Abstract
In recent years, the use of fertilizers has increased in the Amazon. Phosphate fertilizers, which are commonly used, can present high concentrations of radioelements. In the present study, the activity concentrations of uranium (U) and thorium (Th) in Oxisols and Ultisols cultivated with citrus (Citrus sinensis (L.) Osbeck), oil palm (Elaeis guineensis Jacq.) and black pepper (Piper nigrum L.), with 26, 10 and 5 years of implantation, respectively, were evaluated. The potential risk of contamination was estimated by the enrichment (EF) and bioaccumulation (BAF) factors. Pearson’s correlation coefficients indicated a significant relationship between the concentrations of U and Th in soil and plant and the soil properties pH, Ca2+, Mg2+, K+ and P. The enrichment (EF < 2) and bioaccumulation (0.01 < BAF < 0.05) factors were low. In plant tissues, the concentrations of 238U followed the order: citrus > black pepper > oil palm, and the concentrations of 232Th followed the sequence: black pepper >> citrus > oil palm. The activity concentrations of 238U and 232Th in the soil cultivated with black pepper, as well as in the soil of the reference area close to the citrus plantation, were higher than the world average values of 35 and 30 Bq kg−1, respectively, established by the United Nations Scientific Committee on Effects of Atomic Radiation. Perennial crops that are fertilized annually must be monitored by environmental agencies due the accumulation of elements that can promote potential risks to human health.
1. Introduction
In the last 20 years, aiming to increase the productivity of crops, Brazilian agriculture has intensified the use of new technologies, including large-scale application of P-fertilizers [1], which contain radioelements [2,3,4]. Uranium (U) occurs naturally in the earth’s crust, varying from 0.4 to 6.0 mg kg−1 in soils [5], with an average concentration of 2.5 mg kg−1, while thorium (Th) is almost three times more abundant than U [6], with concentrations ranging from 2 to 12 mg kg−1 and an average value of 6 mg kg−1 [7]. Despite their natural occurrence in soils and plants, increased concentrations of U and Th in these environmental compartments may suggest areas affected by anthropogenic activities, such as agriculture, industrialization and mining [8].
The impact of P-fertilizers on U and Th concentrations in agricultural soils has been the subject of environmental and human health risk assessments [9,10,11,12,13,14]. The concentrations of U and Th are usually higher in phosphate-rich soils [6]. Becegato et al. [15] observed increases in the concentrations of Th (0.02 to 0.69 mg kg−1) in agricultural soils and related them to the use of phosphate fertilizers. Increased concentrations of U in the surface horizon of the soil, due to continuous applications of chemical fertilizers, have been observed in several studies [11,16,17,18,19].
Soil properties such as pH, clay minerals, Ca2+, K+ and organic matter, the parent material composition, the weathering degree [20], as well as the soil management (especially fertilization) [21], are directly related to the retention and absorption of radioelements by plants [22]. To assess the effects of natural and anthropogenic processes on the concentrations of radioelements in environmental compartments, the enrichment factor (EF) and the bioaccumulation factor (BAF) have been used. The EF refers to the ratio between the concentration of the studied element in cultivated soil and the natural concentration or background level [23,24], while the BAF correlates the concentrations of elements in plant tissues and their total contents in the soil. BAF is considered one of the most important input variables in the assessment of risks to human health [8,25].
The state of Pará is the second largest Brazilian state at 1,247,955 km2, of which approximately 57% consists of indigenous territories and other protected areas, representing 29.73% of the Brazilian Amazon (4,196,943 km2) and 14.65% of the Brazilian territory. The main economic activities in the region include agriculture, mainly cattle rearing, crop production and mineral extraction [26,27]. In the state of Pará, there is an annual production of 286,768 tons of citrus, 1,634,476 tons of oil palm and 39,577 tons of black pepper, corresponding to 2%, 97% and 50% of the Brazilian production [28]. The growing demand regarding food production and energy generation and society’s increasing call against deforestation in the Amazon have intensified the use of fertilizers in order to enhance productivity [29,30].
The determination of the levels of radioelements in agricultural soils can provide important qualitative and quantitative information in studies of environmental and human health risk assessment. Despite that, such assessments are scarce at the Amazonian agricultural frontiers, which demand frequent applications of agricultural inputs, mainly P-fertilizers. Therefore, this study aimed at: (i) evaluating the concentrations of U and Th in agricultural soils that received fertilizer applications for 26, 10 and 5 years, in citrus, oil palm and black pepper crops, respectively; (ii) establishing/discussing relations of the levels of radioelements with the soil attributes and (iii) determining the enrichment and bioaccumulation factors in the areas of citrus, black pepper and oil palm cultivation.
2. Material and Methods
2.1. Study Site
The study site is located in the Brazilian Amazon (Figure 1), represented by commercial plantations of citrus (Citrus sinensis (L.) Osbeck) with 26 years of implantation (1°48′08′′ S, 47°11′56′′ W); oil palm (Elaeis guineensis Jacq.) with 10 years of implantation (2°13′18′′ S, 48°47′52′′ W) and black pepper (Piper nigrum L.) with 5 years of implantation (1°47′07′′ S, 47°04′07′′ W). The Oxisols and Ultisols are predominant in this region [31], characterized by high acidity, low nutrient availability and dominance of the sand fraction in the soil surface [32].
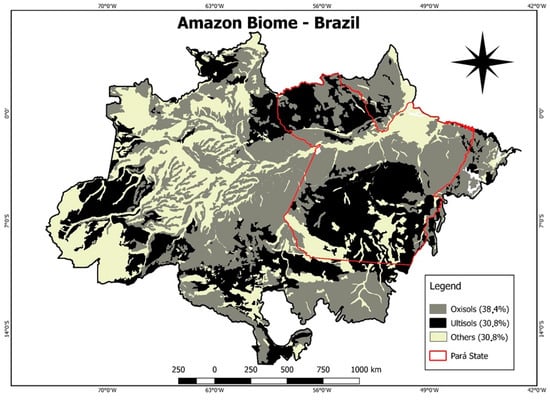
Figure 1.
Study site in the State of Pará, Brazilian Amazon.
In the implantation of the citrus cultivation, 3 kg of chicken manure and 60 g of P2O5 (single superphosphate) were added per pit (before planting), in addition to 60 g of N (urea) and 30 g of K2O (potassium chloride) per plant (after planting). From the second to the fifth year, 200 g of N (urea), 90 g of P2O5 (triple superphosphate) and 180 g of K2O (potassium chloride) were applied per citrus plant. From the sixth year on, the production fertilization started with 80 kg ha−1 of N (urea), 20 kg ha−1 of P2O5 (triple superphosphate), and 40 kg ha−1 of K2O (potassium chloride). In the oil palm cultivation area, 5.3 kg ha−1 of P2O5 (Arad natural reactive phosphate) were applied, in addition to the formulation NPK 11-07-23 + 2.5% Mg + 0.5% B and annual applications of the formulation NPK 10-07-22. For the implantation of the black pepper cultivation, 1.5 kg of chicken manure and 87.5 g of P2O5 (Yoorin thermophosphate) were adopted per pit. In the first and second years, 22.5 g of N (urea), 18.45 g of P2O5 (triple superphosphate) and 30 g of K2O (potassium chloride) were applied per plant. From the third year onwards, 67.5 g of N (urea), 24.6 g of P2O5 (triple superphosphate) and 58 g of K2O (potassium chloride) were added per plant.
Besides the fertilization, the cupric fungicide known as Bordeaux mixture (CuSO4 + Ca (OH)2) was also applied in the areas of citrus and black pepper. All plantations were irrigated with water from wells situated on the respective areas.
2.2. Sampling of Soils and Plant Material
The sampling of soils was carried out in the 0–0.2 m deep. In each cultivation area, 10 subsamples were collected to form one composite sample, with three replications, making a total of 30 subsamples and 3 composed samples by crop. Soil samples were also collected in areas of native or naturally recovered vegetation (regionally called capoeiras) close to the plantations, in order to study the degree of pollution in cultivated areas.
Plant samples were collected at the same points of soil collection, aiming at verifying the U and Th bioaccumulation capacity by each cultivation. Leaf sampling in black pepper and citrus plantations consisted of collecting freshly ripe leaves, in the middle third portion of the crown per useful plant, in the way to the North, South, East and West [33,34]. For oil palm, the leaf sampling from the third or fourth year of cultivation was performed on leaf No. 17 (from apex to base), considered as the best expression or the ideal physiological state for the oil palm [35].
2.3. Analyzes of Soils and Plants
Chemical and granulometric analyses of soil samples were performed according to Silva [36]: pH in H2O and 1 M KCl solution (1:2.5); Ca2+ and Mg2+ in 1 M KCl solution, quantified by atomic absorption spectrophotometry; K+ extracted with 0.05 M HCl solution, quantified by flame photometry; available P extracted with 0.05 M HCl + 0.0125 M H2SO4 (Mehlich-1) and determined by colorimetry; the organic carbon was determined by the Walkley and Black method (wet combustion) with potassium dichromate; the total Al2O3 was found by sulfuric attack, and the soil texture was determined by the pipette method [37]. X-ray fluorescence spectrometry (XRF) was used to quantify the P2O5 content.
The concentrations of U and Th in soils from each cultivation area were extracted using acid digestion in a microwave oven (Mars Xpress, CEM Corporation, Tokyo, Japan) [38]. For this purpose, 0.5 g soil samples (100 mesh) were weighed and placed in Teflon tubes, followed by the addition of the acid solution (HCl: HNO3 3:1). The extracts were diluted with ultrapure water to a final volume of 50 mL and filtered (PTFE 0.45 mm). To quantify the concentrations of U and Th in plants, the dry matter was powdered in a Willey type knife mill and processed in a 20-mesh sieve. After that, 2 mL of HNO3, 2 mL of H2O2 and 5 mL of ultrapure water were applied in 250 mg of the plant material in Teflon tubes, followed by digestion in a microwave oven (Mars Xpress, CEM Corporation) [39].
The concentrations of U and Th in all samples were quantified by inductively coupled plasma mass spectrometry (ICP-MS), in triplicate, including certified reference materials for soils (SRM® 2711a) and plants (SRM® 1570a) and blank samples. After this quantification, the values of U and Th in ppm were converted to activity concentration, in Bq kg−1, using the conversion factors given by the International Atomic Energy Agency-IAEA [40] and by the Polish Central Laboratory for Radiological Protection, as shown by Malczewski et al. [41]. The specific activity of a sample containing 1 mg kg−1 of 238U (by weight) is 12.35 Bq kg−1, and 1 mg kg−1 of 232Th is 4.06 Bq kg−1.
2.4. Calculation of Enrichment and Bioaccumulation Factors
The enrichment factor (EF) was calculated to determine the degree of contamination by the radioelements studied. This index allows us to understand the contamination in an anthropized area (cultivated) in relation to a reference area (native or naturally recovered vegetation), considering a reference element. Several elements, including Al, Ca, Fe, Mn, Ti and V, are used as a reference [24]. In this study, the element used was Al2O3 [42], which guarantees more robustness and reliability because its behavior tends to be more uniform [43,44,45]. The calculation of the EF was carried out using the following Equation (1) [24].
where Cn is the concentration of U/Th in sample n, Cr is the concentration of Al2O3 in the same sample, Bn is the concentration of U/Th in the reference area (native or naturally recovered vegetation), and Br is the concentration of Al2O3 in the reference area. The EF values were classified according to Sutherland [46]: EF < 2 indicates deficient to minimal enrichment; 2 ≤ EF < 5 indicate moderate enrichment; 5 ≤ EF < 20 indicate significant enrichment; 20 ≤ EF < 40 indicate very high enrichment, and EF ≥ 40 indicate extremely high enrichment.
EF = (Cn/Cr)/(Bn/Br)
The bioaccumulation factor (BAF) has been widely used to understand the degree of accumulation of a given contaminant in plant tissue [47,48,49], found according to Equation (2) [25].
where Cp is concentration of U/Th in the plant tissue (dry weight) and Cs is the concentration of U/Th in the soil (100 mesh sieve).
BAF = (Cp/Cs)
2.5. Statistical Analyzes
The results found in this study were subjected to descriptive statistical analysis and the Shapiro–Wilk normality test (p < 0.05). Data without normal distribution were transformed. In order to understand the degree of relationship between soil attributes and the concentrations of U/Th in soils and plants, Pearson’s correlation analysis was performed (p < 0.05). All these statistical analyses were carried out using the software Statgraphics Centurion 18 (v. 18.1.14, StatPoint Technologies, Warrenton, VA, USA).
3. Results
3.1. Soil Attributes
The soils under oil palm and citrus cultivation showed values of pH (H2O) equal to 4.6 and 4.7, respectively, while the soil cultivated with black pepper showed a higher pH (H2O), corresponding to 5.2 (Table 1). The levels of Ca2+ were equal to 9.6, 13.7 and 34 mmolc kg−1 in the areas with cultivation of oil palm, citrus and black pepper, respectively. The concentrations of Mg2+ were 2.5 mmolc kg−1 in the oil palm area, 15 mmolc kg−1 in the black pepper area and 9 mmolc kg−1 in the citrus area. The values of K+ were equal to 0.9 and 0.5 mmolc kg−1 in the areas of oil palm and citrus, respectively, which were lower than the concentration found in the black pepper area, with 4.2 mmolc kg−1.

Table 1.
Classification, chemical attributes and granulometry of the soils studied (number of samples = 3).
The available P concentrations were 5, 234 and 8 mg kg−1, respectively, in oil palm, black pepper and citrus soils. The organic carbon content in soils cultivated with oil palm, citrus and black pepper were corresponding to 11.6, 6.9 and 16 g kg−1. All the soils studied showed a predominance of sand in the surface depth (Table 1).
3.2. Uranium and Thorium in Soils and Plants
The average concentrations of U and Th in soils cultivated with black pepper (3.48 and 10.70 mg kg−1, respectively) and oil palm (2.15 and 7.25 mg kg−1) were higher than those found in the reference areas, while the citrus cultivation showed concentrations lower than the reference area (Figure 2, Table S1). In the agricultural soils in this study, the concentrations of U and Th showed positive correlations with the levels of P2O5 (Figure 3). The enrichment factors were less than 2 (EF < 2) and showed the following orders: U—black pepper > oil palm > citrus; Th—oil palm > black pepper > citrus (Figure 4A).
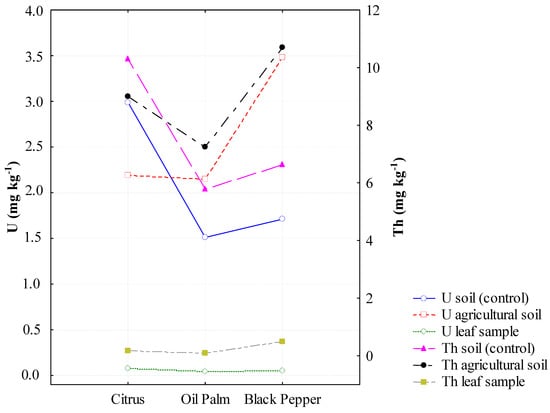
Figure 2.
Uranium and Thorium in cultivated and reference (control) soils and in plant tissues.
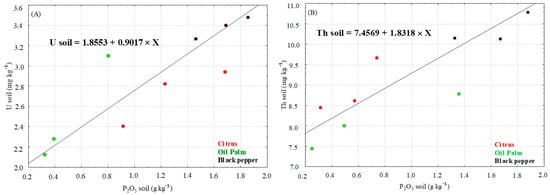
Figure 3.
Elemental concentration ratio between uranium (A) and thorium (B) and the P2O5 content in the cultivated soils.
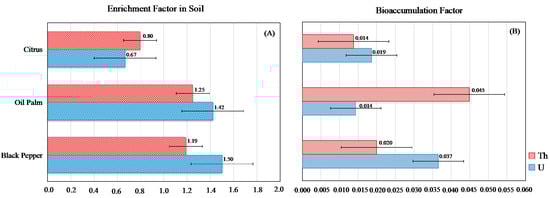
Figure 4.
Enrichment (A) and bioaccumulation (B) factors of uranium and thorium in the cultivated soils and plants.
The average concentrations of U and Th in plant tissues were, respectively, 0.08 and 0.18 mg kg−1 for citrus, 0.05 and 0.48 mg kg−1 for black pepper and 0.04 and 0.10 mg kg−1 for oil palm (Figure 2, Table S1). The bioaccumulation factors of U and Th for the three crops were extremely low, with BAF values < 0.05 (Figure 4B). In soils, with the exception of the citrus soil, all the areas showed higher activity concentrations of 238U and 232Th compared to the reference areas (Table 2). The activity concentration of 232Th in the tissue of black pepper was extremely high (1948.8 mBq kg−1) (Table 3). The activity concentrations of the radioelements in the plant tissues followed the orders: 238U (mBg kg−1) − citrus > black pepper > oil palm; 232Th (mBg kg−1) − black pepper >> citrus > oil palm.
Table 2.
Activity concentrations of uranium and thorium in soils (n = number of samples).
Table 3.
Activity concentrations of uranium and thorium in the studied crops and in previous studies, and reference values.
Strongly positive Pearson’s correlations were found between U and pH, Ca2+, K+ and P in the soil, while the most significant correlation of Th was with Mg (Figure 5). The level of U in plant tissues showed a negative correlation with the silt content and a strong positive correlation with the sand content of the soils. Regarding the Th concentration in plants, it showed a strong positive correlation with pH and Ca+ of the soils (Figure 5).
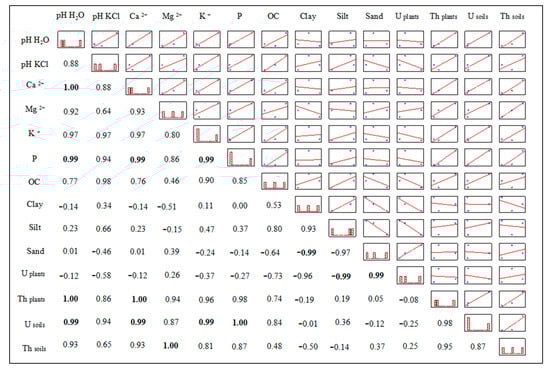
Figure 5.
Pearson’s correlation coefficients between uranium and thorium concentrations and soil attributes. Bold coefficients indicate significant correlation (p ≤ 0.05).
4. Discussion
4.1. Soil Attributes
With the exception of the black pepper cultivation, the soils of this study presented a high acidity, which is common in tropical regions, where the climatic conditions favor the loss of bases by leaching, increasing acidity even in areas that have received liming. Soil acidity is strongly influenced by the dynamics of cations, whose availability increases under high acidity conditions [63]. Previous studies in the Eastern Amazon also indicated that Oxisols and Ultisols have a high acidity [32,64]. In the Western Amazon, Moreira and Fageria [65] studied 3340 soil samples collected in several land uses, and observed that most samples ranged from acidic to very acidic according to Venegas et al. [66].
The level of Ca2+ was low in the soil of oil palm cultivation, and the soils of citrus and black pepper areas presented medium and high Ca2+ concentration, respectively, according to the classification by Venegas et al. [66]. The concentrations of Mg2+ were low in the oil palm area, high in the black pepper area and medium in the citrus area [66]. The levels of K+ were considered low in soils cultivated with oil palm and citrus, while the area cultivated with black pepper showed a soil with a high concentration of K+.
The plantations of oil palm and citrus showed lower contents of organic carbon when compared to the black pepper area, which may be related to the longer period of implantation of these crops and the climatic conditions of the Amazon, including intense rainfall and high temperatures. Such conditions promote the fast decomposition of organic matter [32]. Bayer and Mielniczuk [67] observed that the organic matter content in Ultisol was reduced from 31 to 18 g kg−1 with the conversion of natural areas to successive crops. Bowman et al. [68] observed reductions between 55% and 63% in the organic carbon of the soil (0–15 cm) in sixty years of cultivation. De Souza Braz et al. [69] found reduced organic carbon content in Typic Hapludox from the Eastern Amazon after 15 years of pasture.
The clay contents in the studied soils were within the range found by Birani et al. [64], in Typic Hapludox (from 38 to 931 g kg−1) and Typic Hapludult (from 53 to 719 g kg−1) from the Eastern Amazon. Such results indicate the predominance of the sand fraction, which is commonly observed in the soils from the state of Pará [32].
The citrus and oil palm areas showed soils with low and very low P contents, respectively, while the black pepper area presented very high values of P in the soil [66]. Frazão et al. [70] evaluated oil palm plantations in Amazon soils with 4, 8 and 25 years of implantation, and found P contents equal to 4.3, 3.9 and 4.2 mg kg−1, respectively. In agricultural areas, this variation is generally due to the amounts applied in fertilization and the soil management, which can increase productivity and the export of nutrients by the crops. The higher P level in the soil from the area cultivated with black pepper may be associated with the residual effect of the thermophosphate fertilization [1].
4.2. Radioelements in Soils and Plants
The concentrations of U and Th in agricultural soils showed a positive correlation with the increase in the P2O5 content, resulting from the use of P-fertilizers in these areas. Therefore, there is a direct relationship between phosphate fertilization and increased concentrations of U and Th in the soils. The concentration of U is higher than the concentration of Th in P-fertilizers; however, in the soils of the present study, this did not imply a higher level of U compared to Th. Takeda et al. [18] obtained average concentrations of 31 mg kg−1 and 0.8 mg kg−1 for U and Th, respectively, in superphosphate samples. The concentrations of U and Th are 5.6 and 2.6 times higher in triple superphosphate (TSP) than in single superphosphate (SSP), with 172.8 mg kg−1 of U and 2.1 mg kg−1 of Th [21]. In addition to the total U and Th concentrations in P-fertilizers, it is important to determine their bioavailability in soils [71].
In oxidizing environments, which are common in surface soil horizons, the soluble U and insoluble Th forms predominate [72]. This may explain the higher levels of Th than U in the soils from the studied areas. Moreover, the presence of CO32− and HCO3− ions contributes to the permanence of soluble U form [72]. The studied soils are also under such conditions. In addition, the high acidity and the sandy texture of the soils may have favored the solubility, mobility and leaching of these radioelements, resulting in EFs < 2 in the evaluated soils. Rodríguez et al. [73] observed that the activity concentrations of radioelements in the soil decreased with the increase in particle size.
Soil pH is among the most important drivers of the U mobility [74]. Low pH increases U mobility and availability, favoring absorption by plants [75]. It is known that U can be more mobile and bioavailable in the soil than Th [76]. However, it has been reported that Th can form soluble complexes with humic acids in the rhizosphere, and plants can easily absorb Th in this form [77]. Comparing the bioaccumulation of U and Th among the three crops studied, a higher BAF was observed for U compared to Th in citrus and black pepper cultivation. The bioaccumulation of Th in oil palm leaves was three times greater than that of U. In addition to the edaphoclimatic factors that control the bioavailability of radioelements in the rhizosphere, there is a natural difference in the absorption capacity of plants [12].
The low bioaccumulation factors (0.01 < BAF < 0.05) obtained for U and Th in the studied species are above the soil–plant transfer factors established by the International Atomic Energy Agency—IAEA [78] for the Tropical Regions in relation to U (TF = 4.9 × 10⁻³) and Th (TF = 8.2 × 10⁻³). This suggests that, despite small concentrations found, all the studied crops present the potential of U and Th accumulation.
The activity concentrations of U and Th in the soils and plants in this study show that the concentrations in the plant tissues are not based only on the quantitative properties of the soils. As reported by Tuovinen et al. [79], the relationship between the concentration of radioelements from soils to plants is not linear. Pulhani et al. [80] demonstrated that the availability of essential nutrients for absorption by plants, such as calcium and potassium, regulates the absorption of non-essential elements, including U and Th.
The activity concentrations of U and Th in the soil cultivated with black pepper and in the soil of the reference area adjacent to the citrus cultivation, which corresponded to 42.99 and 36.93 Bq kg−1 of 238U, and 43.44 and 41.82 Bq kg−1 of 232Th, respectively, were higher than the world averages: 238U (35 Bq kg−1) and 232Th (30 Bq kg−1), as established by the United Nations Scientific Committee on Effects of Atomic Radiation—UNSCEAR [60]. However, the concentrations of 238U and 232Th in the soils of the present study were well below the averages obtained by Peixoto et al. [51] in Ultisols of the state of Minas Gerais—Southeastern Brazil, which may be related to the parent material richer in these elements and the subtropical climate conditions, in which the loss by leaching is lower. The higher activity concentration of 238U in citrus leaves may be related to the more accentuated sandy character of the soil, which promoted the plant uptake. The higher activity concentration of 232Th in Black pepper leaves, in turn, may be related to the higher pH and Ca2+ values of the soil [80].
Although it was not the focus of the study, the concentrations of 40K were also determined, considering that this form of K is considered radioactive. The total concentrations of K were extracted and quantified by the same method used to determine U and Th, and the activity concentrations were estimated considering that 1% of K is equivalent to 313 Bq kg−1 of 40K [60]. In the studied soils, the concentrations of 40K ranged from 15.6 to 31.2 Bq kg−1, values that are below the worldwide average of 400 Bq kg−1 [60]. Previous studies carried out in the states of Alagoas and Rio Grande do Norte, Northeastern Brazil, showed a high concentration of 40K, ranging from 6.0 to 2160 Bq kg−1 and 56.4 to 1972 Bq kg−1, respectively [81,82]. In this region, the high concentrations may be related to semi-arid climate, with high evapotranspiration and low rainfall [81], which makes it difficult to leach 40K. On the other hand, the soils studied in the present work present high natural acidity and lower capacity of cation retention, which lead to the removal of elements by weathering under high rainfall rates [32]. In the agricultural system, plant uptake is the main process responsible for the decrease in 40K in soils, mainly in the cultivation of citrus (Table S2). The decreasing rate of 40K from plant uptake is relevant to the fact that K is important in fertilizing the crop and demonstrate the mobile ability of this element in the soil-plant ecosystems [83].
5. Conclusions
The soil properties pH, Ca2+, Mg2+, K+, P and the sand fraction were important to understand the dynamics of U and Th in the soil/plant. The longer period of soil use with the citrus cultivation, when compared to the other crops, was not decisive to establish cause/effect relations with the radioelements. The soils in the present study are sandy, which may have favored the losses of U and Th by leaching to deeper layers and contributed to the low concentrations of U and Th in the soils and plants, in addition to the low enrichment and bioaccumulation factors, indicating that the concentrations of U and Th in citrus, black pepper and oil palm crops do not represent risks to the environment and human health. However, the monitoring of radioelements in agricultural soils should be maintained in the future, especially through modeling studies of radioactivity over time, due to the frequent use of fertilizers that can enrich the environment with these elements. The results found in this study suggest that it would be interesting for fertilizer industries to seek to reduce the levels of U and Th in these commercial products through purification processes.
Supplementary Materials
The following are available online at https://www.mdpi.com/article/10.3390/min11090994/s1, Table S1: Concentrations of uranium (U) and thorium (Th) in the soils and crops studied. Table S2: Activity concentrations, enrichment and bioaccumulation of potassium (40K) in the soils and crops studied.
Author Contributions
Conceptualization, A.M.d.S.B. and M.L.d.C.; methodology, A.M.d.S.B. and A.R.F.; validation, A.M.d.S.B., M.L.d.C. and A.R.F.; formal analysis, A.M.d.S.B. and S.J.R.; investigation, A.M.d.S.B.; resources, A.M.d.S.B.; writing—original draft preparation, A.M.d.S.B.; writing—review and editing, M.L.d.C., A.R.F., S.J.R. and R.D.; visualization, A.M.d.S.B.; supervision, M.L.d.C.; project administration, A.M.d.S.B. and M.L.d.C.; funding acquisition, S.J.R. and R.D. All authors have read and agreed to the published version of the manuscript.
Funding
This research was funded by Pro-Rectory of Research and Technological Development (PROPED/UFRA), the first (Prodoutoral-04/2017), the second (Grant 305015/2016-8), the third (Grant 307166/2019-8) and the last (Grant 305819/2018-6). The APC was funded by Instituto Tecnológico Vale.
Data Availability Statement
Data are contained within the article and in the Supplementary Materials.
Acknowledgments
Authors thank the Brazil’s National Council of Technological and Scientific Development (CNPq) for the scientific support.
Conflicts of Interest
The authors declare that they have no conflict of interest.
References
- Withers, P.J.A.; Rodrigues, M.; Soltangheisi, A.; de Carvalho, T.S.; Guilherme, L.R.G.; Benites, V.D.M.; Gatiboni, L.C.; de Sousa, D.M.G.; Nunes, R.D.S.; Rosolem, C.A.; et al. Transitions to sustainable management of phosphorus in Brazilian agriculture. Sci. Rep. 2018, 8, 2537. [Google Scholar] [CrossRef]
- Mazzilli, B.; Palmiro, V.; Saueia, C.; Nisti, M. Radiochemical characterization of Brazilian phosphogypsum. J. Environ. Radioact. 2000, 49, 113–122. [Google Scholar] [CrossRef]
- Yamazaki, I.M.; Geraldo, L.P. Uranium content in phosphate fertilizers commercially produced in Brazil. Appl. Radiat. Isot. 2003, 59, 133–136. [Google Scholar] [CrossRef]
- Fávaro, D.I.T. Natural radioactivity in phosphate rock, phosphogypsum and phosphate fertilizers in Brazil. J. Radioanal. Nucl. Chem. 2005, 264, 445–448. [Google Scholar] [CrossRef]
- Shacklette, H.T.; Boerngen, J.G. Element Concentrations in Soils and Other Surficial Materials of the Conterminous United States; US Government Printing Office: Washington, DC, USA, 1984.
- Shtangeeva, I. Uranium and thorium accumulation in cultivated plants. In Trace Elements as Contaminants and Nutrients: Consequences in Ecosystems and Human Health; Prasad, M.N.V., Ed.; Wiley-Interscience: Hoboken, NJ, USA, 2008; pp. 295–340. [Google Scholar]
- Kabata-Pendias, A.; Pendias, H. Trace Elements in Soils and Plants, 3rd ed.; CRC Press: Boca Raton, FL, USA, 2001. [Google Scholar]
- Ebyan, O.A.M. Distribution and Bioaccumulation of Uranium and Thorium in Natural Soil and Wild Plants of Wadi El-Missikat, Central Eastern Desert, Egypt. Arab J. Nucl. Sci. Appl. 2019, 52, 159–166. [Google Scholar] [CrossRef] [Green Version]
- Kant, K.; Upadhyay, S.B.; Sonkawade, R.G.; Chakarvarti, S.K. Radiological risk assessment of use of phosphate fertilizers in soil. Int. J. Radiat. Res. 2006, 4, 63–70. [Google Scholar]
- Ünak, T.; Yildirim, Y.; Tokucu, G.; Ünak, G.; Öcal, J.; Konyali, D.; Kiliç, S. Study of the effect of uranium and thorium on the growing of pepper (Capsicum annuum var. longum) and cucumber (Cucumis sativus) plants. J. Radioanal. Nucl. Chem. 2007, 273, 763–766. [Google Scholar] [CrossRef]
- Yamaguchi, N.; Kawasaki, A.; Iiyama, I. Distribution of uranium in soil components of agricultural fields after long-term application of phosphate fertilizers. Sci. Total Environ. 2009, 407, 1383–1390. [Google Scholar] [CrossRef]
- Shtangeeva, I. Uptake of uranium and thorium by native and cultivated plants. J. Environ. Radioact. 2010, 101, 458–463. [Google Scholar] [CrossRef]
- Wetterlind, J.; Richer De Forges, A.C.; Nicoullaud, B.; Arrouays, D. Changes in uranium and thorium contents in topsoil after long-term phosphorus fertilizer application. Soil Use Manag. 2012, 28, 101–107. [Google Scholar] [CrossRef]
- Khan, I.U.; Sun, W.; Lewis, E. Radiological Impact on Public Health from Radioactive Content in Wheat Flour Available in Pakistani Markets. J. Food Prot. 2020, 83, 377–382. [Google Scholar] [CrossRef]
- Becegato, V.A.; Ferreira, F.J.F.; Machado, W.C.P. Concentration of radioactive elements (U, Th and K) derived from phosphatic fertilizers in cultivated soils. Braz. Arch. Biol. Technol. 2008, 51, 1255–1266. [Google Scholar] [CrossRef]
- Rothbaun, H.P.; McGaveston, D.A.; Wall, T.; Johnston, A.E.; Mattingly, G.E.G. Uranium accumulation in soils from long-continued applications of superphosphate. J. Soil Sci. 1979, 30, 147–153. [Google Scholar] [CrossRef]
- Stojanovic, M.; Popic, J.M.; Stevanovic, D.; Martinovic, L.J. Phosphorus fertilizers as a source of uranium in Serbian soils. Agron. Sustain. Dev. 2006, 26, 179–183. [Google Scholar] [CrossRef]
- Takeda, A.; Tsukada, H.; Takaku, Y.; Hisamatsu, S.; Nanzyo, M. Accumulation of uranium derived from long-term fertilizer applications in a cultivated Andisol. Sci. Total Environ. 2006, 367, 924–931. [Google Scholar] [CrossRef] [PubMed]
- Tunney, H.; Stojanović, M.; Mrdaković Popić, J.; McGrath, D.; Zhang, C. Relationship of soil phosphorus with uranium in grassland mineral soils in Ireland using soils from a long-term phosphorus experiment and a National Soil Database. J. Plant Nutr. Soil Sci. 2009, 172, 346–352. [Google Scholar] [CrossRef]
- Ribeiro, F.C.A.; Silva, J.I.R.; Lima, E.S.A.; do Amaral Sobrinho, N.M.B.; Perez, D.V.; Lauria, D.C. Natural radioactivity in soils of the state of Rio de Janeiro (Brazil): Radiological characterization and relationships to geological formation, soil types and soil properties. J. Environ. Radioact. 2018, 182, 34–43. [Google Scholar] [CrossRef]
- Vogel, C.; Hoffmann, M.C.; Taube, M.C.; Krüger, O.; Baran, R.; Adam, C. Uranium and thorium species in phosphate rock and sewage sludge ash based phosphorus fertilizers. J. Hazard. Mater. 2020, 382, 121100. [Google Scholar] [CrossRef]
- Tagami, K.; Uchida, S. Soil-to-Crop Transfer Factor: Consideration on Excess Uranium from Phosphate Fertilizer. In Uranium in Plants and the Environment; Springer: Cham, Switzerland, 2020; pp. 163–180. [Google Scholar]
- Loska, K.; Cebula, J.; Pelczar, J.; Wiechuła, D.; Kwapuliński, J. Use of enrichment, and contamination factors together with geoaccumulation indexes to evaluate the content of Cd, Cu, and Ni in the Rybnik water reservoir in Poland. Water Air Soil Pollut. 1997, 93, 347–365. [Google Scholar] [CrossRef]
- Loska, K.; Wiechuła, D.; Korus, I. Metal contamination of farming soils affected by industry. Environ. Int. 2004, 30, 159–165. [Google Scholar] [CrossRef]
- Khan, A.; Khan, S.; Khan, M.A.; Qamar, Z.; Waqas, M. The uptake and bioaccumulation of heavy metals by food plants, their effects on plants nutrients, and associated health risk: A review. Environ. Sci. Pollut. Res. 2015, 22, 13772–13799. [Google Scholar] [CrossRef] [PubMed]
- Bowman, M.S.; Soares-Filho, B.S.; Merry, F.D.; Nepstad, D.C.; Rodrigues, H.; Almeida, O.T. Persistence of cattle ranching in the Brazilian Amazon: A spatial analysis of the rationale for beef production. Land Use Policy 2012, 29, 558–568. [Google Scholar] [CrossRef]
- de Souza, R.A.; Miziara, F.; De Marco Junior, P. Spatial variation of deforestation rates in the Brazilian Amazon: A complex theater for agrarian technology, agrarian structure and governance by surveillance. Land Use Policy 2013, 30, 915–924. [Google Scholar] [CrossRef]
- IBGE Municipal Agricultural Research. Available online: https://cidades.ibge.gov.br/brasil/pa/pesquisa/15/11863 (accessed on 4 January 2019).
- Vale, P.; Gibbs, H.; Vale, R.; Christie, M.; Florence, E.; Munger, J.; Sabaini, D. The Expansion of Intensive Beef Farming to the Brazilian Amazon. Glob. Environ. Chang. 2019, 57, 101922. [Google Scholar] [CrossRef]
- Cortner, O.; Garrett, R.D.; Valentim, J.F.; Ferreira, J.; Niles, M.T.; Reis, J.; Gil, J. Perceptions of integrated crop-livestock systems for sustainable intensification in the Brazilian Amazon. Land Use Policy 2019, 82, 841–853. [Google Scholar] [CrossRef]
- USDA. Keys to Soil Taxonomy, 12th ed.; USDA-Natural Resources Conservation Service: Washington, DC, USA, 2014.
- Souza, E.S.; de Fernandes, A.R.; De Souza Braz, A.M.; Oliveira, F.J.; de Alleoni, L.R.F.; Campos, M.C.C. Physical, chemical, and mineralogical attributes of a representative group of soils from the eastern Amazon region in Brazil. SOIL 2018, 4, 195–212. [Google Scholar] [CrossRef] [Green Version]
- Oliveira, R.F.; Cruz, E.S. Manual of Sample Collection of Black Pepper Leaves for Nutritional Diagnosis; Embrapa Amazônia Oriental: Belém, Brazil, 1999. [Google Scholar]
- Dias, J.R.M.; Tucci, C.A.F.; Wadt, P.G.S.; Silva, A.M.; da Santos, J.Z.L. Níveis críticos e faixas de suficiência nutricional em laranjeira-pêra na Amazônia Central obtidas pelo método DRIS. Acta Amaz. 2013, 43, 239–246. [Google Scholar] [CrossRef] [Green Version]
- Rodrigues, M.R.L.; Amblard, P.; Barcelos, E.; Macedo, J.L.V.; Cunha, R.N.V.; Tavares, A.M. Evaluation of the nutritional status of oil palm: Leaf analysis (Reformulated). In Circular Técnica; Embrapa Amazônia Ocidental: Manaus, Brazil, 2006; Volume 26. [Google Scholar]
- Silva, C. Manual de Análises Químicas de Solos, Plantas e Fertilizantes, 2nd ed.; Embrapa Informação Tecnológica: Brasília, Brazil, 2009. [Google Scholar]
- Gee, G.W.; Bauder, J.W. Particle-size analysis. In Methods of Soil Analysis; Klute, A., Ed.; American Society of Agronomy: Madison, WI, USA, 1986; pp. 383–411. [Google Scholar]
- McGrath, S.P.; Cunliffe, C.H. A simplified method for the extraction of the metals Fe, Zn, Cu, Ni, Cd, Pb, Cr, Co and Mn from soils and sewage sludges. J. Sci. Food Agric. 1985, 36, 794–798. [Google Scholar] [CrossRef]
- Araújo, G.C.L.; Gonzalez, M.H.; Ferreira, A.G.; Nogueira, A.R.A.; Nóbrega, J.A. Effect of acid concentration on closed-vessel microwave-assisted digestion of plant materials. Spectrochim. Acta Part B At. Spectrosc. 2002, 57, 2121–2132. [Google Scholar] [CrossRef]
- IAEA. Measurement of radionuclides in food and the environment. A Guidebook; Technical Reports Series; International Atomic Energy Agency: Vienna, Austria, 1989; p. 229. [Google Scholar]
- Malczewski, D.; Teper, L.; Dorda, J. Assessment of natural and anthropogenic radioactivity levels in rocks and soils in the environs of Swieradow Zdroj in Sudetes, Poland, by in situ gamma-ray spectrometry. J. Environ. Radioact. 2004, 73, 233–245. [Google Scholar] [CrossRef] [PubMed]
- Wu, J.; Teng, Y.; Lu, S.; Wang, Y.; Jiao, X. Evaluation of Soil Contamination Indices in a Mining Area of Jiangxi, China. PLoS ONE 2014, 9, e112917. [Google Scholar] [CrossRef] [PubMed]
- Rubio, B.; Nombela, M.; Vilas, F. Geochemistry of Major and Trace Elements in Sediments of the Ria de Vigo (NW Spain): An Assessment of Metal Pollution. Mar. Pollut. Bull. 2000, 40, 968–980. [Google Scholar] [CrossRef]
- Alagarsamy, R.; Zhang, J. Geochemical characterisation of major and trace elements in the coastal sediments of India. Environ. Monit. Assess. 2010, 161, 161–176. [Google Scholar] [CrossRef]
- Islam, S.; Ahmed, K.; Mamun, H.A.; Masunaga, S. Potential ecological risk of hazardous elements in different land-use urban soils of Bangladesh. Sci. Total Environ. 2015, 512–513, 94–102. [Google Scholar] [CrossRef] [PubMed]
- Sutherland, R.A. Bed sediment-associated trace metals in an urban stream, Oahu, Hawaii. Environ. Geol. 2000, 39, 611–627. [Google Scholar] [CrossRef]
- Kumar, V.; Singh, J.; Chopra, A.K. Assessment of plant growth attributes, bioaccumulation, enrichment, and translocation of heavy metals in water lettuce (Pistia stratiotes L.) grown in sugar mill effluent. Int. J. Phytoremediation 2018, 20, 507–521. [Google Scholar] [CrossRef]
- Khaokaew, S.; Landrot, G. A field-scale study of cadmium phytoremediation in a contaminated agricultural soil at Mae Sot District, Tak Province, Thailand: (1) Determination of Cd-hyperaccumulating plants. Chemosphere 2015, 138, 883–887. [Google Scholar] [CrossRef]
- Covre, W.P.; Pereira, W.V.; Gonçalves, D.A.M.; Teixeira, O.M.M.; Amarante, C.B.D.; Fernandes, A.R. Phytoremediation potential of Khaya ivorensis and Cedrela fissilis in copper contaminated soil. J. Environ. Manag. 2020, 268, 110733. [Google Scholar] [CrossRef] [PubMed]
- Pérez, D.V.; Saldanha, M.F.C.; Moreira, J.C.; Vaitsman, D.S. Total concentration of uranium and thorium in some Brazilian soils. Pesqui. Agropecuária Bras. 1998, 33, 1417–1423. [Google Scholar]
- Peixoto, C.M.; Fernandes, P.R.M.; Rodrigues, P.C.H.; Feliciano, V.M.D. Distribution of Activity Concentrations of 238U and 232Th in Soil Samples from the State of Minas Gerais. Braz. J. Radiat. Sci. 2016, 4, 1–18. [Google Scholar]
- Nascimento, R.C.; da Silva, Y.J.A.B.; do Nascimento, C.W.A.; da Silva, Y.J.A.B.; da Silva, R.J.A.B.; Collins, A.L. Thorium content in soil, water and sediment samples and fluvial sediment-associated transport in a catchment system with a semiarid-coastal interface, Brazil. Environ. Sci. Pollut. Res. 2019, 26, 33532–33540. [Google Scholar] [CrossRef] [PubMed]
- Myrick, T.E.; Berven, B.A.; Haywood, F.F. Determination of Concentrations of Selected Radionuclides in Surface Soil in the U.S. Health Phys. 1983, 45, 631–642. [Google Scholar] [CrossRef] [PubMed]
- Cengiz, G.B. Natural radioactivity analysis in soil samples of Ardahan province, Turkey for the assessment of the average effective dose. Sak. Üniv. Fen Bilim. Enstitüsü Derg. 2017, 21, 1583–1590. [Google Scholar]
- Masok, F.B.; Masiteng, P.L.; Mavunda, R.D.; Maleka, P.P.; Winkler, H. Determination of uranium and thorium concentration and gross alpha and beta activity measurement in top soil samples from Richards Bay, South Africa. J. Radiat. Res. Appl. Sci. 2018, 11, 305–310. [Google Scholar] [CrossRef]
- Selvasekarapandian, S.; Sivakumar, R.; Manikandan, N.M.; Meenakshisundaram, V.; Raghunath, V.M.; Gajendran, V. Natural radionuclide distribution in soils of Gudalore, India. Appl. Radiat. Isot. 2000, 52, 299–306. [Google Scholar] [CrossRef]
- Yang, Y.; Wu, X.; Jiang, Z.; Wang, W.; Lu, J.; Lin, J.; Wang, L.-M.; Hsia, Y. Radioactivity concentrations in soils of the Xiazhuang granite area, China. Appl. Radiat. Isot. 2005, 63, 255–259. [Google Scholar] [CrossRef]
- Guagliardi, I.; Zuzolo, D.; Albanese, S.; Lima, A.; Cerino, P.; Pizzolante, A.; Thiombane, M.; De Vivo, B.; Cicchella, D. Uranium, thorium and potassium insights on Campania region (Italy) soils: Sources patterns based on compositional data analysis and fractal model. J. Geochem. Explor. 2020, 212, 106508. [Google Scholar] [CrossRef]
- Taboada, T.; Martinez Cortizas, A.; Garcia, C.; Garcia Rodeja, E. Uranium and thorium in weathering and pedogenetic profiles developed on granitic rocks from NW Spain. Sci. Total Environ. 2006, 356, 192–206. [Google Scholar] [CrossRef]
- UNSCEAR. Sources and Effects of Ionizing Radiation; United Nation Scientific Committee on the Effect of Atomic Radiation: New York, NY, USA, 2000. [Google Scholar]
- Ramli, A.T.; Apriantoro, N.H.; Wagiran, H.; Wood, A.K.; Kuan, L.S. Health risk implications of high background radiation dose rate in Kampung Sungai Durian, Kinta District, Perak, Malaysia. Glob. J. Health Sci. 2009, 1, 140–149. [Google Scholar] [CrossRef] [Green Version]
- Hegazy, A.K.; Afifi, S.Y.; Alatar, A.A.; Alwathnani, H.A.; Emam, M.H. Soil characteristics influence the radionuclide uptake of different plant species. Chem. Ecol. 2013, 29, 255–269. [Google Scholar] [CrossRef]
- Rieuwerts, J.S.; Ashmore, M.; Farago, M.; Thornton, I. The influence of soil characteristics on the extractability of Cd, Pb and Zn in upland and moorland soils. Sci. Total Environ. 2006, 366, 864–875. [Google Scholar] [CrossRef]
- Birani, S.M.; Fernandes, A.R.; de Souza Braz, A.M.; Pedroso, A.J.S.; Alleoni, L.R.F. Available contents of potentially toxic elements in soils from the Eastern Amazon. Geochemistry 2015, 75, 143–151. [Google Scholar] [CrossRef]
- Moreira, A.; Fageria, N.K. Soil Chemical Attributes of Amazonas State, Brazil. Commun. Soil Sci. Plant Anal. 2009, 40, 2912–2925. [Google Scholar] [CrossRef]
- Venegas, V.H.A.; Novais, R.F.; Barros, N.F.; Cantarutti, R.B.; LOPES, A.S. Interpretation of soil analysis results. In Recommendations for the Use of Correctives and Fertilizers in Minas Gerais; Comissão de Fertilidade do Solo do Estado de Minas Gerais: Viçosa, Brazil, 1999; pp. 25–32. [Google Scholar]
- Bayer, C.; Mielniczuk, J. Características químicas do solo afetadas por métodos de preparo e sistemas de cultura. Soil Sci. 1997, 21, 105–112. [Google Scholar]
- Bowman, R.A.; Reeder, J.D.; Lober, R.W. Changes in soil properties in a central plains rangeland soil after 3, 20, and 60 years of cultivation. Soil Sci. 1990, 150, 851–857. [Google Scholar] [CrossRef]
- de Souza Braz, A.M.; Fernandes, A.R.; Alleoni, L.R.F. Soil attributes after the conversion from forest to pasture in the Amazon. L. Degrad. Dev. 2013, 24, 33–38. [Google Scholar] [CrossRef]
- Frazão, L.A.; Paustian, K.; Pellegrino Cerri, C.E.; Cerri, C.C. Soil carbon stocks and changes after oil palm introduction in the Brazilian Amazon. GCB Bioenergy 2013, 5, 384–390. [Google Scholar] [CrossRef]
- De Souza, J.L.; Ferreira, F.J.F. Anomalias aerogamaespectrométricas (K, eU e eTh) da quadrícula de Araras (SP) e suas relações com processos pedogenéticos e fertilizantes fosfatos. Rev. Bras. Geofísica 2005, 23, 251–274. [Google Scholar] [CrossRef]
- Malikova, I.N.; Strakhovenko, V.D.; Ustinov, M.T. Uranium and thorium contents in soils and bottom sediments of lake Bolshoye Yarovoye, western Siberia. J. Environ. Radioact. 2020, 211, 106048. [Google Scholar] [CrossRef]
- Blanco Rodríguez, P.; Vera Tomé, F.; Lozano, J.C.; Pérez-Fernández, M.A. Influence of soil texture on the distribution and availability of 238U, 230Th, and 226Ra in soils. J. Environ. Radioact. 2008, 99, 1247–1254. [Google Scholar] [CrossRef]
- Echevarria, G.; Sheppard, M.I.; Morel, J. Effect of pH on the sorption of uranium in soils. J. Environ. Radioact. 2001, 53, 257–264. [Google Scholar] [CrossRef]
- Stojanović, M.; Stevanović, D.; Milojković, J.; Mihajlović, M.L.; Lopičić, Z.; Šoštarić, T. Influence of Soil Type and Physical–Chemical Properties on Uranium Sorption and Bioavailability. Water Air Soil Pollut. 2012, 223, 135–144. [Google Scholar] [CrossRef]
- Morton, L.S.; Evans, C.V.; Estes, G.O. Natural Uranium and Thorium Distributions in Podzolized Soils and Native Blueberry. J. Environ. Qual. 2002, 31, 155–162. [Google Scholar] [CrossRef]
- Reiller, P.; Moulin, V.; Casanova, F.; Dautel, C. Retention behaviour of humic substances onto mineral surfaces and consequences upon thorium (IV) mobility: Case of iron oxides. Appl. Geochem. 2002, 17, 1551–1562. [Google Scholar] [CrossRef]
- IAEA. Handbook of Parameter Values for the Prediction of Radionuclide Transfer in Terrestrial and Freshwater Environments; International Atomic Energy Agency: Vienna, Austria, 2010. [Google Scholar]
- Tuovinen, T.S.; Roivainen, P.; Makkonen, S.; Kolehmainen, M.; Holopainen, T.; Juutilainen, J. Soil-to-plant transfer of elements is not linear: Results for five elements relevant to radioactive waste in five boreal forest species. Sci. Total Environ. 2011, 410–411, 191–197. [Google Scholar] [CrossRef] [PubMed]
- Pulhani, V.A.; Dafauti, S.; Hegde, A.G.; Sharma, R.M.; Mishra, U.C. Uptake and distribution of natural radioactivity in wheat plants from soil. J. Environ. Radioact. 2005, 79, 331–346. [Google Scholar] [CrossRef] [PubMed]
- Filgueiras, R.A.; Silva, A.X.; Ribeiro, F.C.A.; Lauria, D.C.; Viglio, E.P. Baseline, mapping and dose estimation of natural radioactivity in soils of the Brazilian state of Alagoas. Radiat. Phys. Chem. 2020, 167, 108332. [Google Scholar] [CrossRef]
- Malanca, A.; Pessina, V.; Dallara, G. Assessment of the Natural Radioactivity in the Brazilian State of Rio Grande Do Norte. Health Phys. 1993, 65, 298–302. [Google Scholar] [CrossRef]
- Nguyen, V.T.; Thu Huynh, N.P.; Le, C.H. Accumulation rates of natural radionuclides (40K, 210Pb, 226Ra, 238U, and 232Th) in topsoils due to long-term cultivations of water spinach (Ipomoea Aquatica Forssk.) and rice (Oryza Sativa L.) based on model assessments: A case study in Dong Nai province. J. Environ. Manag. 2020, 271, 111001. [Google Scholar] [CrossRef]
Publisher’s Note: MDPI stays neutral with regard to jurisdictional claims in published maps and institutional affiliations. |
© 2021 by the authors. Licensee MDPI, Basel, Switzerland. This article is an open access article distributed under the terms and conditions of the Creative Commons Attribution (CC BY) license (https://creativecommons.org/licenses/by/4.0/).