Article

Multisource Data Analysis for Gold Potentiality Mapping of Atalla Area and Its Environs, Central Eastern Desert, Egypt

1
Department of Mineralogy and Geology, University of Debrecen, Egyetem tér 1, 4032 Debrecen, Hungary
2
Department of Geology, Tanta University, Tanta 31527, Egypt
3
Department of Geophysics, University of Miskolc, 3515 Miskolc, Hungary
4
Department of Geology, South Valley University, Qena 83523, Egypt
*
Authors to whom correspondence should be addressed.
Minerals 2021, 11(6), 641; https://doi.org/10.3390/min11060641
Submission received: 20 May 2021 / Revised: 14 June 2021 / Accepted: 15 June 2021 / Published: 16 June 2021
(This article belongs to the Section Mineral Exploration Methods and Applications)

Abstract

:
In this research, airborne geophysical and remote sensing datasets were integrated for gold potentiality mapping (GPM) over the Atalla area in Central Eastern Desert, Egypt. Utilizing aeromagnetic data, detailed structural complexity maps were constructed using the center for exploration targeting (CET) procedure. Then, spectrometric gamma-ray data primarily located hydrothermally altered tracts with discriminating various rock units. The latter are precisely outlined by implementing various techniques (false-color composite (FCC), band ratio (BR), relative absorption band depth (RBD), directed principal component analysis (DPCA), and constrained energy minimization (CEM)) to ASTER, Sentinel 2 and ALOS PRISM datasets, with reference to the geological maps. The study exhibits that gold mineralization is structurally controlled by NW-SE direction. The findings of structural complexity and hydrothermal alteration (argillic, advanced argillic, phyllic, and propylitic) were used as weighted inputs for contouring gold potentiality. The resultant GPM accentuated five gold-promising zones; two are confirmed via locations of ancient gold mines, while the remaining three zones are strongly recommended for their gold potentiality.

1. Introduction

The exploration of potentially mineralized areas substantially relies on an integrated analysis of multiple datasets, mostly geophysical, remote sensing, geological, and geochemical. Every method has its characteristics to identify areas of economic interest. Some methods (e.g., magnetic) may directly detect ore deposits such as ferromagnetic minerals [1], while deposits enriched in natural radioelements (potassium, thorium, and uranium) can be outlined by spectrometric gamma-rays. Other approaches are often useful in inferring lithology, surface, and subsurface structure, thus indirectly supporting the identification of mineralized rocks and promising tracts for deposits. Applying one or more of these methods for attaining the desired targets is based on several factors; the surveyed area, time, investment (cost), and human labor, specifically in regions that are not easily accessible.
Airborne geophysical methods involving aeromagnetic and spectrometric gamma-rays stand out from other geophysical approaches due to their rapid rate of coverage and low cost per unit area surveyed for deducing both hidden ores and structural features (faults, dykes, shear zones) associated with mineral deposits. There has been a remarkable development in the used methods not only in the processing of magnetic data but also in enhancement and interpretation as well. It has become possible to automatically map the linear structures, porphyry magnetic signatures that may control mineralization [2] besides the conventional methods [3,4,5,6]. Otherwise, the gamma-ray spectrometric method is appropriate for the identification of lithologies based on the concentration of radioelements between rock units and structures that cannot be recognized by using potential methods [7,8]. Additionally, the method showed significant success in the precise detection of hydrothermally altered rocks, which are essentially linked to favorable sites of ore deposits.
Supplementing the geophysical methods, remote sensing becomes an efficient tool that aids in deducing surface features and remapping lithological boundaries of rock units. In addition, it transcends the detection of hydrothermal alteration locations to recognize its type depending on the spectral signatures of index minerals for each alteration type. For instance, argillic (kaolinite and alunite), phyllic (illite/muscovite (sericite)), and propylitic (epidote, chlorite, and calcite) alteration zones could be discriminated [9]. Advanced spaceborne thermal emission and reflection radiometer (ASTER) and Sentinel 2 datasets have been utilized to differentiate between altered tracts and lithological units through their visible and near-infrared (VNIR, 0.4 to 1.1 µm), and shortwave infrared (SWIR, 2.0 to 2.50 µm) bands [10,11,12]. Disclosing minerals in VNIR are mainly attributed to marked absorption due to electronic processes of transitional elements (e.g., Fe3+, Fe2+, Mn, and Cr) [13]. Carbonate and OH-bearing minerals exhibit distinct absorption attributes in SWIR. In this way, minerals could be identified depending on the response from the interacting electromagnetic spectrum with the chemical constituents of minerals.
In our study, ASTER and Sentinel 2 datasets have been integrated with airborne geophysical methods (aeromagnetic, spectrometric gamma-ray), followed by the reconnaissance fieldwork to explore, locate mineralized zones and narrow the area to be further investigated via the costly field and geochemical studies, which can economically confirm these nominated zones for subsequent exploitation.

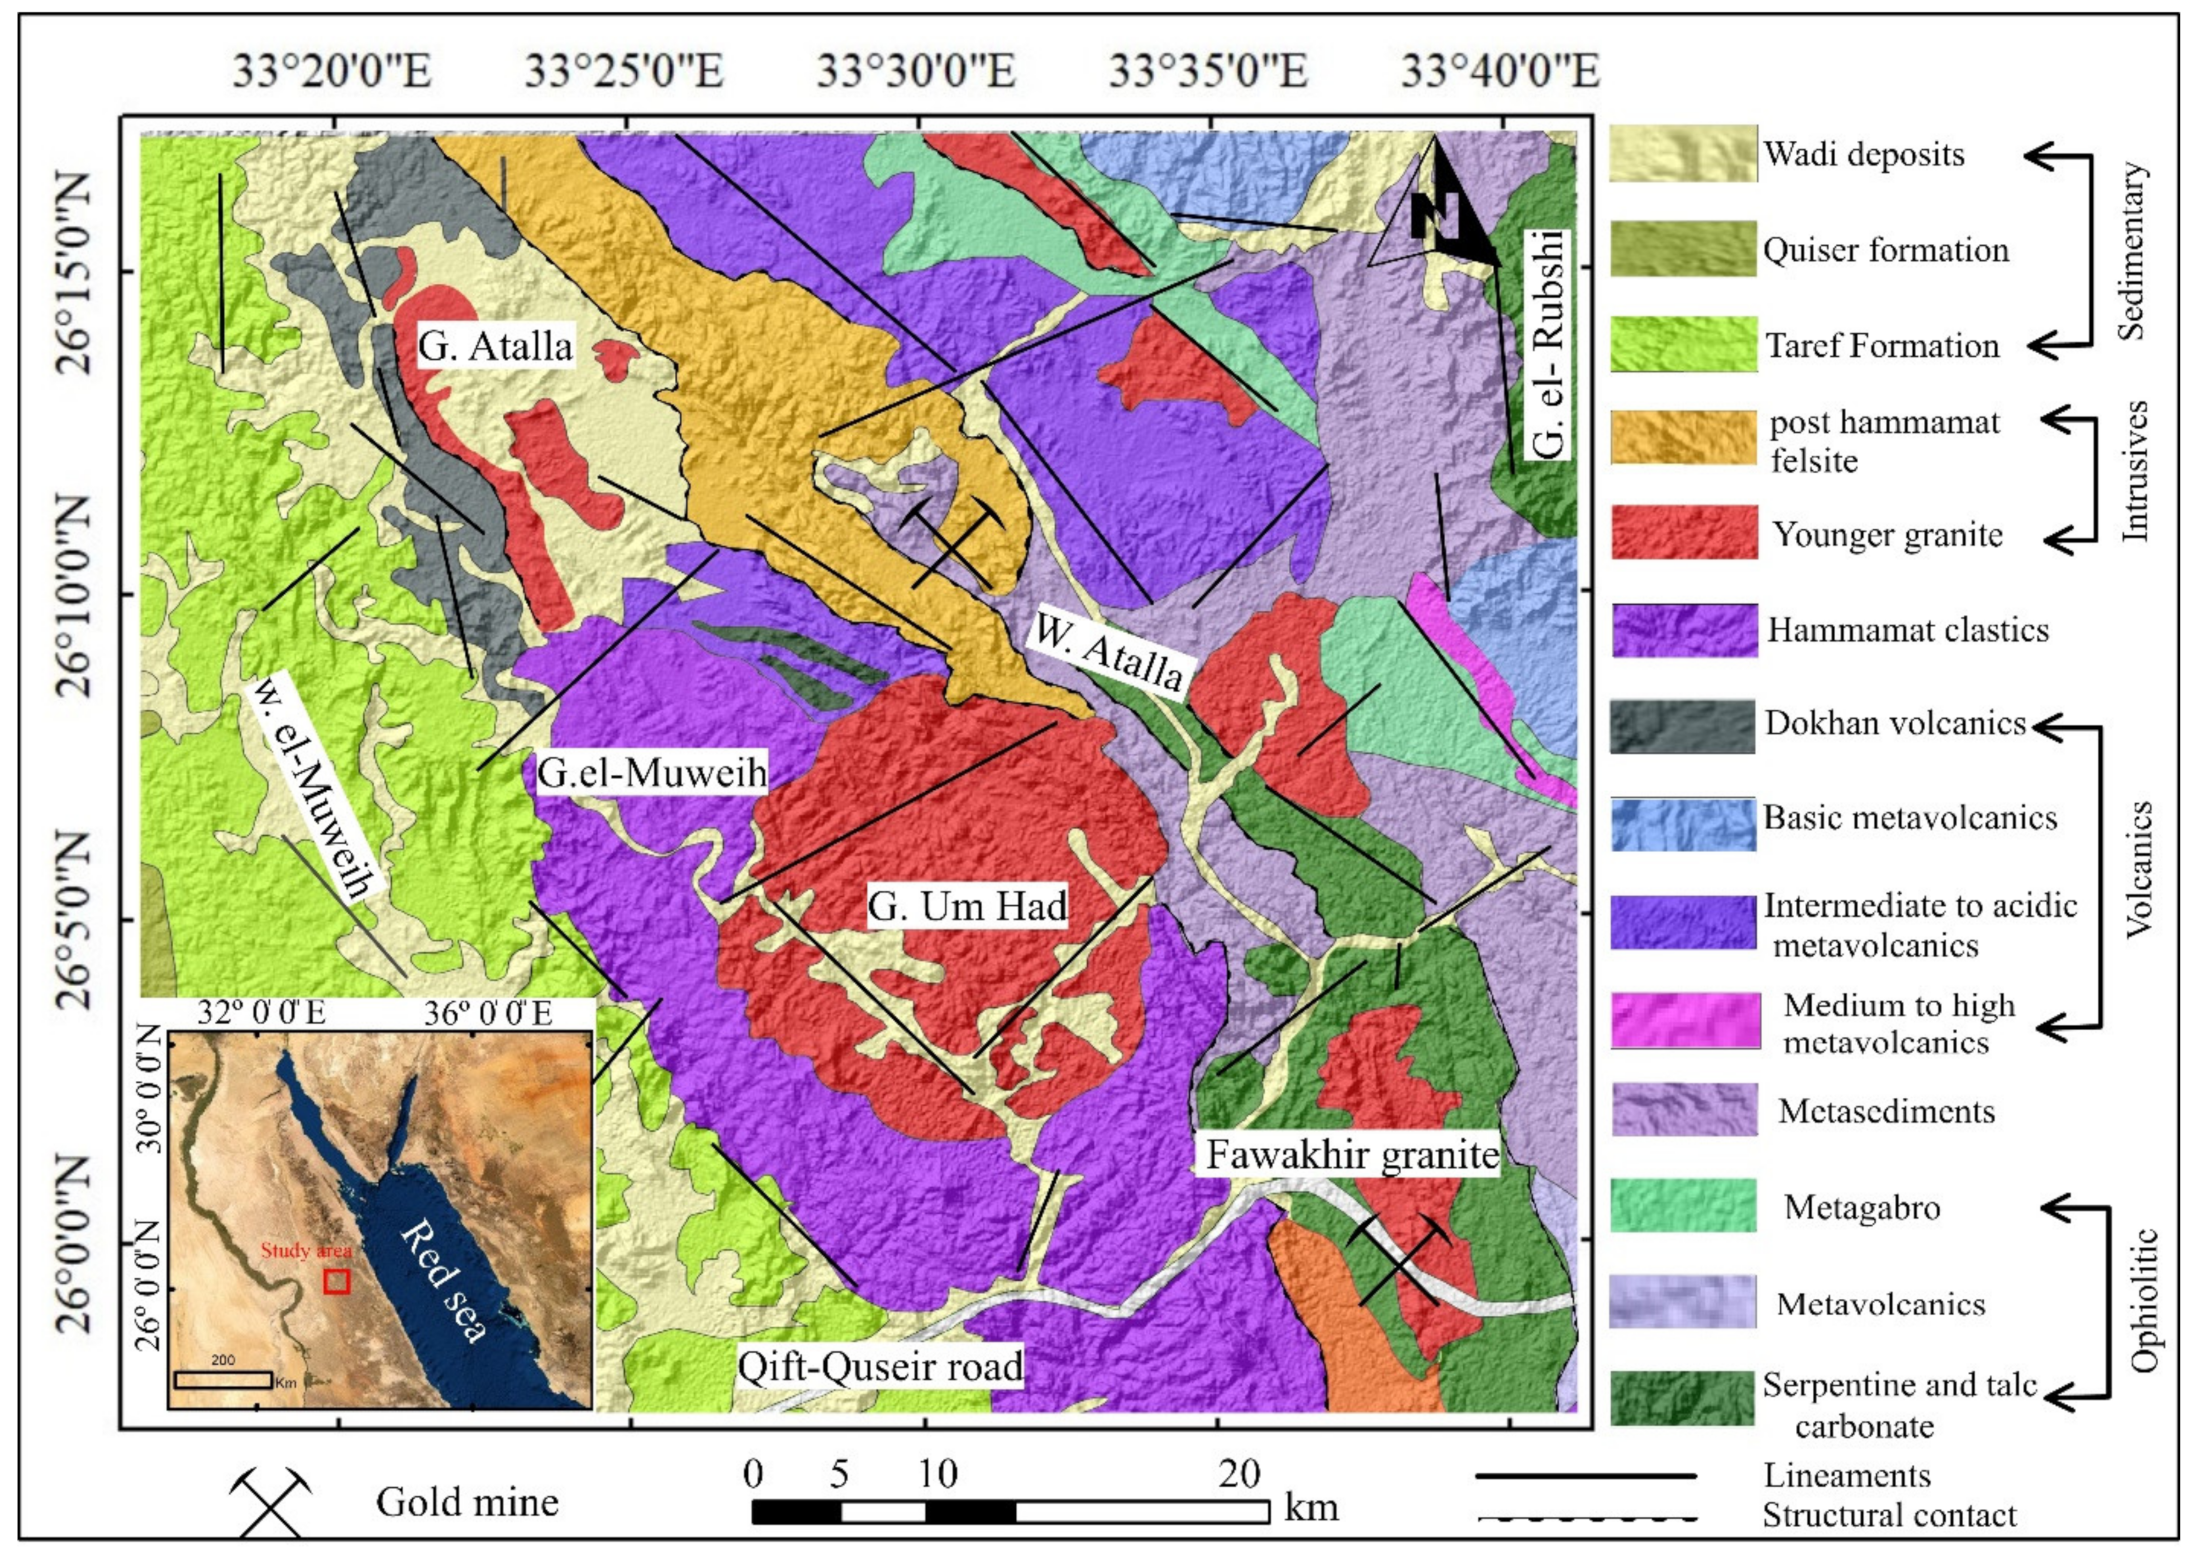
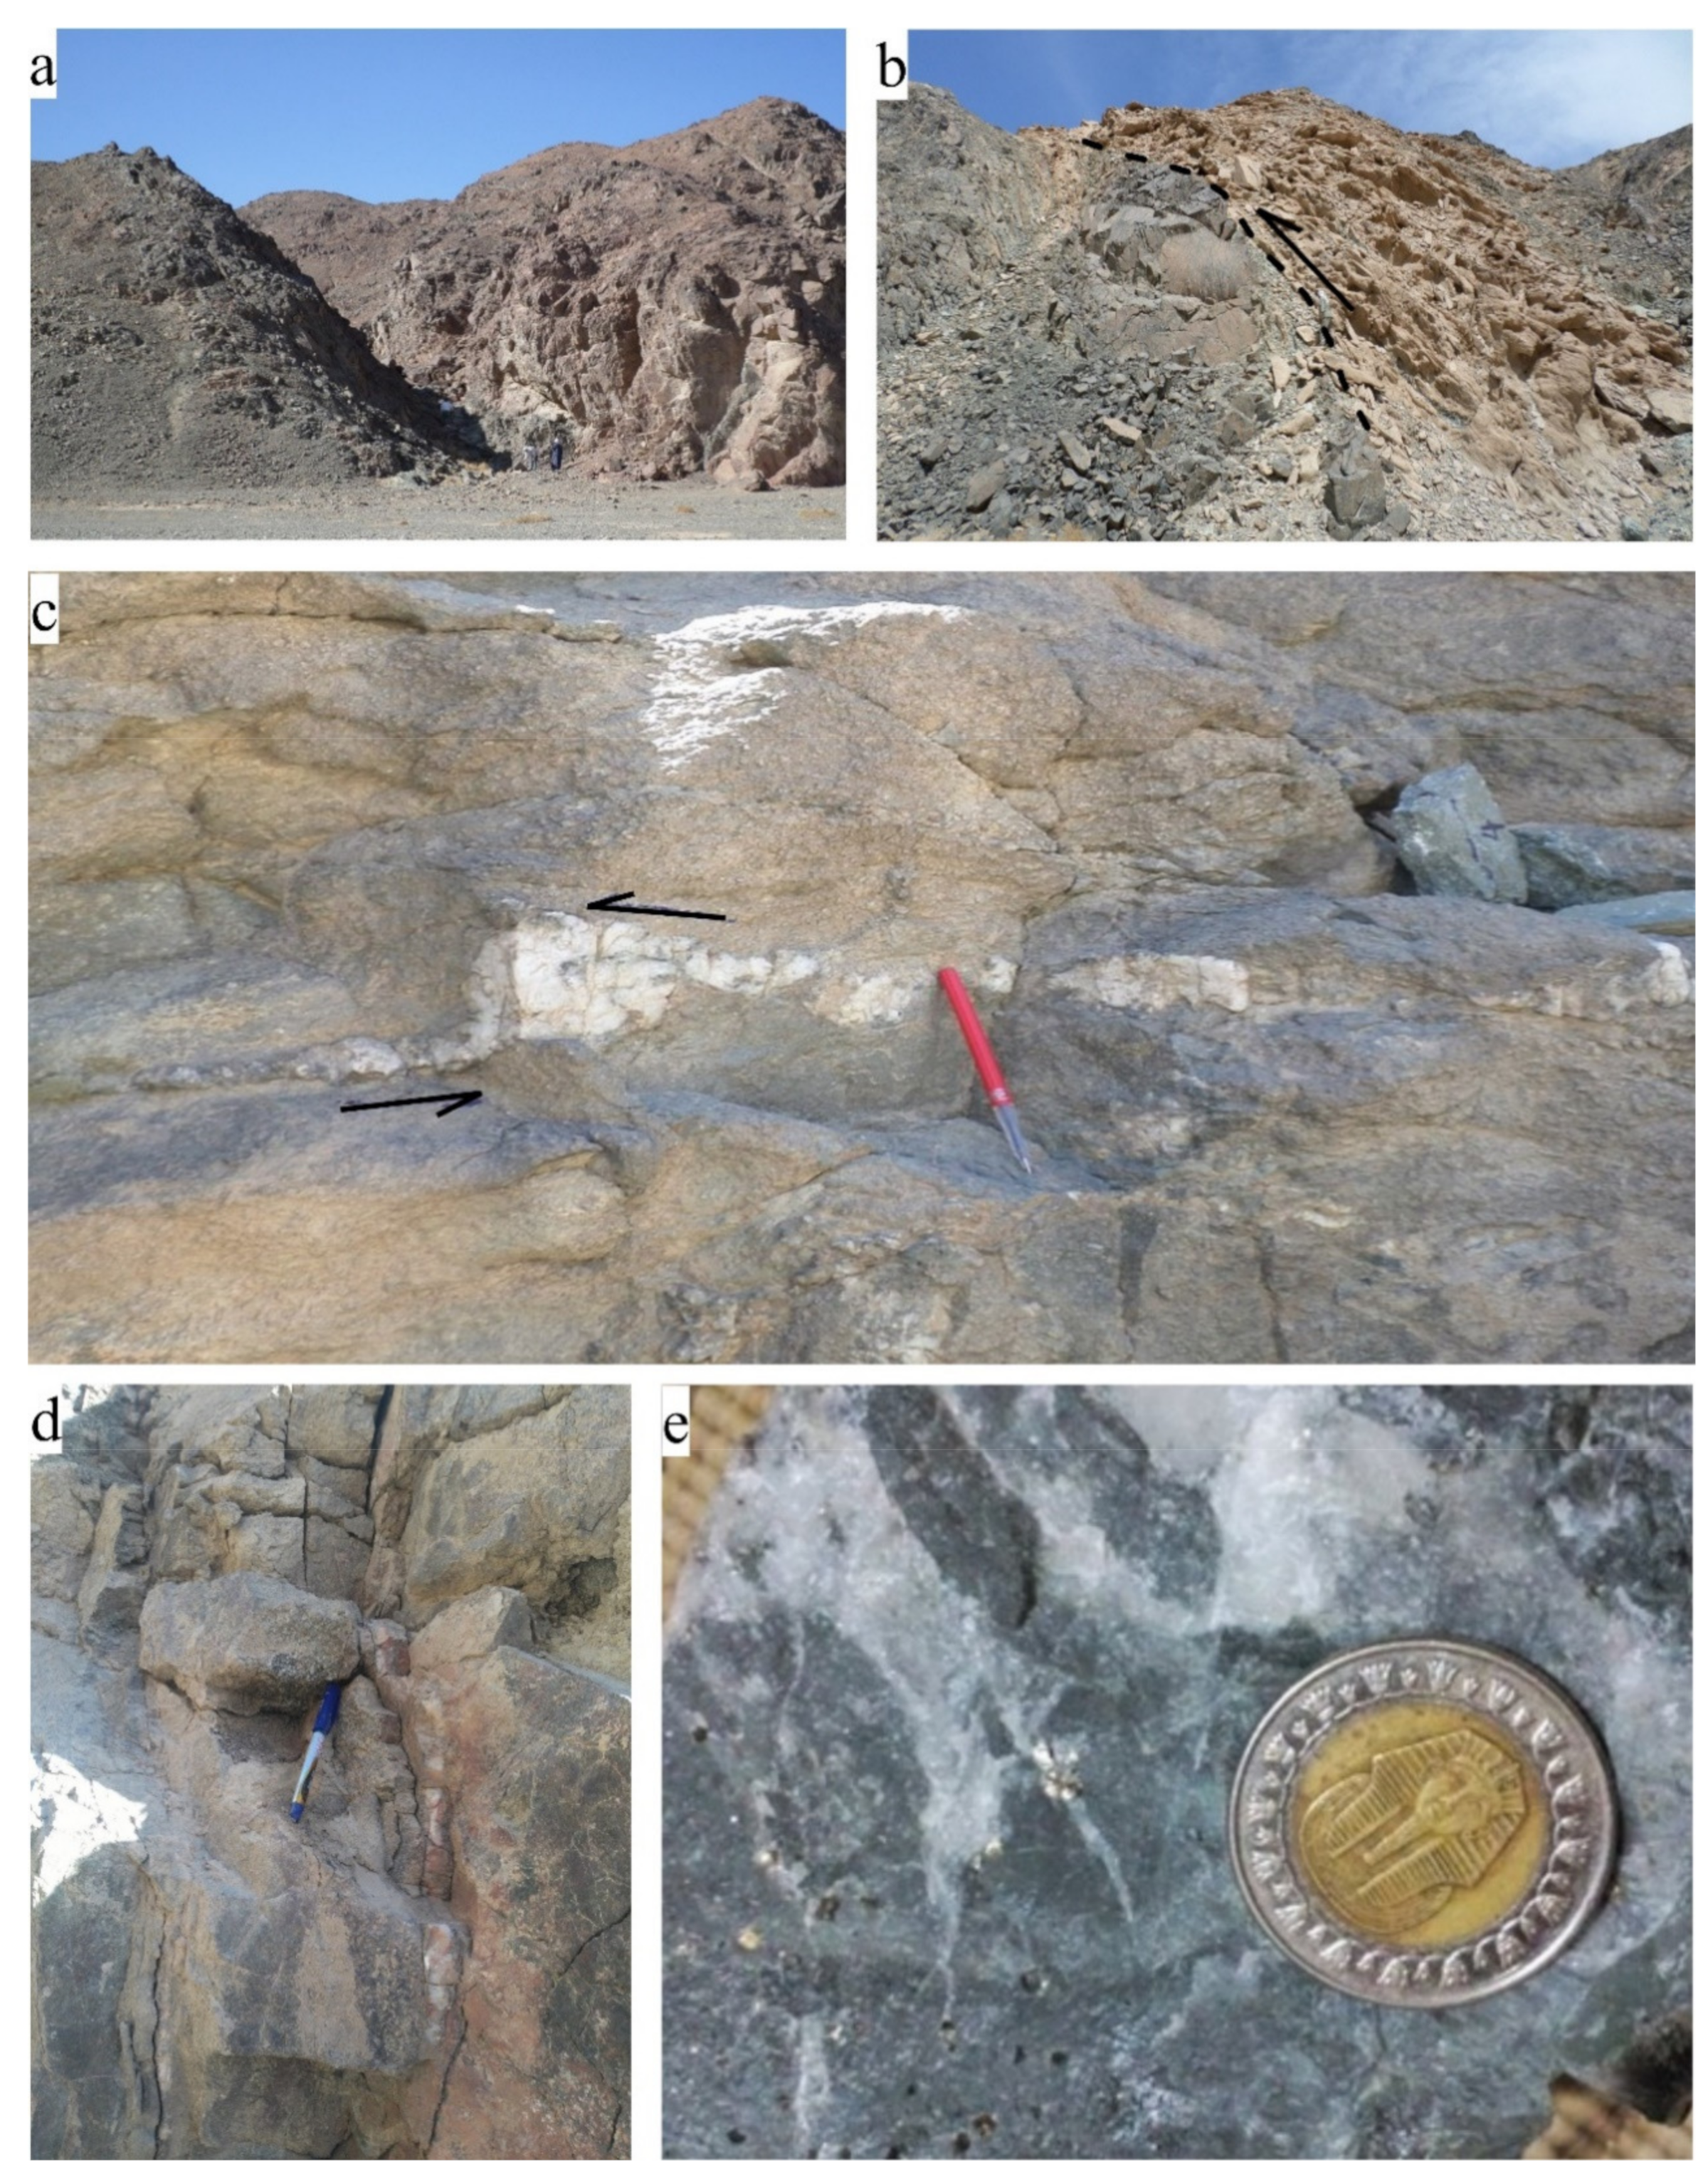
Geology of the Study Area

The study area constitutes a part of the Central Eastern Desert (CED), extending between latitudes 25°58′ to 26°17′ N and longitudes 33°17′ to 33°41′ E. It is covered by a complicated variety of igneous, metamorphic, and sedimentary rocks, as shown in Figure 1. Ophiolitic assemblages mostly include serpentinites (Ser) that always exhibit structural contacts (thrusting) with other rock units and may result in talc-carbonates due to retrogressive metamorphism [14]. Massive serpentinites are represented at the northwestern corner of the study area (Gabal El-Rubbshi, to the north of Um Esh amphibolites (Amp)) and other blocks are disseminated along the Atalla Shear Zone (ASZ) and around Fawakhir granite (FGr). Island arc metavolcanics are chiefly foliated and intruded by Um Had granite and felsites, to the north of the Um Had area. Syn- to late tectonic granitoids include Atalla granite (coarse-grained granodiorite), which is located at the central part of the study area with NW-SE extension, and the oval-shaped Fawakhir granite (mostly mylonitized tonalite) at the southern part of the study area and exhibiting the same extension. Following NW-SE ASZ, Dokhan volcanics are represented by foliated tuffs of wide composition )felsite, dacite, andesite, and basalt) [15] at the western part of the area and between Fawakhir serpentinites and Hammamat clastics.

2. Materials and Methods

In this study, aeromagnetic data helps in detecting the structural complexity, which in turn is confirmed by the automated extracted lineaments from remote sensing data; both are confirmed by previously published geological maps. Radiometric data assists in detecting the alteration areas, which is specified using the widely known (for rocks and alteration identification) ASTER and the recently launched Sentinel 2 data. ALOS PRISM data highly discriminate the rock units and alteration zones (resulting from CEM) by its 2.5 m spatial resolution. A detailed workflow of the integrated datasets and the processing techniques is summarized in Figure 2.

2.1. Airborne Geophysical Data

2.1.1. Acquisition and Preparation

The datasets to be used in this study are compiled from surveys that have been conducted in 1984 by the western geophysical company of America (Aero service division). Traverse flight lines were oriented in a northeast-southwest direction at 1.5-km spacing, while the tie lines were flown northwest-southeast at 10 km. For aeromagnetic data, a Varian (V-85) proton precession magnetometer was used with measurements made at a 304 feet (92.65 m) interval at a nominal sensor altitude of 393.7 feet (120 m) terrain clearance, while a high-sensitivity 256-channel airborne gamma-ray spectrometer was used to conduct the gamma-ray spectrometric survey. The available maps have been prepared for subsequent processing by digitizing the maps in a numeric format that permits the application of interpolation (gridding) techniques. Essential processing operation has been performed on the total magnetic gridded map (Figure 3a) using Fourier transform algorithm [17] to produce a reduction to the north magnetic pole map (Figure 3b) which centroids the magnetic anomalies above the causative bodies. The RTP data is used to implement the structural complexity analysis of the investigated area.

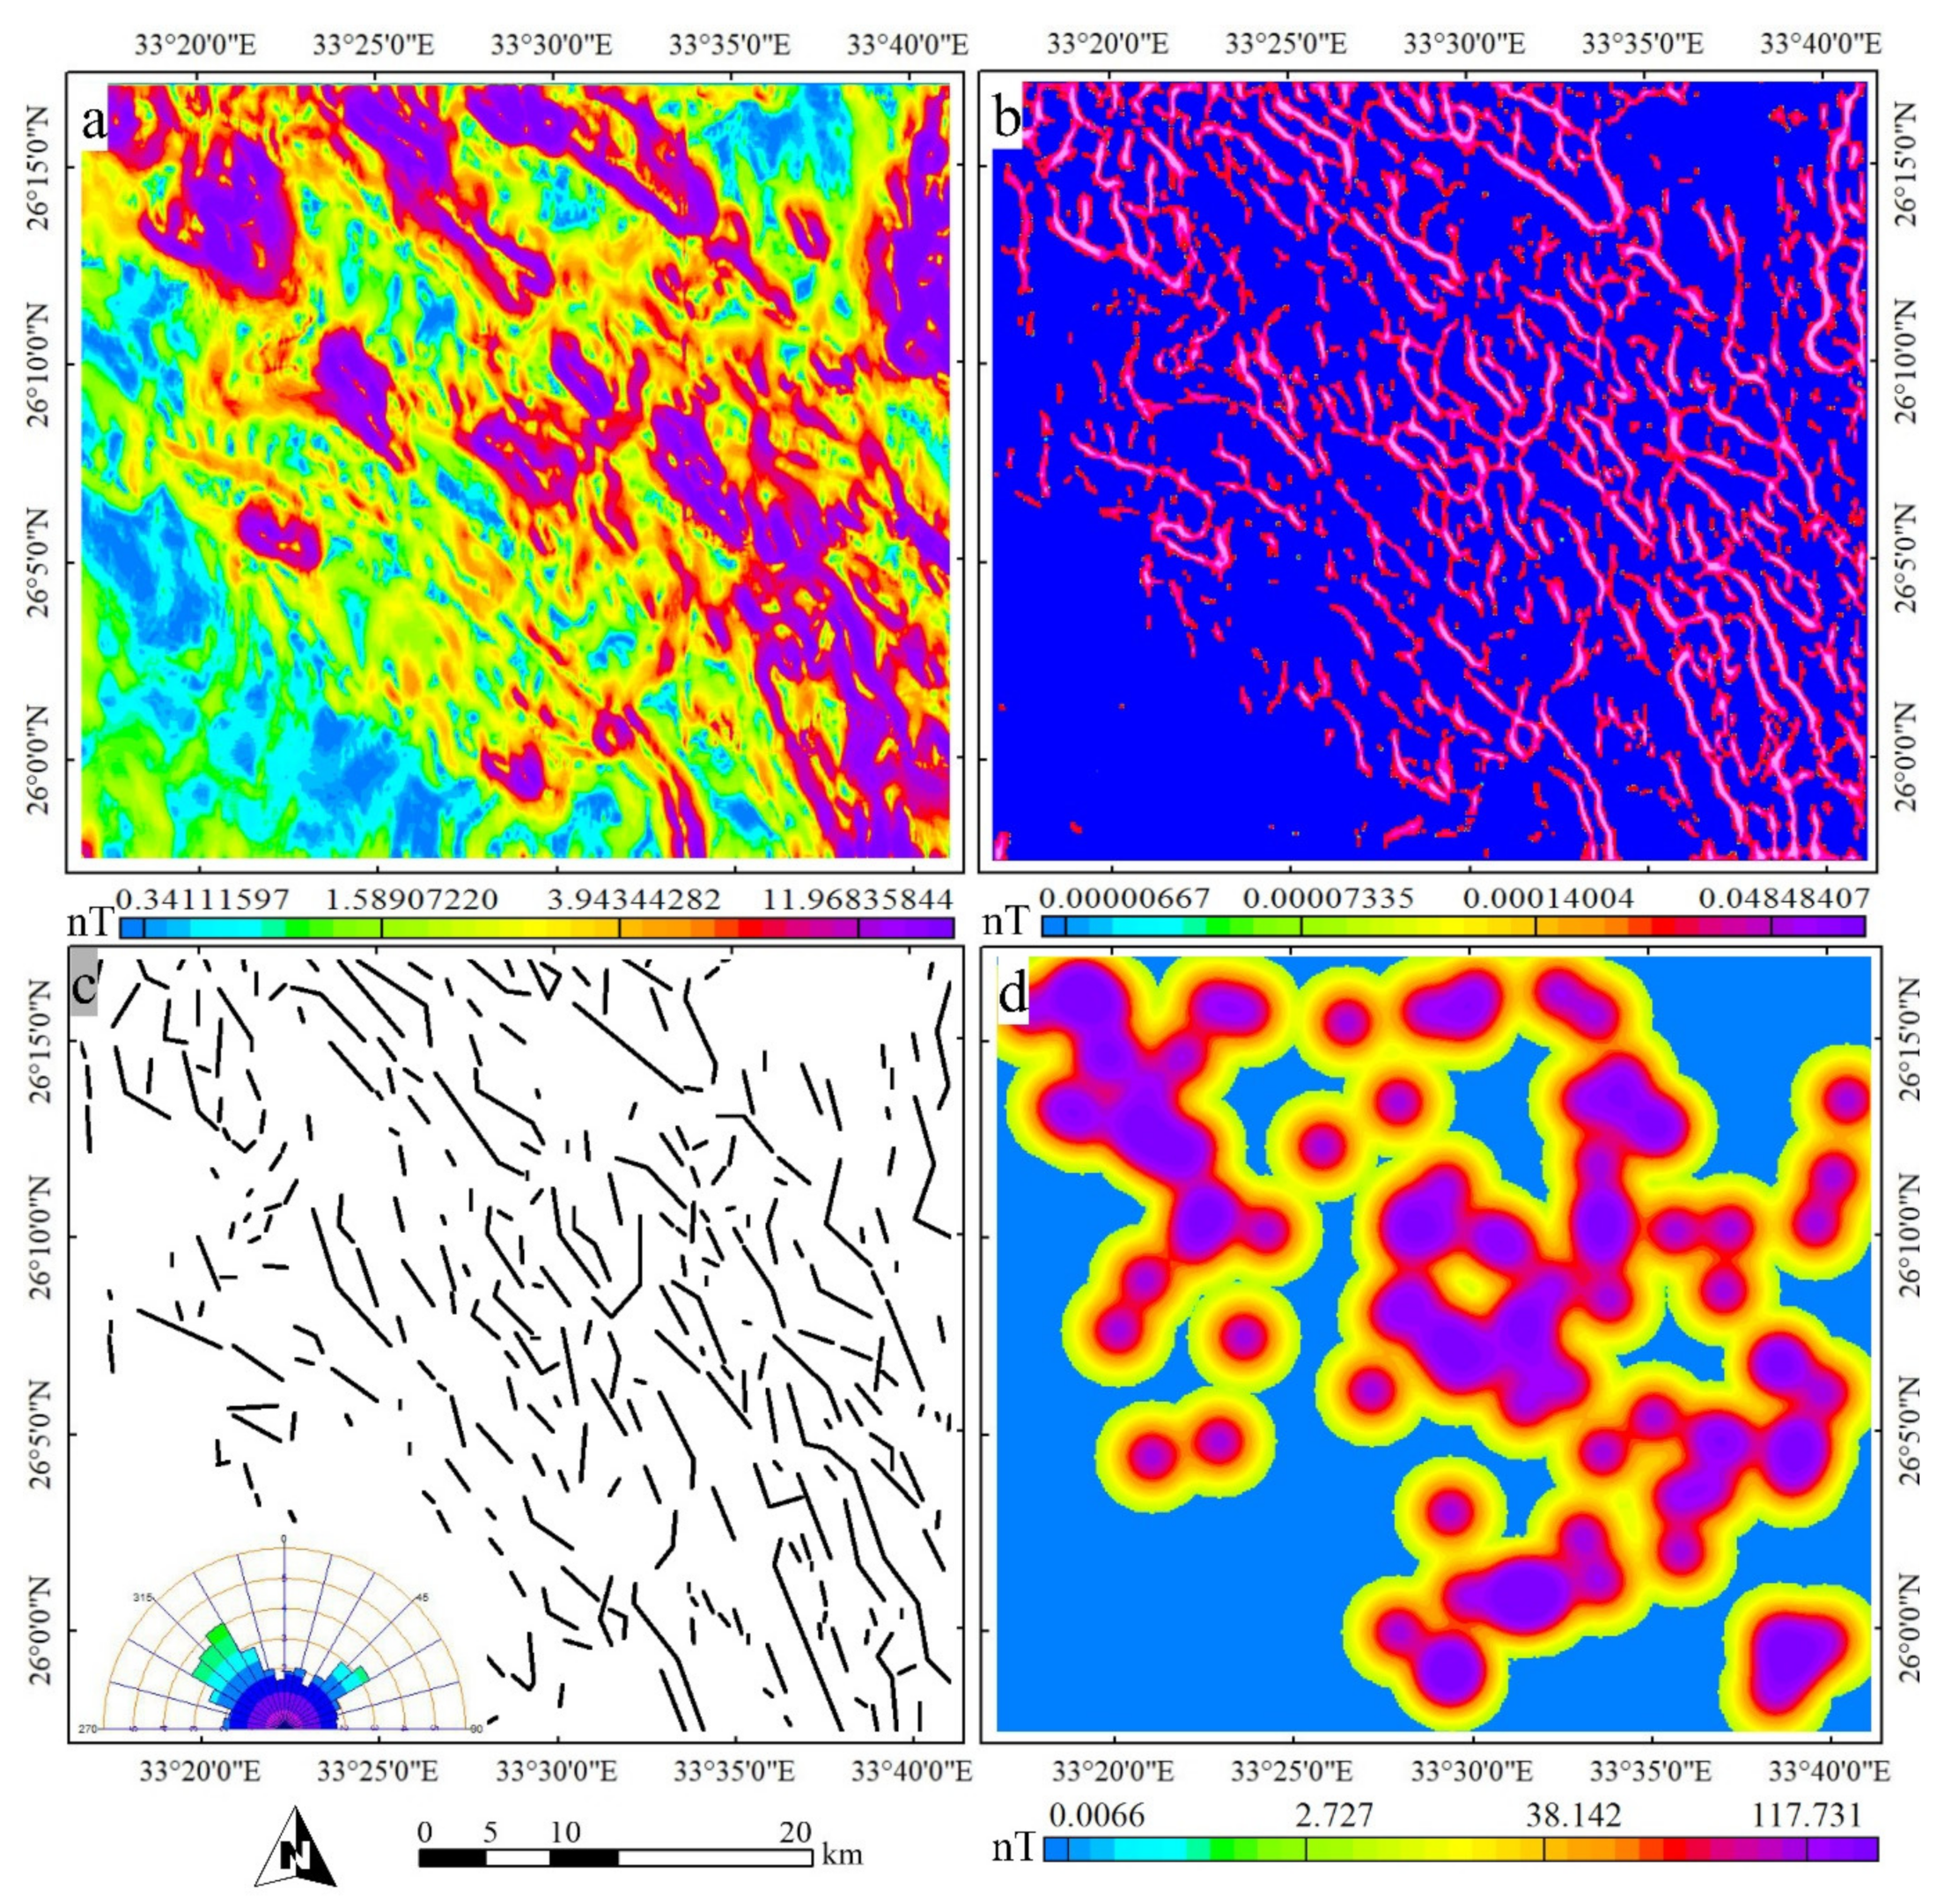
2.1.2. CET Grid Analysis

The CET technique is one of the most recent approaches that includes tools for the automated interpretation of texture, lineation, structure complexity, and the identification of desirable mineralized regions [2]. It provides two different approaches for delineating lineaments automatically, texture analysis-based image enhancement and discontinuity structure detection. The texture analysis-based image enhancement to be used in our study highlights the local intensity variation and enhances the discontinuity regions to figure out junctions, intersections, and changes of strike direction. Three steps to be followed for extracting the tectonic patterns from the magnetic signals are: (i) textural analysis to detect areas of complex texture by converting the magnetic data to a standard deviation map (Figure 4a), (ii) phase symmetry to locate any laterally continuous line-like zones of discontinuity by using the output of textural analysis, and (iii) structure detection using the phase symmetry results to reduce the areas comprising discontinuities into skeletal structures in the form of a binary grid. After using a structure detection workflow to create a database of detected, skeletonized, and vectorized features, an entropy heat map is generated to recognize the favourable occurrences of ore deposits in the study area.

2.1.3. Hydrothermal Alteration Indicators

It has been proven that the gamma-ray spectrometric data has a significant role in the detection of mineralization associated with alteration [18]. The method maps potassium alteration related to several styles of mineralization [19]. In our study, the hydrothermal alteration zones in the investigated area are deduced by using the Th/K ratio and Kd anomalies maps. The nominal k values (Kn) with respect to the concentration of equivalent thorium (eTh) is estimated by using the proposed method of [20,21]
K n = K   m a p a v e r a g e T h   m a p   a v e r a g e × T h   m a p
The (Kd) represents potassium enrichment values owing to hydrothermal alteration processes as derived by
K d = K K n K n

2.2. Remote Sensing Data

2.2.1. Data Characteristics and Preprocessing

Three remote sensing datasets—ASTER, Sentinel 2, and Panchromatic Remote-sensing Instrument for Stereo Mapping (PRISM)—have been implemented in the current study. The ASTER data record radiance in 14 bands [22] is shown in Table 1. Radiance is converted to reflectance via fast line-of-sight atmospheric analysis of spectral hypercubes (FLAASH) atmospheric correction. Then, the six SWIR 30-m spatial resolution bands were resampled to VNIR spatial resolution (15 m) via a cubic convolution algorithm. The second dataset, Sentinel-2A satellite, has 13 spectral channels ranging from VNIR to SWIR and spatially from a 10- to 60-m ground sampling distance [23], as illustrated in Table 1.

2.2.2. Processing Techniques

False-color composites (FCCs), band ratio (BR), relative absorption band depth (RBD), directed principal component analysis (DPCA), and the constrained energy minimization (CEM) spectral mapping technique were applied to discriminate lithologies, alteration zones, and their associated minerals, aiming to locate potential gold zones in the study area.
FCCs deliver reasonable results that help to discriminate rock units, major structures and provide considered shreds of evidence for various geochemical compositions, reflected by color variations for the selected combinations depending on the utilized bands [24,25]. The band ratio technique was applied to ASTER data to recognize types of hydrothermal alteration (advanced argillic (b4/b6), argillic-phyllic (b5/b6), gossan (b4/b2), and hydroxyl-bearing minerals (b4/b9)), and to S2 for the identification of gossan (b11/b4), ferric oxide (b11/b8a), ferrous silicate (b12/b11), and hydroxyl (b11/b12) minerals. RBD was also very helpful for disclosing epidote-chlorite-rich areas through the following ratio: (b7 + b9)/(b8). Principal component analysis is a multivariate statistical technique and dimensionality-reduction method frequently utilized with remote sensing data [26]. DPCA simply considers specific bands as inputs for PCA depending on the required objective and helped in the confirmation of argillic and propylitic alteration zones [27]. The CEM technique was adopted as a spectral mapping method for the localization of minerals that mostly indicate alteration within the range covered by ASTER bands (VNIR and SWIR), with the aid of the USGS spectral library. The CEM technique has the advantage of maximizing the target spectral response over a subdued background. Using ASTER data, clay minerals displayed strong absorption at b6, muscovite was recognized by notable absorption in bands b1, b2, and b6, chlorite absorption troughs were seen at b1, b2, b3, and b8, and the calcite absorption range was extended between b6 to b9. Thus, calcite, muscovite, quartz, kaolinite, epidote, and chlorite were mapped.
Linear structures form an important factor in controlling mineralizations; thus, these lineaments were extracted from ASTER data. The process of automatic lineaments extraction involves two steps: edge detection and line-linking [28]. The frequently used LINE module of the PCI Geomatica was utilized in the current study. A set of parameters including RADI (filter radius), GTHR (edge gradient threshold), LTHR (curve length threshold), FTHR (line fitting threshold), ATHR (angular difference threshold), and DTHR (linking distance threshold) were necessary to determine the pixel edges and curves to ensure a reasonable level of lineament extraction. The input for the extraction process was a greyscale ASTER band 3 image and the values of parameters were assigned as 10, 50, 30, 3, 15, and 20, respectively.

3. Results

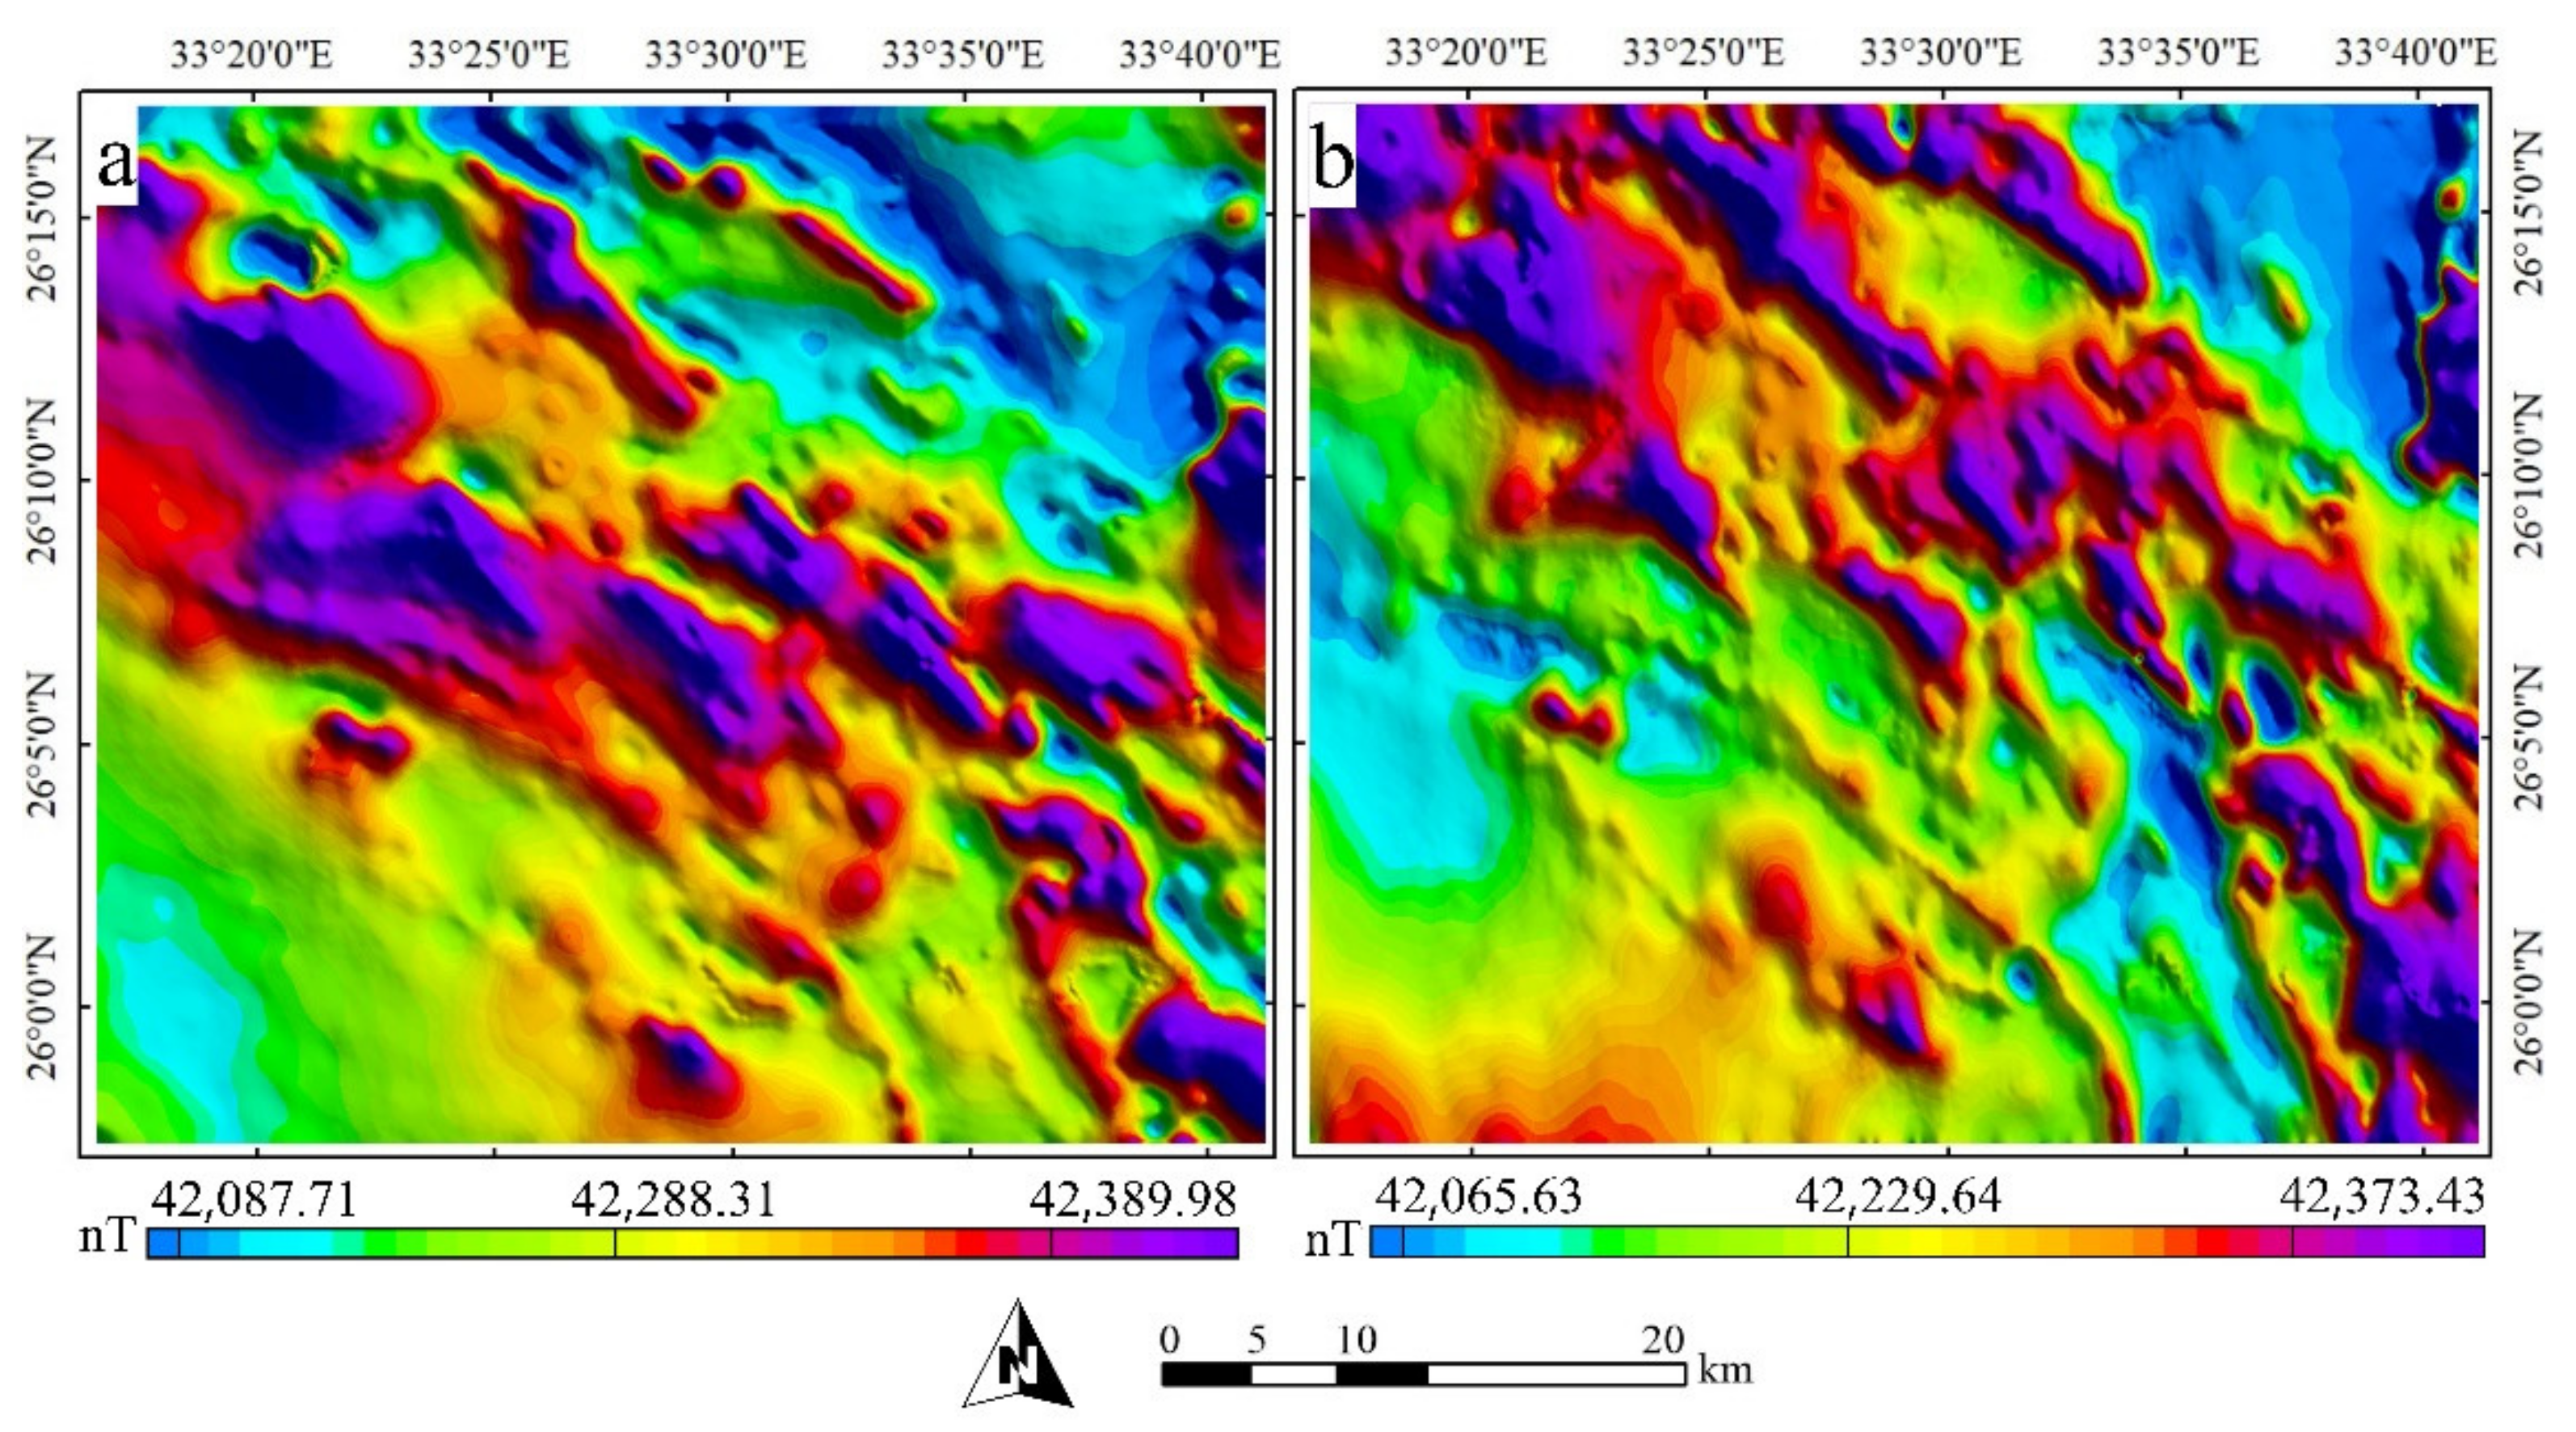
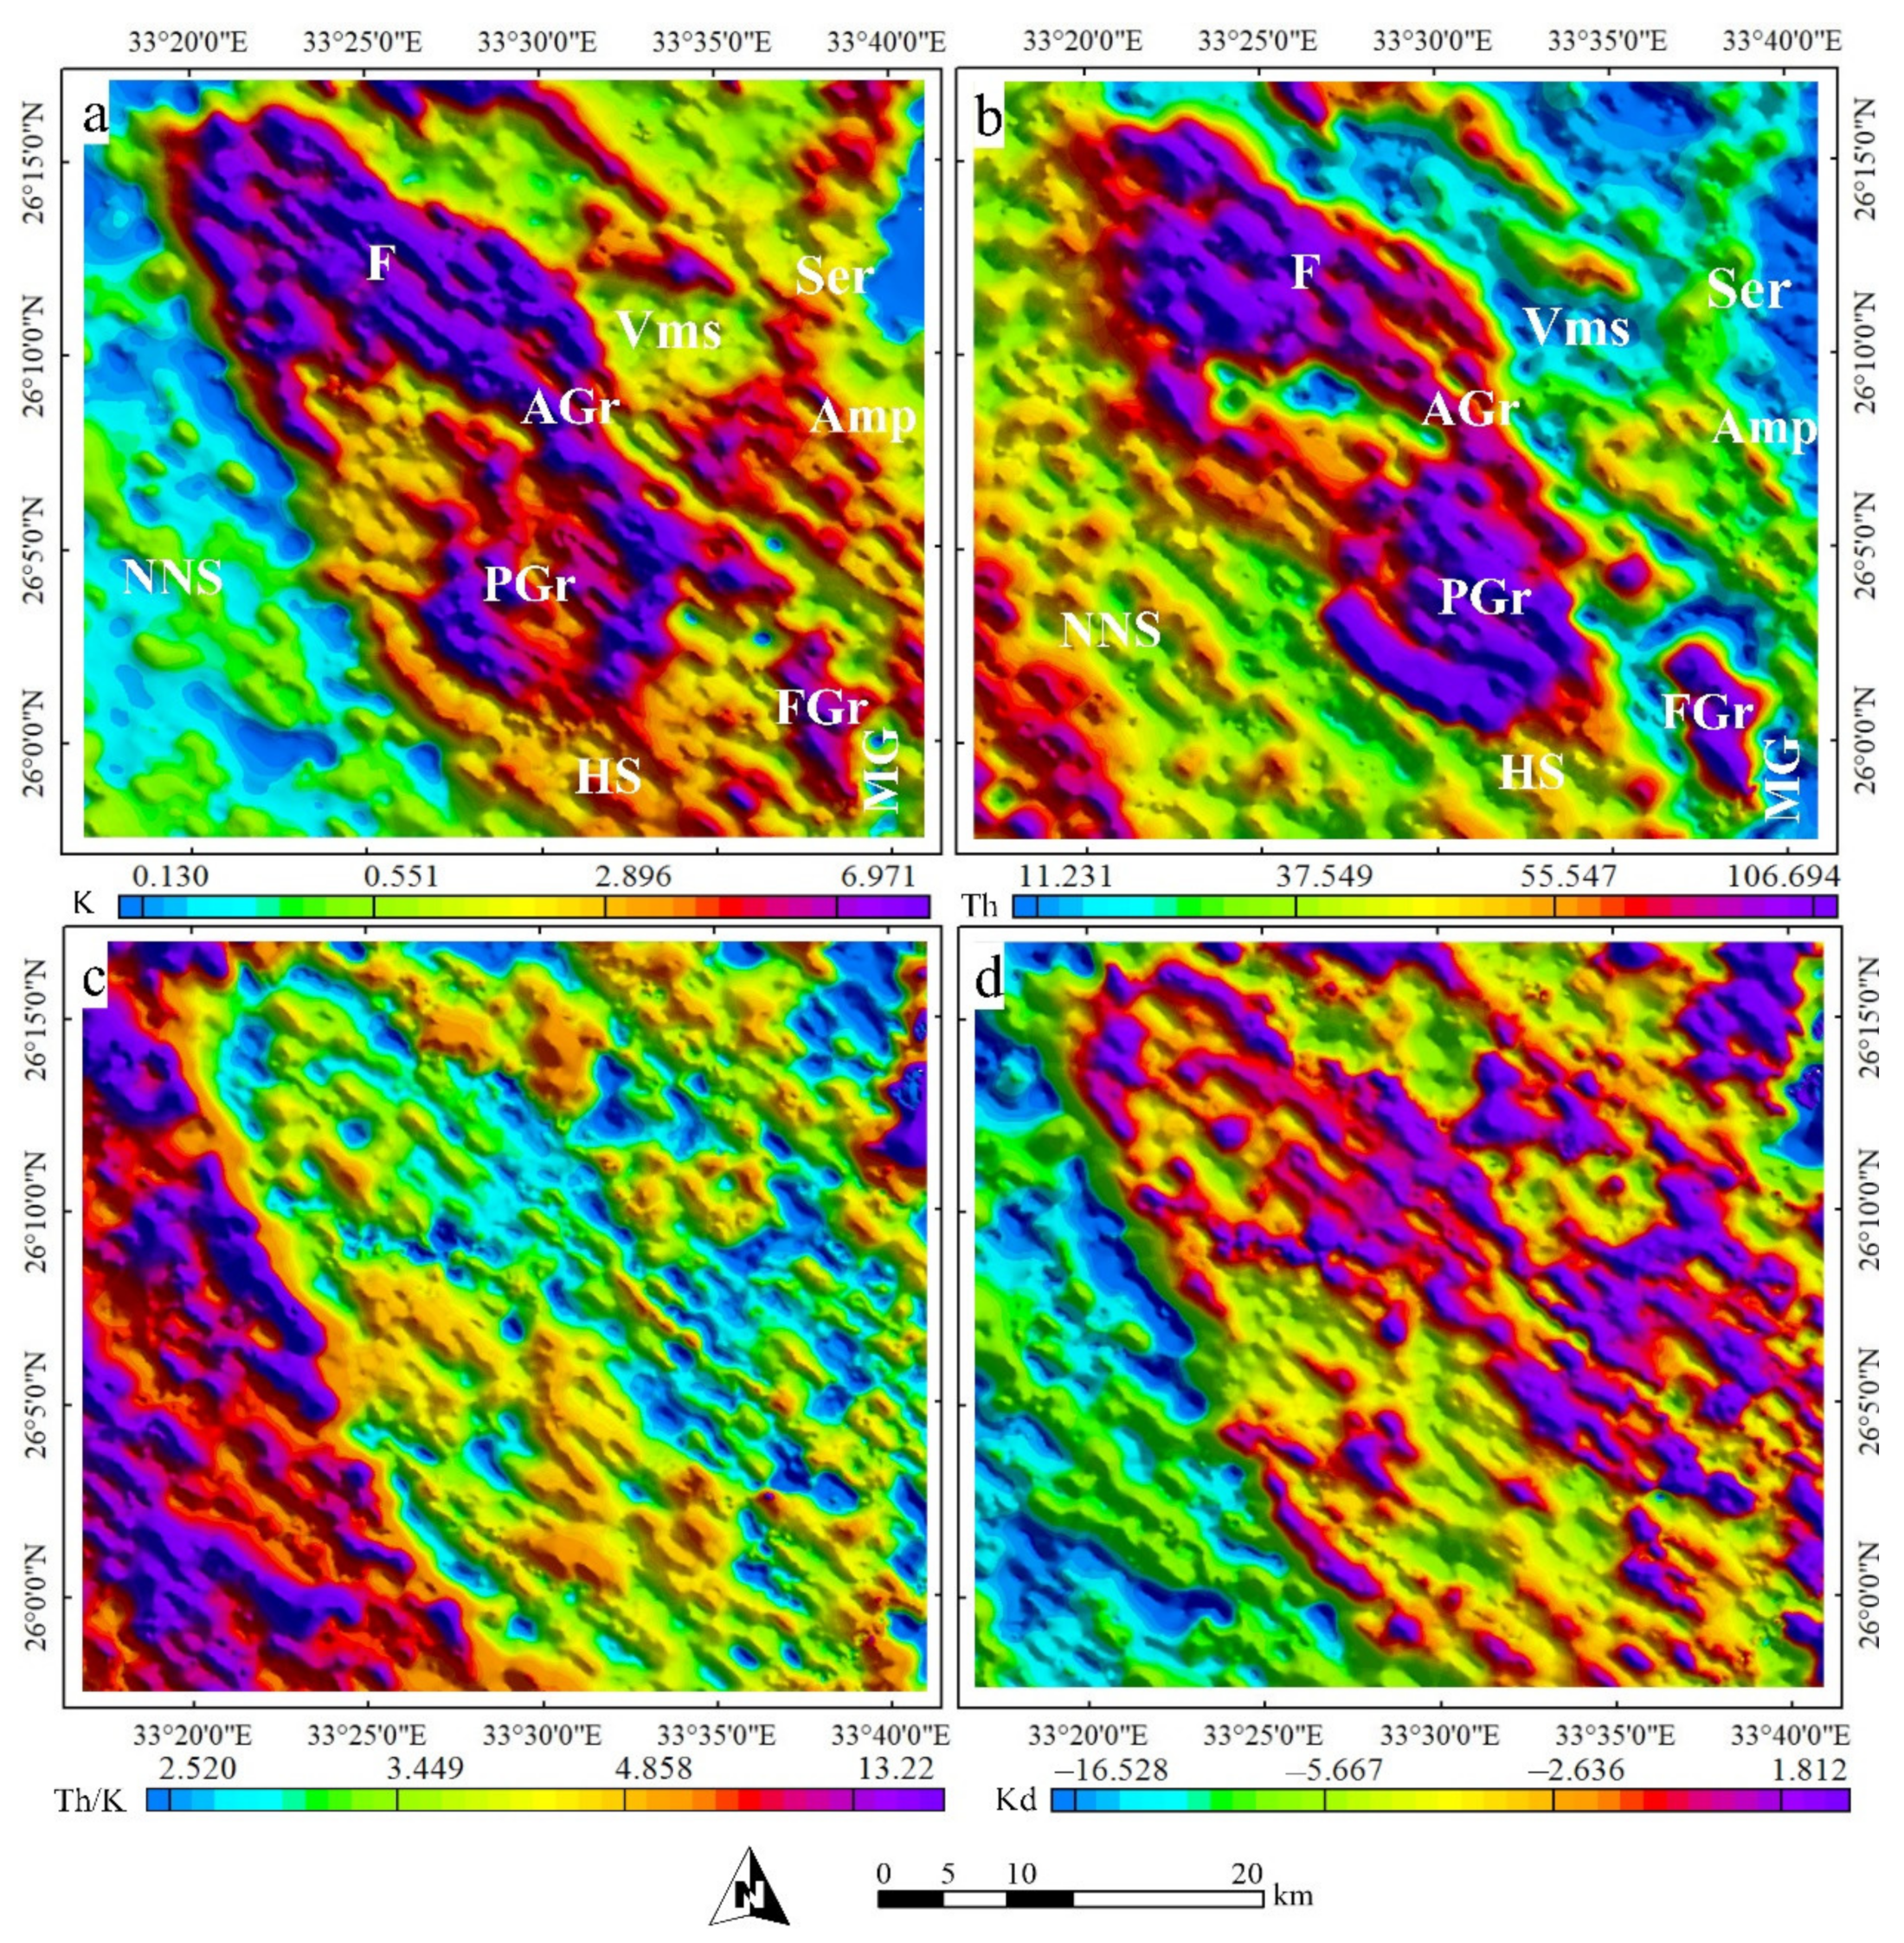
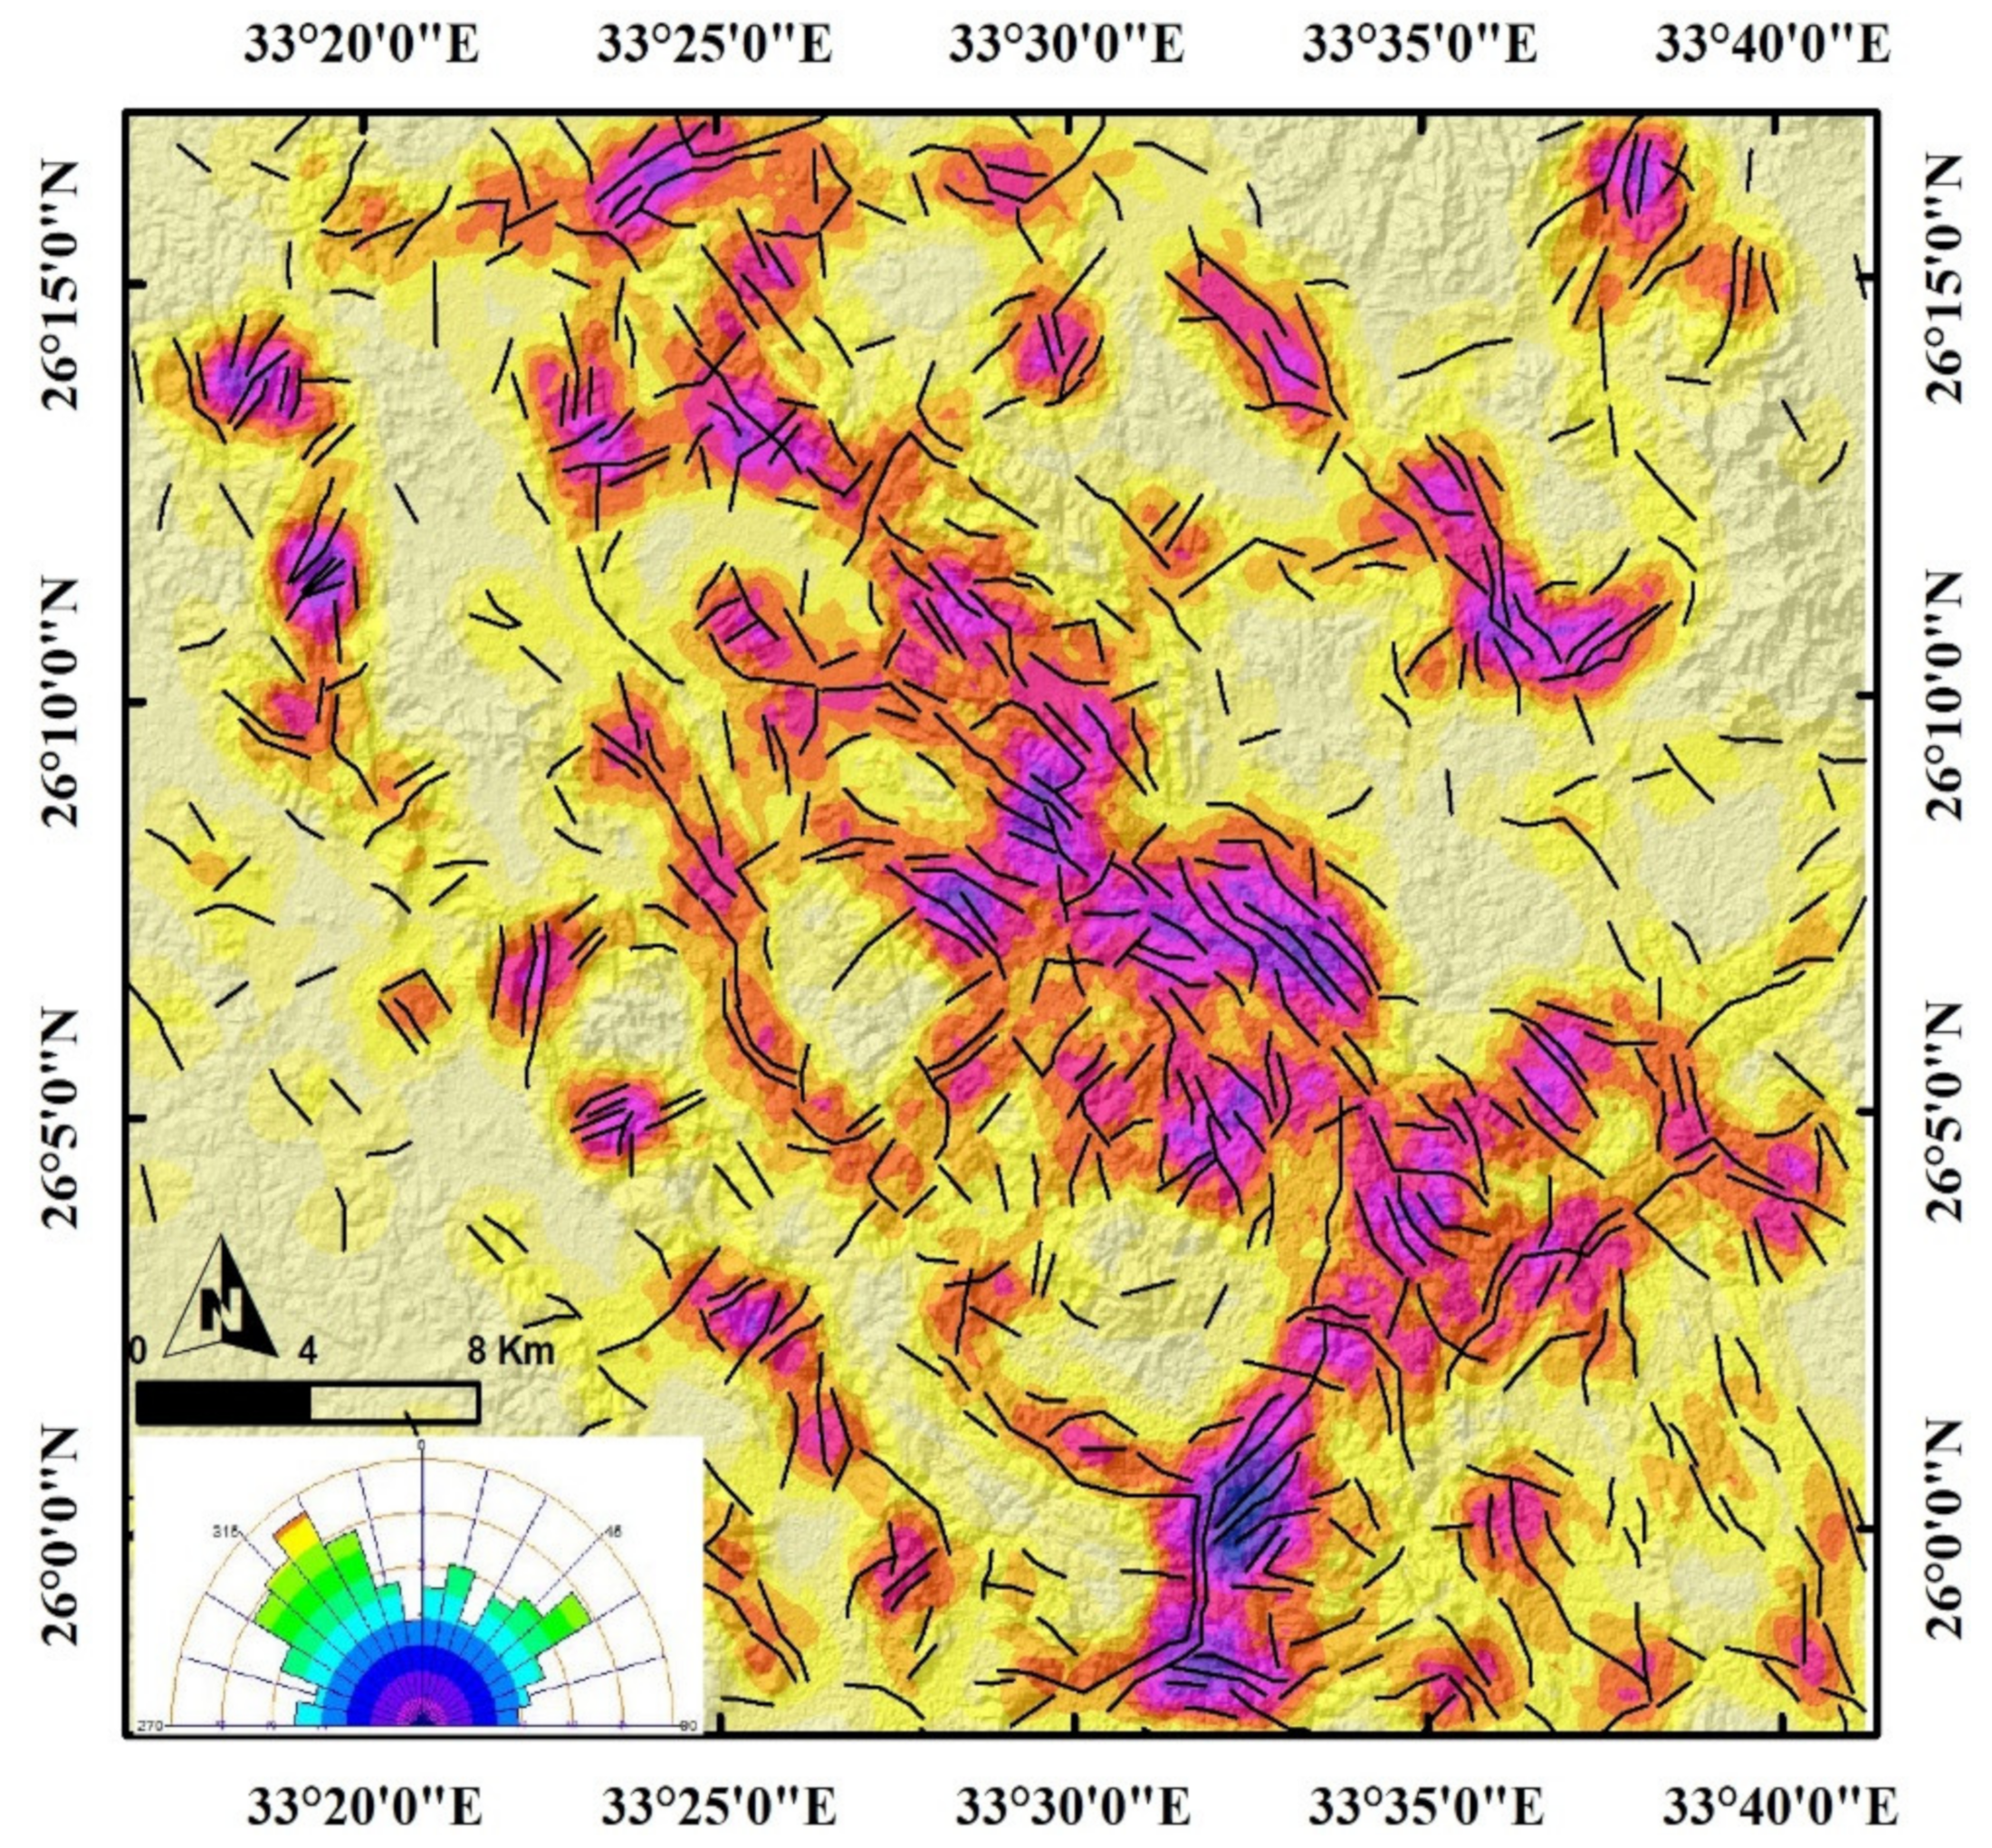
3.1. Analysis of Airborne Geophysical Data

The RTP map (Figure 3b) depicted a more vivid picture of the boundaries of rock units and a more straightforward delineation of the magnetic lineaments in the investigated area, allowing further precise identification of nature and the locations of various structures (dykes, faults, contacts, and shear zones). A glance at the map exhibits a noticeable NW-SE alignment of high magnetic anomalies following the general pattern of Wadi Attalla in the geologic map. The high magnetic anomalies (>42,700 nT) were primarily related to the Atalla shear zone consisting of granite, ophiolitic serpentine, and Dokhan volcanics and define the hydrothermally altered regions. The map also shows medium to low magnetic anomalies (<42,700 nT) associated with metasediments, metavolcanics, Hammamat felsite, and Nubian sandstone, at the northeast and southwest parts of the area, respectively. The NE-SW direction is locally represented in the research area; a minor trace in the N-S and E-W directions has also been revealed.
The high values of applying the standard deviation (STD) filter on the RTP data characterized the discontinuity regions, as shown in Figure 4a. Subsequently, the STD output was used to generate the phase symmetry map (Figure 4b), which distinguishes the possible regions of interest and laterally separates the continuous lines (linear structures). The size and directions of the detected features depend on the scale and orientation parameters used. Hence, in our study, all orientations with a scale of 100 m were utilized. It is worth noting that only positive features were taken into account, as the dykes all appear to have a positive magnetic response. To automatically detect the linear structures in the area, a set of skeletonization and vectorization processes (extracting line segments) were applied to the results (Figure 4c). The close examination of this map reveals various structural trends that include NW-SE, NNW-SSE, NE-SW, N-S, and E-W. Furthermore, potential traps for hydrothermal fluids can be recognized from the intersections of the detected lineaments. The orientation entropy heat map (Figure 4d) was generated using the extracted line segments. The map is associated with the variation of feature orientation (lineaments involving crossings and junctions), allowing identification zones of structural complexity.
The prepared concentration maps of potassium (Figure 5a) and thorium (Figure 5b) assist in highlighting the hydrothermally altered zones that are strongly associated with mineralization in the study area by creating Th/K ratio and Kd anomalies maps (Figure 5c,d), respectively. Additionally, the maps provide a strong correlation and description of the lithologic units based on the concentration, as indicated in the K and Th concentration maps. It is seen that anomalously low Th/K (<3.0), as well as anomalously high Kd (>1.2), reveal highly fractured and hydrothermally altered districts within the investigated area. Furthermore, these signatures are noted to be placed along the shear zone, constituting the proper environment for the occurrence of mineralization.

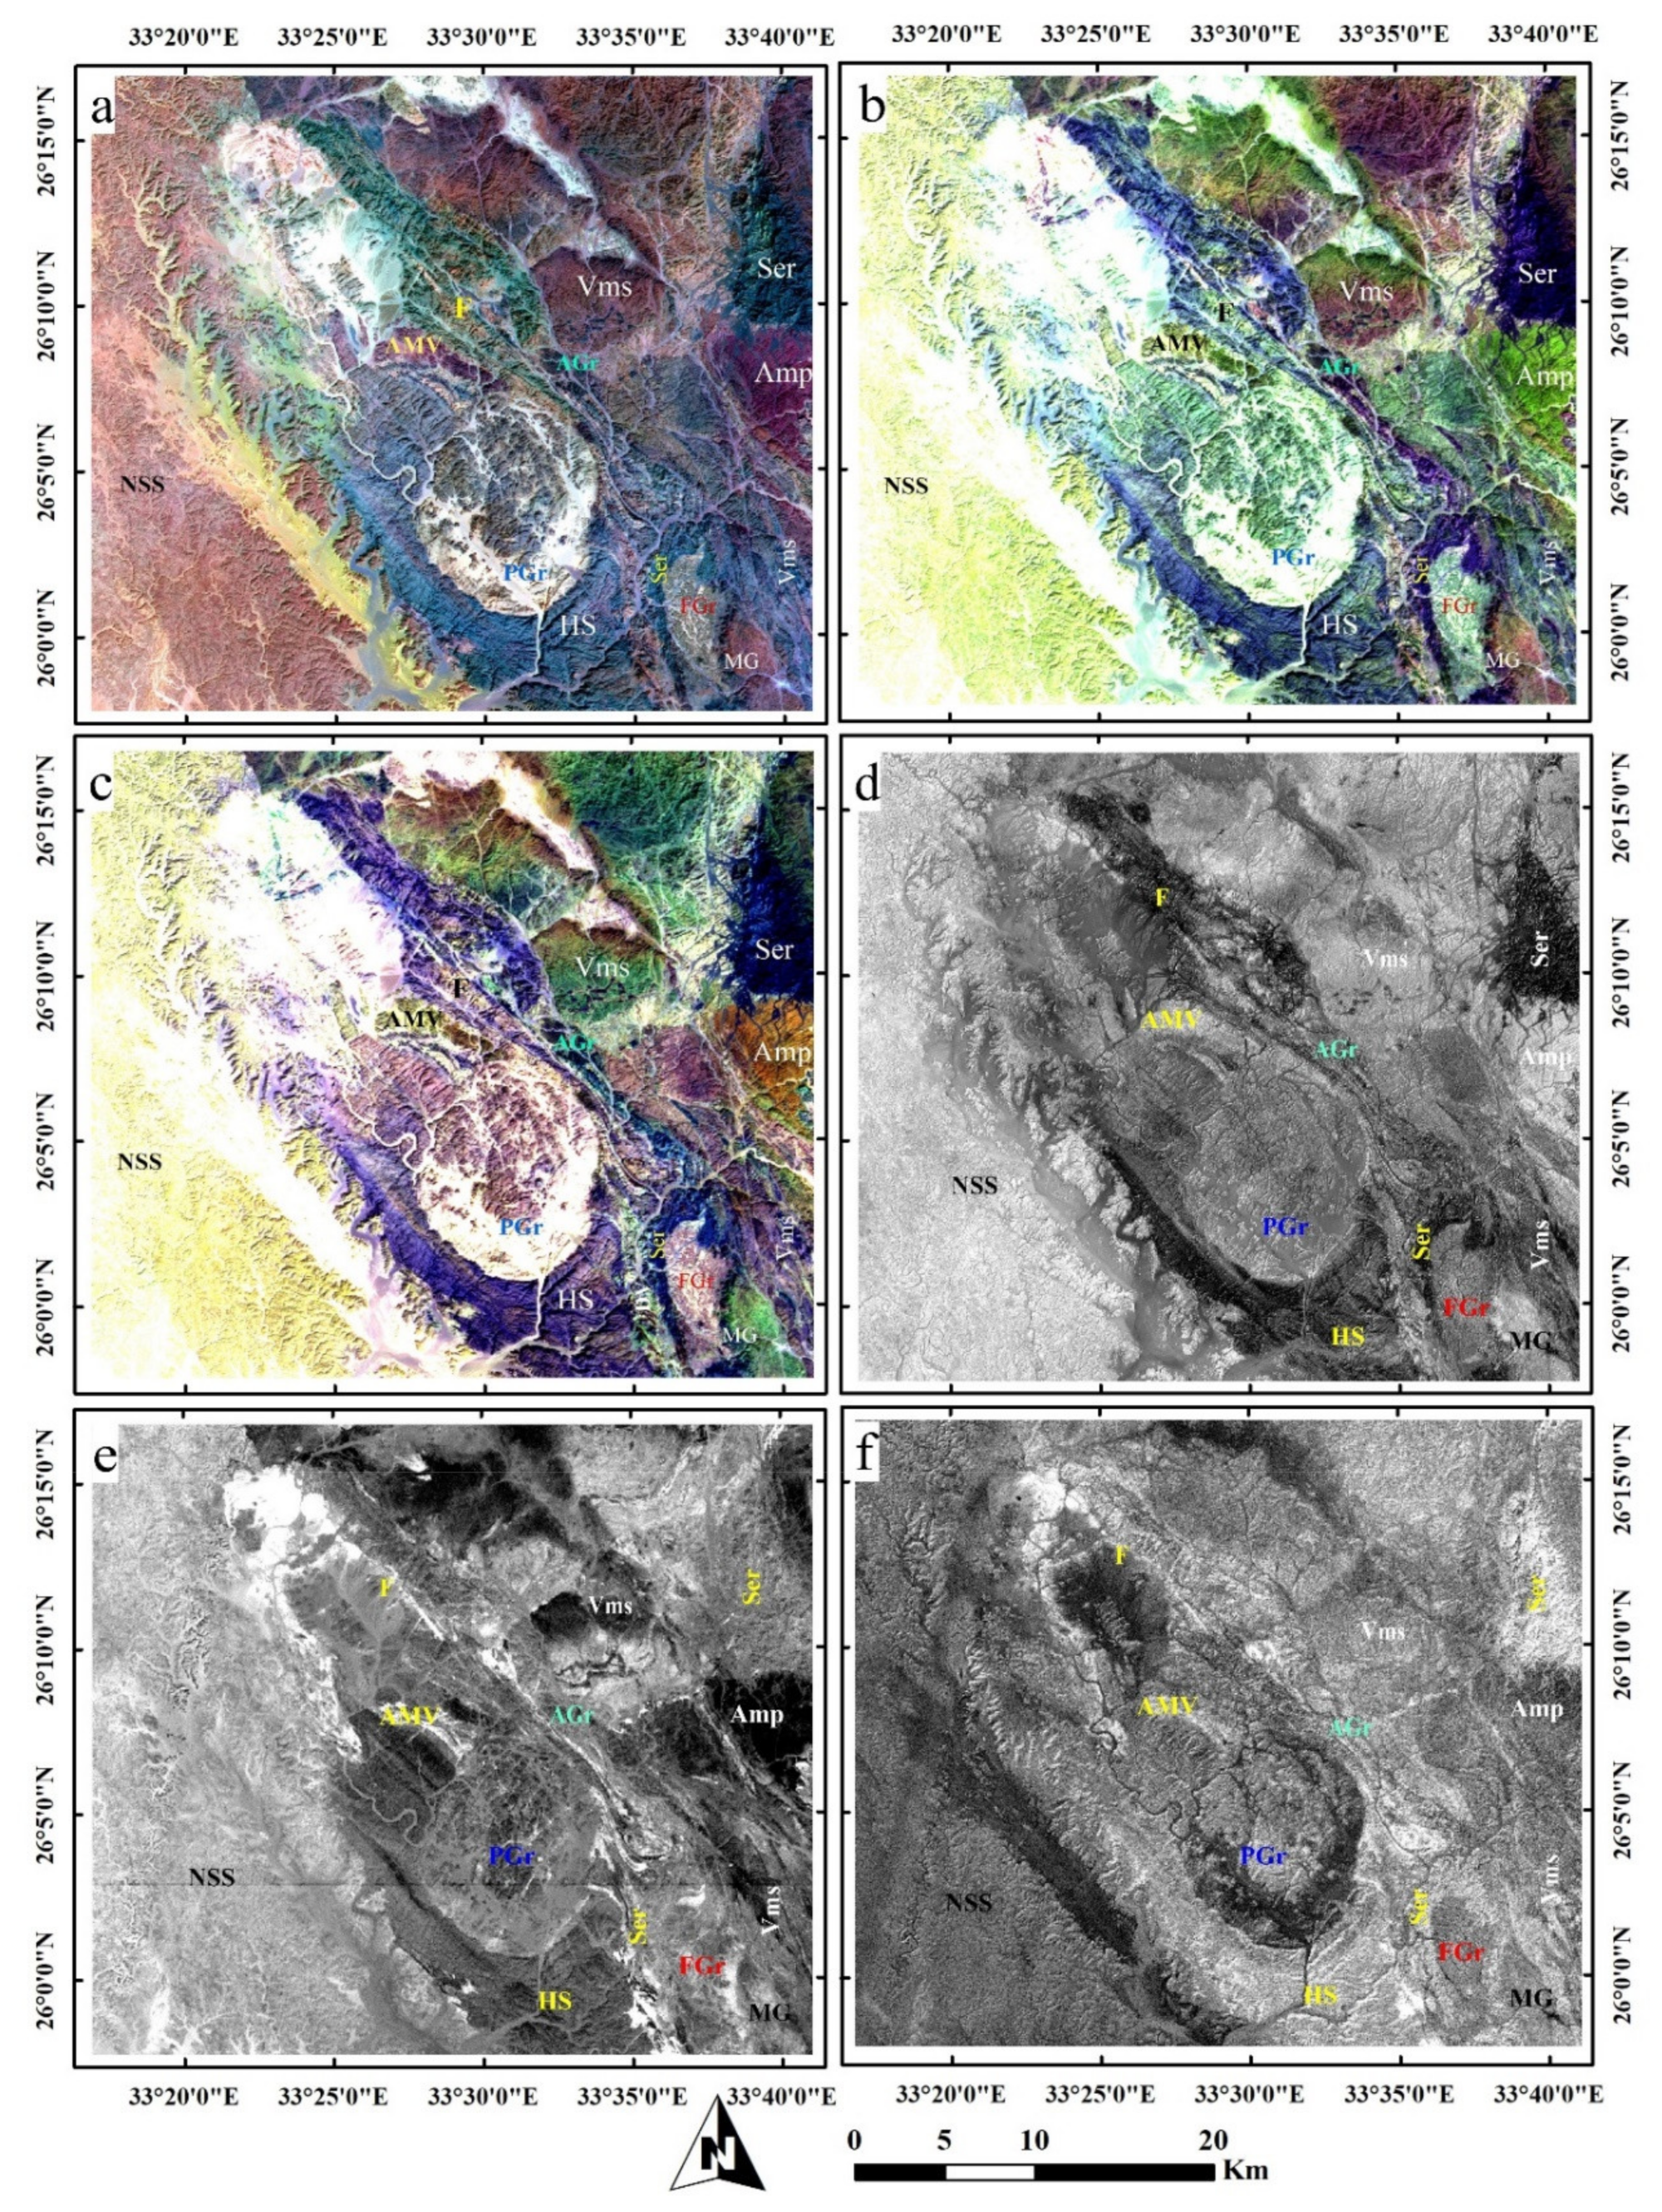
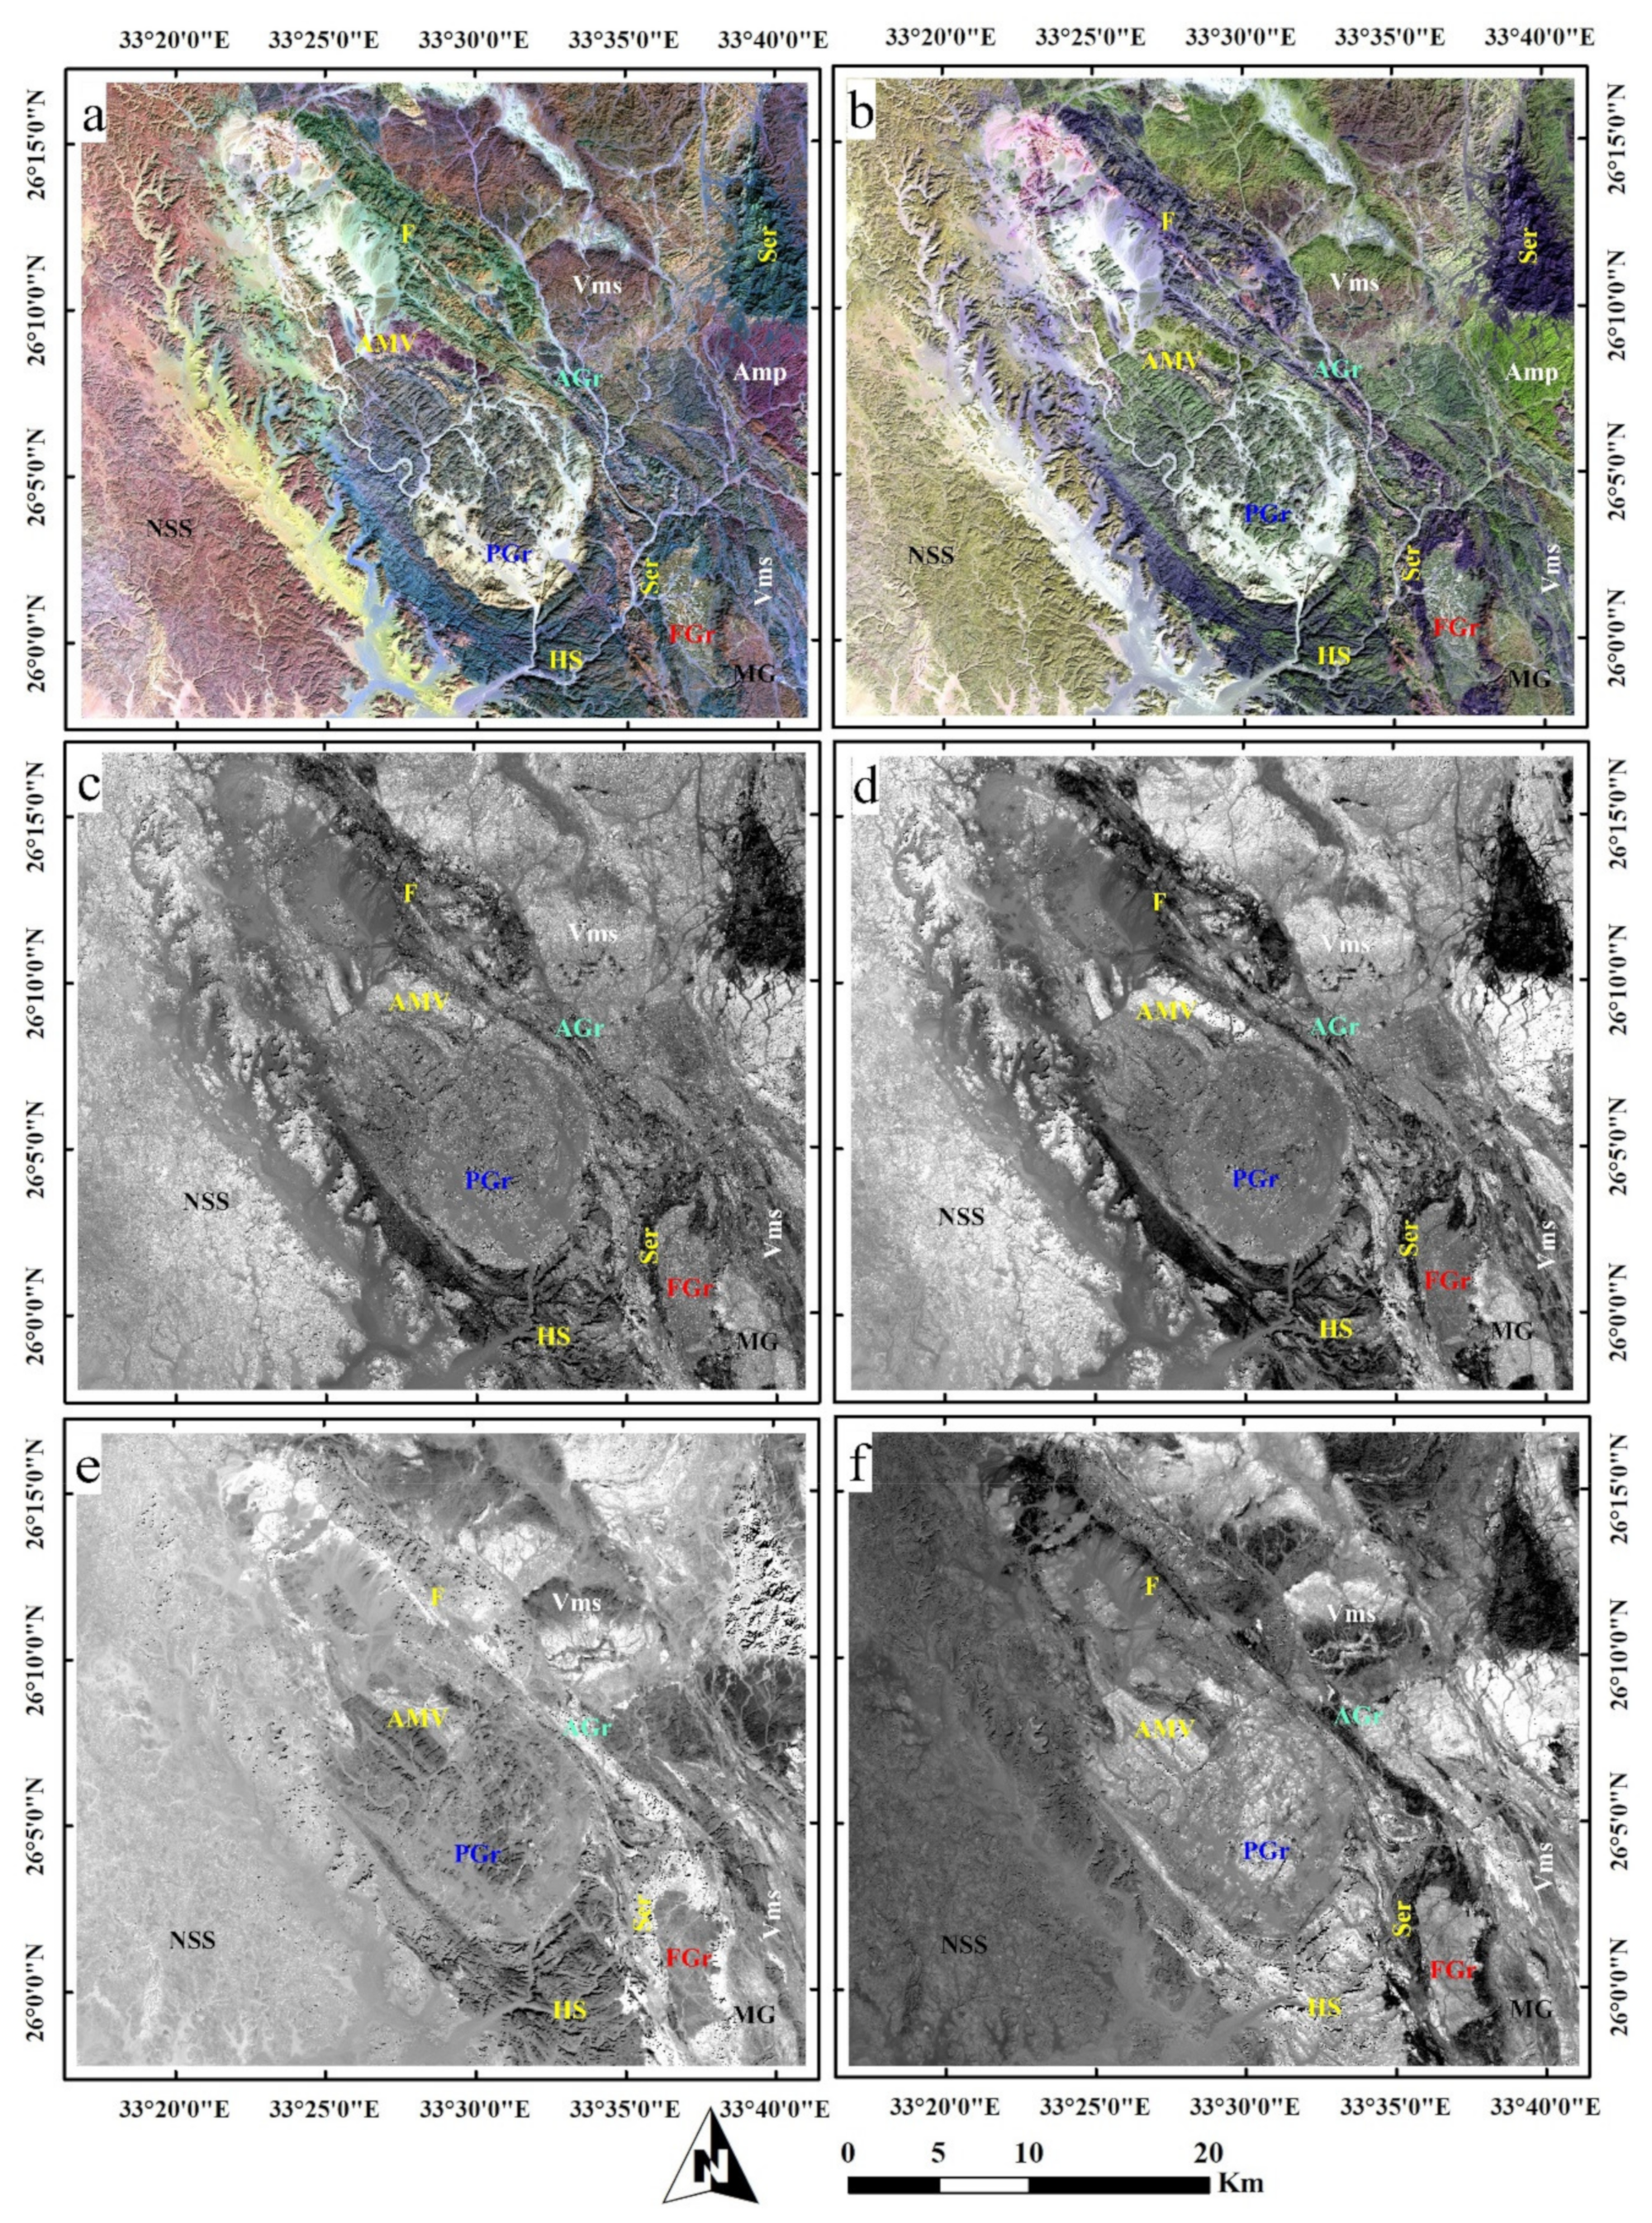
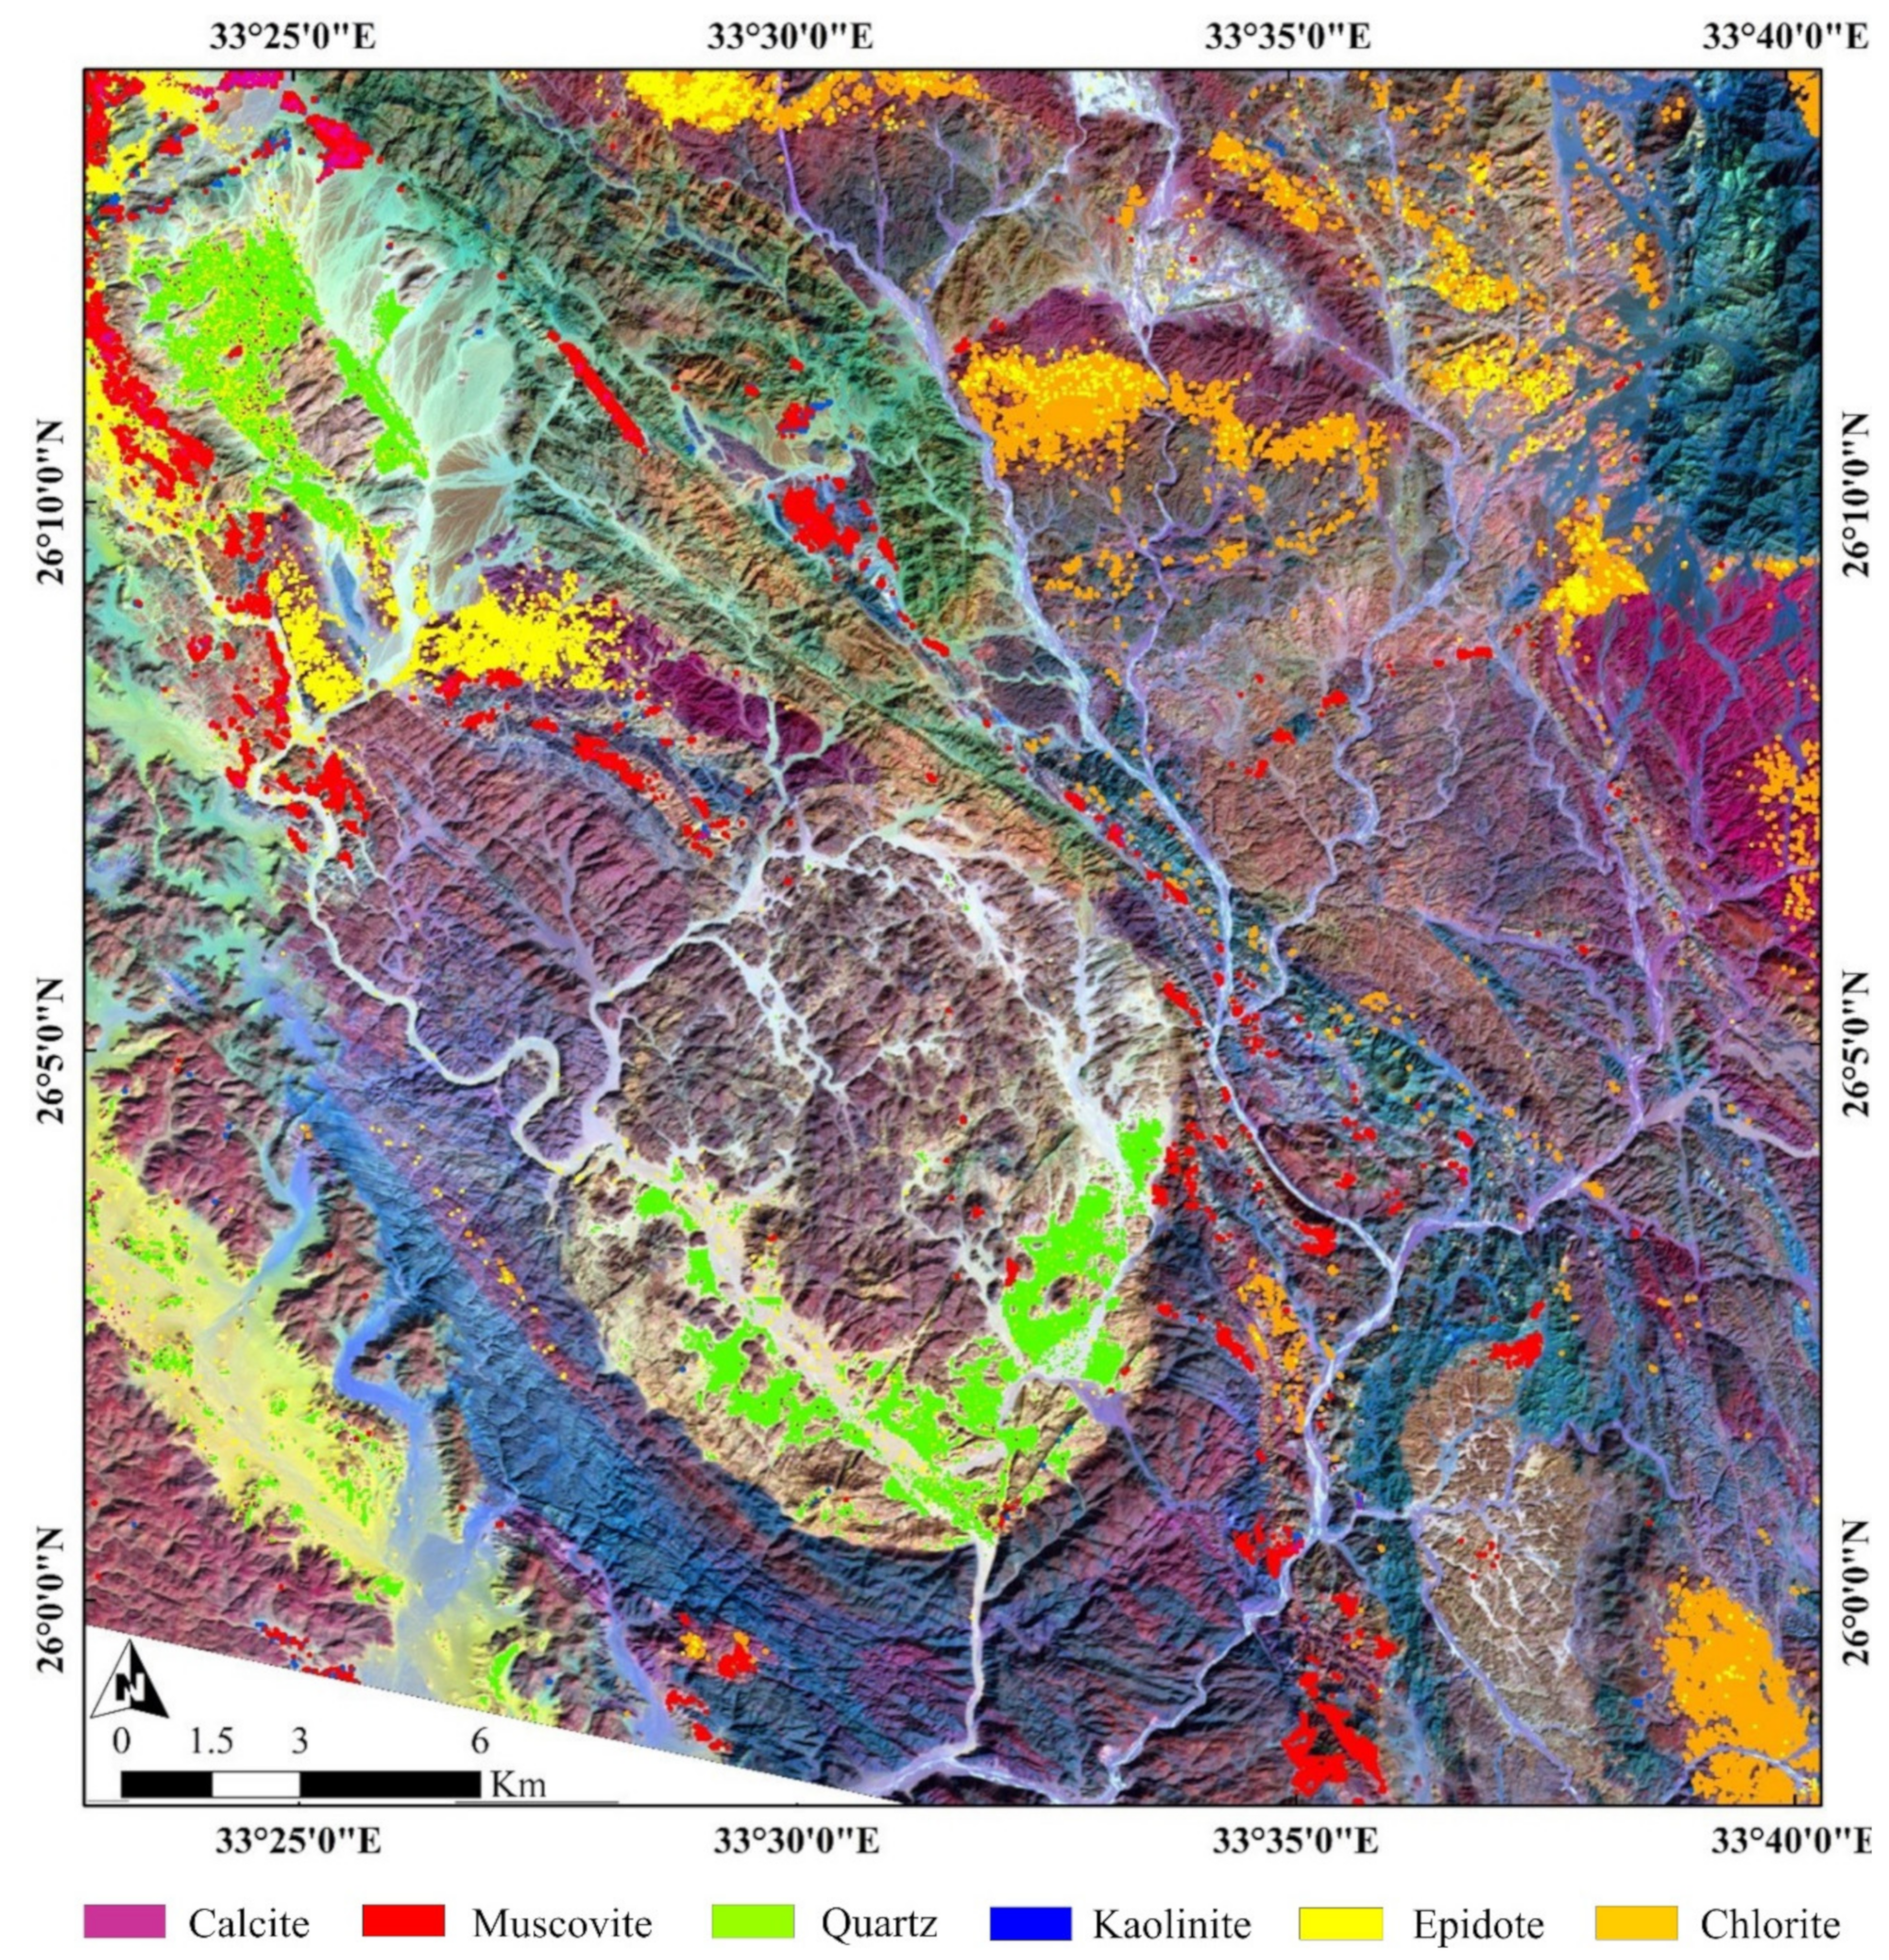
3.2. Analysis of Remote Sensing Data

The composite of ASTER bands 4, 3, and 2, respectively, in RGB manifest rocks enriched with ferromagnesian minerals by strong dark pixels, and the degree of pixel opacity decreases slightly for rocks with lower ferromagnesian content, as shown in Figure 6a. For instance, serpentinites (Ser) are obviously marked by dark pixels. Due to the approximately moderate Fe2O3/MgO content, amphibolites (Amp) and metagabbro are displayed in a dusky color, lesser in their density than that of serpentinites. On the other hand, Fawakhir granite and felsites (F) (poor in Fe2O3/MgO) have faint and pale colors. Moreover, Nubian sandstone is clearly separated by a reddish color at the western side of the study area. The unconformity surface between NSS and Precambrian rocks could be easily.
More closely to mineralization indicators, specific band ratios were applied to ASTER data to map surface hydrothermal alteration zones within the study area. Gossan is delineated as bright pixels using the b4/b2 ASTER band ratio (Figure 6d), predominating over the Atalla area and its surroundings of tectonized schists, Fawkhir serpentinites, and Nubian sandstone. The advanced argillic alteration has been mapped using b4/b6 ratio and demarcated. For mapping Al2O3-rich rocks, the combination of ASTER bands 4, 7, and 3 (RGB) is applied (Figure 6b). Serpentinites and rocks that have lower Al2O3 content are recognized as dark-colored pixels, whereas moderate and higher Al2O3 content rocks (granites and amphibolites) have greenish colors, varying in their degree depending on the aluminosilicate mineral contents. RGB of ASTER b7, b4, and b3 clearly discriminates the rock units of the study area (Figure 6c). Fawakhir granite (FGr), post-tectonic granite (PGr), and Atalla granite (AGr) are clearly differentiated (lighter) from their surroundings (darker). is shown as very bright pixels (Figure 6e). Through the b5/b6 ratio, areas affected by argillic-phyllic alteration were mapped as bright pixels (Figure 6f). The results also show a considered prevalence over volcaniclastic metasediments at the southern part of the study area. The results from ASTER b4/b9 ratio (Figure 7a) enhance carbonates and minerals containing hydroxyl in bright colors and are particularly analogous to the advanced argillic alteration map. Rocks rich in chlorite-epidote-calcite are mapped via RBD (b7 + b9)/(b8), as seen in Figure 7b.Depending on eigenvector loadings, DPCA of b1, b2, and b4 was performed to highlight areas enriched with iron oxides/hydroxides and is represented by the second principal component (Figure 7c) due to higher reflection in band 4 compared to absorptions in band 1, and band 2 (Table 2a), which is the case for iron oxides in ASTER data [27]. DPCA of b4, b5, and b6 focuses on argillic alteration zones, as displayed by the second principal component (Figure 7d). Argillic alteration constituents (mostly kaolinite and alunite) show considered reflection at band 4 compared to strong absorption at bands 5 and 6 due to AL-OH (Table 2b). Similarly, the propylitic (mostly epidote, chlorite, and calcite) alteration zone is represented by the third principal component (Table 2) of RGB b7, b8, and b9 (Figure 7e). Iron oxides/hydroxides (red), argillic (green), and propylitic (blue) alteration zones are combined, respectively, as shown in Figure 7f.
Due to its higher spectral and spatial characteristics, Sentinel 2 data deliver reasonable discrimination besides confirming ASTER results. In RGB, respectively, b11, b8, and b2 combination enhances rocks enriched with Fe2O3/MgO in a dark color, and thus clearly separate serpentinites and metagabbro from other lithologies (Figure 8a). Granitic rocks, felsites, and acidic metavolcanics mostly have light brown colors. Al2O3-rich lithologies are recognized by green colors in b11, b12, and b7 RGB composite (Figure 8b); thus, granites, amphibolites, felsites, and metavolcanics are displayed in green color, varying in intensity depending on the composition of these various lithologies; however, serpentinites are still reflected as dark pixels due to the lower content of Al2O3. The band ratio of (b11/b4) is implemented to highlight gossan zones (Figure 8c) and show reasonable matching with the ASTER (b4/b2) result (Figure 6d), even in highlighting Nubian sandstone. Lithologies that have a higher content of ferric oxide (Figure 8d), hydroxyl alteration (Figure 8e), and ferrous silicates (Figure 8f) are clearly mapped as bright pixels using b11/b8a, b11/12, and b12/b11 of sentinel data, respectively.
Hydroxyl-bearing minerals are distinguished as bright pixels (b11/b12) or dark pixels (b12/b11); the results coincided with that of ASTER data (Figure 7a) but with higher discrimination due to better spectral characteristics of S2 data. These ratios also identified the propitious mineralized zones as an invaded pathway, and it could be noticed that the structural trend (NW-SE) is completely marked as a hydroxyl-bearing area. This could be considered a piece of evidence for gold potentiality along all of these fractures. This is confirmed by the presence of suitable geological (granites, felsites, and metavolcanics), structural (shear zones, thrusts, joints, and other linear features), and geophysical conditions, required for zones of higher potentiality for mineralization.
The CEM technique employs a finite impulse response (FIR) filter to concentrate on the required target with simultaneous minimization of the background effect. Moreover, it was applied to detect alteration minerals for a part of the southern side of the study area and delivers potential results [29]. In this study, the CEM spectral mapping method was applied to ASTER bands to detect calcite, muscovite, quartz, kaolinite, epidote, and chlorite minerals with reference to the USGS spectral library. The distribution of these minerals is dropped over sentinel 2 FCC, RGB b11, b8, and b2, pan-sharpened with ALOS PRISM nadir image (2.5 m pixel size). The latter gives a closer view of the rock units, structures, and alteration minerals (Figure 9). The results of CEM strongly support the potential zones observed by the previous techniques. Thus, various remote sensing datasets (ASTER and Sentinel 2) and different specified techniques strongly nominated five zones as mineralized zones.
On the other side, results of lineament analysis show that the predominant trends are NW-SE and NE-SW. The NW-SE trend is feasibly seen from all the data sets and sometimes from the alignment of alteration minerals on remote sensing data (Figure 8e,f). Moreover, several quartz veins, linear features, and the Atalla sinistral shear zone have a prominent NW-SE trend. Thus, we strongly believe that mineralization is mainly controlled by the NW-SE trend; however, the NE-SW trend is also represented. A lineament density map was created to better visualize the result and display higher dissected areas (Figure 10). Supporting the image analysis findings, the density map also shows higher density regions trending mostly as NW-SE; this, in turn, could be one of the required pillars boosting the possible existence of mineralizations at these locations.

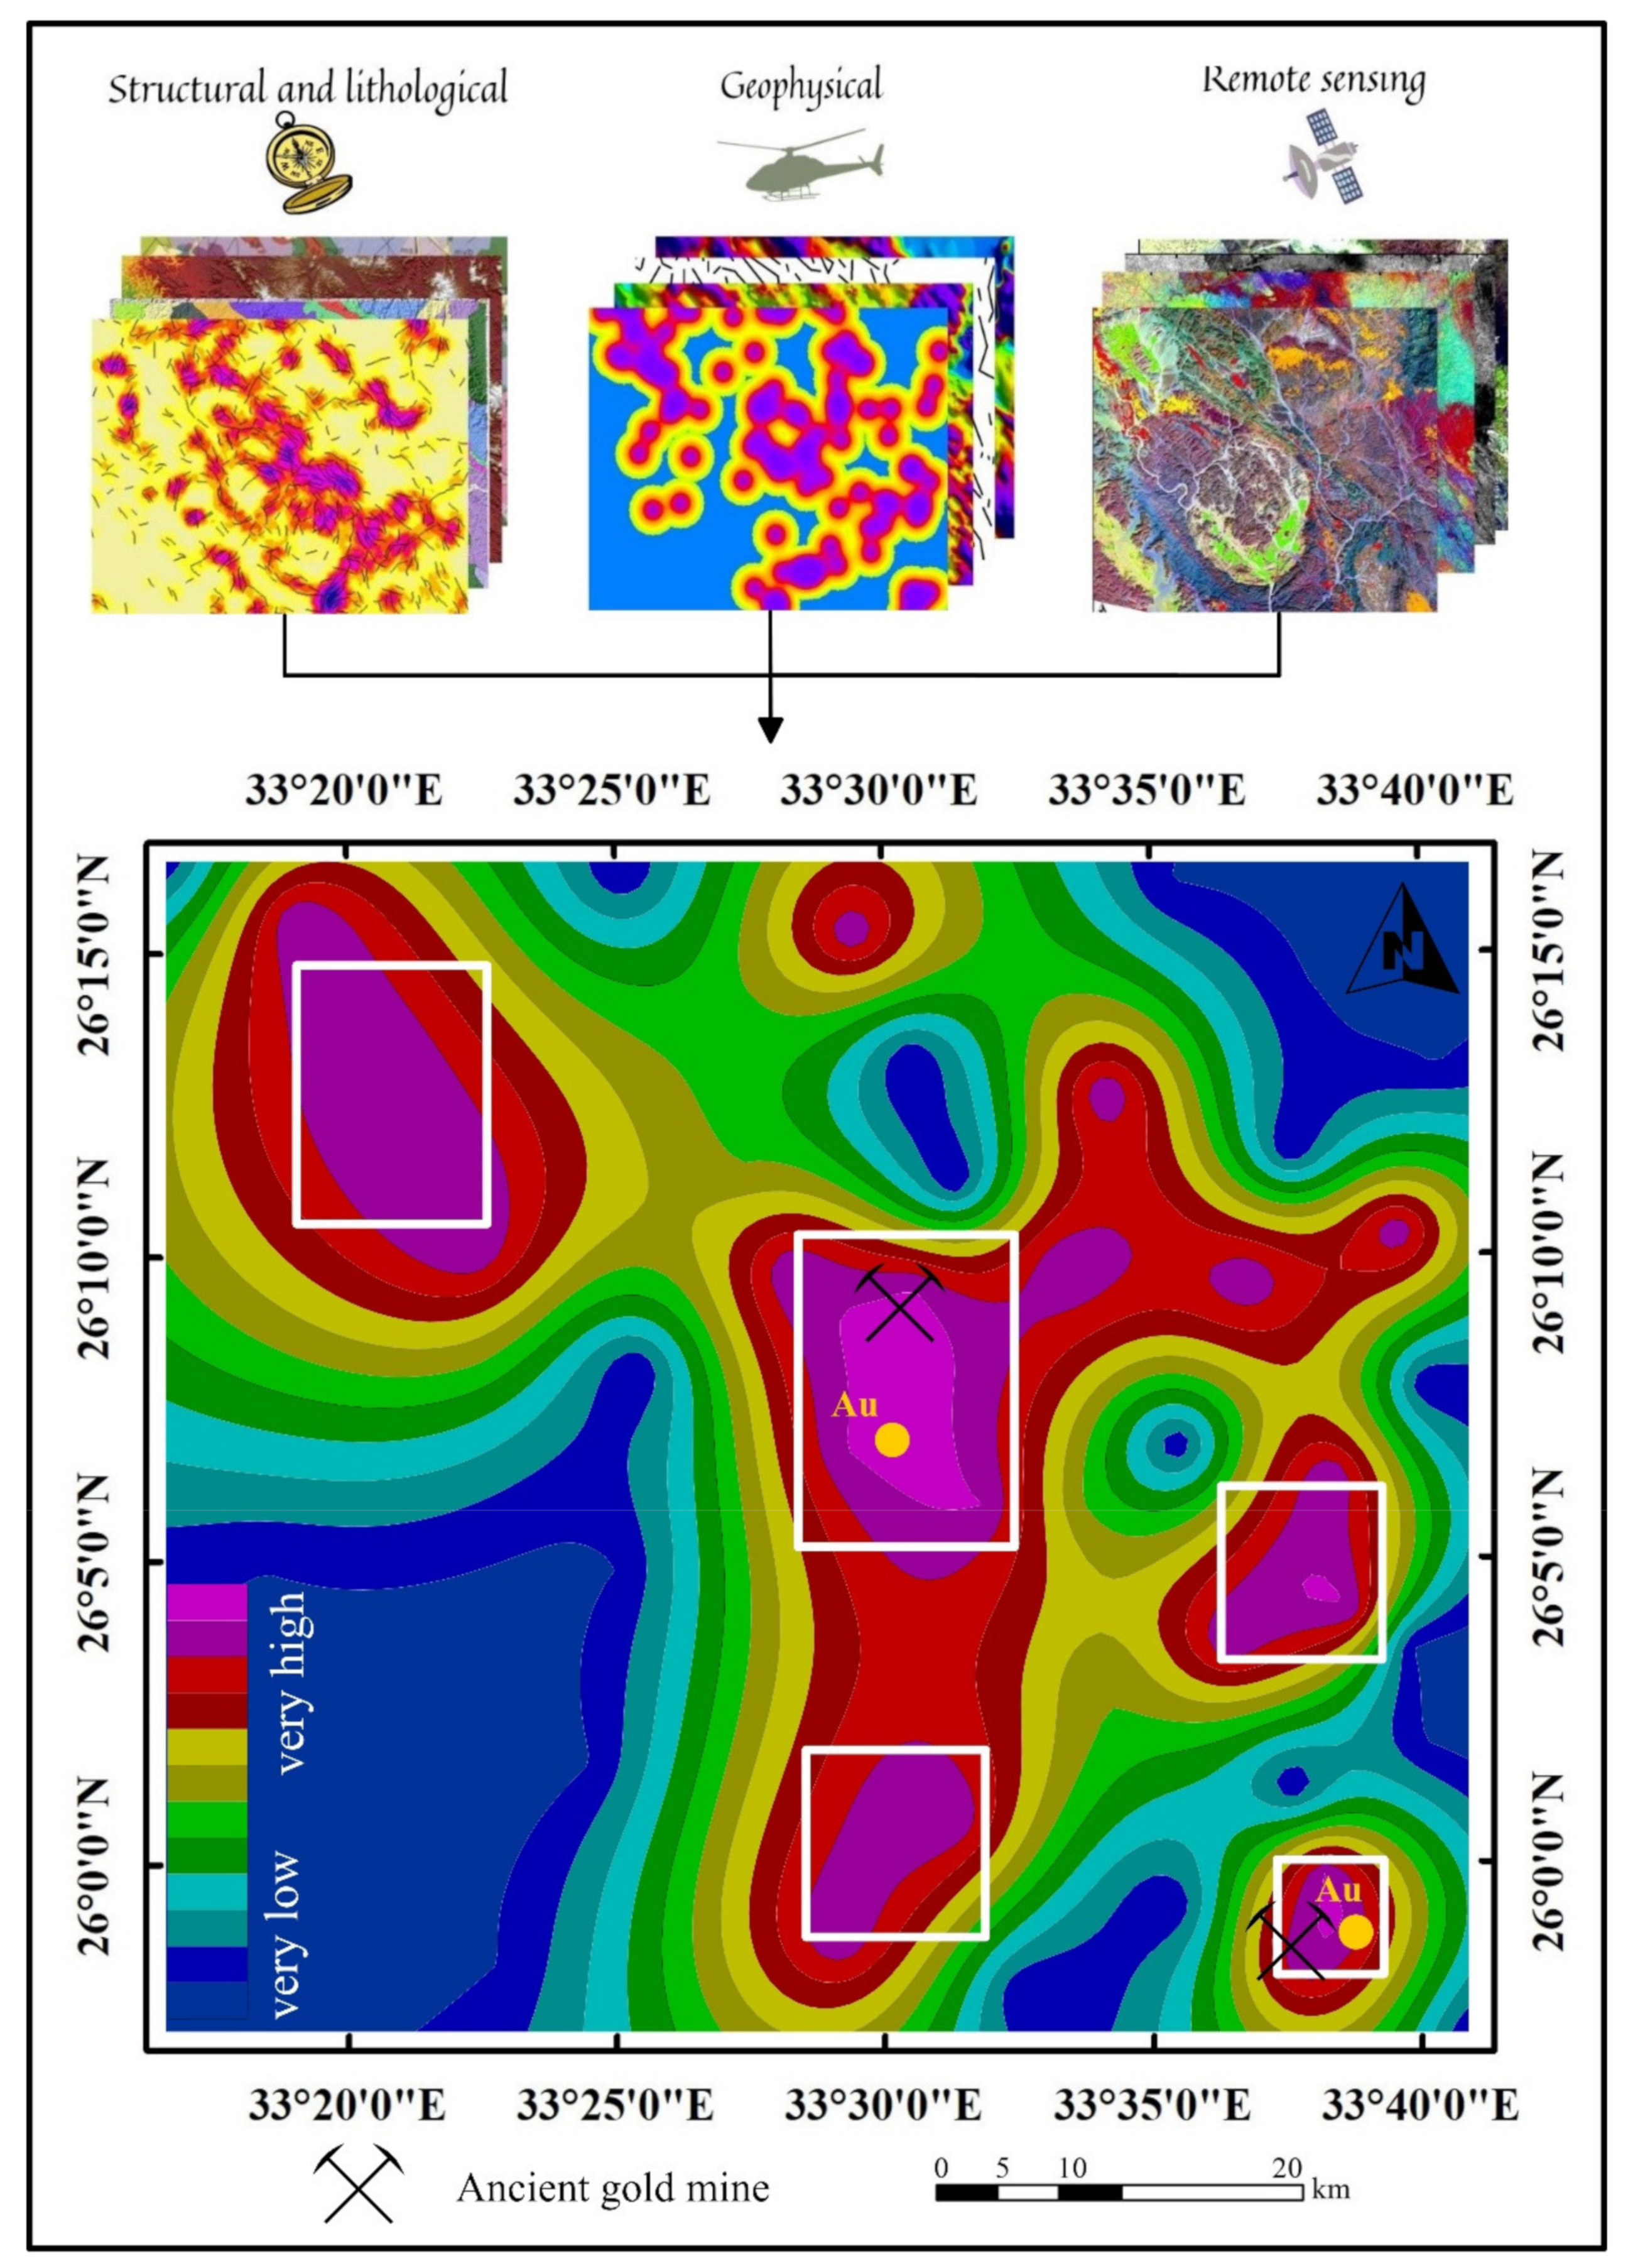
4. Data Integration and Validation

Favorable mineralized zones are mostly controlled by a structural regime and associated with one or more alteration types. Thus, aeromagnetic, gamma-ray, ASTER, and Sentinel 2 data sets were integrated to outline the controlling structural regime and the common alteration zones to finalize the findings by constructing a gold potentiality map for the study area. The linear elements derived from geophysical data were harmonized with remote sensing outputs. The results showed that the area has been affected by several tectonic trends arranged as NW-SE, NE-SW, N-S, and E-W according to their importance. The NW-SE structural trend is the common controlling trend for gold deposits; however, NE-SW was locally represented. These trends seem to reasonably coincide with previous studies [14,30]. Considerable matching is also evident between lineament density heat maps from both sources (geophysical and remote sensing). Primitive discrimination of hydrothermally altered zones has been performed by spectrometric gamma-ray, then confirmed and specified using remote sensing methods to argillic, advanced argillic, phyllic, and propylitic alteration, as well as manifesting areas enriched by gossan, ferric oxide, hydroxyl, and ferrous silicates. Toward a weighted overlay analysis, all the findings were manipulated as layers in a GIS environment and each layer (lineaments, density heat maps, and alteration type) was given the same value (weight) without any preferences because they have approximately the same importance in defining the target. Consequently, highly weighted values are assumed to be the collective representation of structural complexity and alteration zones, which strongly indicate the favorable mineralized sites, and vice-versa. The results are displayed as a gold potentiality map. The GPM strongly protrudes the central part of the study area as a promising sector. It is confirmed by both field checks (Figure 11) and the locations of two ancient gold mines. This, in turn, manifests the efficient role of the utilized combined datasets in robust recommendations for expected zones of mineralization. This integrated approach suggests five high-potential zones convenient for mineral emplacement and occurring within Gabal Atalla, north Gabal Atalla, east Wadi Atalla, south Gabal Um Had, and El Fawakhir. Two zones are already confirmed as gold mines. Accordingly, the study strongly recommends the other three highlighted sites (Figure 12) as promising zones for gold mineralization.

5. Conclusions

Cross-linking geophysical and remote sensing data sets successfully localized gold mineralization within the study area. The study concludes the following:
  • The enrichment of gold mineralization is largely controlled by the weakness zones in a NW-SE trend, which forms the pathway of hydrothermal fluids.
  • The interrelated datasets conclude three potential zones that need further investigation to assign their economic potential. These nominated zones have the same criteria and weight as the already confirmed gold mines within the study area.
  • The combined geophysical and remote sensing data sets proved their efficacy in delivering a low-cost reliable exploration.

Author Contributions

Conceptualization, A.S. and M.A.; methodology, A.S. and M.A.; software, A.S. and M.A.; validation, A.S., M.A., Á.C. and S.O.E.; formal analysis, M.A.; investigation, A.S., M.A., Á.C. and S.O.E.; resources, A.S., M.A., and Á.C.; data curation, A.S. and M.A.; writing—original draft preparation, A.S. and M.A.; writing—review and editing, A.S., M.A., Á.C. and S.O.E.; visualization, A.S. and M.A.; supervision, Á.C. All authors have read and agreed to the published version of the manuscript.

Funding

This research received no external funding.

Institutional Review Board Statement

Not applicable.

Informed Consent Statement

Not applicable.

Data Availability Statement

The data presented in this study are available on request from the corresponding author.

Acknowledgments

The authors would like to express their gratitude to Gamal Abdelhamid (Geology department—South Valley University) and geologist Ahmed Rady for helping in fieldwork. The authors are thankful to the U.S. Geological Survey, and European Space Agency (ESA) for providing the data. Special thanks to Mahmoud Ashmawy, Mohamed Abd Elwahed and Samir Kamh (Tanta University, Egypt) for their kind support. The authors deeply thank David Lentz (University of New Brunswick, Canada) for his comments and enhancing the English language. The authors also appreciate the referee’s valuable and profound comments. Many thanks to the University of Debrecen.

Conflicts of Interest

The authors declare no conflict of interest.

References

  1. Telford, W.M.; Geldart, L.P.; Sheriff, R.E. Applied Geophysics, 2nd ed.; Cambridge University Press: Cambridge, UK, 1990. [Google Scholar]
  2. Holden, E.J.; Dentith, M.; Kovesi, P. Towards the automated analysis of regional aeromagnetic data to identify regions prospective for gold deposits. Comput. Geosci. 2008, 34, 1505–1513. [Google Scholar] [CrossRef]
  3. Cordell, L.; Grauch, V.I.S. Mapping basement magnetitation zones from aeromagnetic data in the san juan basin, New Mexico. In Proceedings of the 1982 SEG Annual Meeting, Dallas, TX, USA, 17–21 October 1982; Society of Exploration Geophysicists: Tulsa, OK, USA, 1982; pp. 246–247. [Google Scholar]
  4. Miller, H.G.; Singh, V. Potential field tilt-a new concept for location of potential field sources. J. Appl. Geophys. 1994, 32, 213–217. [Google Scholar] [CrossRef]
  5. Cooper, G.R.J. Feature detection using sun shading. Comput. Geosci. 2003, 29, 941–948. [Google Scholar] [CrossRef]
  6. Wijns, C.; Perez, C.; Kowalczyk, P. Theta map: Edge detection in magnetic data. Geophysics 2005, 70, 1JA-Z68. [Google Scholar] [CrossRef]
  7. Youssef, M.A.S.; Elkhodary, S.T. Utilization of airborne gamma ray spectrometric data for geological mapping, radioactive mineral exploration and environmental monitoring of southeastern Aswan city, South Eastern Desert, Egypt. Geophys. J. Int. 2013, 195, 1689–1700. [Google Scholar] [CrossRef] [Green Version]
  8. Patra, I.; Veldi, R.B. High-resolution Airborne Gamma-ray Spectrometric Data in Geological Mapping-A Case Study from Parts of Shillong Basin, Meghalaya. J. Geophys. 2016, XXXVII, 173–178. [Google Scholar]
  9. Ahmadirouhani, R.; Karimpour, M.H.; Rahimi, B.; Malekzadeh-Shafaroudi, A.; Pour, A.B.; Pradhan, B. Integration of SPOT-5 and ASTER satellite data for structural tracing and hydrothermal alteration mineral mapping: Implications for Cu–Au prospecting. Int. J. Image Data Fusion 2018, 9, 237–262. [Google Scholar] [CrossRef]
  10. Pour, A.B.; Hashim, M.; Hong, J.K.; Park, Y. Lithological and alteration mineral mapping in poorly exposed lithologies using Landsat-8 and ASTER satellite data: North-eastern Graham Land, Antarctic Peninsula. Ore Geol. Rev. 2019, 108, 112–133. [Google Scholar] [CrossRef]
  11. Van der Werff, H.; van der Meer, F. Sentinel-2A MSI and Landsat 8 OLI Provide Data Continuity for Geological Remote Sensing. Remote Sens. 2016, 8, 883. [Google Scholar] [CrossRef] [Green Version]
  12. Zoheir, B.; El-Wahed, M.A.; Pour, A.B.; Abdelnasser, A. Orogenic gold in transpression and transtension zones: Field and remote sensing studies of the barramiya—mueilha sector, Egypt. Remote Sens. 2019, 11, 2122. [Google Scholar] [CrossRef] [Green Version]
  13. Hunt, G.R.; Ashley, R.P. Spectra of altered rocks in the visible and near infrared. Econ. Geol. 1979, 74, 1613–1629. [Google Scholar] [CrossRef]
  14. Hamimi, Z.; Hagag, W.; Kamh, S.; El-Araby, A. Application of remote-sensing techniques in geological and structural mapping of Atalla Shear Zone and Environs, Central Eastern Desert, Egypt. Arab. J. Geosci. 2020, 13. [Google Scholar] [CrossRef]
  15. Abd el Monsef, M. Ore Controls and Metallogenesis of Au-Ag Deposits at Atalla Mine, Central Eastern Desert of Egypt. Acta Geol. Sin.English Ed. 2020, 94, 1451–1470. [Google Scholar] [CrossRef]
  16. CONOCO (Continental Oil Company). Geological map of Egypt (Scale 1: 500,000); CONOCO Inc.: Ogden, UT, USA, 1987; in Collaboration with Freie Universitat Berlin, Berlin, Germany. [Google Scholar]
  17. Spector, A.; Grant, F.S. Statistical models for interpreting aeromagnetic data. Geophysics 1970, 35, 293–302. [Google Scholar] [CrossRef]
  18. Moxham, R.M.; Foote, R.S.; Bunker, C.M. Gamma-ray spectrometer studies of hydro-thermally altered rocks. Econ. Geol. 1965, 60, 653–671. [Google Scholar] [CrossRef]
  19. Shives, R.B.K.; Charbonneau, B.W.; Ford, K.L. The detection of potassic alteration by gamma-ray spectrometry—Recognition of alteration related to mineralization. Geophysics 2000, 65, 2001–2011. [Google Scholar] [CrossRef] [Green Version]
  20. Saunders, D.F.; Terry, S.A.; Thompson, C.K. Test of National Uranium Resource Evaluation gamma-ray spectral data in petroleum reconnaissance (Texas). Geophysics 1987, 52, 1547–1556. [Google Scholar] [CrossRef]
  21. César, A.; Pires, B. IDENTIFICAÇÃO GEOFÍSICA DE ÁREAS DE ALTERAÇÃO HIDROTERMAL, CRIXÁS-GUARINOS, GOIÁS. Braz. J. Geol. 2017, 25, 61–68. [Google Scholar]
  22. Yamaguchi, Y.; Fujisada, H.; Tsu, H.; Sato, I.; Watanabe, H.; Kato, M.; Kudoh, M.; Kahle, A.B.; Pniel, M. ASTER early image evaluation. Adv. Sp. Res. 2001, 28, 69–76. [Google Scholar] [CrossRef]
  23. Drusch, M.; Del Bello, U.; Carlier, S.; Colin, O.; Fernandez, V.; Gascon, F.; Hoersch, B.; Isola, C.; Laberinti, P.; Martimort, P. Sentinel-2: ESA’s optical high-resolution mission for GMES operational services. Remote Sens. Environ. 2012, 120, 25–36. [Google Scholar] [CrossRef]
  24. Abd El-Wahed, M.; Kamh, S.; Ashmawy, M.; Shebl, A. Transpressive Structures in the Ghadir Shear Belt, Eastern Desert, Egypt: Evidence for Partitioning of Oblique Convergence in the Arabian-Nubian Shield during Gondwana Agglutination. Acta Geol. Sin. English Ed. 2019, 93, 1614–1646. [Google Scholar] [CrossRef]
  25. Manuel, R.; Brito, M.D.G.; Chichorro, M.; Rosa, C. Remote sensing for mineral exploration in central Portugal. Minerals 2017, 7, 184. [Google Scholar] [CrossRef] [Green Version]
  26. Pour, A.B.; Park, T.Y.S.; Park, Y.; Hong, J.K.; Zoheir, B.; Pradhan, B.; Ayoobi, I.; Hashim, M. Application of multi-sensor satellite data for exploration of Zn-Pb sulfide mineralization in the Franklinian Basin, North Greenland. Remote Sens. 2018, 10, 1186. [Google Scholar] [CrossRef] [Green Version]
  27. Noori, L.; Pour, A.B.; Askari, G.; Taghipour, N.; Pradhan, B.; Lee, C.W.; Honarmand, M. Comparison of different algorithms to map hydrothermal alteration zones using ASTER remote sensing data for polymetallic Vein-Type ore exploration: Toroud-Chahshirin Magmatic Belt (TCMB), north Iran. Remote Sens. 2019, 11, 495. [Google Scholar] [CrossRef] [Green Version]
  28. Masoud, A.; Koike, K. Applicability of computer-aided comprehensive tool (LINDA: LINeament Detection and Analysis) and shaded digital elevation model for characterizing and interpreting morphotectonic features from lineaments. Comput. Geosci. 2017, 106, 89–100. [Google Scholar] [CrossRef]
  29. El-Magd, I.A.; Mohy, H.; Basta, F. Application of remote sensing for gold exploration in the Fawakhir area, Central Eastern Desert of Egypt. Arab. J. Geosci. 2015, 8, 3523–3536. [Google Scholar] [CrossRef]
  30. Elkhateeb, S.O.; Abdellatif, M.A.G. Delineation potential gold mineralization zones in a part of Central Eastern Desert, Egypt using Airborne Magnetic and Radiometric data. NRIAG J. Astron. Geophys. 2018, 7, 361–376. [Google Scholar] [CrossRef] [Green Version]
Figure 1. Location and geological map of the study area, (modified after Conoco (1987) [16]).
Minerals 11 00641 g001
Figure 2. Flowchart methodology adopted in the current study.
Minerals 11 00641 g002
Figure 3. (a) Total magnetic intensity map, and (b) reduction to pole map.
Minerals 11 00641 g003
Figure 4. CET results: (a) standard deviation, (b) phase symmetry, (c) generated automated lineaments, and (d) entropy heat map.
Minerals 11 00641 g004
Figure 5. Spectrometric gamma-ray results: (a) potassium concentration, (b) thorium concentration, (c) thorium–potassium ratio map, and (d) kd anomalies map.
Minerals 11 00641 g005
Figure 6. Lithological discrimination via (a) RGB b4, b3, and b1; (b)RGB b4, b7, and b3; and (c) RGB b7, b4, and b3 ASTER FCCs. ASTER band ratios of (d) (4/2), (e) (4/6), and (f) (5/6) for mapping gossan, advanced argillic, and argillic-phyllic alteration as bright pixels, respectively.
Minerals 11 00641 g006
Figure 7. Allocation of (a) hydroxyl-bearing minerals (BR 4/9), (b) chlorite-calcite-epidote (RBD (7 + 9)/8), (c) oxide/hydroxide minerals (DPC2), (d) argillic alteration (DPC2), (e) propylitic alteration (DPC3) as a bright pixels of ASTER data. (f)FCC of (ce) images, respectively, in RGB.
Minerals 11 00641 g007
Figure 8. Lithological differentiation of ferromagnesian-rich rocks, and Al2O3-rich rocks using 10-m pixel size Sentinel 2 FCCs of (a) RGB b11, b8, b2 and (b) RGB b11, b12, b7, respectively. Sentinel 2 band ratios of (c) (11/4), (d) (11/8a), (e) (11/12), and (f) (12/11) distinguish lithologies or altered zones enriched by gossan, ferric oxide, hydroxyl, and ferrous silicate, respectively.
Minerals 11 00641 g008
Figure 9. CEM results (distribution of six minerals commonly associated with different types of alteration) over 2.5 m pan-sharpened Sentinel 2 FCC (RGB b11, b8, b2).
Minerals 11 00641 g009
Figure 10. Density map of lineaments extracted automatically from ASTER band 3.
Minerals 11 00641 g010
Figure 11. (a) Sharp contact between Atalla granite (right) and metavolcanics (left), (b) NW trending thrust contact between talc-carbonates (right) and metavolcanics (left), (c) sinistral sense of shearing marked by asymmetric delta-type quartz porphyroclast in granitic rocks, (d) mixed alteration minerals (kaolinite and sericite) binding a small-scale quartz vein, and (e) disseminated golden sulfides (e.g., pyrite) in milky white and grey quartz, in a hand specimen.
Minerals 11 00641 g011
Figure 12. Gold potentiality map (GPM) manifesting an outstanding match with ancient gold mines and highlighting three other promising zones.
Minerals 11 00641 g012
Table 1. Characteristics of the ASTER and Sentinel 2.
ASTERSentinel 2
Band (b)Central Wavelength (µm)Pixel Size (m)Band (b)Central Wavelength (µm)Pixel Size (m)
10.5601510.44360
20.6601520.49010
3N0.8201530.56010
3B0.8201540.66510
41.6503050.70420
52.1653060.74020
62.2053070.78220
72.2603080.84210
82.330308a0.86520
92.3953090.94560
101.37560
111.61020
122.19020
A cloud-free, S2A multispectral imager (MSI), L1C product was accessible through ESA. The scene was reprojected and radiometrically corrected using sen2cor processor in Sentinel Application Platform (SNAP). In our study, coastal (b1), water vapor (b9), and cirrus (b10) bands were excluded and the remaining VNIR and SWIR bands were resampled to 10-m pixel size. PRISM was on the board of Advanced Land Observing Satellite (ALOS) and has a nadir spatial resolution of 2.5m that enabled better discernment of rock units and structures.
Table 2. Eigenvector statistics of the utilized DPCA.
Iron Oxides/Hydroxides MineralsArgillic AlterationPropylitic Alteration
ABand 1Band 2Band 4BBand 4Band 5Band 6CBand 7Band 8Band 9
PC1−0.309−0.532−0.787PC10.5730.5800.578PC1−0.514−0.532−0.672
PC2−0.493−0.6180.611PC20.809−0.295−0.506PC2−0.491−0.4590.739
PC3−0.81290.577−0.0713PC30.122−0.7580.639PC3−0.7020.712−0.025
Publisher’s Note: MDPI stays neutral with regard to jurisdictional claims in published maps and institutional affiliations.

