Article

Depositional Environment and Genesis of the Nabeba Banded Iron Formation (BIF) in the Ivindo Basement Complex, Republic of the Congo: Perspective from Whole-Rock and Magnetite Geochemistry

1
School of Civil and Environmental Engineering, University of Science and Technology Beijing, Beijing 100083, China
2
Geological Engineering Department, University of Mines and Technology, Tarkwa P.O. Box 237, Ghana
3
French Geological Survey, BRGM, F-45060 Orléans, France
*
Author to whom correspondence should be addressed.
Minerals 2021, 11(6), 579; https://doi.org/10.3390/min11060579
Submission received: 12 April 2021 / Revised: 12 May 2021 / Accepted: 25 May 2021 / Published: 29 May 2021
(This article belongs to the Section Mineral Deposits)

Abstract

:
The Nabeba high-grade iron deposit (Republic of the Congo) is hosted by banded iron formation (BIF) in the Ivindo Basement Complex, which lies in the northwestern part of the Congo Craton. The Nabeba BIF is intercalated with chlorite-sericite-quartz schist and comprises two facies (oxide and a carbonate-oxide). In this study, whole-rock and LA-ICP-MS magnetite geochemistry of the BIF was reported. Magnetite samples from both BIF facies had fairly similar trace element compositions except for the rare earth element plus yttrium (REE + Y) distribution patterns. The high V, Ni, Cr, and Mg contents of the magnetite in the Nabeba BIF could be ascribed to the involvement of external medium-high temperature hydrothermal fluids during their deposition in relatively reduced environment. The Post-Archean Australian Shale (PAAS)-normalized REY patterns of the Nabeba BIF magnetite were characterized by LREE depletion coupled with varying La and positive Eu anomalies. Processing of the information gathered from the geochemical signatures of magnetite and the whole-rock BIF suggested that the Nabeba BIF was formed by the mixing of predominantly anoxic seawater (99.9%) with 0.1% of high-temperature (>250 °C) hydrothermal vent fluids, similar to the formation mechanism of many Archean Algoma-type BIFs reported elsewhere in the world.

1. Introduction

Algoma-type banded iron formations (BIFs) are increasingly explored and studied due to their rich endowments of iron (e.g., the Águas Claras and Pico Mine, Brazil; [1]) and gold (e.g., the Meliadine, Canada; [2]). In addition to their economic significance, BIFs have immense scientific value in understanding the Precambrian hydrosphere, biosphere, and atmosphere [3,4,5,6,7]. BIFs are chemical sedimentary rocks by definition and comprise alternating chert- and iron-rich (≥15% Fe) layers [8,9,10]. These rocks are associated with Archean to Paleoproterozoic volcano-sedimentary sequences in greenstone belts associated with back-arc or intra-arc basin setting.
The northwestern margin of the Congo Craton extends from Cameroon southward through northern Gabon to the northwestern Republic of the Congo (R.C.), where various BIF-hosted iron deposits were discovered within the Precambrian terranes and the narrow greenstone belts around them [11,12,13,14,15]. The BIFs in Central Africa and the Congo are much less studied than those in Cameroon. In the northwestern Congo, recent exploration by the Core Mining Ltd., Equatorial Resources, and Congo Iron SA discovered several high-grade iron deposits, including Avima, Badondo, Nabeba, and Cabosse [16] (Figure 1). Very little is known about these BIF-hosted iron deposits, including the BIF depositional environment prior to ore enrichment [16,17,18]. Among these iron deposits, the Nabeba iron deposit is renowned for its strong economic potential, which attracts much attention.
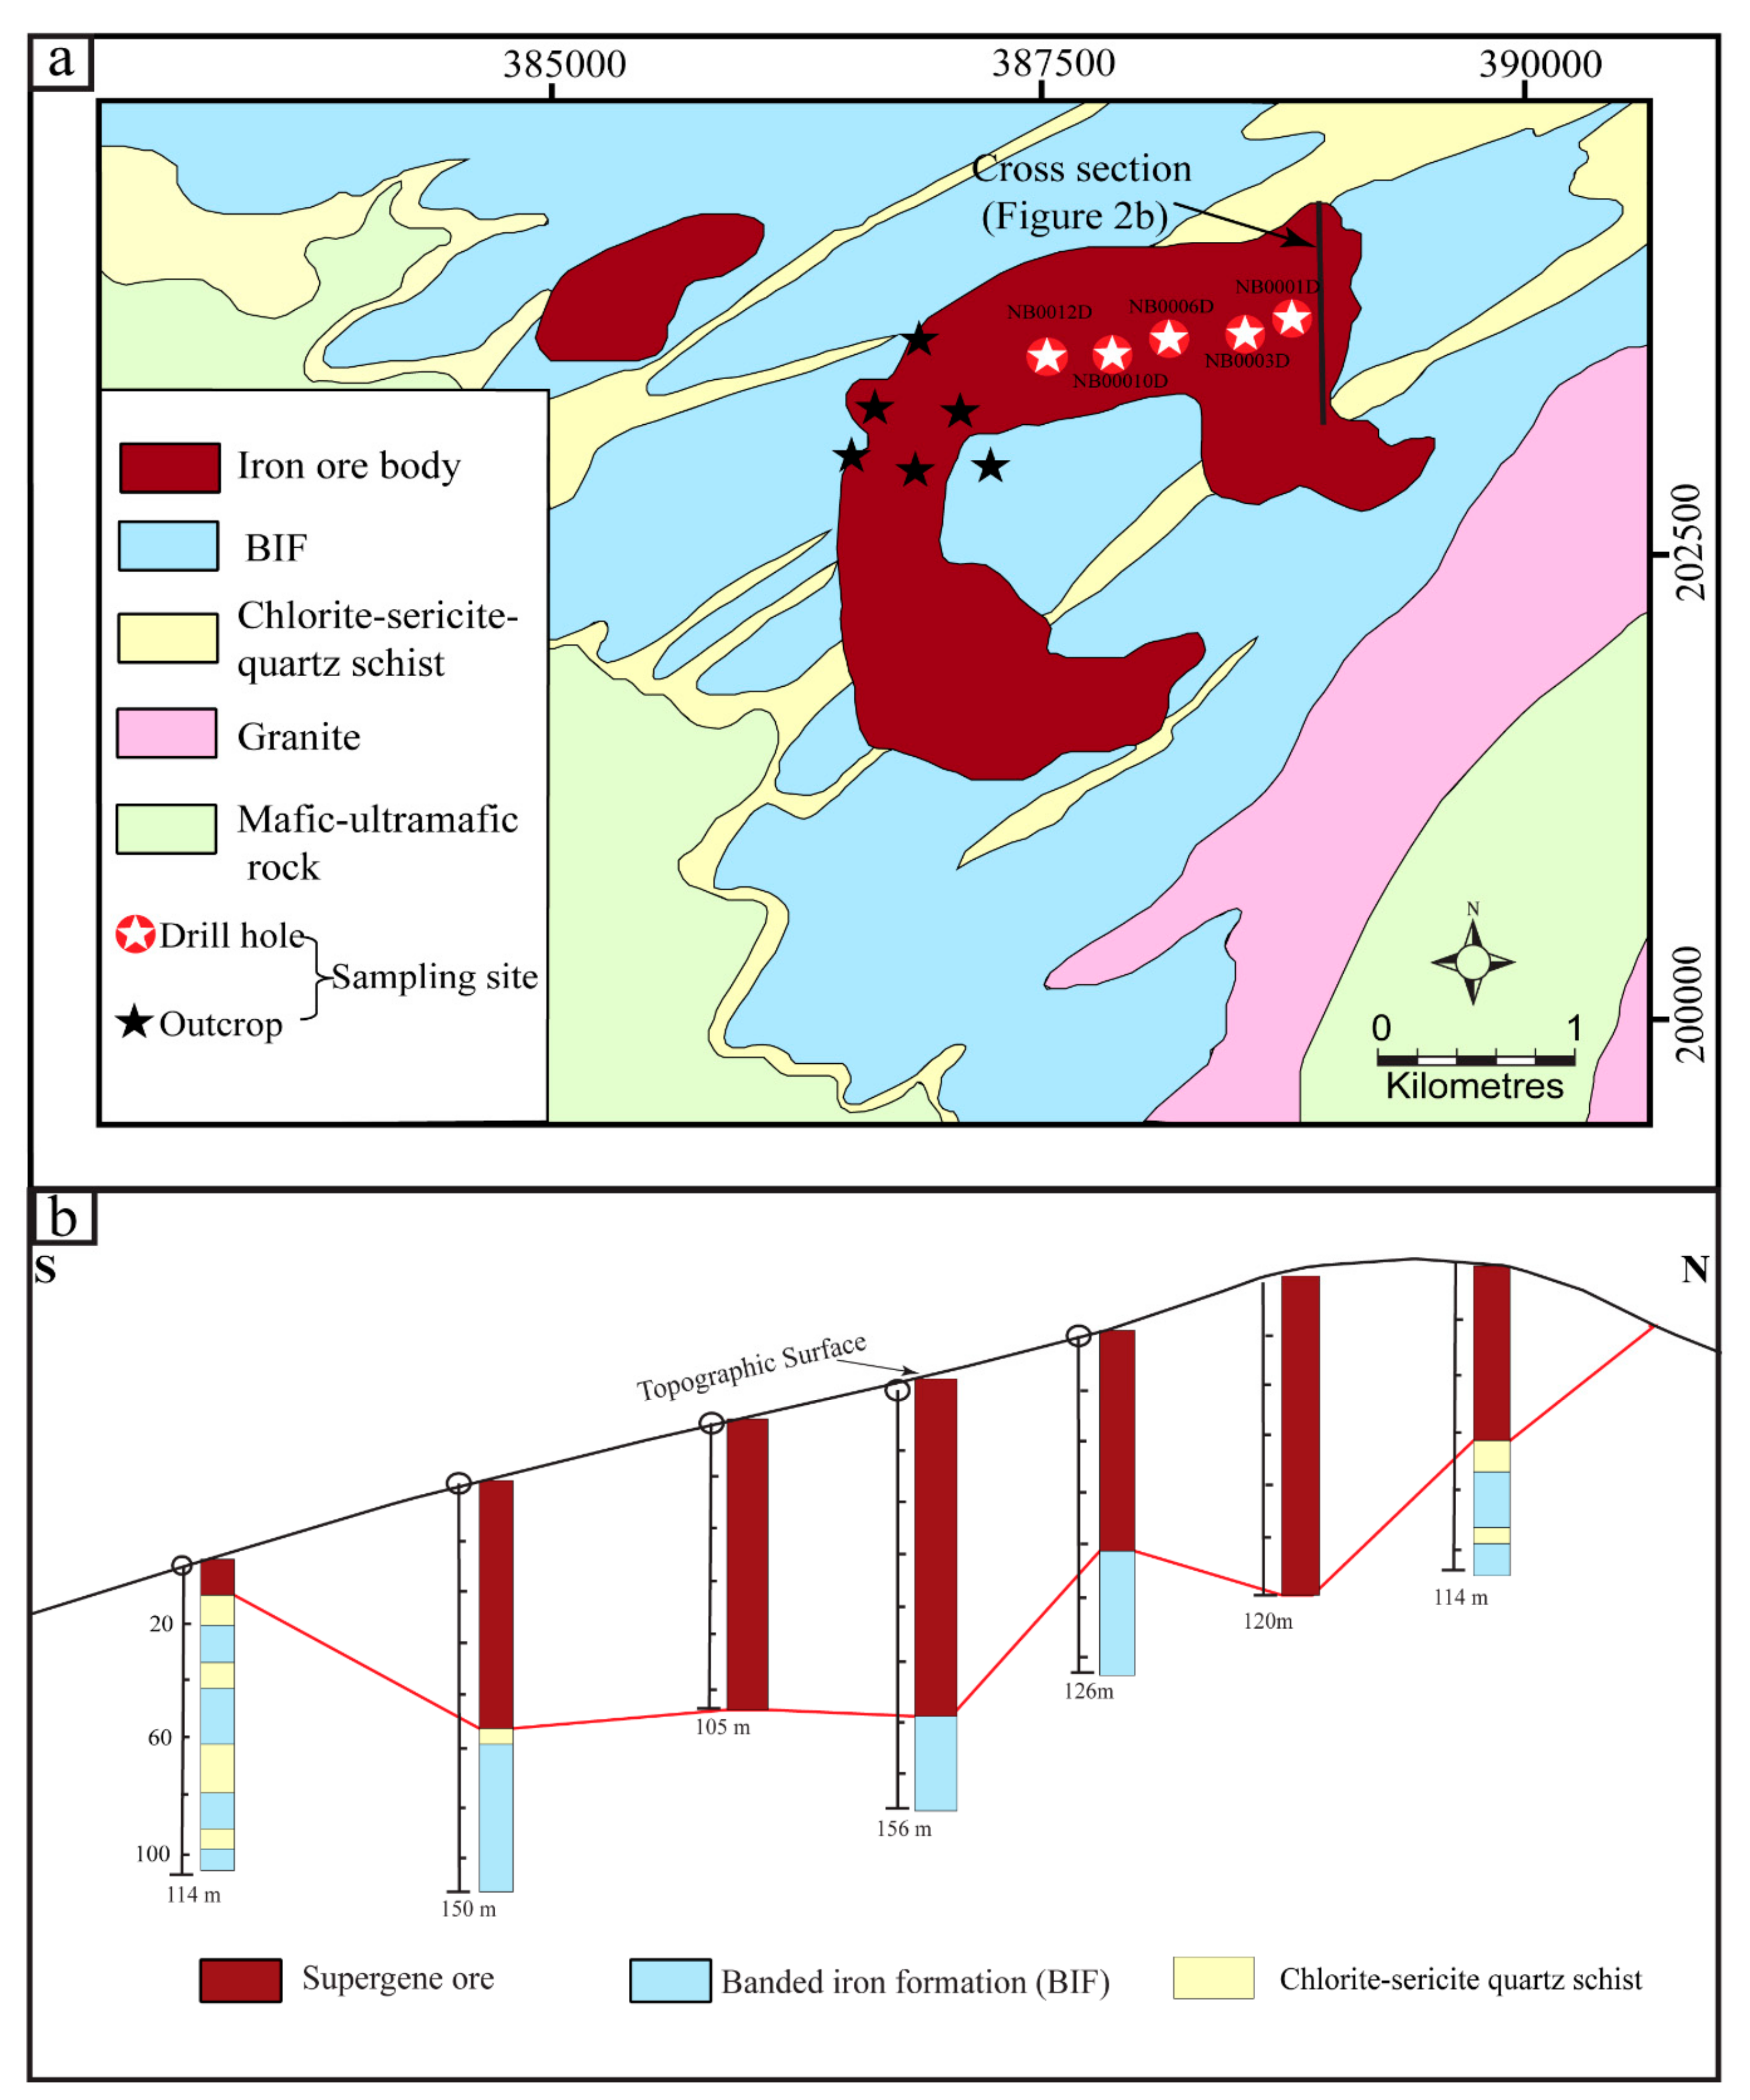
The Precambrian Nabeba BIF is associated with mafic and felsic volcanic rocks (Figure 2a). Their lithological associations are similar to those of the well-studied Algoma-type Musselwhite and Meliadine BIFs. Recent studies on Algoma-type BIFs demonstrated that their depositional settings [2,20,21,22,23,24] involve submarine hydrothermal activity and a seawater component with varying detrital/volcaniclastic input. Despite being influenced by post-depositional processes, such as regional greenschist-/amphibolite-facies metamorphism, mineral geochemistry from Si-rich and Fe-rich layers can be used to constrain petrogenesis and depositional environment [2,25,26,27,28,29,30,31,32,33], especially with the recent advances in the laser ablation-inductively coupled plasma-mass spectrometry (LA-ICP-MS) analytical technology [28].
This study focuses on the BIF that hosts the Nabeba iron deposit—the deposit with the highest iron ore potential amongst the other BIFs in the Invido Basement Complex (IBC) of the Republic of Congo (Figure 1)—but its host BIF depositional environment and genesis are not well-studied. In this paper, we reported BIF petrographic features and whole-rock geochemical and LA-ICP-MS magnetite trace element compositions. Based on comparisons with well-studied BIFs around the world, we discussed the controlling factors on the magnetite trace element characteristics and the implications that all of these data have for the BIF depositional environment and petrogenesis at Nabeba.

2. Regional Geology

Due to the inaccessibility of the region to conduct regionally extensive geological works and the lack of extensive outcrops, the regional geology reported in this paper was based on the few outcrops that we encountered at the company site and environs, the company records on exposures during its geological exploration expeditions, and the scant literature available on the Nabeba area (e.g., the publication of Meloux et al. [34]). In NW Congo, a granitoid massif, which is known as the Chaillu Massif [35] and an equivalent of the IBC, contains two generations of granitoids with mainly N-S foliation. Greenstone belts (including BIF) and schist are found in several locations within the Chaillu Massif, including the Mayoko and the Zanaga Regions in southern Congo [36] and at Mt. Nabeba. To the east of Mt. Nabeba, the margins of the Chaillu Massif are overlain by low-grade metamorphic rocks of the Proterozoic Sembé-Ouesso Group (i.e., a sedimentary sequence of sandstone-shale and diamictite [19,34,35,37] (Figure 1). Cenozoic sediments of the Congo Basin cover much of the area, including the surroundings of Mt. Nabeba.
The Precambrian Nabeba iron deposit in northwestern Congo (Figure 1) is geologically located in the Archean IBC. The IBC comprises mainly two types of rock formation, namely supracrustal and crystalline rocks (Figure 1; [19,34,35,37]). The supracrustal rocks are mainly volcano-sedimentary in origin and comprise metamorphosed, EW-trending greenstone belts (commonly chlorite-sericite-quartz schists and amphibolite) and banded iron formations with mafic and/or ultramafic intrusive rocks [34]. The Archean greenstone belts narrowly frame the crystalline rocks along regional NE-trending structural corridors. The crystalline rocks generally comprise, as elsewhere in the Congo Craton, cataclasized granites, orthogneiss, and migmatites. These rocks constitute the greater part of the basement (80% to 90%). However, the most widespread lithological assemblages are calc-alkaline granites, biotite, green hornblende granodiorites, and, more locally, quartz meta-diorites or metagabbros [34].
In the Souanké area, which is at the northeastern margin of the IBC, the greenstone belts and the amphibolite associated with banded iron formation (Figure 2a) are thought to be the remnants of greenstone belts, including those at Nabeba [34]. The good exposures in the Souanké area reveal intrusions of Archean TTG suites and potassic granite in the amphibolite, suggesting that the Amphibolite and the BIF are at least of Precambrian age [38,39].

3. Deposit Geology

The principal rock types that represent the volcano-sedimentary units in the structurally complex Nabeba project area are BIF and chlorite-sericite-quartz schists [40]. The Nabeba rocks are metamorphosed to the amphibolite facies and strongly deformed [16].
Structural geological studies revealed at least two major deformation events (D1 and D2) [16]. D1 consists of the NE-trending S1 foliation and the F1 north-plunging isoclinal fold, while D2 formed regional N-S-trending folds (F2) and extensive E-W-trending S2 shearing [16]. The Nabeba BIF was suggested to be structurally dismembered and fan-shaped, which was confined by NE-trending thrust/reverse faults. These faults converged into an E-W trending regional shear zone north of Nabeba [16].
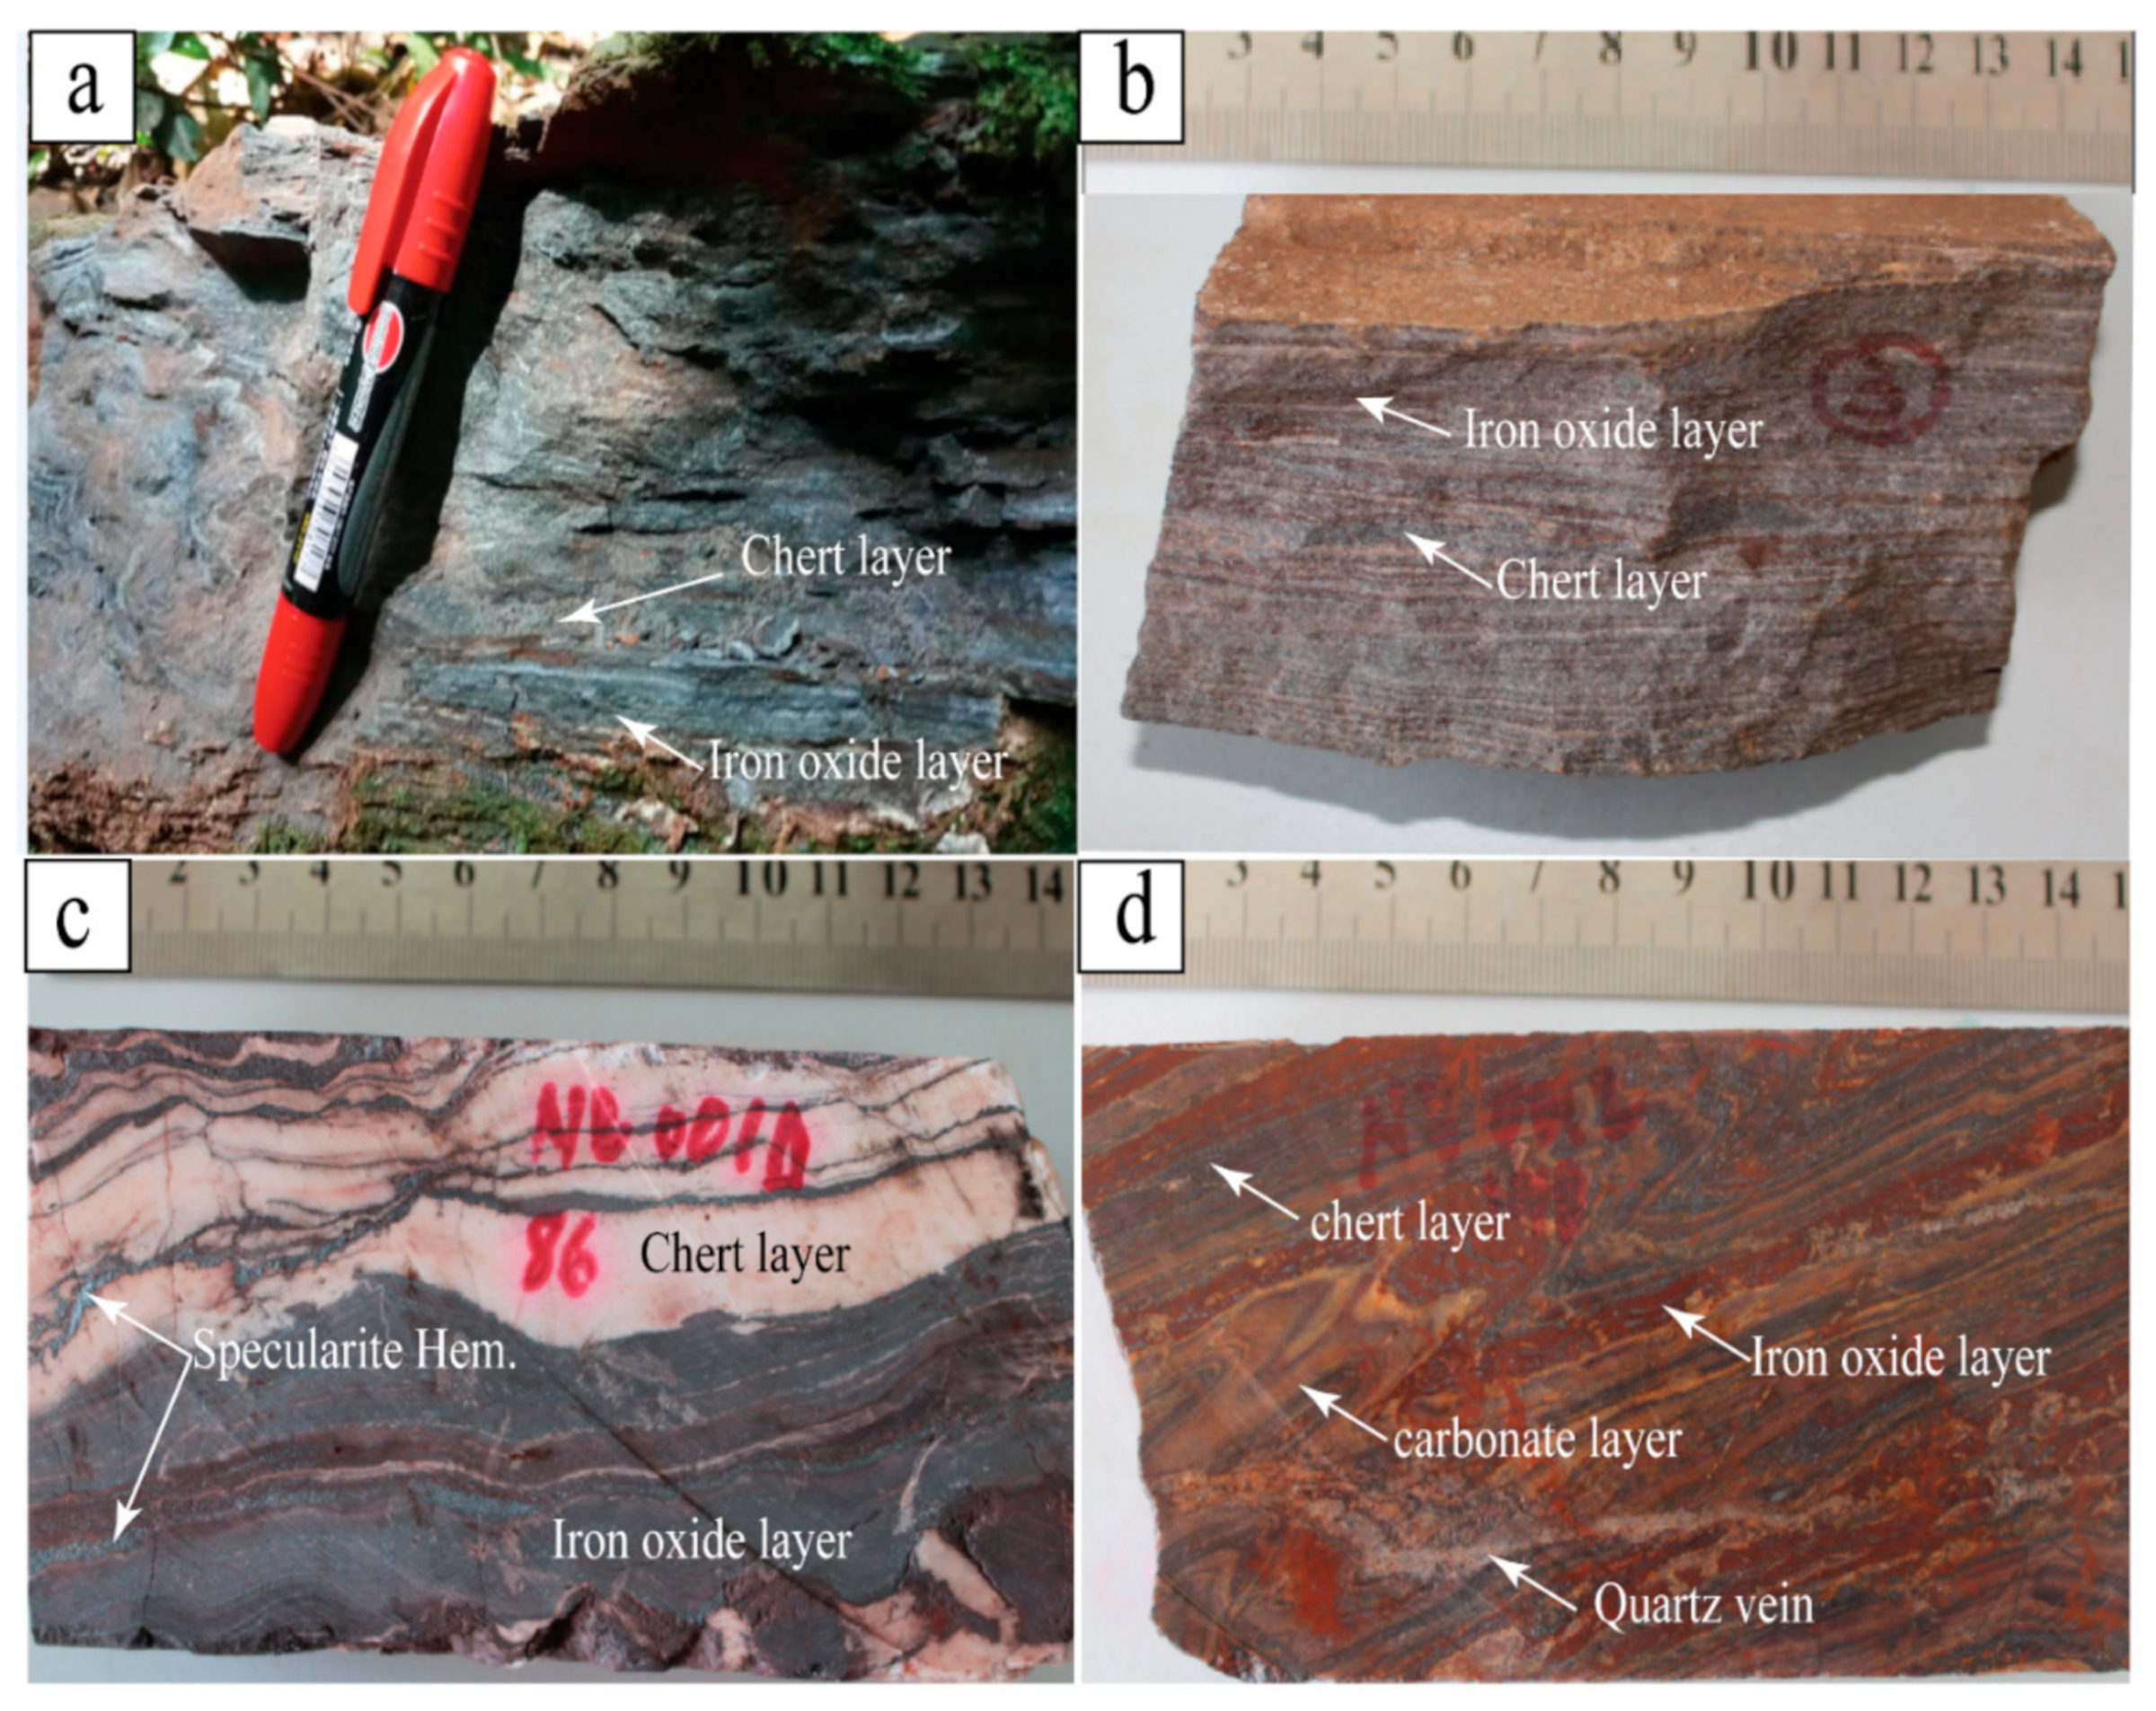
The Nabeba BIF consists of alternating thin iron oxide-rich and cherty bands with minor iron carbonate minerals, such as siderite and ferroan-magnesite. The iron oxide minerals comprise hematite, magnetite, and martite. The BIF is crosscut by quartz veins of varying thicknesses [16].
The Nabeba BIF contains the Nabeba iron deposit: an inferred resource of 436.3 Mt at a grade of 62.3% Fe (Figure 2a; [16]). Three mineralization styles are present: (1) supergene goethite-hematite ore (>62.3% Fe); (2) itabirite-type mineralization (i.e., hematite-enriched BIF; 34% Fe) (Figure 2b); (3) hypogene iron ore (45% to 55% Fe) [16].

4. Sampling and Analytical Methods

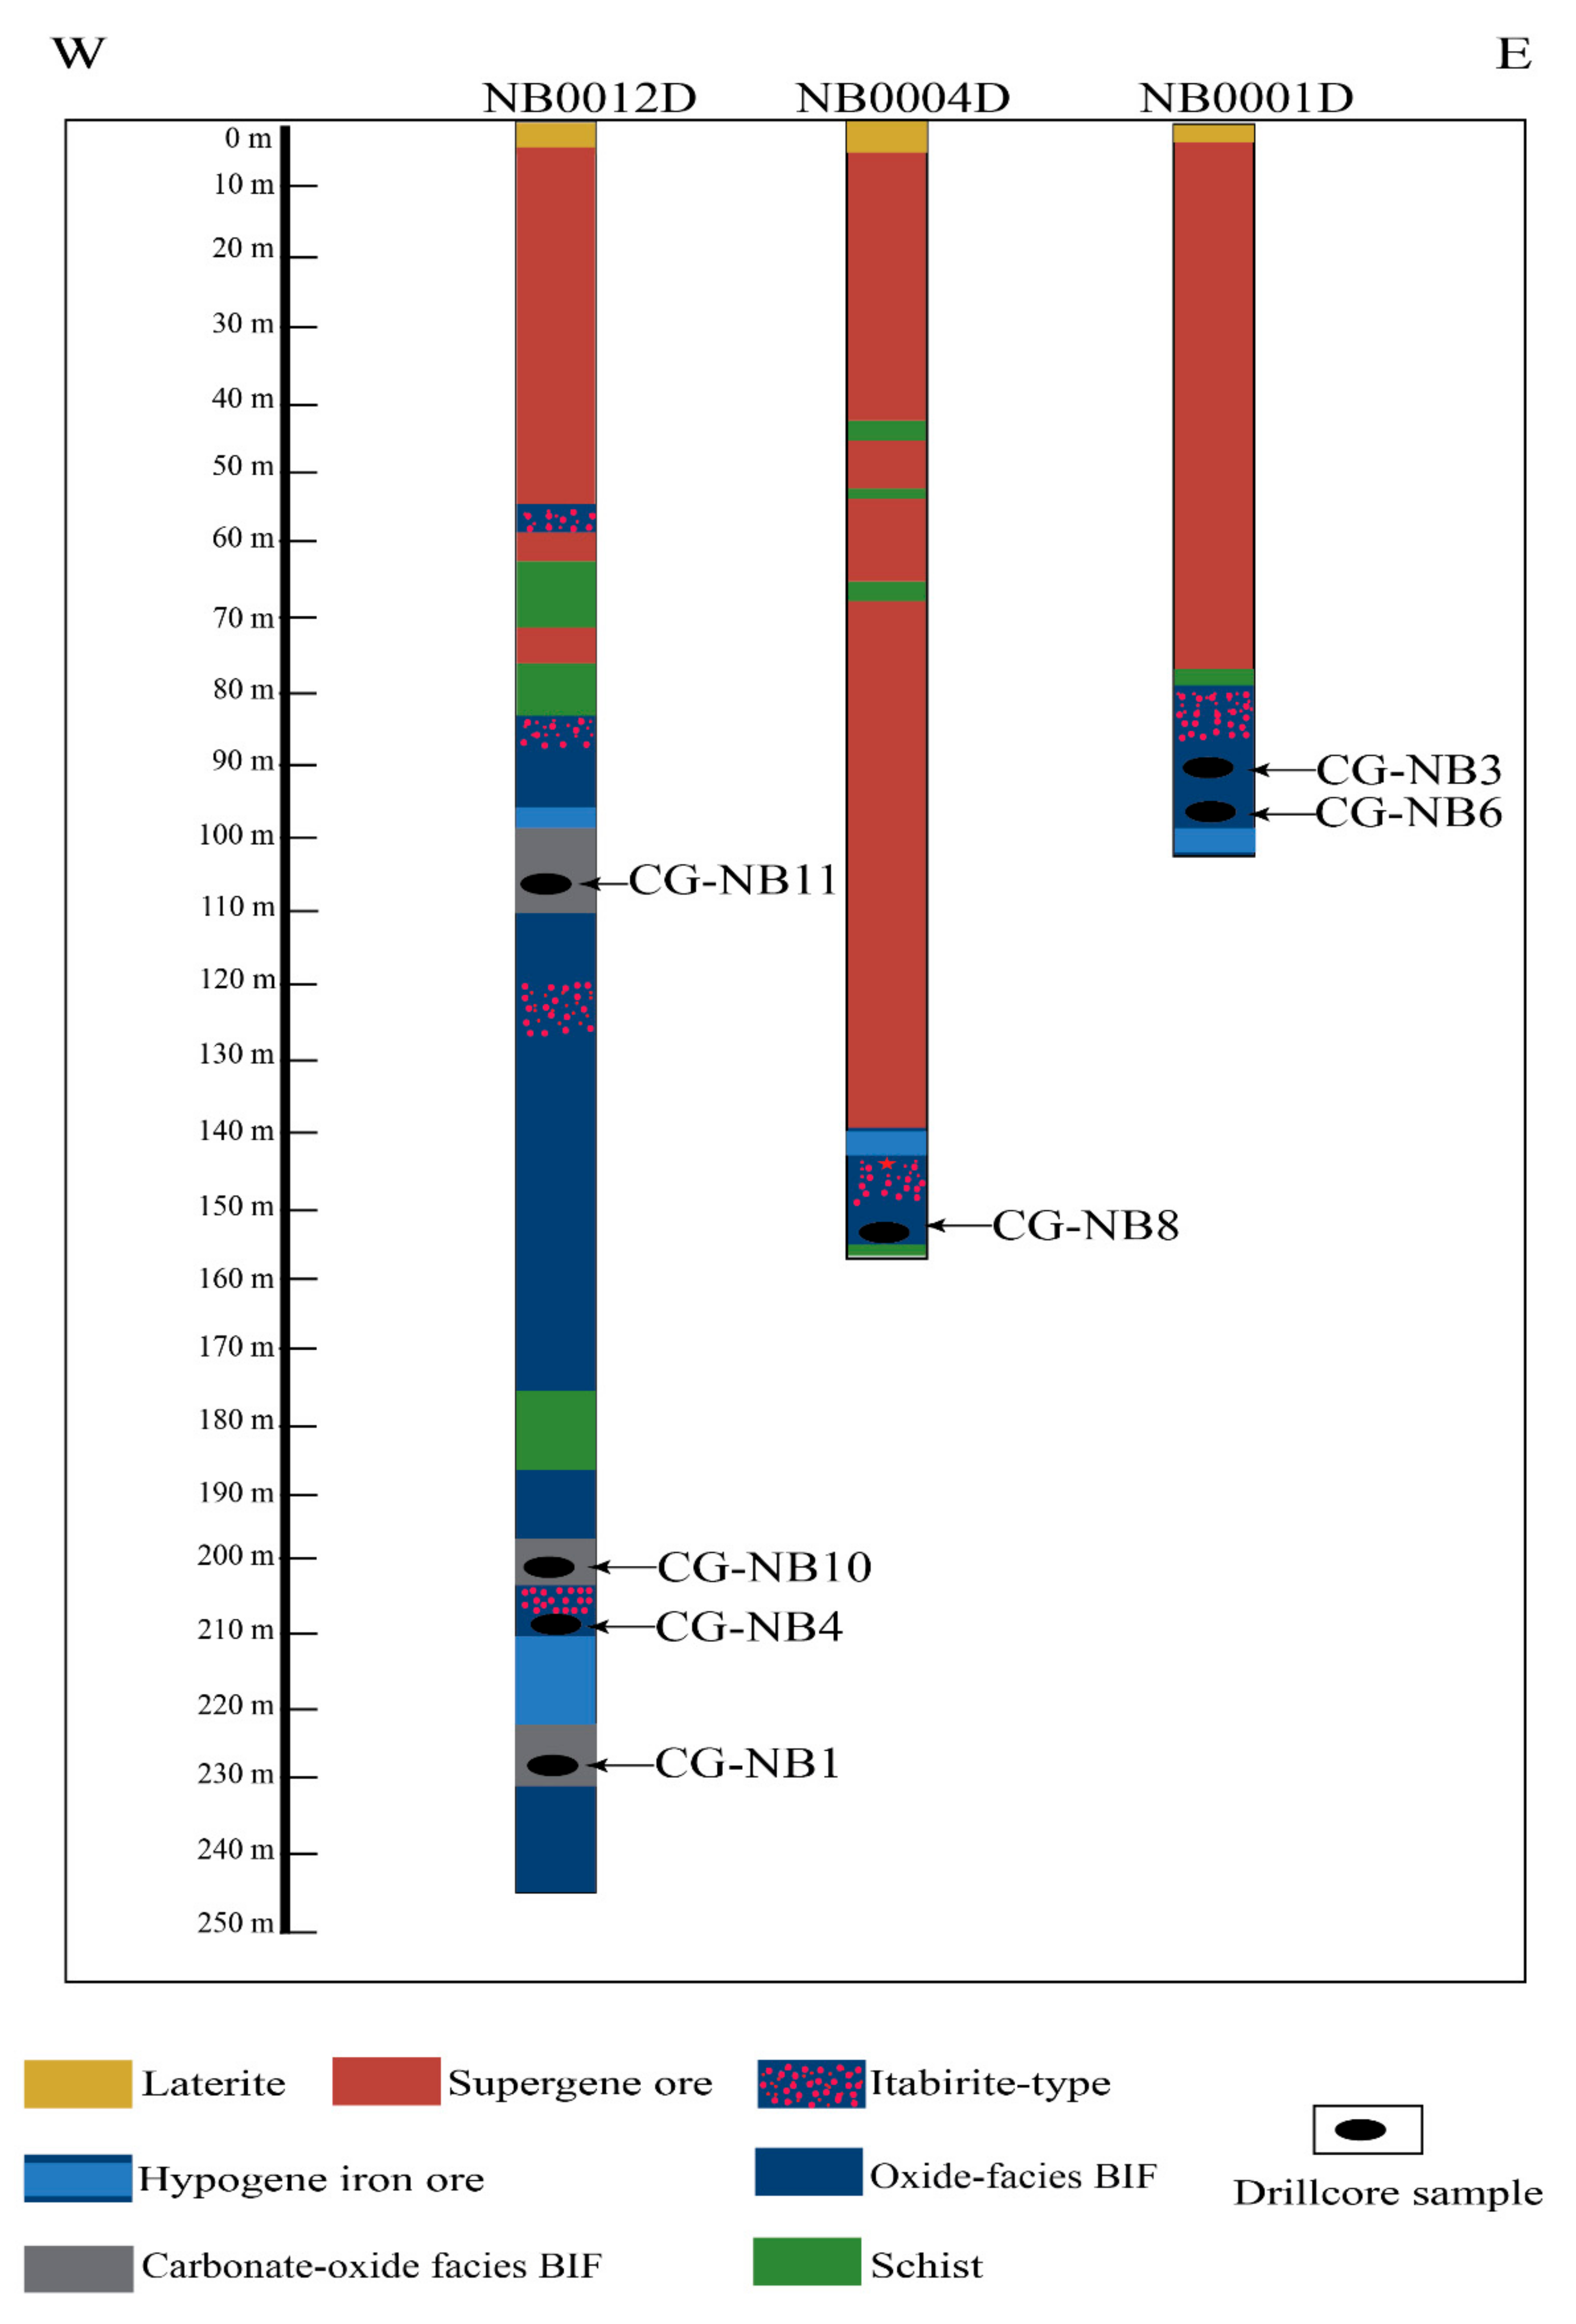
Thirty-three representative BIF samples were collected from drill cores (Figure 3) and outcrops (Figure 4a,b) for petrographic observations, from which ten samples were selected for whole-rock geochemical analysis and five for in situ LA-ICP-MS magnetite trace element analyses (Table 1).
These samples contain iron oxide bands with dominantly anhedral magnetite grains and rare hematite. Polished thin sections were prepared and examined using both transmitted and reflected light microscopy along with scanning electron microscopy (SEM) in order to select suitable geochemical analysis site with minimal intergranular matrix or mineral (e.g., quartz, siderite, monazite) inclusions.
Whole-rock major and trace (including rare earth element (REE)) analyses were performed at the ALS Laboratory (Guangzhou, China). The samples were crushed and powdered in an agate mill. Major elements were analyzed with X-ray fluorescence (XRF) spectroscopy after the powders were fused with lithium borate into glass disks. The analytical uncertainties varied from 1% to 0.04%.
Trace element compositions were analyzed with solution ICP-MS, with approximately 2% to 5% analytical uncertainties. The sample powder was mixed with distilled HF and HNO3 acids in Teflon screw-up capsules at 140 °C and then dried and digested with HNO3 acid at 190 °C for 48 h in an oven. The solution was dried again and digested with HNO3 acid at 150 °C for 12 h. A solution with 800 ng/g rhodium was added into the dissolved samples as an internal standard. The precision for trace elements and REEs varies between 0.1% and 0.5%. For REE-Y, the detection limits were 0.01 ppm. Data quality was monitored by analyzing various standards between unknown samples.
LA-ICP-MS trace element analysis was performed on selected magnetite grains with an Agilent 7900 quadrupole ICP-MS (Agilent Technologies, Santa Clara, CA, USA) attached to a Photon Machines Analyte (Photon-Machines INC., Redmond, WA, USA) HE 193 nm Excimer laser ablation system equipped with a SQUID signal smoothing (Applied Spectra, INC., West Sacramento, CA, USA) device. The analysis was performed at the In-situ Mineral Geochemistry Laboratory, Ore Deposit and Exploration Centre (ODEC), Hefei University of Technology (Anhui Province, China). Sample ablation was done using He as a carrier gas, which mixed with the Ar make-up gas before entering in the ICP. The 30 μm laser spot and the 8 Hz frequency were maintained throughout the analysis. Analysis of all grains was done using laser energy at 3 J/cm2. Each analysis comprised a gas blank (laser-off) background measurement of 20 s, followed by a 40 s laser-on sample signal measurement. Calibration was done using multiple reference materials (BCR-2G, SRM 612, and SRM 610), and 57Fe was used as an internal standard [41]. The ICPMSDataCal program was used for data processing, following the method described by Liu et al. [42]. This software is generally used for the integrated selection of contextual and for signal analysis, quantitative calibration, and correction of time drift. Fifty-four isotopes were measured. Forty-seven sample analysis spots were bracketed by analysis of the standard (e.g., BCR-2G, SRM610, and SSRM612). In the study, the detection limits were significantly lower than the rare earth element (REE) contents of our magnetite samples (Tables S1 and S2).
The Post-Archean Australian Shale (PAAS; [43], subscript “SN”) was used to normalize the REE+Y concentrations to minimize the influence of potential terrigenous input. The PAAS-normalized La (La SN) anomalies were calculated by (La/La*)SN = (La/Pr)SN after Bau et al. [44], because these REEs were taken as reference elements due to their coherent behavior during geochemical processes and predictable fractionation [45]. The anomalous abundance of CeSN, EuSN, GdSN, and PrSN were calculated as suggested by Bau and Dulski [3]: (Ce/Ce*)SN = CeSN/(0.5LaSN + 0.5PrSN), (Eu/Eu*)SN = EuSN /(0.67SmSN + 0.33TbSN), (Gd/Gd*)SN = GdSN/(0.33SmSN + 0.67TbSN), and (Pr/Pr*)SN = PrSN/(0.5CeSN + 0.5NdSN).

5. Results

5.1. BIF Petrography

5.1.1. Oxide-Facies-BIF

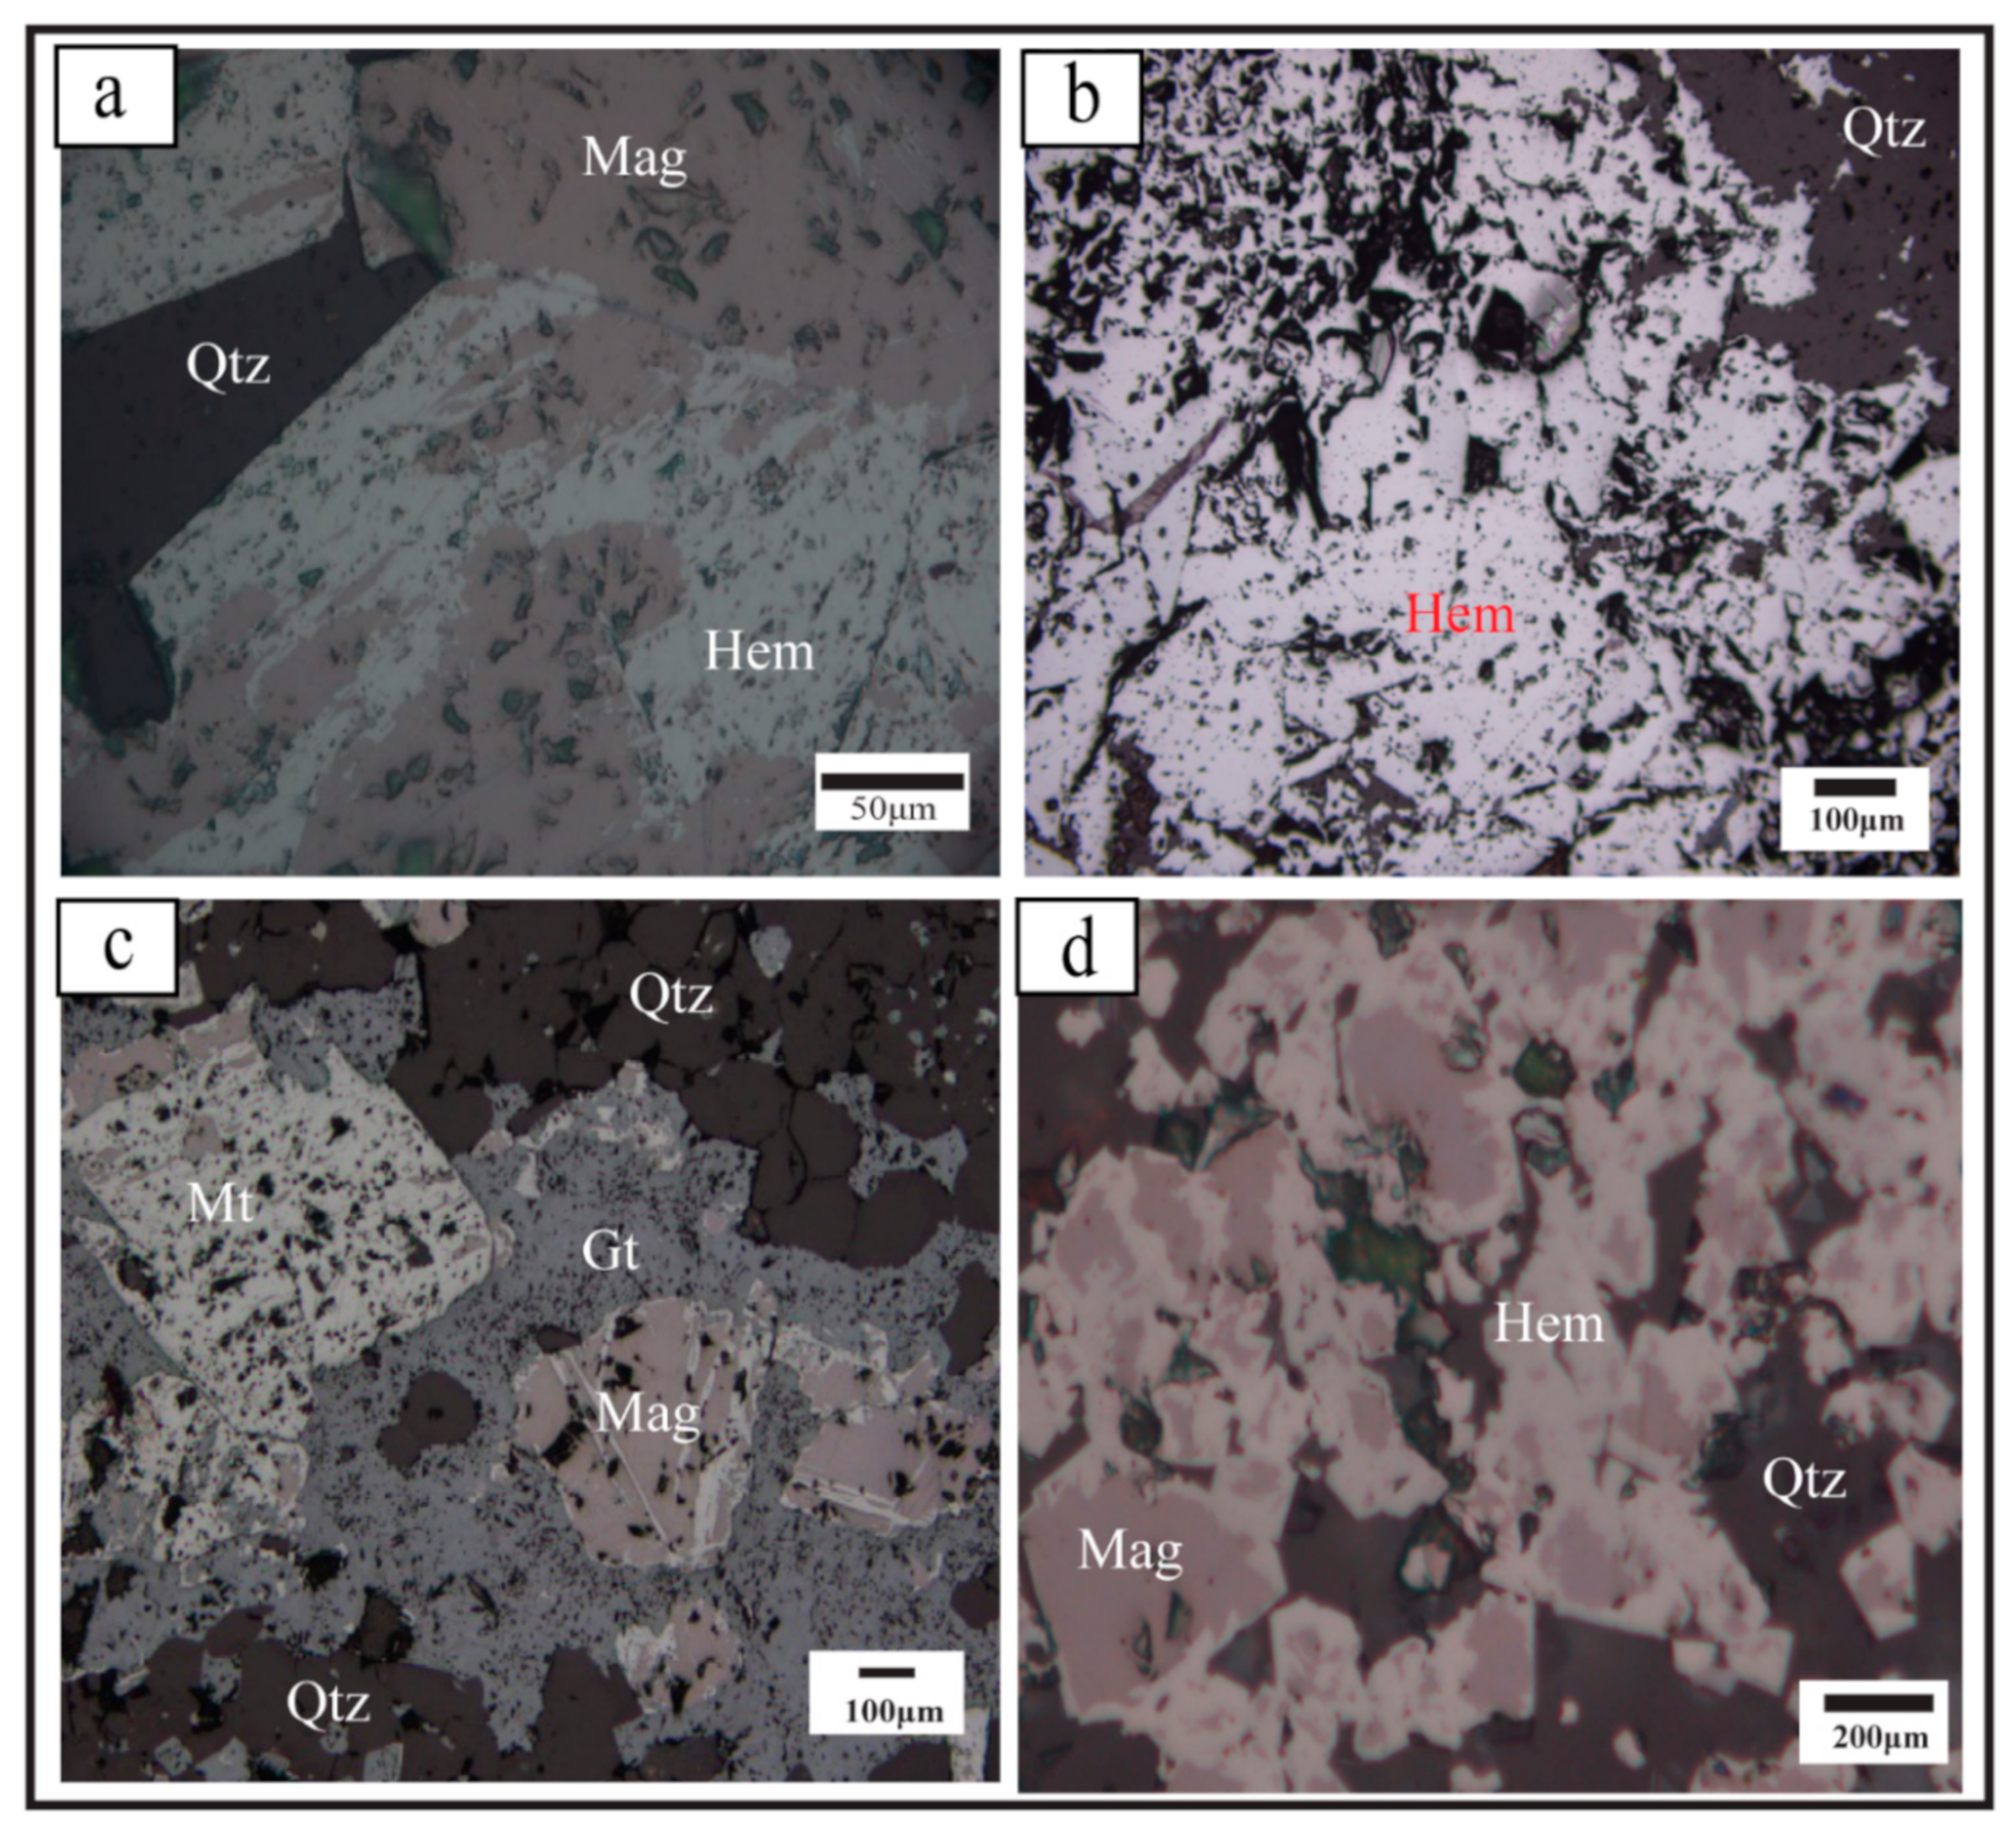
The oxide-facies-BIF was fine- to coarse-grained and comprised alternating whitish chert- and dark-brown iron oxide-bands, which were <1 to 1.5 mm thick (Figure 4b,c). The oxide-facies-BIF consisted of quartz, magnetite, hematite, and martite, and minor fluorapatite and sulfides. Quartz occurred as isolated anhedral-euhedral fine grains (<45–400 μm) or formed granular aggregates 150 to >200 μm in size (Figure 5a,b). It locally displayed undulose extinction due to deformation. Magnetite appeared as anhedral crystals or aggregates of 25–550 μm in size (Figure 5a–d). Magnetite was partially replaced by hematite or as relicts in hematite grains (Figure 5d). Many magnetite grains contained quartz inclusions. Hematite occurred as massive anhedral aggregates of 25–300 μm in size (Figure 5c,d) and was commonly formed as pseudomorphic replacement of magnetite (Figure 5a). Martite occurred as granular mass with grain size of 50–300 μm (Figure 5c).

5.1.2. Carbonate-Oxide Facies-BIF

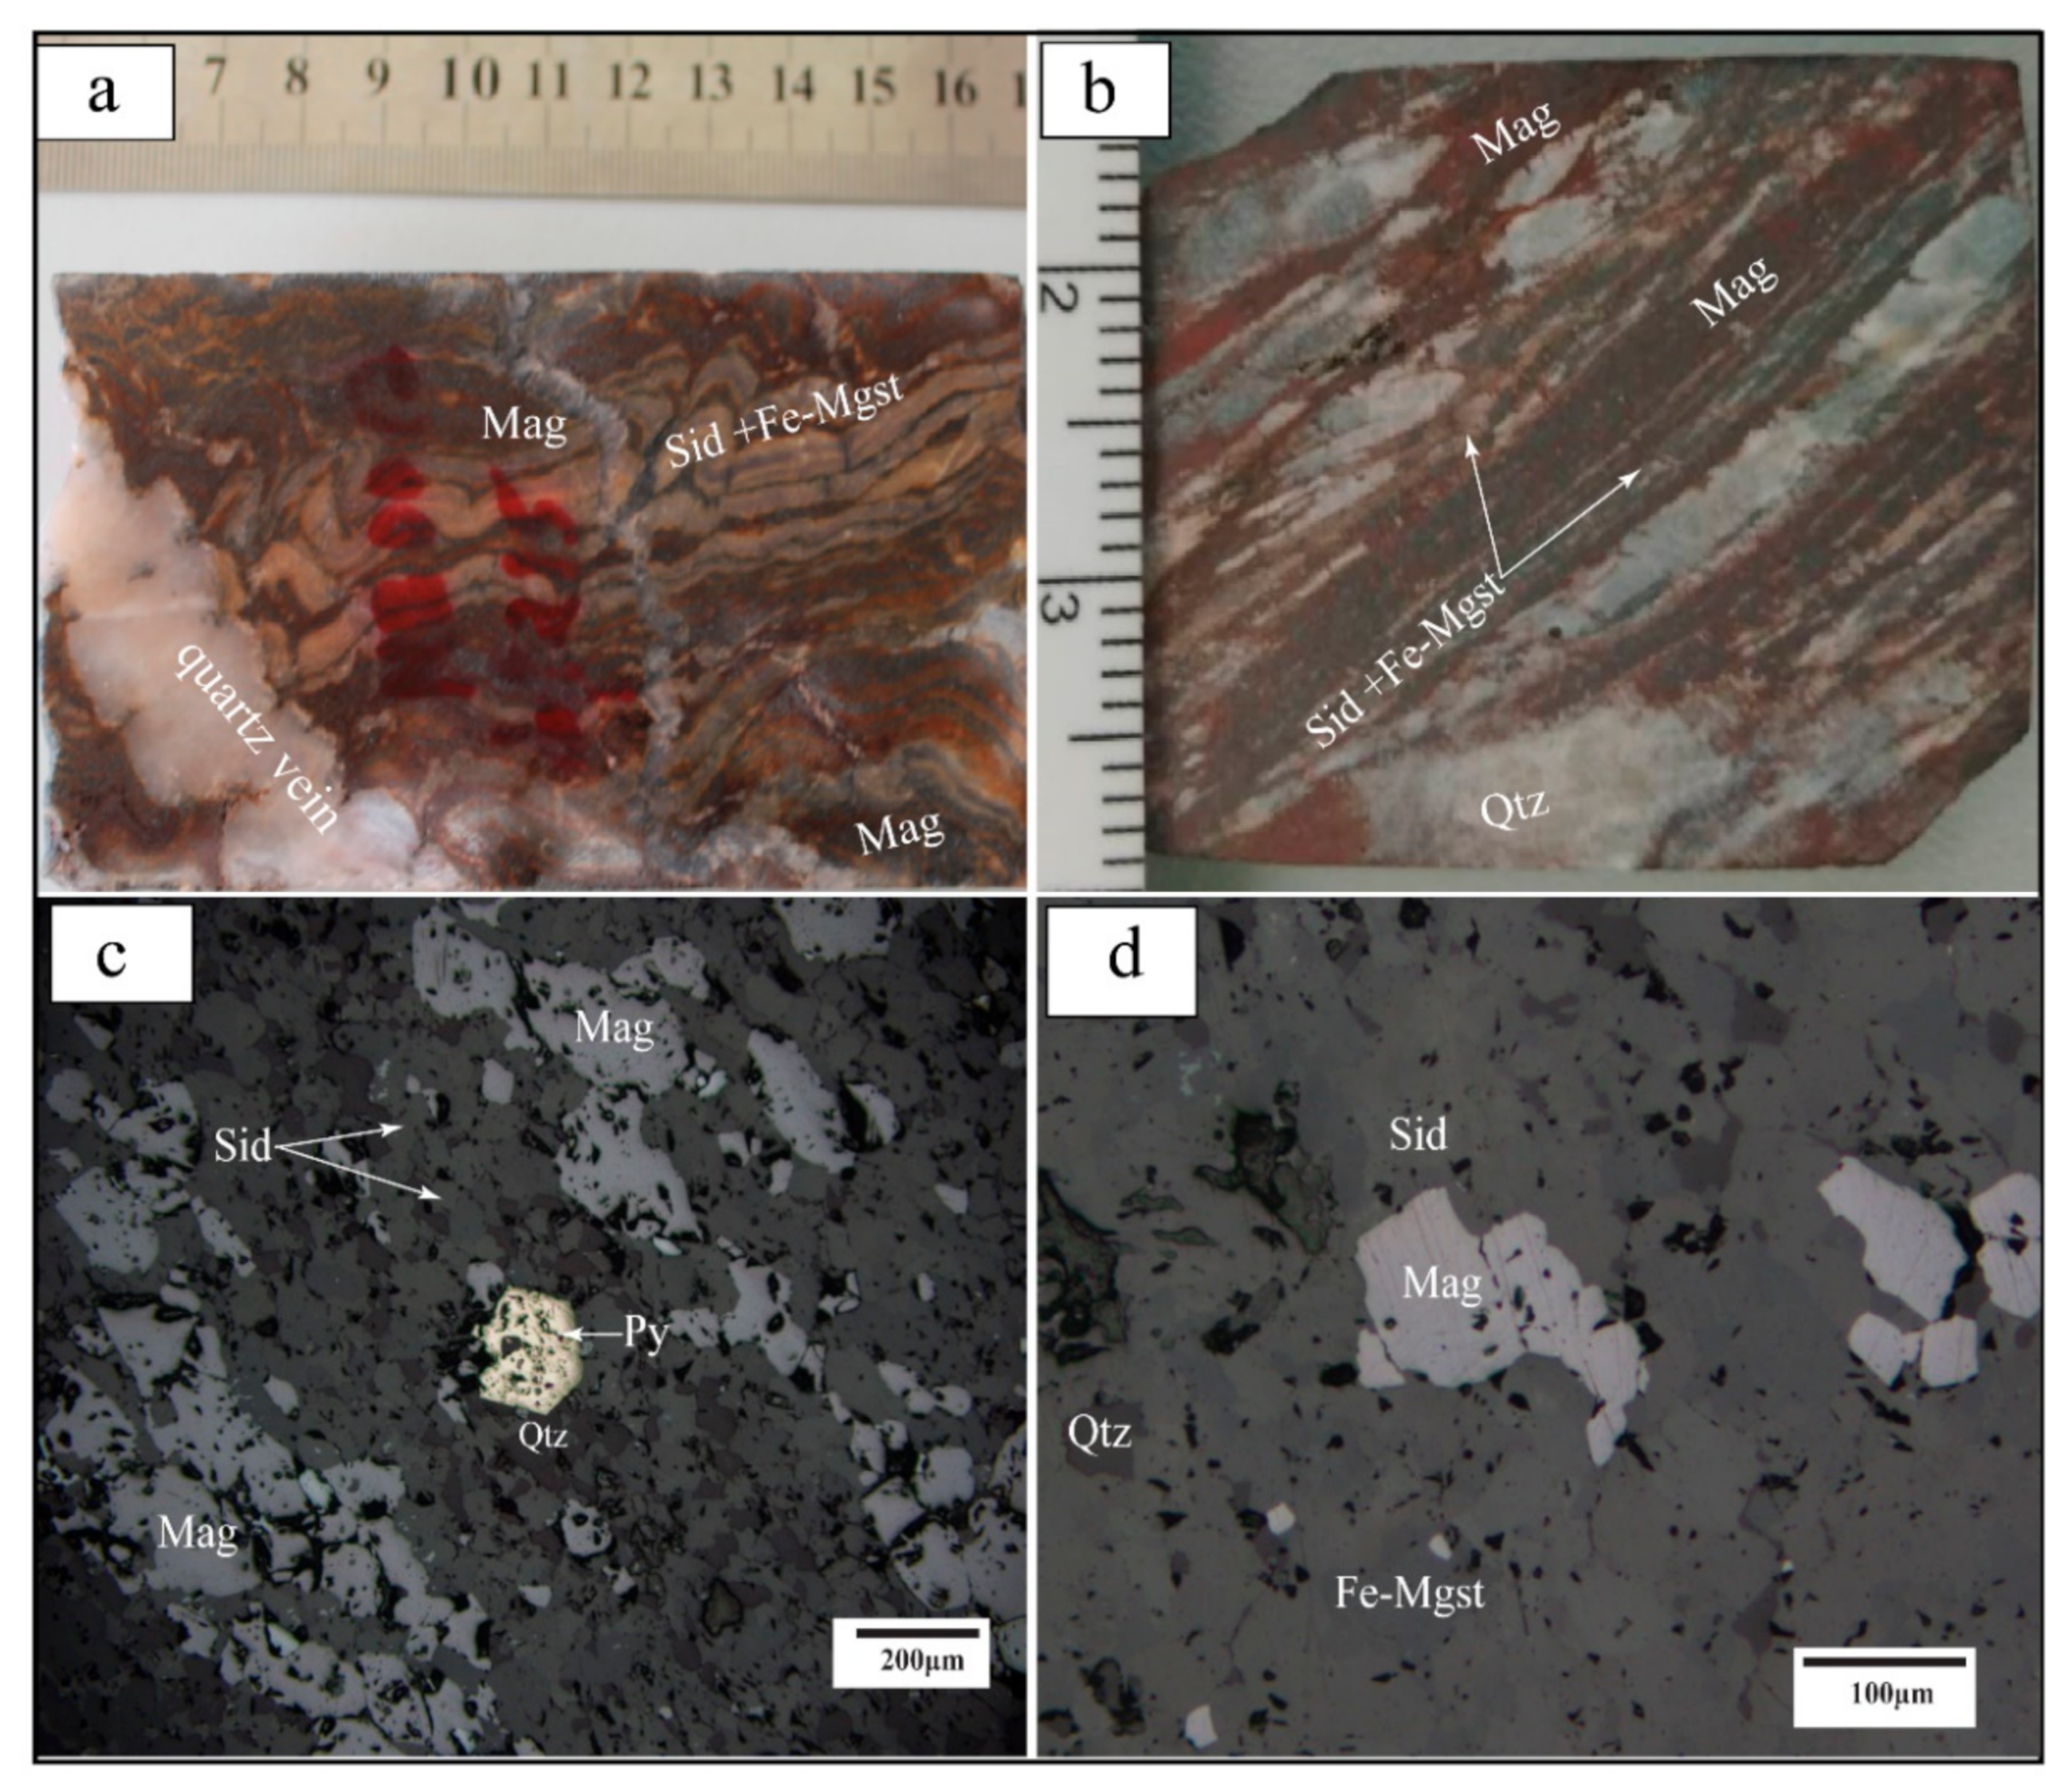
The Nabeba carbonate-oxide facies-BIF was dark-brown and fine- to coarse-grained (Figure 4d and Figure 6a,b). The sample hand-specimens displayed alternating bands (<1 to 4 mm thick) of chert and ferric minerals (siderite, magnetite, and ferroan-magnesite) (Figure 6a,b). Under the microscope, the Nabeba carbonate-oxide facies-BIF contained accessory apatite, K-feldspar, chlorite, monazite, galena, sphalerite, and sulfides (pyrite, arsenopyrite, and chalcopyrite) (Figure 6c,d).
Magnetite, the dominant iron-bearing ferric mineral, was euhedral-subhedral and <50–600 μm in size. Magnetite formed massive aggregates or occurred as minor inclusions in chert- or iron carbonate-rich layers (Figure 6b). Rare fine quartz and monazite inclusions were found in the massive magnetite aggregates (Figure 6c).
Siderite was often associated with ferroan-magnesite, and both minerals appeared as massive aggregates in the continuous iron carbonate-rich bands (Figure 6a,b). Siderite was often associated with magnetite or quartz (Figure 6c). Anhedral ferroan-magnesite occurred as micro-laminae in a siderite groundmass and appeared as an alteration product of siderite.
Quartz was anhedral and formed micro-laminae between magnetite-rich and carbonate-rich laminae (Figure 6b). Quartz displayed undulose extinction and was often associated with pyrite, chlorite, or ferro-microcline as inclusions in granoblastic siderite (Figure 6c).

5.2. Whole-Rock Geochemistry

5.2.1. Major Elements

Major element analyses of the representative Nabeba BIF were performed on oxide- and carbonate-oxide-facies-BIF samples (six from outcrop and four from drill core) (Table 1). The results showed that the BIF contained mainly Fe2O3 and SiO2, with a weak positive correlation between them (r = 0.17 and 0.27 for oxide-facies and carbonate-oxide-facies-BIF, respectively; Table 2, Table 3 and Table 4).
The oxide facies-BIF samples had SiO2 = 43.74–68.37 wt.%, which was negatively correlated with MnO, MgO, Al2O3, CaO, and P2O5. Fe2O3 (30.71–55.63 wt.%) was the dominant oxide and was negatively correlated with MnO (r = −0.56), MgO (r = −0.72), and CaO (r = −0.78). Al2O3 (0.03–0.36 wt.%) was the second most abundant oxide and was moderately negatively correlated with Fe2O3 (r = −0.67) and strongly positively correlated with MnO (r = 0.54), MgO (r = 0.88), and CaO (r = 0.94). MnO content was low (0.01−0.12 wt.%) and had strong positive correlation with MgO (r = 0.87) and CaO (r = 0.75). MgO content was also low (0.02–0.08 wt.%) and had strong positive correlation with CaO (r = 0.97). These oxide facies-BIF samples had very low contents of TiO2 (<0.01 wt.%) and K2O (<0.02 wt.%) (Table 2 and Table 3).
The carbonate-oxide facies-BIF samples had SiO2 = 37.23–41.05 wt.% and Fe2O3 = 44.86–55.63 wt.%. SiO2 had weak positive correlation with MnO (r = 0.27) and strong negative correlation with Al2O3 (r = −0.84), CaO (r = −0.61), and P2O5 (r = −0.97). Fe2O3 was strongly negatively correlated with MnO (r = −0.85), MgO (−0.98), and CaO (r = −0.93). The MgO content (0.18−1.99 wt.%) was strongly positively correlated with CaO (r = 0.98), suggesting the incorporation of Mg in carbonate, which was the dominant phase in carbonate-oxide facies. Contents of the remaining major oxides, including TiO2, Al2O3, MnO, CaO, K2O, Na2O, and P2O5, were below 1.00wt.%. The Al2O3 content (0.06−0.48 wt.%) was strongly positively correlated with MgO (r = 0.85) and CaO (r = 0.94) (Table 4) but negatively correlated with Fe2O3 (r = −0.75). The MnO content (0.15–0.44 wt.%) was positively correlated with MgO (r = 0.74) and CaO (r = 0.60) but negatively correlated with P2O3 (r = −0.48) (Table 2 and Table 4).

5.2.2. Trace Elements

Trace element concentrations of the Nabeba BIF varied widely (Table 5). The oxide facies-BIF had lower Zr (0.9–2.1 ppm), Nb (0.1–0.3 ppm), and Zn (3–21 ppm) but higher Cr (15–52 ppm) and V (1–8 ppm) contents than the carbonate-oxide facies-BIF, which had Zr (1.4–7.6 ppm), Nb (0.1–1.1 ppm), Zn (11–175 ppm), Cr (12–50 ppm), and V (5–7 ppm). Transition metals, which showed slight enrichments (relative to HFSEs), are commonly used as indicators of direct volcanogenic hydrothermal input in chemical precipitates [46]. When normalized to the average upper continental crust (UCC) [43], our BIF samples were depleted in most high field strength elements (HFSEs; e.g., Zr, Nb, Th, and REEs) and large ion lithophile elements (LILEs; K and Rb) (Figure 7).
Table 5. Trace element compositions (in ppm) and ratios of the Nabeba BIF.
BIF FaciesOxideCarbonate-Oxide
Sample NameCG-NB3CG-NB6CG-C2CG-C21CG-C23–1CG-C23–2CG-C25CG-NB1CG-NB10CG-C5
Li0.40.30.60.20.20.20.22.42.10.2
Be0.210.161.180.610.440.330.230.190.340.47
V8153422575
Ni2.81.413.16.55.65.34.010.715.86.7
Co0.30.22.52.02.02.01.05.73.42.3
Cr52392522231915395012
Sc0.80.20.40.60.30.20.20.40.90.3
Rb1.40.40.20.32.01.5<0.11.00.51.0
Ba13.310.62.74.459.741.12.142.051.922.9
Sr2.93.20.50.20.70.60.25.120.40.7
Th0.050.030.060.080.040.030.020.080.150.09
Zr2.11.00.91.30.90.9<0.56.57.61.4
Cu<0.20.40.61.71.90.22.12.10.65.4
Zn<2<2211089310717511
Ga0.510.250.540.320.780.620.210.650.740.46
Nb0.30.20.20.10.10.10.11.10.30.1
Cs0.100.03<0.010.040.060.030.010.03<0.010.01
La1.61.41.41.61.81.71.51.51.42.4
Ce3.83.43.04.04.23.93.13.53.14.4
Pr0.450.400.370.360.480.400.320.390.340.42
Nd2.11.51.71.62.11.91.41.91.41.7
Sm0.440.350.510.430.550.400.410.400.350.41
Eu0.210.140.230.290.350.240.180.250.150.21
Gd0.570.350.630.541.060.680.580.580.390.50
Tb0.100.060.110.100.130.110.100.100.070.09
Dy0.610.360.680.610.690.710.630.620.470.55
Y5.03.25.44.75.25.65.14.63.54.3
Ho0.140.080.160.140.150.150.150.140.110.12
Er0.390.250.490.410.450.460.430.400.360.35
Tm0.060.040.080.060.070.070.060.060.060.05
Yb0.380.260.590.390.450.450.400.390.410.32
Lu0.060.040.100.060.080.080.060.060.070.05
Hf<0.2<0.2<0.2<0.2<0.2<0.2<0.20.20.2<0.2
Ta0.150.060.09<0.050.080.08<0.050.050.050.05
Pb1.01.40.90.9<0.50.5<0.52.60.70.6
U0.09<0.05<0.05<0.05<0.05<0.05<0.05<0.05<0.05<0.05
SREE-Y15.5211.5814.9614.8817.3116.3913.9914.4911.8215.52
ΣREE10.528.389.5610.1812.1110.798.899.898.3211.22
Y/Ho35.7140.0033.7533.5734.6737.3334.0032.8631.8235.83
(Ce/Ce*)SN1.031.040.961.221.041.091.031.051.041.00
(Pr/Pr* )SN0.931.040.950.840.950.860.900.880.960.90
(Eu/Eu*)SN1.861.771.802.602.432.121.652.321.772.03
(La/Yb)SN0.240.310.140.240.230.220.220.220.200.43
(Tb/Yb)SN0.900.790.640.880.990.840.860.880.590.97
(Y/Y*)SN1.061.171.011.001.001.061.030.970.951.04
(Sm/Yb)SN0.460.530.340.440.480.350.410.410.340.51
(Eu/Sm)SN2.452.062.323.473.273.082.263.212.202.63
(Pr/Yb)SN0.300.380.160.230.270.220.200.250.210.33
(Tb/Yb)SN0.900.790.640.880.990.840.860.880.590.97
(Gd/Gd*)SN1.151.101.141.091.651.291.181.191.091.11
(Eu/Eu*)CN1.281.221.241.841.401.411.131.591.241.42
(Sm/Yb)CN1.291.500.961.231.360.991.141.140.951.42
(La/Yb)CN3.023.861.702.942.872.712.692.762.455.38
(Tb/Yb)CN1.201.050.851.171.311.111.141.170.781.28
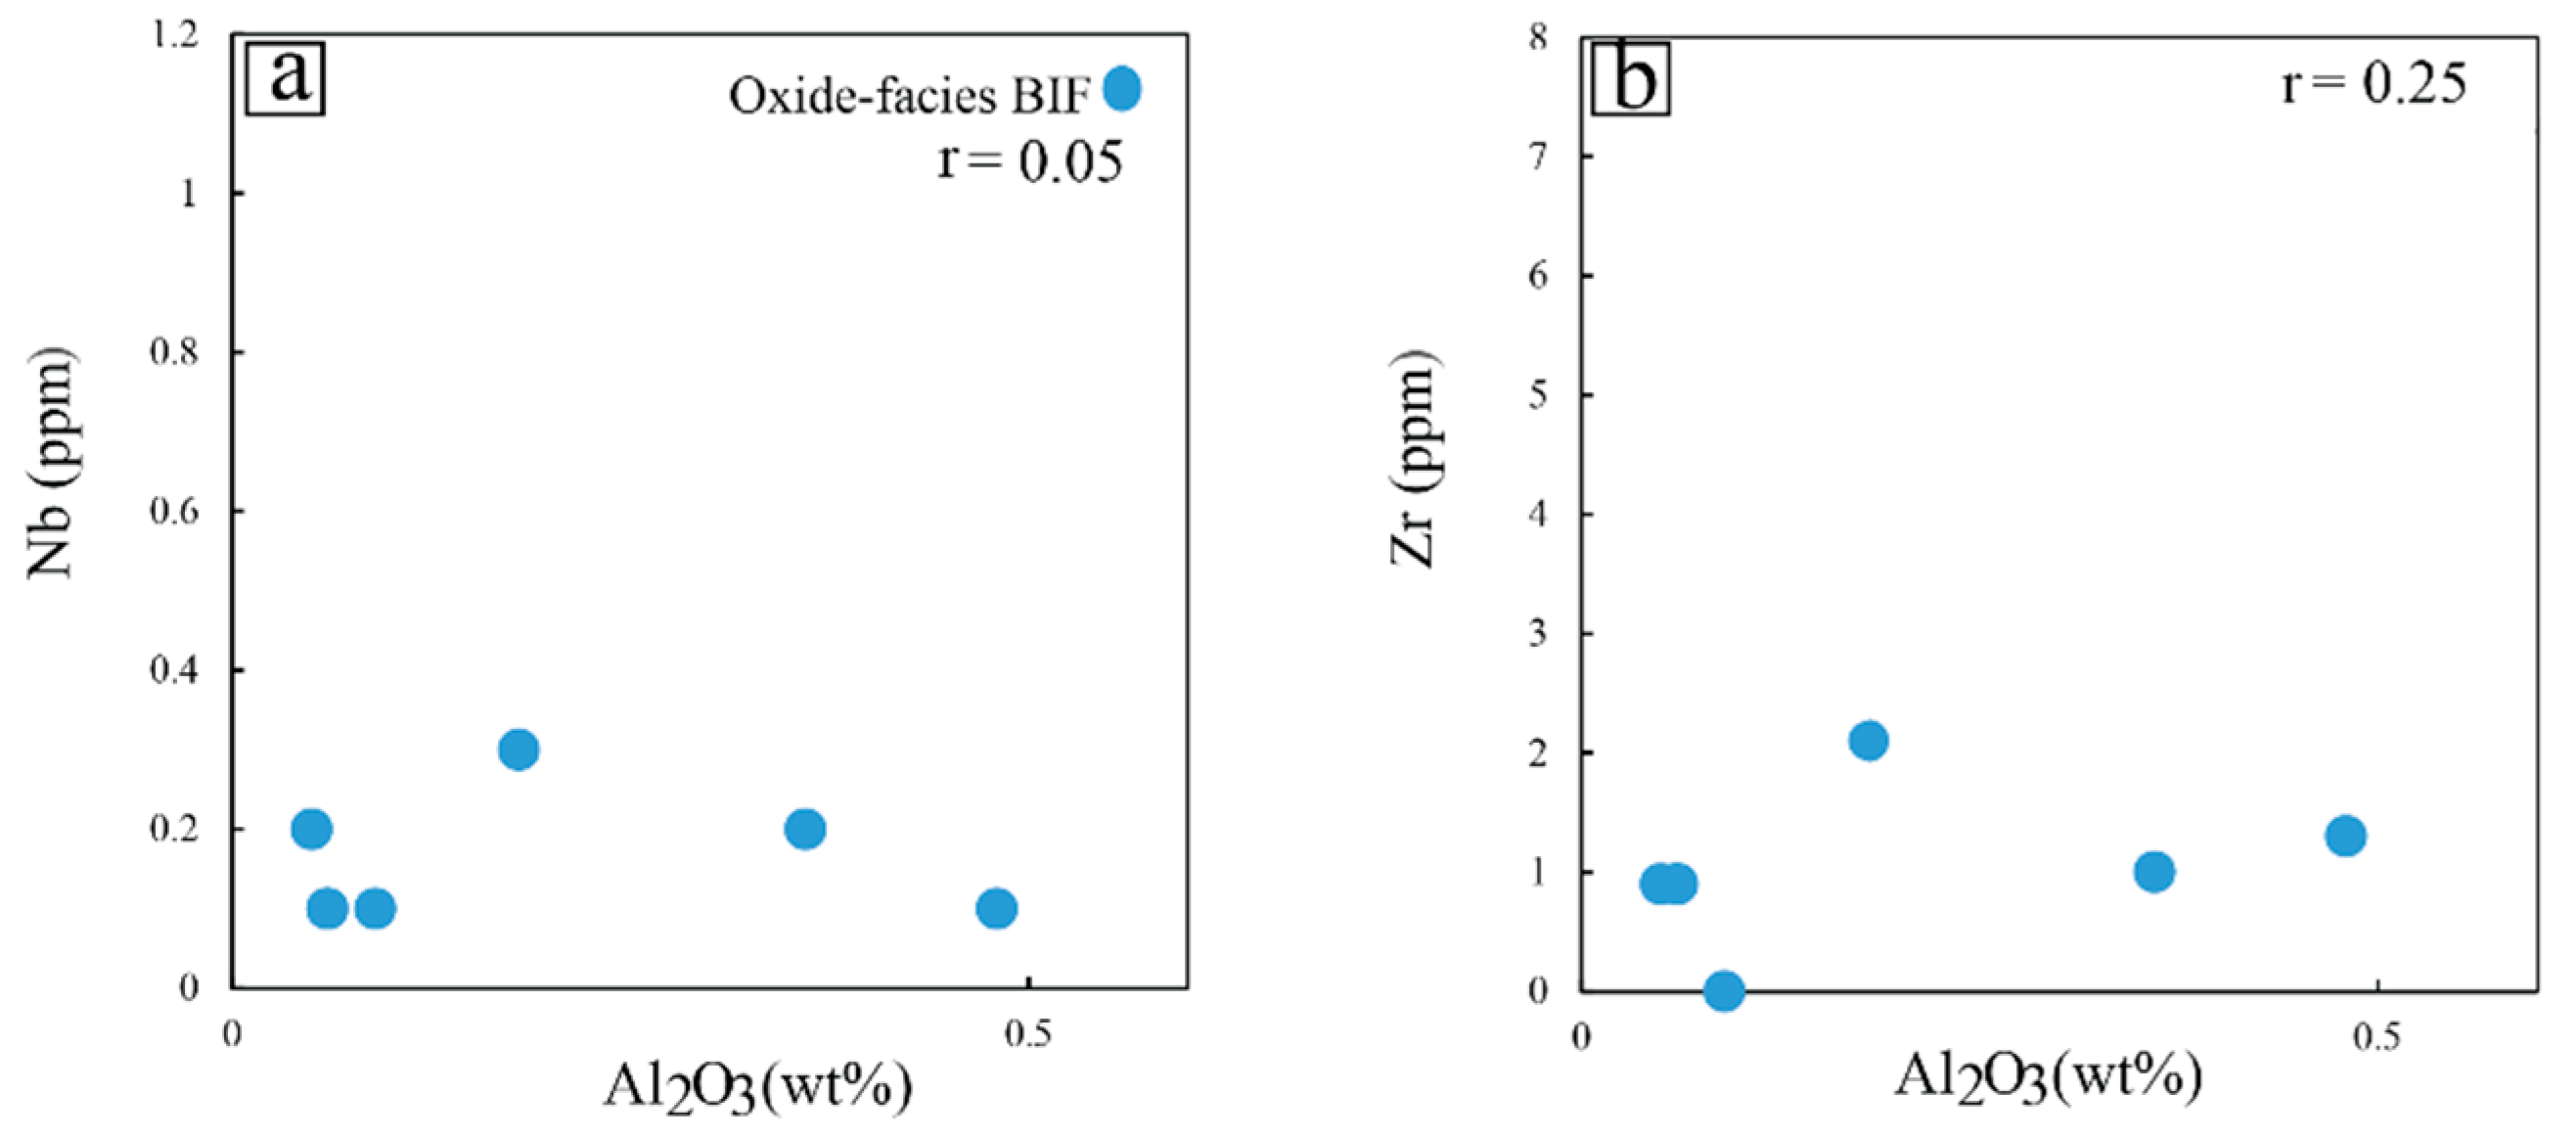
Note: (Eu/Eu*)CN, (Sm/Yb)CN, (La/Yb)CN and (Tb/Yb)CN are normalized to chondrite [48], while (Ce/Ce*)SN, (Pr/Pr* )SN, (La/Yb)SN, (Tb/Yb)SN, (Y/Y*)SN, (Sm/Yb)SN, (Eu/Sm)SN, and (Eu/Eu*)SN are normalized to PAAS [49].In the oxide facies-BIF, Nb and Al2O3 showed no or weak positive correlation (r = 0.05) (Figure 8a), while for the carbonate-oxide facies-BIF, the three samples were too few for the correlative analysis and therefore were not plotted in Figure 8. In addition, Zr and Al2O3 were weakly positively correlated in the oxide facies-BIF (r = 0.25) (Figure 8b).

5.2.3. Rare Earth Elements

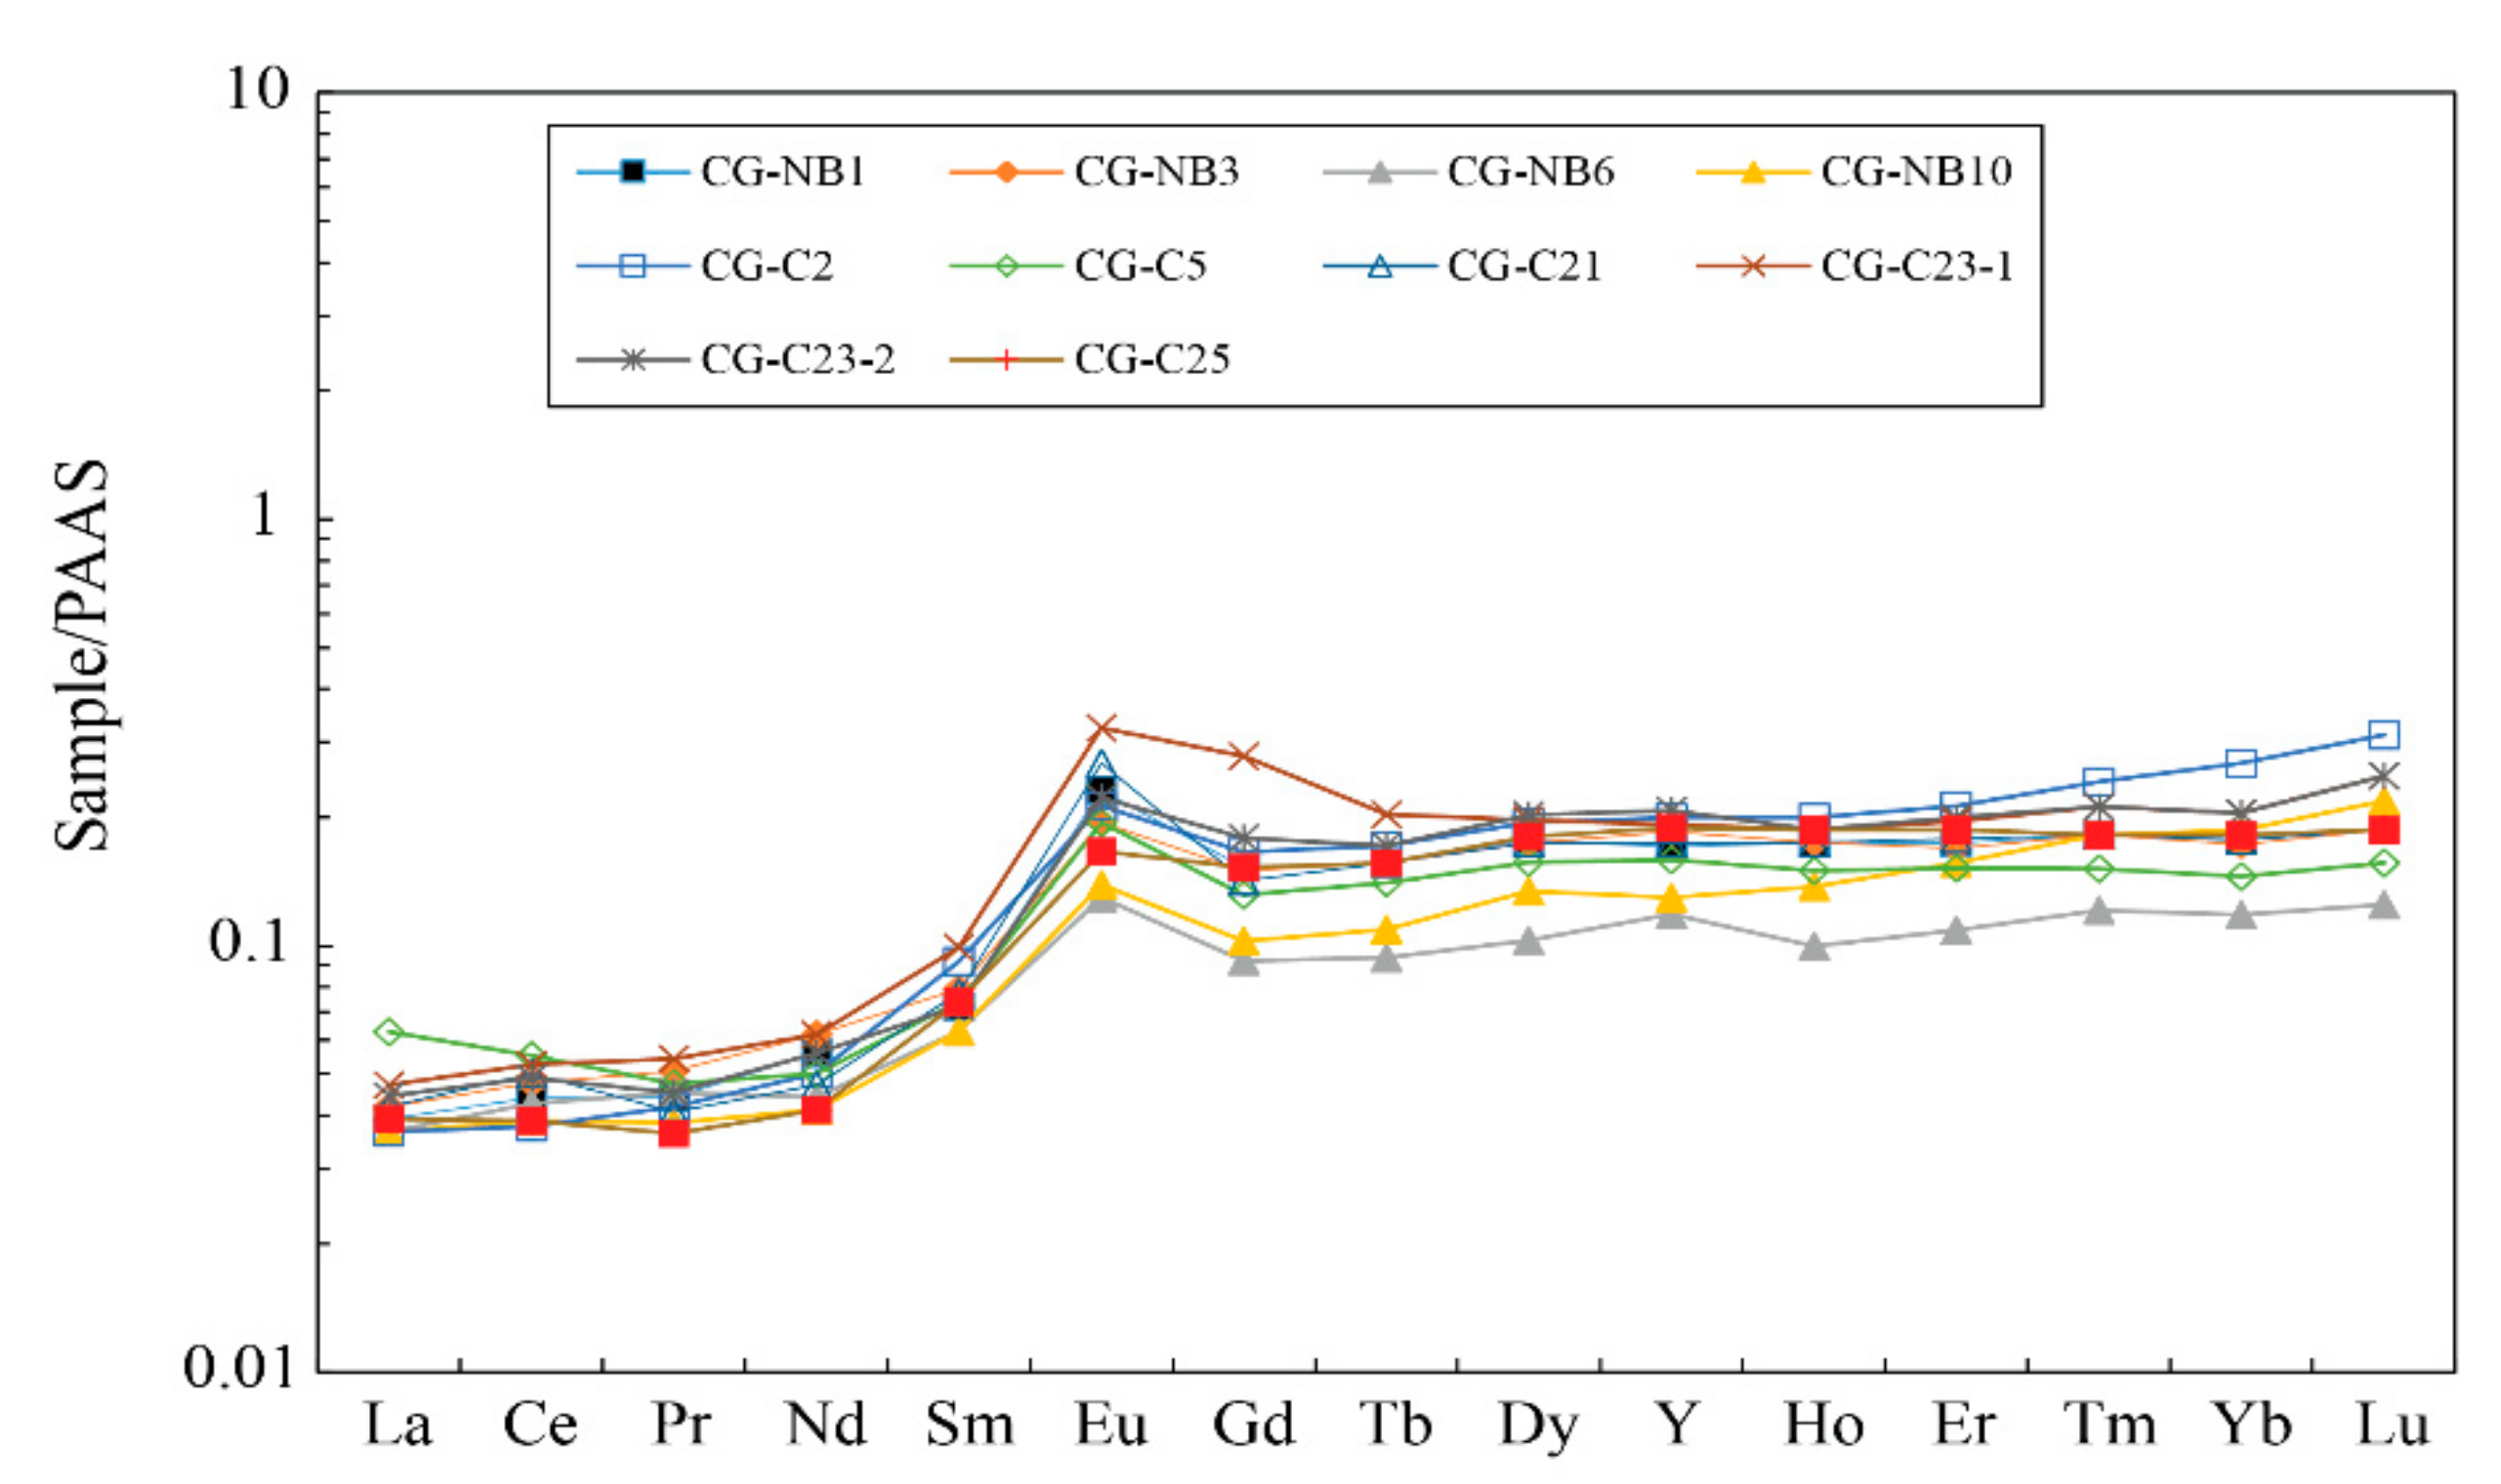
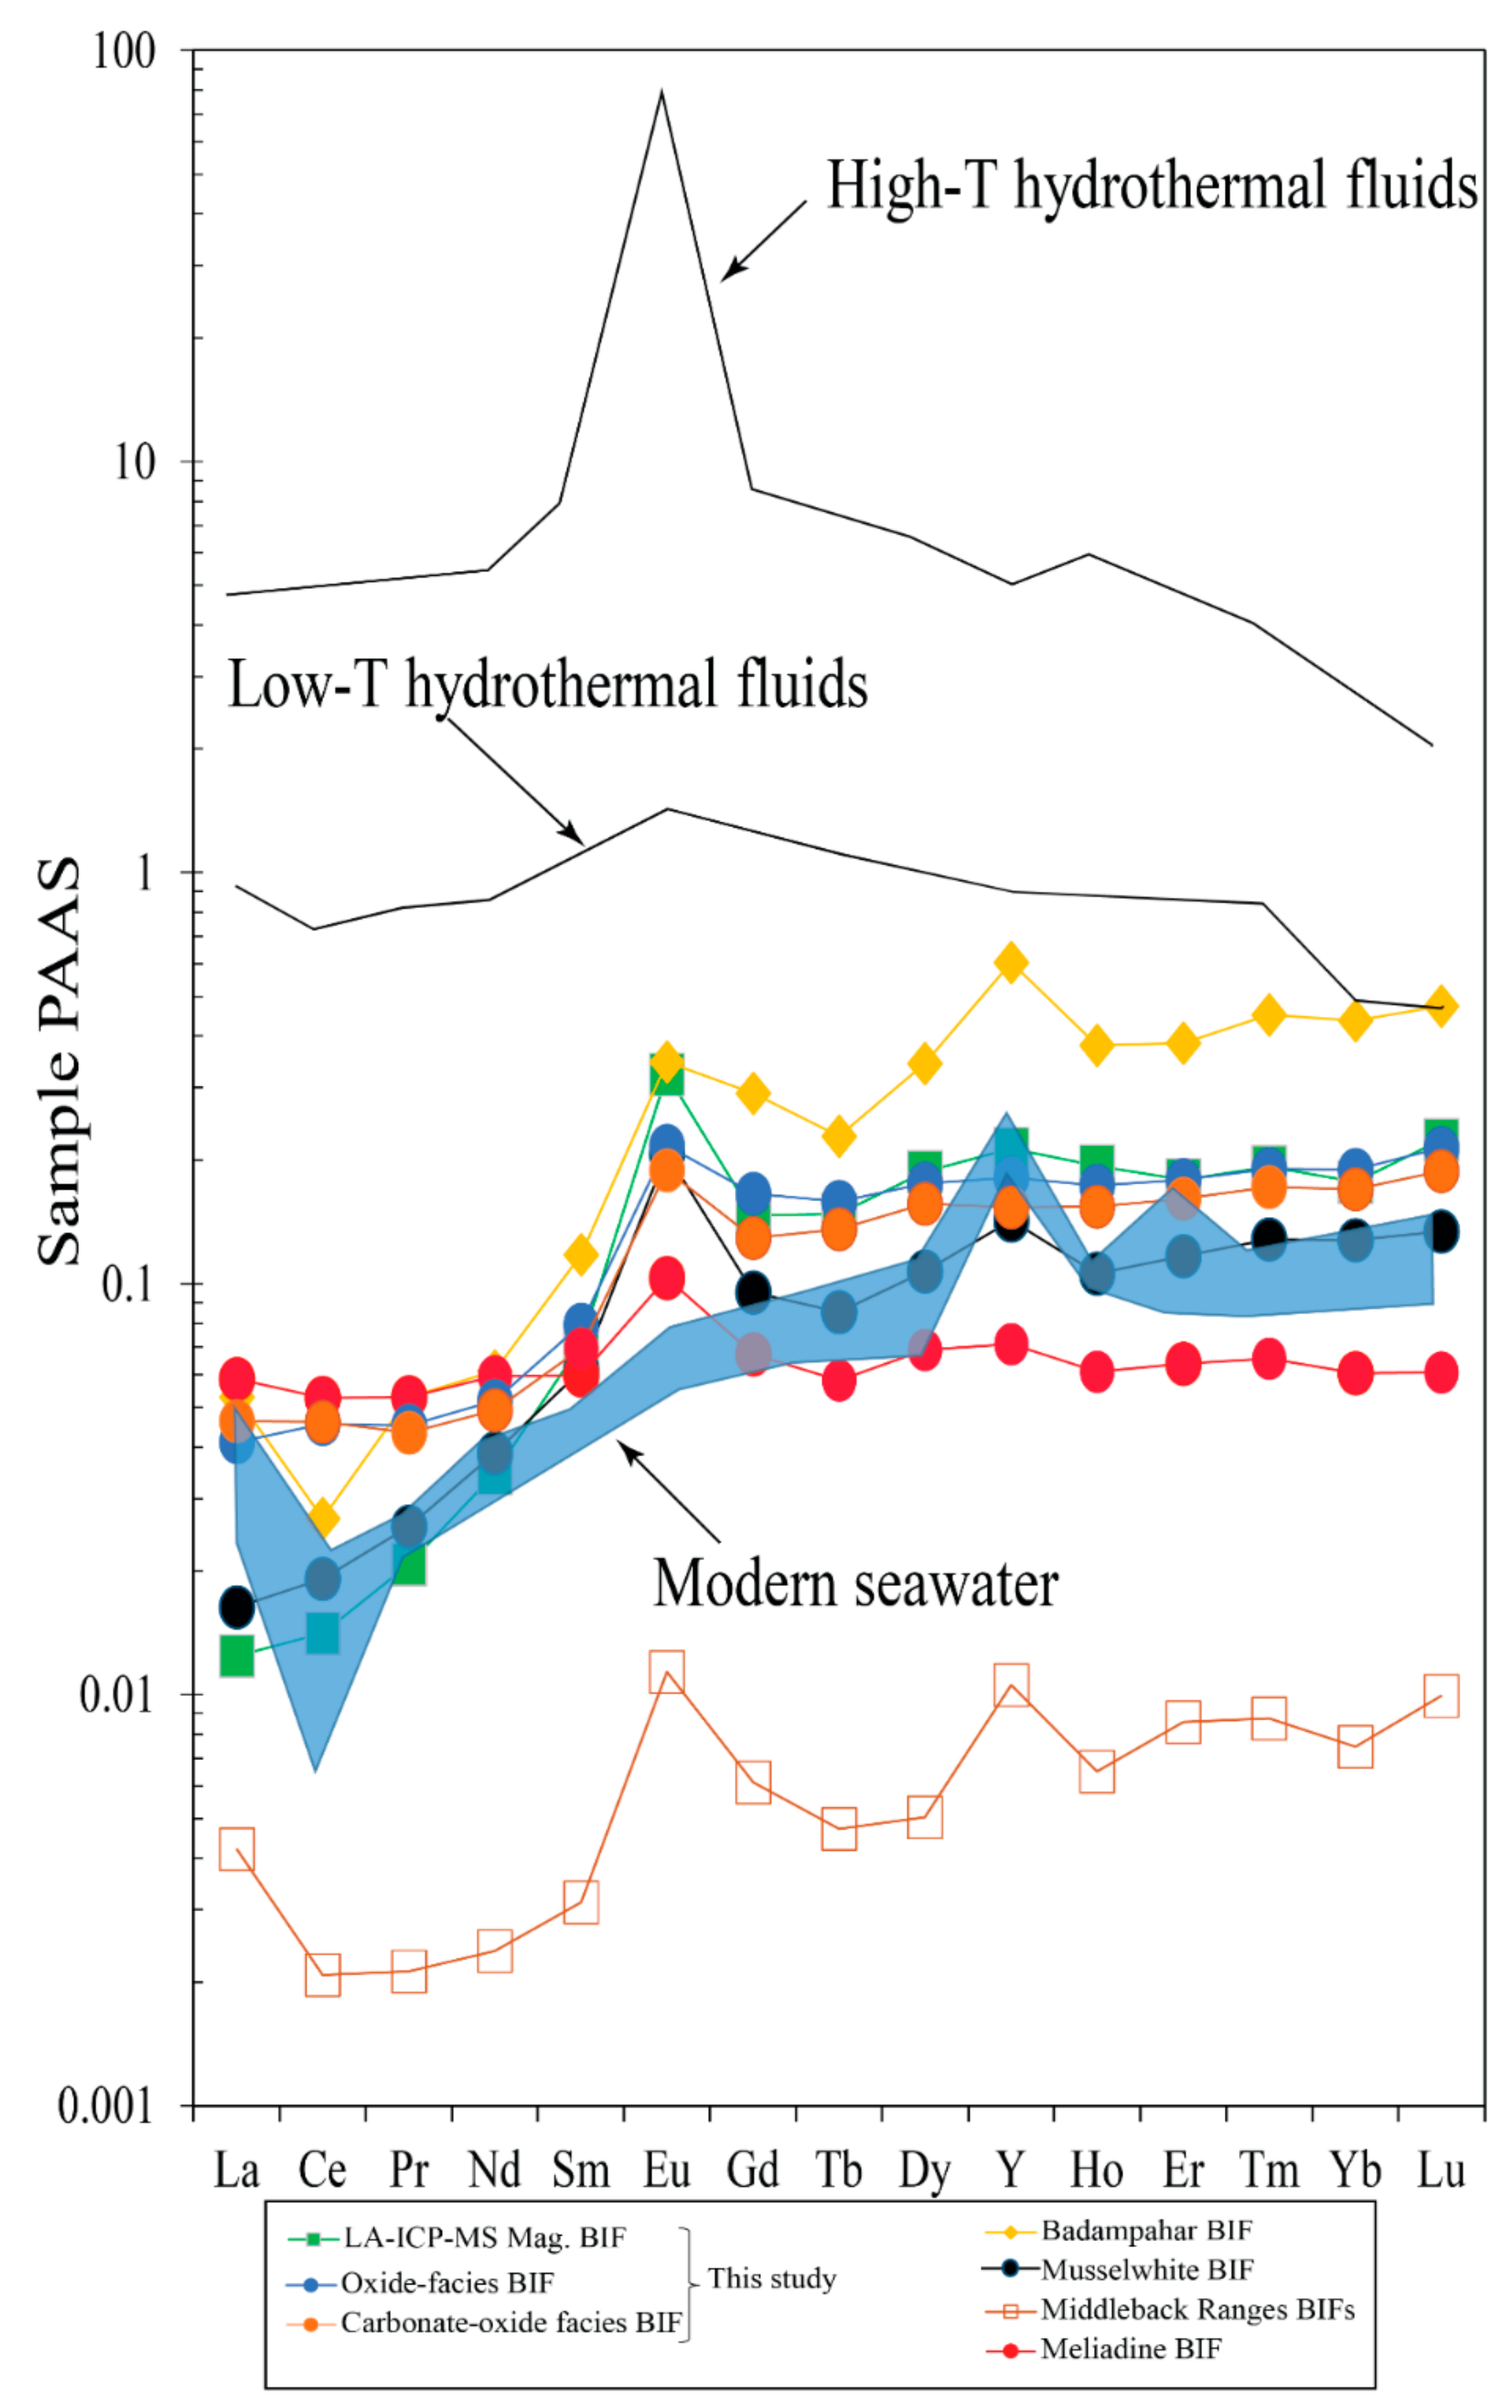
The Nabeba BIF had generally low total REE contents (ΣREE = 8.32–12.11 ppm), with an average of 10.06 ppm for the oxide facies-BIF and 9.81 ppm for the carbonate-oxide facies-BIF samples (Table 5). The low ΣREE content feature was also reported in many other Archean BIFs [46,50,51]. The PAAS-normalized REE+Y (REY) patterns for the studied BIF were characterized by greater depletions in LREE/HREE ((La/Yb)SN = 0.23 (oxide facies-BIF) and 0.28 (carbonate-oxide facies-BIF) than MREE/HREE ((Tb/Yb)SN = 0.84 (oxide facies-BIF) and 0.81 (carbonate-oxide facies-BIF)) (Figure 9). Strong positive Eu anomalies (Eu/Eu*)SN were present in both the oxide facies-BIF (1.65–2.60) and the carbonate-oxide facies-BIF (1.77–2.32) samples. The samples also had average high (La/La*)SN values, i.e., 1.37 for the oxide facies-BIF and 1.51 for the carbonate-oxide facies-BIF.
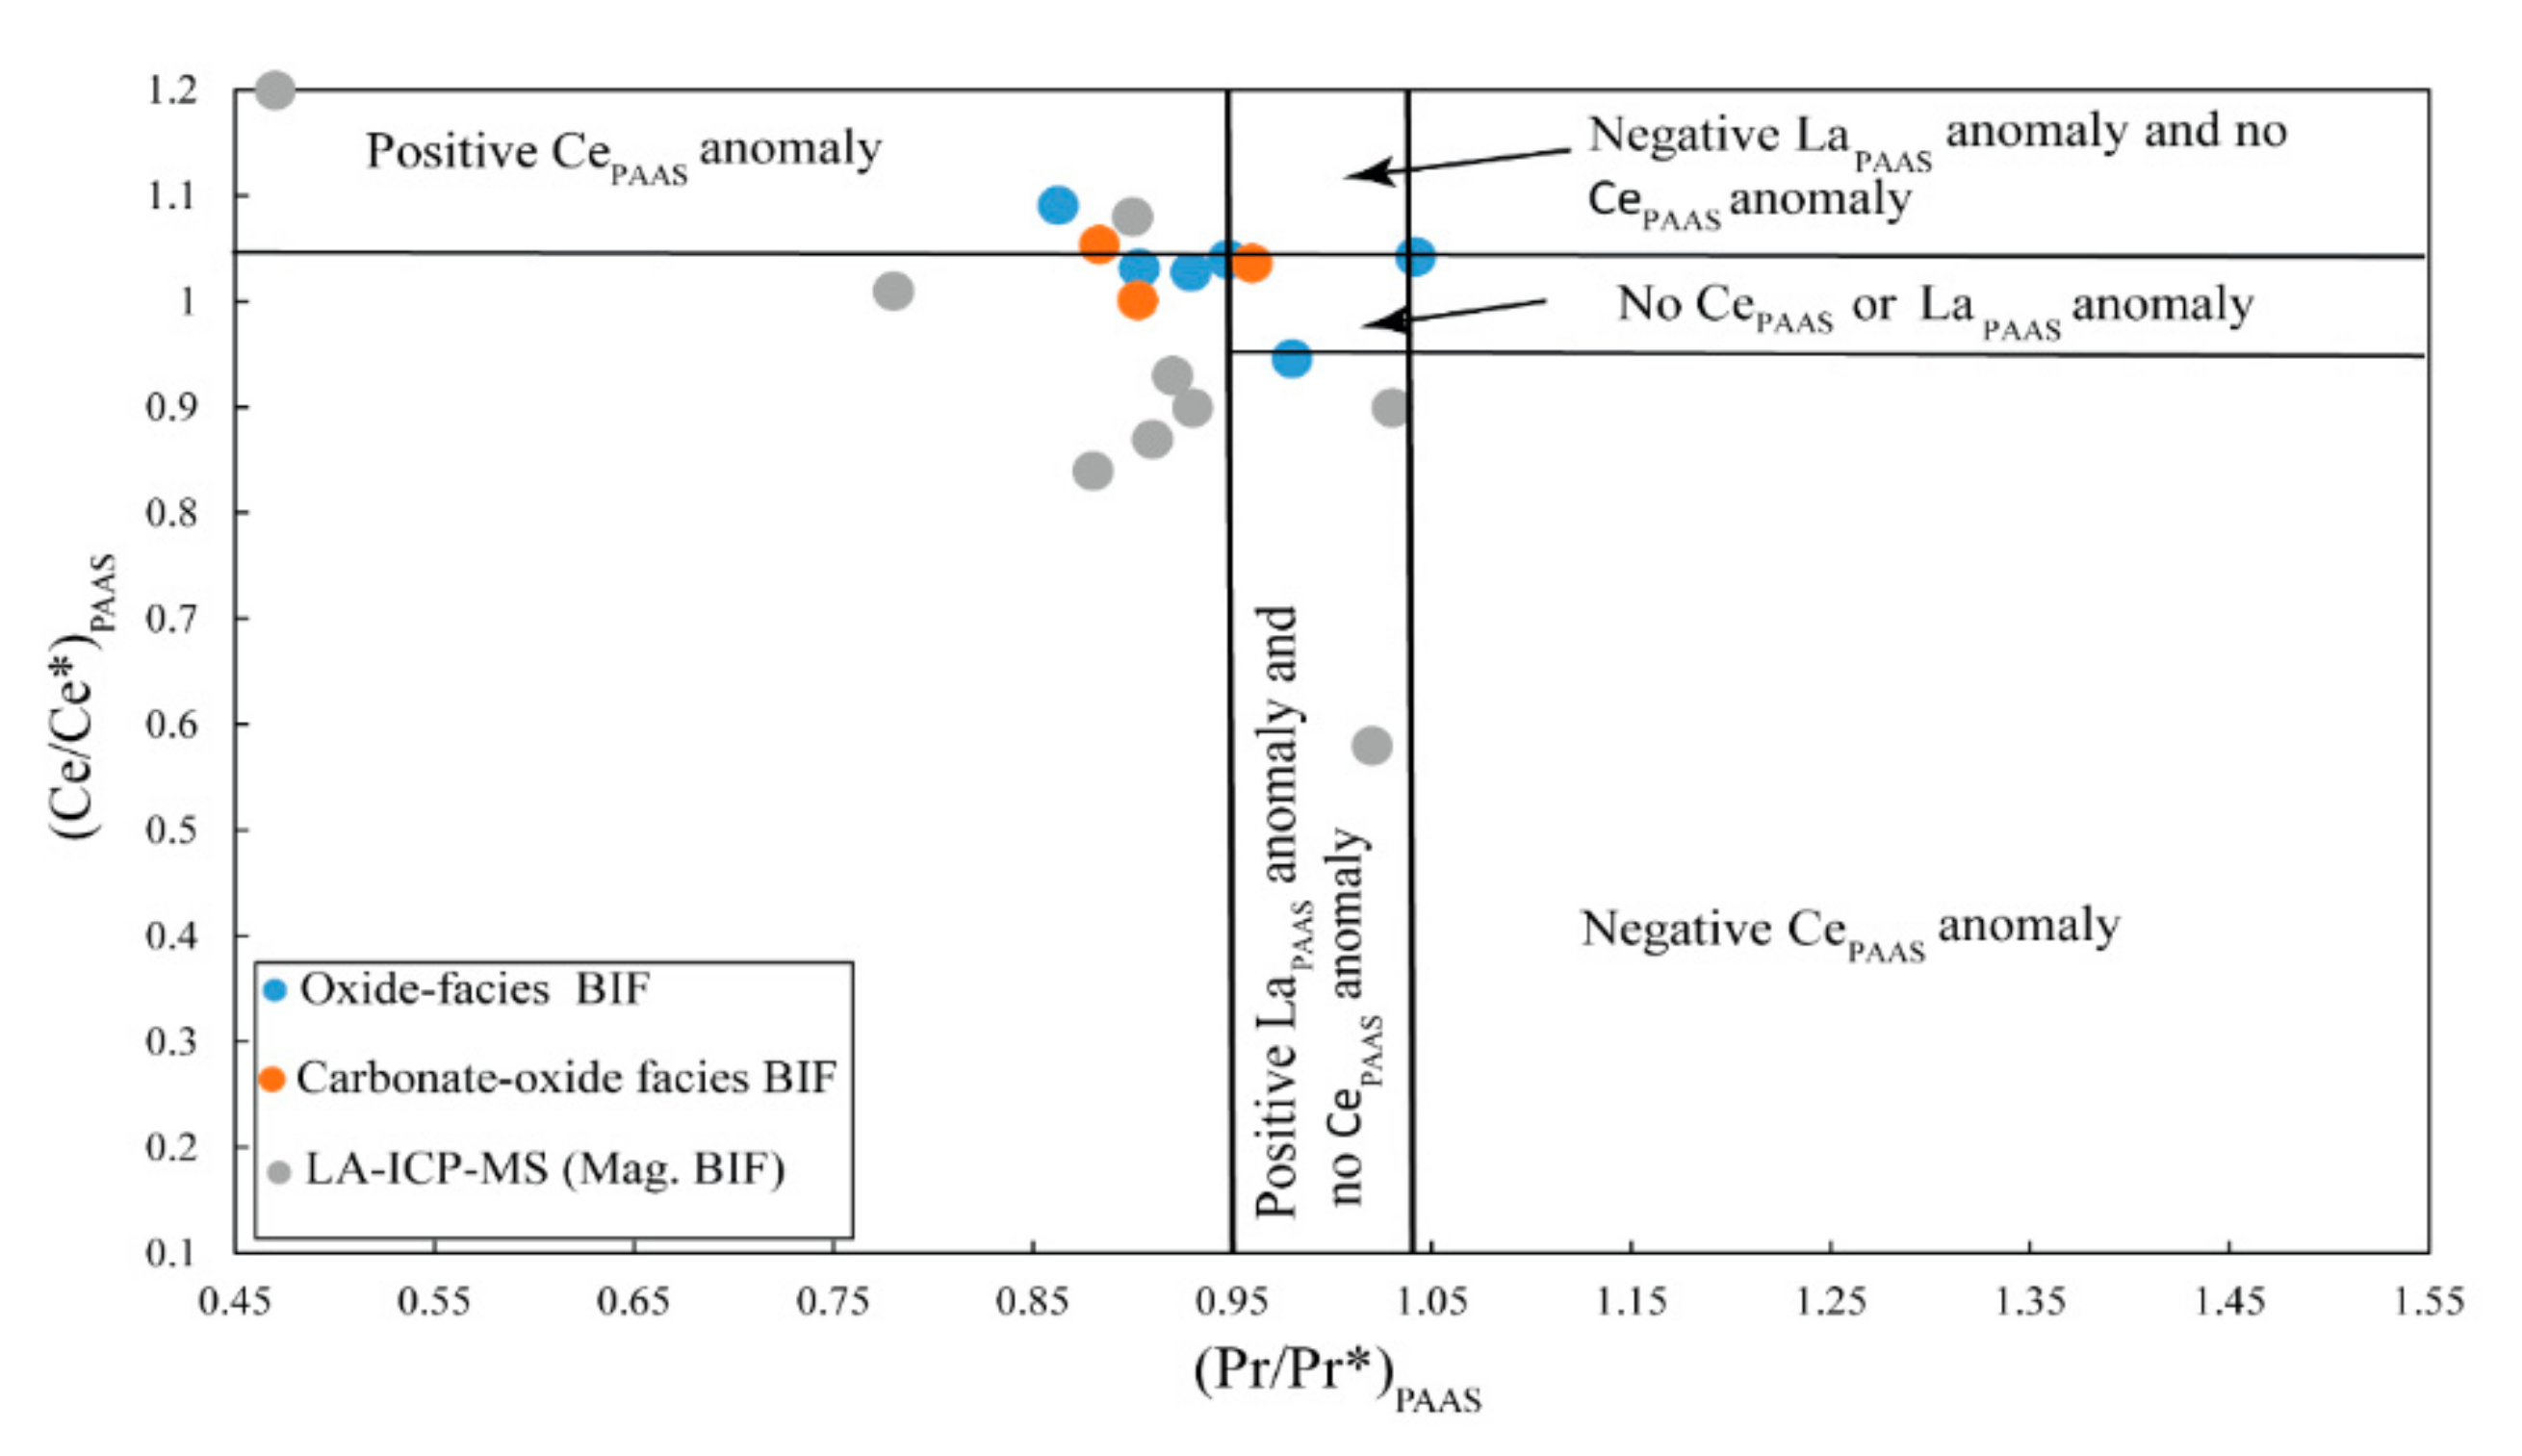
Determining Ce anomalies is often complicated due to the anomalous behavior of La. Bau and Dulski [3] suggested the use of Ce/Ce* vs. Pr/Pr* diagram to determine La and Ce anomalies in BIFs. The Ce/Ce* and the Pr/Pr* ratios were calculated as CeSN/(0.5 LaSN + 0.5 PrSN) and as PrSN/(0.5 CeSN + 0.5 NdSN), respectively. The Ce/Ce* vs. Pr/Pr* plot indicated that the majority of our samples had no negative Ce anomalies and had very small to negligible positive La and Ce anomalies (Figure 10).

5.3. LA-ICP-MS Magnetite Chemical Compositions

5.3.1. Magnetite in the Oxide Facies-BIF

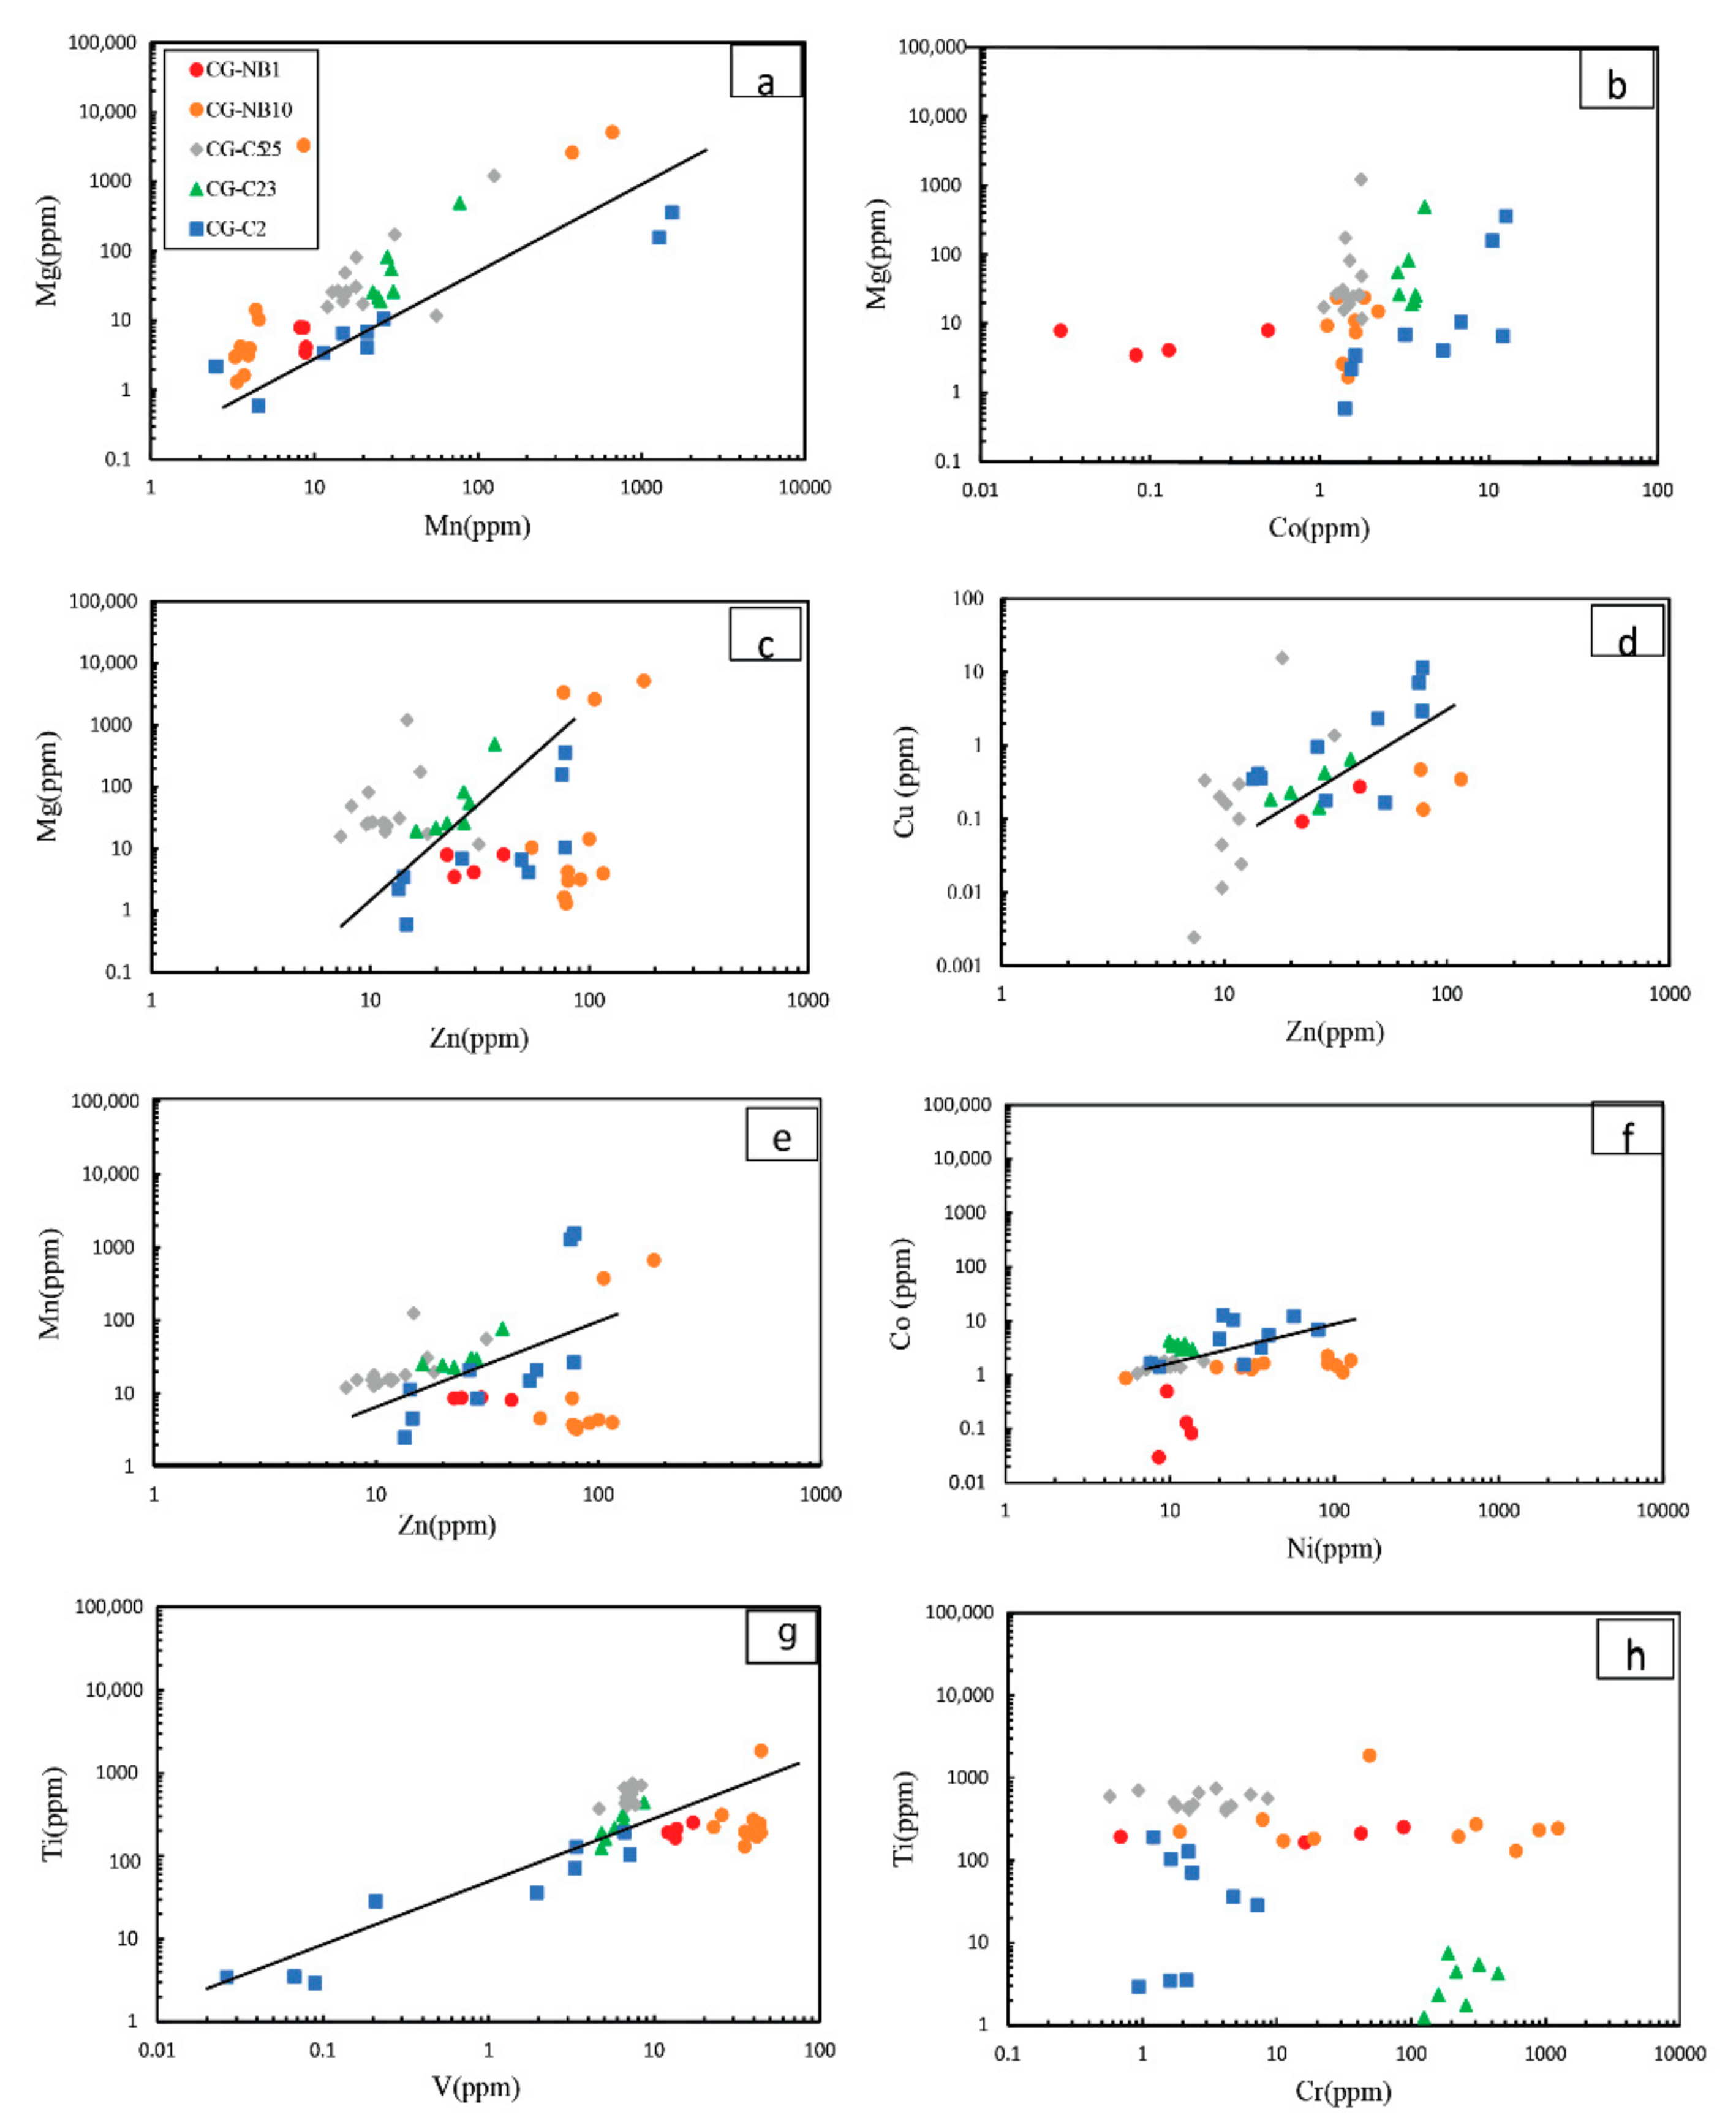
Elemental contents of magnetite from the Nabeba oxide facies-BIF varied considerably (Table S1), except for SiO2 (0.07–9.40 wt.%), which was attributed to the presence of quartz near the analysis spot. Contents of other major element oxides (e.g., MgO and MnO) were very low (<0.01 wt.%), while those of most trace elements were either close to the detection limit or showed insignificant concentration change, although Ni (6.37–80.00 ppm), Co (1.06–12.70 ppm), Zn (7.34–77.80 ppm), and Y (0.17–50.80 ppm) displayed high values (Table S1). Magnetite trace element contents of the oxide facies-BIF differed widely, as shown in Mg vs. Mn (r = 0.25), Mn vs. Zn (r = 0.67), Ti vs. V (r = 0.8), Cu vs. Zn (r = 0.47), Co vs. Ni (r = 0.59), and Ti vs. Cr (r = 0.81) diagrams, indicating positive correlations. A few trace elements had narrow concentration ranges (within one order of magnitude), and they had no or weak positive correlations, i.e., Mg vs. Zn (r = 0.08) and Mg vs. Co (r = 0.08) (Figure 11b,c).
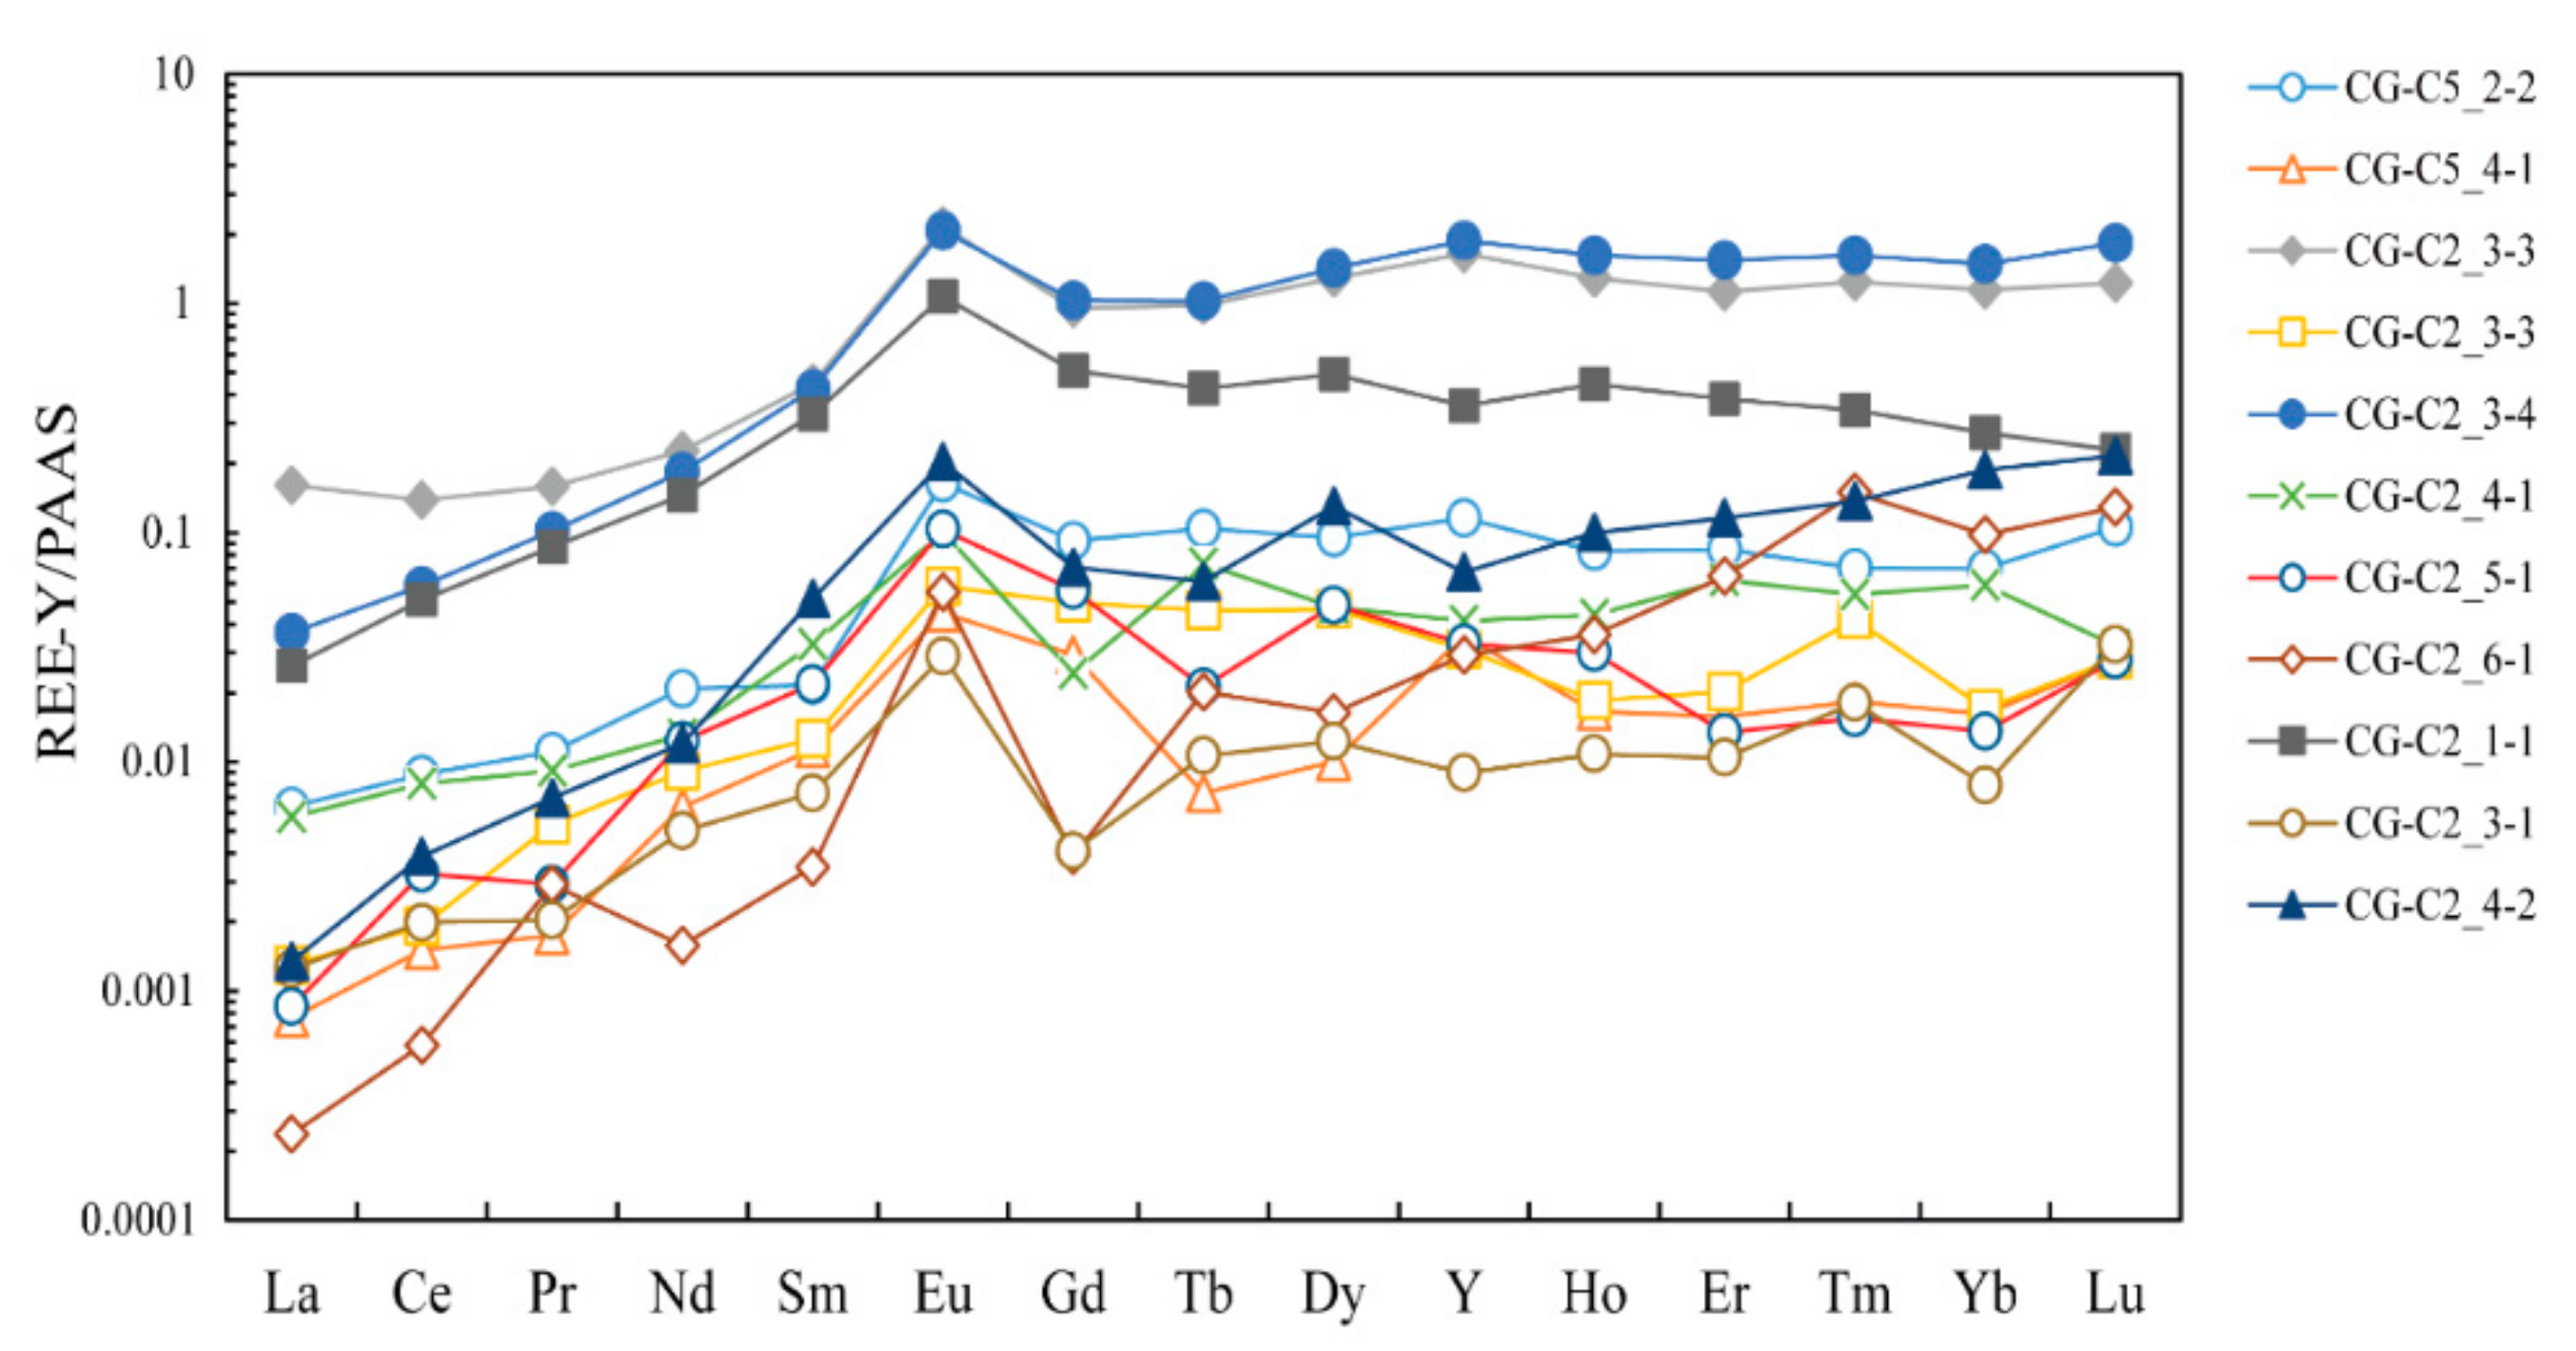
The magnetite REY contents of the Nabeba oxide facies-BIF were generally above the detection limits (Table S1). The PAAS-normalized REY patterns were characterized by LREE/HREE depletions (Nd/Yb = 0.012–0.674) and MREE/HREE depletions (Sm/Yb = 0.0282–0.9572) (Figure 12), with the exception of Mag/5–1 (sample CG-C2) that had weak MREE/HREE enrichment (Sm/Yb = 1.279). The PAAS-normalized REY patterns also showed negative to weak positive La anomalies (0.0805–0.9976) and weak (negative or positive) Y (Y/Y* = 0.4656–2.1268) and positive Eu (Eu/Eu* = 1.9963–5.4061) anomalies. Negligible to moderate positive Ce (Ce/Ce* = 0.3676–1.7234) and Gd (Gd/Gd* = 0.3034–3.745) anomalies were also found in our samples. The super-chondritic Y/Ho ratios = 18.219–45.336, with an exceptionally high ratio for Mag/4–1 (Y/Ho = 57.70) and Mag/6–1 (Y/Ho = 91.62).

5.3.2. Magnetite in Carbonate-Oxide Facies-BIF

Apart from the high major iron oxide content, other major element oxides (e.g., MgO, MnO and TiO2) had concentrations generally below 2 wt.% (Table S2).
Compared to the magnetite samples from the oxide facies BIF, REY contents of most magnetite samples from the carbonate-oxide facies BIF were below the detection limit, which might have been due to poor signals and/or alterations. This explains the very few data points used for the carbonate-oxide facies BIF. The data were not used in the bivariate plots to test for any correlations between analysed elements. Correlations based on bivariate plots for the Nabeba BIF were done using the whole rock geochemical data (Figure 8) and the magnetite LA-ICP-MS data for oxide-facies and carbonate-oxide-facies BIF (Figure 11). The magnetite LA-ICP-MS data for carbonate-oxide facies BIF were used cautiously, with emphasis on (1) the nature of the REY patterns when compared with other well-studied BIFs and the Nabeba oxide facies BIF in this study, and (2) the absolute values (i.e., amounts) of the elemental concentrations and whether they were higher or lower than the concentrations in the oxide facies BIF’.

6. Discussion

6.1. Primary Geochemical Signature of the Nabeba BIF Magnetite

The primary iron minerals (e.g., Fe-oxyhydroxide) in most Archean BIFs were modified by later diagenesis and regional metamorphism [52]. These assertions in which magnetite in BIF were formed by diagenetic and/or metamorphic processes are illustrated by the following three equations:
(1)
2Fe(OH)3 + Fe2+→Fe3O4 + 2H2O + 2H+ [26,53];
(2)
12Fe(OH)3 + CH2O→4Fe3O4 + CO2 + 19H2O [54];
(3)
Fe(OH)2·2Fe(OH)3→Fe3O4 + 4H2O [52].
Recent studies [3,29,55] showed that the separation of Y and REE in the ambient seawater column represents depletions in LREEs relative to HREEs, in association with Y and La positive anomalies, which is explained by the preferential removal of these elements in organic matter, Fe oxyhydroxides, and clay minerals. Magnetite is the most abundant iron oxide mineral in both facies of the Nabeba BIF. In order to use the magnetite as a proxy for understanding the environment of deposition, it is essential to establish whether the Nabeba BIF magnetite retained the REY signature of the precursor minerals, notably Fe oxyhydroxides [1,4,56,57,58,59,60].
In our study, the magnetite REY patterns in the two-facies BIF samples showed LREE/HREE and MREE/HREE depletions, negative to slightly positive La anomalies, slightly negative to positive Y anomalies and positive Eu anomalies, negligible to weak positive Ce and Gd anomalies, and super-chondritic Y/Ho ratios (Table S1). The Nabeba BIF magnetite showed similar REY characteristics as those in other well-studied Archean BIF magnetites from Isua, North Caribou, Temagami [61], Badampahar [62], and Musselwhite and Meliadine BIFs [30], regardless of their diagenetic, later metamorphic, and hydrothermal histories. The similarity with magnetite data of the other well-studied BIFs indicates that the Nabeba BIF magnetite possesses the primary geochemical signatures that would be useful in determining the depositional environment and the genesis of the Nabeba BIF.

6.2. Characterization of the Nabeba BIF Depositional Environment

6.2.1. Purity of the Nabeba BIF Based on Amount of Detrital Input

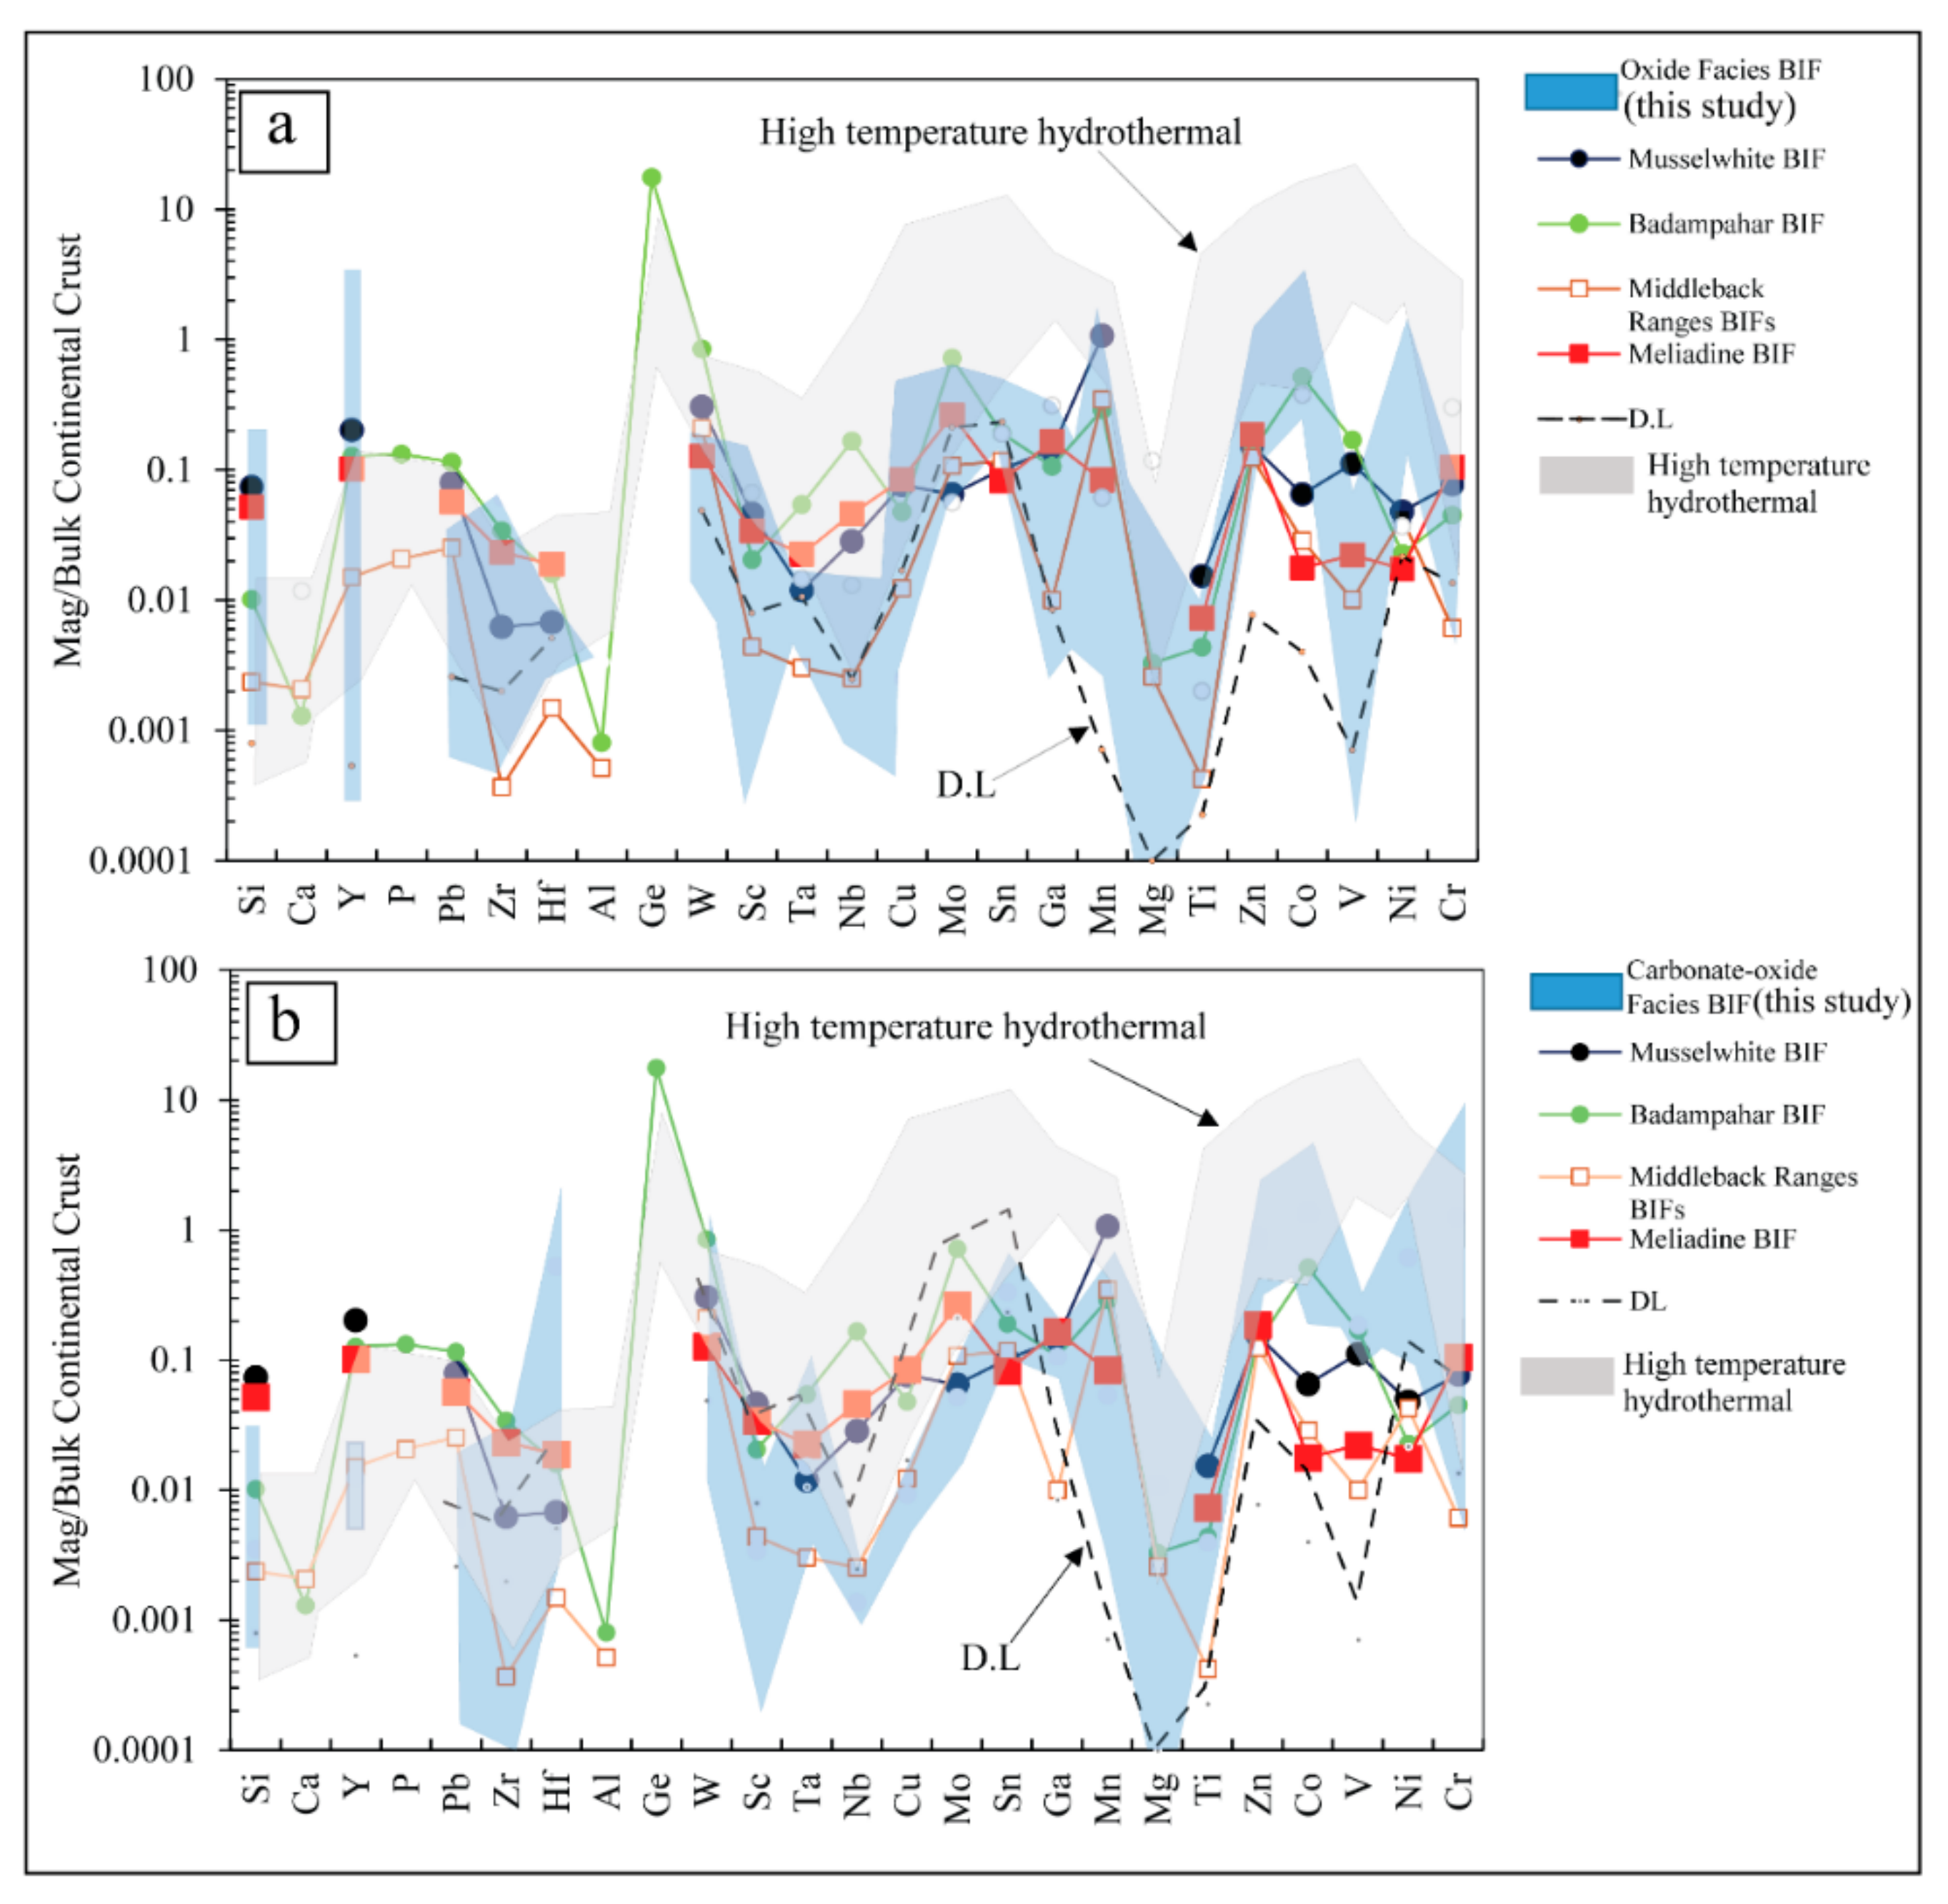
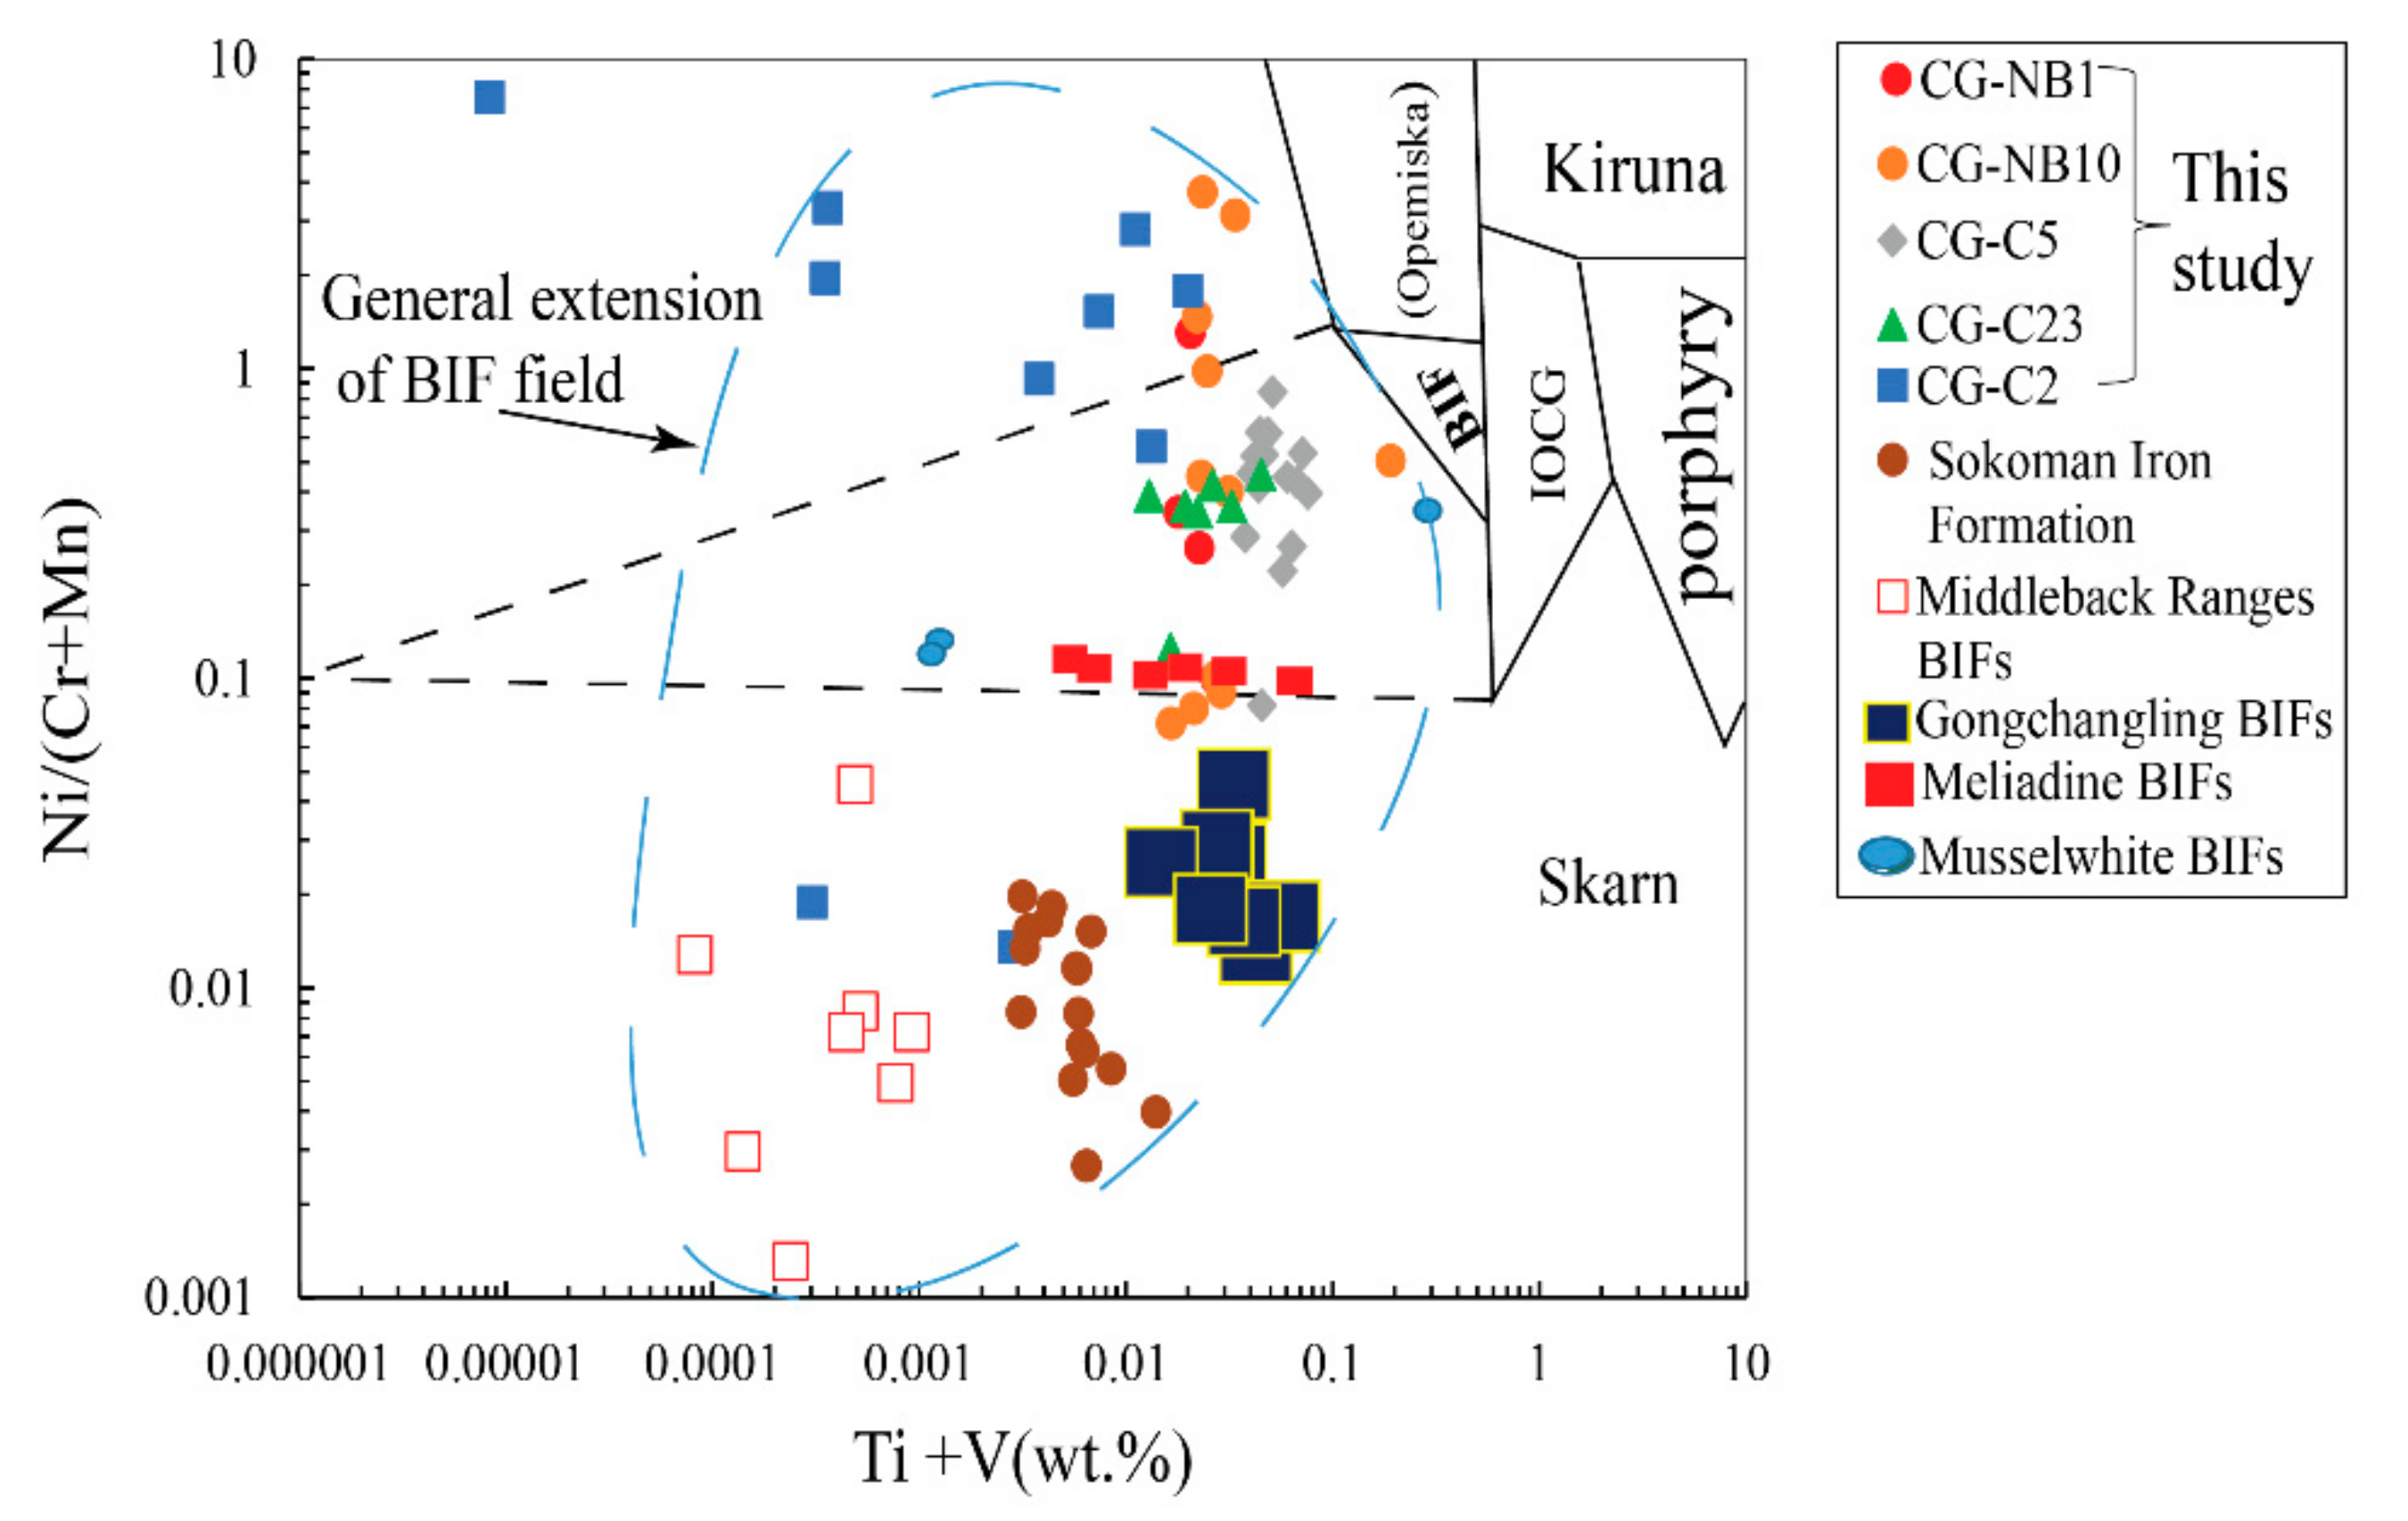
The magnetite trace element contents of the Nabeba BIF were generally similar to those of other BIFs (e.g., Meliadine and Musselwhite), except for the high Y-Ni contents in the former (Figure 13a,b). Most of our samples were plotted in the extended BIF field of Gourcerol et al. [30] and overlapped with the extended field of Sun et al. [32] (Figure 14).
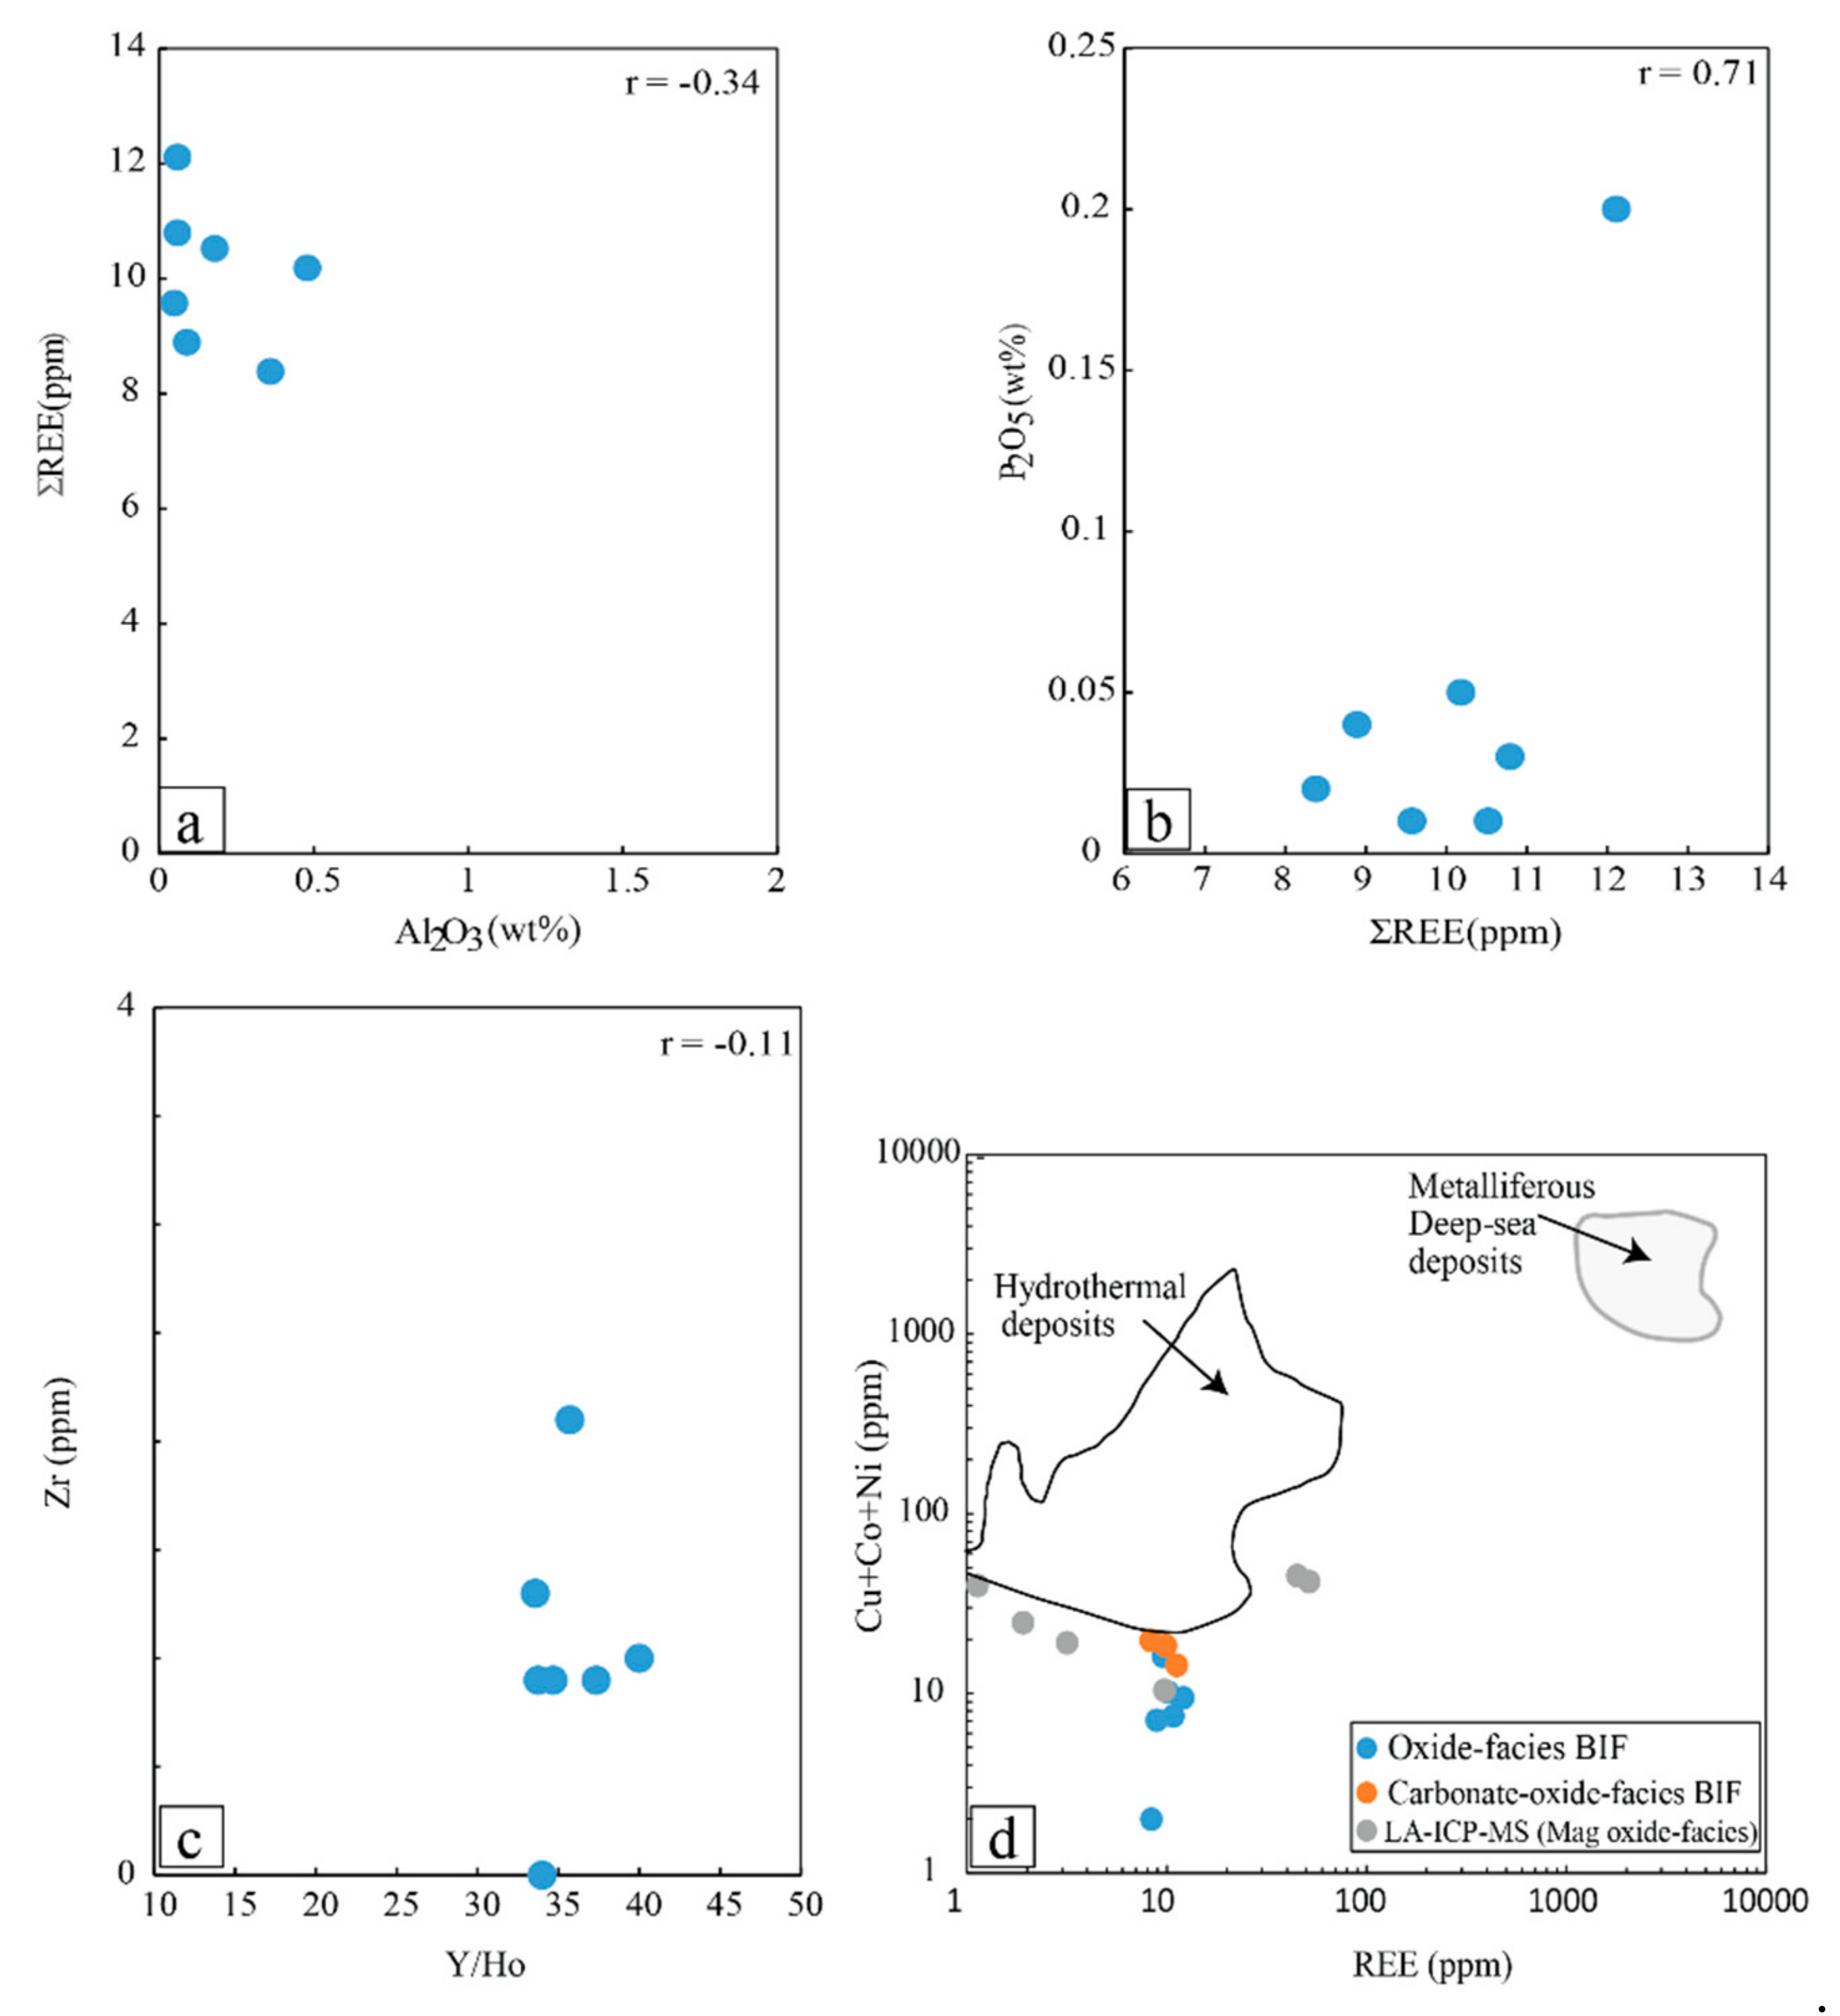
Since BIFs are formed by chemical precipitation, any detrital input would produce high contents of Al2O3 and TiO2 and correlations between HFSE contents and REE ratios (e.g., La/La*, Y/Ho, Pr/Yb, and Ce/Ce*) [66,67,68]. As we mentioned previously, the three samples of carbonate-oxide facies BIF were not good for correlation such as in Figure 15, but we used their element ratios to discuss other aspects of the BIF characterisictics. Thus, the variations and the negative correlations of low Al2O3 concentrations with SiO2 and the weak ΣREE vs. Al2O3 correlations in the oxide-facies BIF samples (Table 3 and Table 4; Figure 15a) suggested insignificant detrital input in the Nabeba BIF formation [5,67,69,70]. However, the strong positive ΣREE vs. P2O5 correlation in oxide-facies indicated that P2O5 controlled REY contents during the BIF precipitation (Figure 15). Slight negative Zr vs. Y/Ho correlation (r = −0.11; Figure 15c) of the oxide-facies BIF further argued against detrital (terrigenous) contamination during the BIF chemical precipitation [71].
Meanwhile, hydrothermal input into the Nabeba chemical sediments was implied from the high average Si/Al (oxide facies: 772; carbonate-oxide facies: 326) and Fe/Al (oxide facies: 708; carbonate-oxide facies: 474) [14,72,73]. In the ΣREE vs. (Co+Ni+Cu) diagram [5,74], samples of both facies were plotted close to the hydrothermal deposit field (Figure 15d), implying that the main constituents (Si and Fe) of the Nabeba BIF originated from hydrothermal fluids. The close-superchondritic Y/Ho ratio (~35) in the Nabeba BIF samples suggested that this signature was inherited from hydrothermal fluid that had not undergone significant decoupling of Y from REE [70,75,76]. In Figure 13, all the Nabeba BIF magnetite data from both facies were plotted below the high-T magmatic-hydrothermal field [63] and exhibited moderate Eu anomalies (Figure 16). This suggested that the Nabeba BIF precipitated from medium-temperature fluids or a mixture of high-temperature hydrothermal vent fluids (T = ~250 °C) with cold ambient seawater.

6.2.2. Fluid Mixing and T-fO2 Conditions of Nabeba BIF Precipitation

The Nabeba BIF magnetite and the whole-rock samples had weak positive Ce anomalies (except for two samples of CG-NB3 and CG-NB6) (Figure 10). Their REY distribution patterns showed LREE depletions, a mild Ce incongruity, and marked positive anomalies for Eu and weakly positive to negligible Y (Figure 16). This indicated that the Nabeba BIF formation was likely influenced by reduced bottom water [77] and the chemical precipitates were derived from a mixture of anoxic seawater and medium-to-high-temperature hydrothermal fluids. Similar geochemical trends were found in the magnetite from many well-studied Archean BIFs, such as Musselwhite and Meliadine [30], Badampahar [62], and Middle Back Ranges [33]. This implied that, despite the overprinting diagenetic, metamorphic, and hydrothermal processes, the Nabeba magnetite still retained the geochemical signature of the fluid mixing that formed the original Nabeba chemical precipitates on the paleo-seafloor.
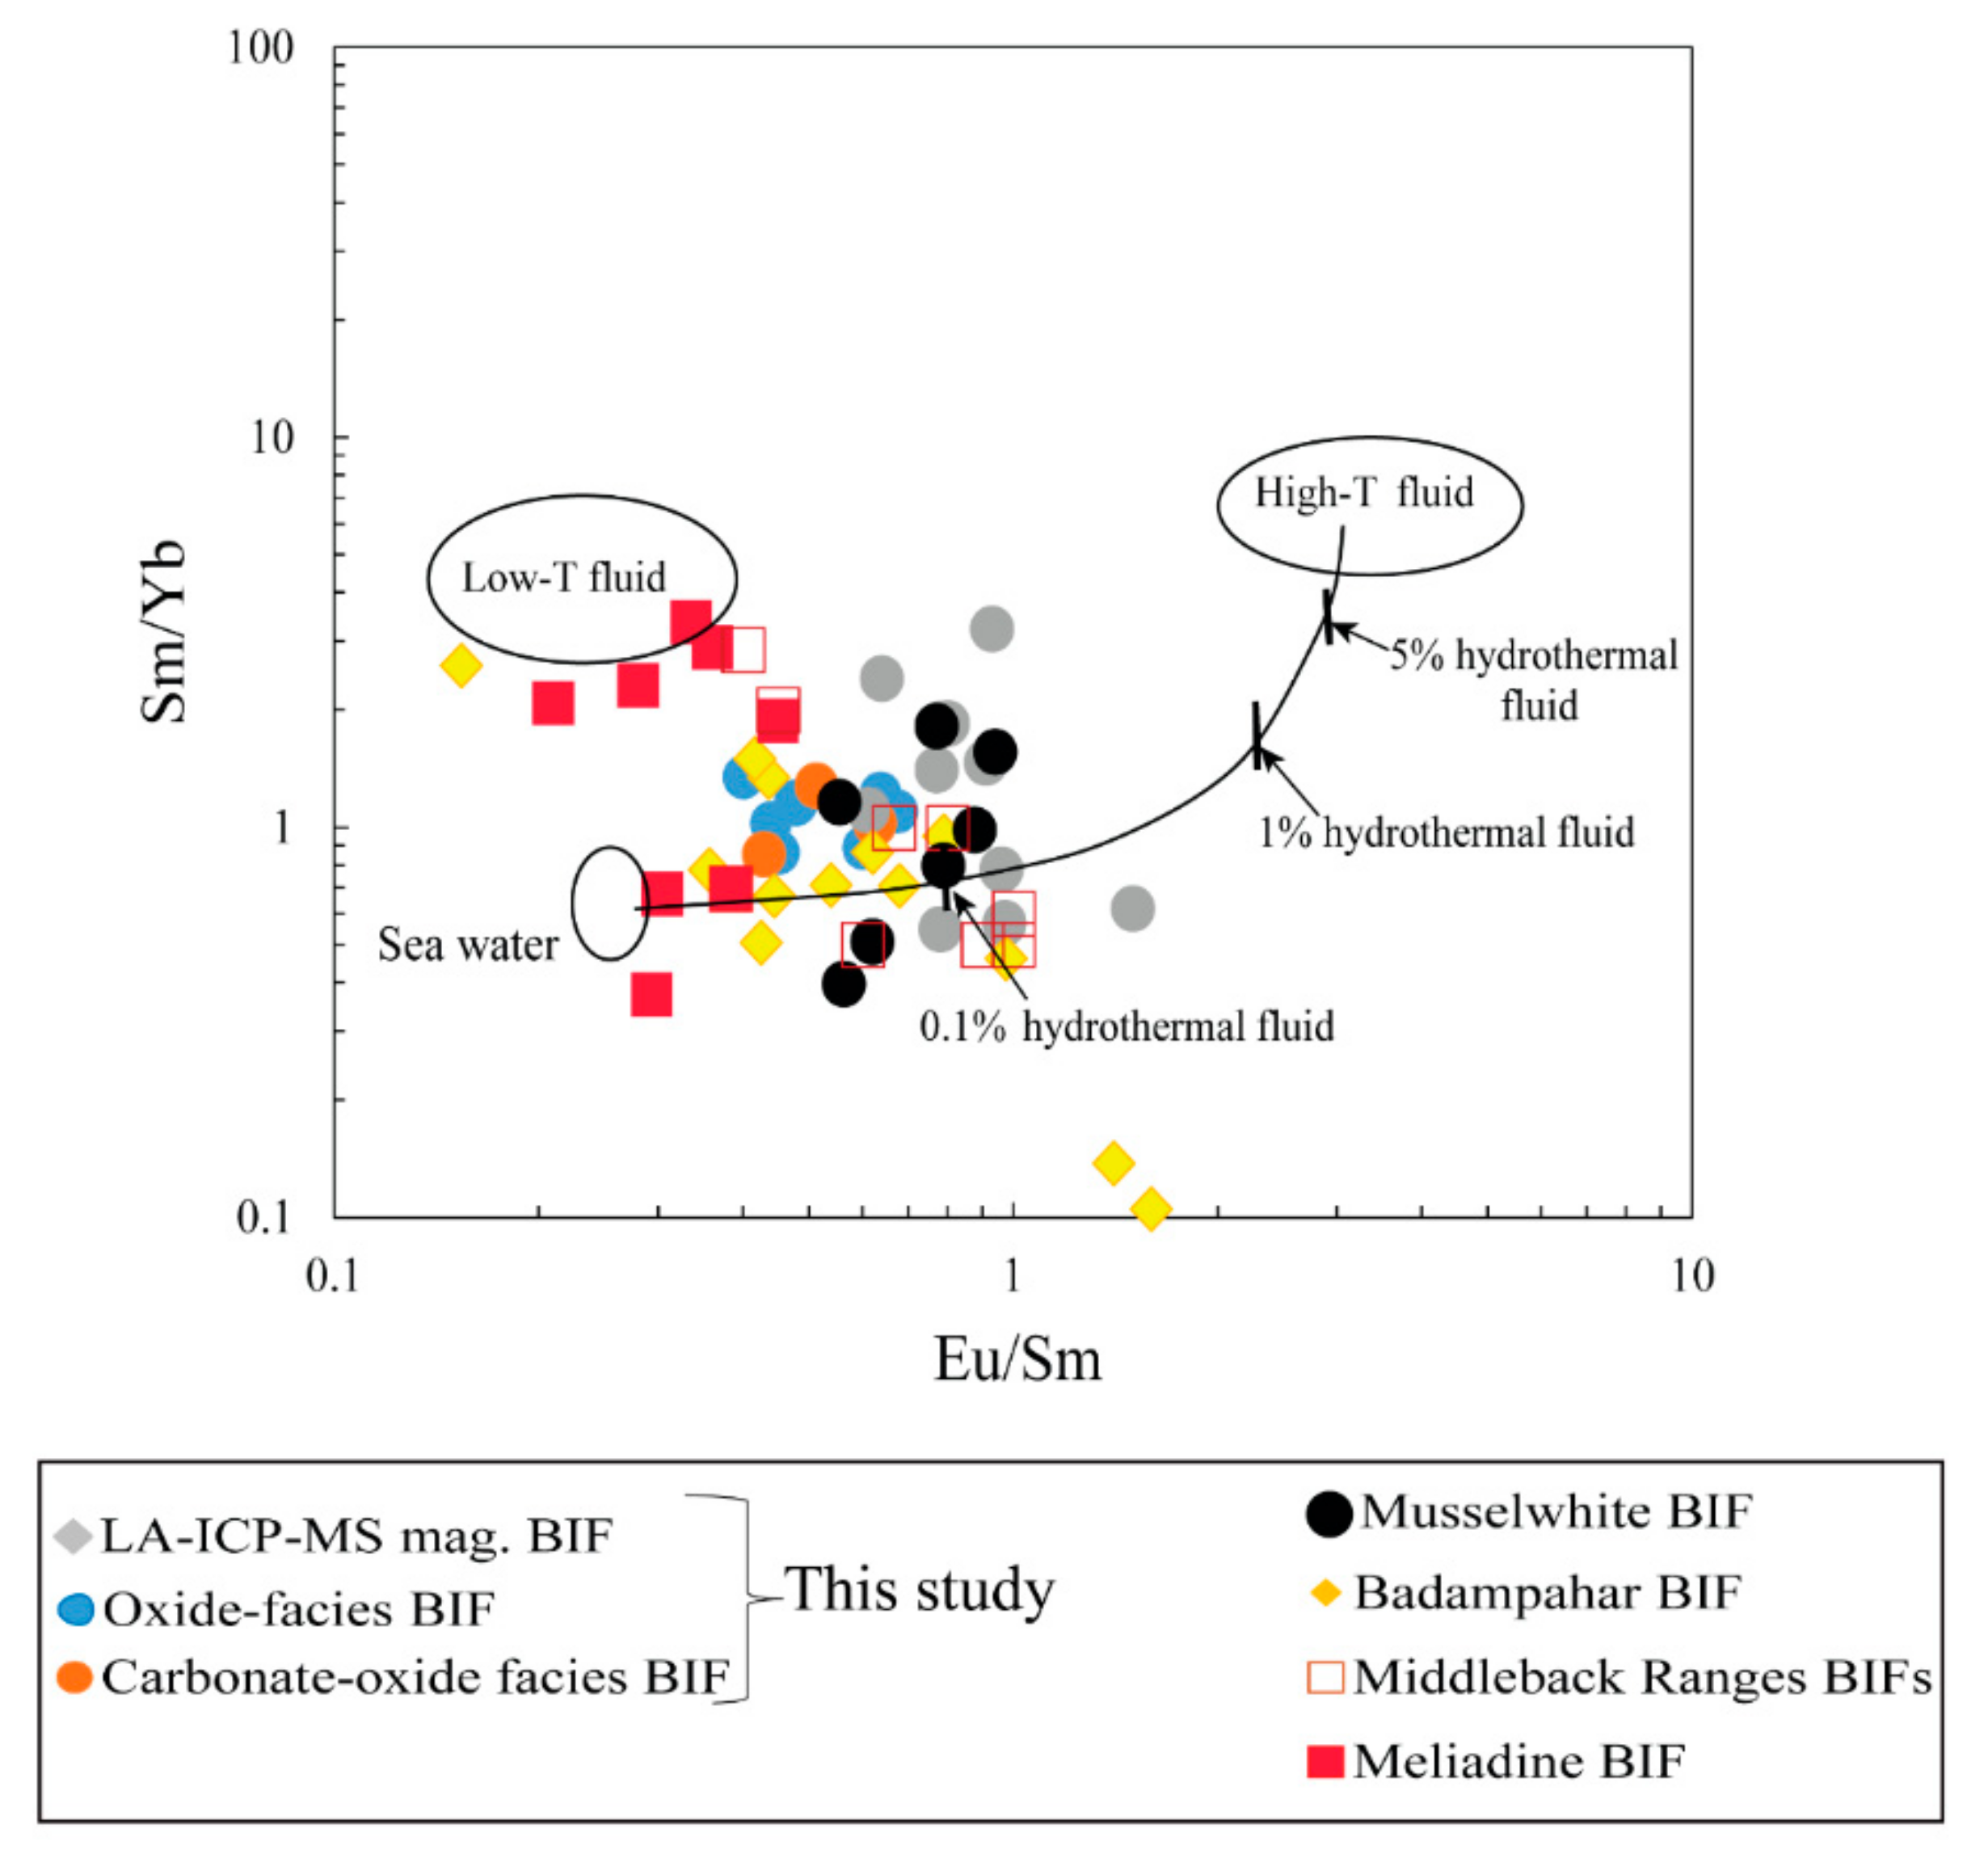
To determine the proportion of fluid-mixing components (i.e., hydrothermal vent fluid and seawater) for the Nabeba BIF, variations of Sm/Yb and Eu/Sm ratios [78] were used (Figure 17), which yielded ~0.1% for the high-temperature hydrothermal vent fluid input [2,30]. Strong positive Eu anomalies were associated with high-temperature hydrothermal fluids, medium-to-weak Eu anomalies with low (or medium)-temperature hydrothermal fluids, and no Eu anomaly with seawater (Figure 16; [3,23,71]). Thus, the weak Eu anomalies exhibited by both facies of the Nabeba BIF (Figure 16) was consistent with the fluid mixing that dominantly comprised (~99.9%) ambient seawater with minor (~0.1%) high-temperature vent fluids.
The presence of W, As, Pb, Mo, and Sn in the precipitates from seawater was influenced by hydrothermal fluids associated with felsic rocks. In contrast, hydrothermal fluids related to mafic-ultramafic rocks would produce elevated Ti, V, Ni, Cr, and Mg contents [28,79], which was the case for the Nabeba BIF (Figure 2 and Figure 11) [28,79]. Titanium and V contents in magnetite are sensitive indicators of redox conditions and mafic material input [80,81]. The magnetite precipitated from reduced fluids had lower Ti/V ratios than those of the magnetite precipitated from oxidized fluids [32,80,81,82]. Overall, the Ti/V ratios from both facies of the Nabeba BIF were considered as low. Therefore, the magnetite trace element compositions of these two facies indicated medium-high temperature and relatively reducing conditions and were likely related to mafic-ultramafic hydrothermal input during the BIF deposition on the paleo-seafloor.
However, when comparing both facies of the Nabeba BIF, magnetite from the carbonate-oxide facies-BIF had higher V content than its oxide facies-BIF counterpart (Figure 11g), yielding lower magnetite Ti/V ratio for the carbonate-oxide facies (3.72−16.02 ppm, average 10.95 ppm) than that for the oxide facies (18.51−136.69 ppm, average 60.63 ppm). This suggested that the depositional environment was more reducing for the carbonate-oxide facies than for the oxide facies [28,65].

7. Conclusions

  • The Nabeba BIF comprised two facies (oxide and carbonate-oxide) and displays alternating iron-rich and quartz-rich layers. The BIF consisted of magnetite, hematite, and quartz, together with minor siderite and magnesite. Geochemical analysis suggested that the Nabeba BIF had mainly Fe and Si, with minor CO3 and trace detrital material.
  • Magnetite from both BIF facies had a wide range of trace element contents (e.g., Mn, Ti, Ni, Mg, Cr, V, and Zn), which suggested input of medium-high-temperature hydrothermal vent fluids. Redox and temperature conditions likely controlled the magnetite chemical compositions.
  • Major and trace (including REE) element compositions suggested that Fe and Si were sourced from anoxic seawater mixed with medium-high-temperature (>250 °C) hydrothermal fluids. The Nabeba BIF was likely deposited in a reducing marine environment.

Supplementary Materials

The following are available online at https://www.mdpi.com/article/10.3390/min11060579/s1, Table S1: Chemical composition of magnetite from the oxide facies BIF of the Nabeba deposit major element (wt.%) trace elements (ppm), Table S2: Chemical composition of magnetite from the carbonate facies BIF of the Nabeba deposit major element (wt.%) trace elements (ppm).

Author Contributions

Conceptualization, C.G.E. and Y.X.; methodology, C.G.E., Y.X., and K.A.-A.; formal analysis C.G.E., Y.X., and Y.Q.; investigation, C.G.E., Y.X., K.A.-A., B.G., and Y.Q.; resources, Y.X.; writing—original draft preparation: C.G.E.; writing—review and editing, C.G.E., Y.X., K.A.-A., B.G., and Y.Q.; funding acquisition: Y.X. All authors have read and agreed to the published version of the manuscript.

Funding

This research was funded by the administration of Science and Technology of the People’s Republic of China (State Key Research Plan), grant number 2017YFC0601302, and by the scholarship at University of Science and Technology Beijing (No. b20160568).

Acknowledgments

We thank the Sundance Resources for providing data and consent to field work and sample collection. We thank A. Yoka and L. Djama (Ministry of Mines and Geology, Republic of Congo) for helping with the fieldwork. The authors would also like to thank FY Wang for helping with the LA-ICP-MS analysis. P. Thurston (Laurentian University) and two anonymous reviewers are sincerely thanked for their inspiring suggestions that helped to improve the initial version of the manuscript.

Conflicts of Interest

The authors declare no conflict of interest.

References

  1. Spier, C.A.; de Oliveira, S.M.B.; Rosiere, C.A. Geology and geochemistry of the Águas Claras and Pico Iron Mines, Quadrilátero Ferrífero, Minas Gerais, Brazil. Miner. Depos. 2003, 38, 751–774. [Google Scholar] [CrossRef]
  2. Gourcerol, B.; Thurston, P.; Kontak, D.; Côté-Mantha, O.; Biczok, J. Depositional setting of Algoma-type banded iron formation. Precamb. Res. 2016, 281, 47–79. [Google Scholar] [CrossRef]
  3. Bau, M.; Dulski, P. Distribution of yttrium and rare-earth elements in the Penge and Kuruman iron-formations, Transvaal Supergroup, South Africa. Precamb. Res. 1996, 79, 37–55. [Google Scholar] [CrossRef]
  4. Beukes, N.J.; Gutzmer, J. Origin and paleoenvironmental significance of major iron formations at the Archean-Paleoproterozoic boundary. Rev. Econ. Geol. 2008, 15, 5–47. [Google Scholar]
  5. Dymek, R.F.; Klein, C. Chemistry, petrology and origin of banded iron-formation lithologies from the 3800 Ma Isua supracrustal belt, West Greenland. Precamb. Res. 1988, 39, 247–302. [Google Scholar] [CrossRef]
  6. Khalil, K.I.; El-Shazly, A.E.; Lehmann, B. Late Neoproterozoic banded iron formation (BIF) in the central Eastern Desert of Egypt: Mineralogical and geochemical implications for the origin of the Gebel El Hadid iron ore deposit. Ore Geol. Rev. 2015, 69, 380–399. [Google Scholar] [CrossRef]
  7. Simonson, B.M.; Chan, M.; Archer, A. Origin and evolution of large Precambrian iron formations. Spec. Papers Geol. Soc. Am. 2003, 370, 231–244. [Google Scholar]
  8. Gross, G.A. A classification of iron formations based on depositional environments. Canad. Mineral. 1980, 18, 215–222. [Google Scholar]
  9. James, H.L. Sedimentary facies of iron-formation. Econ. Geol. 1954, 49, 235–293. [Google Scholar] [CrossRef]
  10. Trendall, A. The significance of iron-formation in the Precambrian stratigraphic record. In Precambrian Sedimentary Environments: A Modern Approach to Ancient Depositional Systems; Wiley: Hoboken, NJ, USA, 2002; pp. 33–66. [Google Scholar]
  11. De Waele, B.; Lacorde, M.; Rivers, J. Banded iron formations and associated detrital iron deposits of the Western Congo Craton. In Proceedings of the SEG S015—World-Class Ore Deposits: Discovery to Recovery, Hobart, TAS, Australia, 27–30 September 2015. [Google Scholar]
  12. De Waele, B.; Lacorde, M.; Cunningham, M.; Jupp, B. Understanding Geology and Structure: An Essential Part of Mineral Resource Estimation. ASEG Ext. Abstr. 2018, 1, 1–8. [Google Scholar] [CrossRef] [Green Version]
  13. Suh, C.; Cabral, A.; Shemang, E.; Mbinkar, L.; Mboudou, G. Two contrasting iron deposits in the Precambrian mineral belt of Cameroon, West Africa. Explor. Min. Geol. 2008, 17, 197–207. [Google Scholar] [CrossRef]
  14. Ganno, S.; Njiosseu Tanko, E.L.; Kouankap, N.G.D.; Djoukouo Soh, A.; Moudioh, C.; Ngnotue, T.; Nzenti, J.P. A mixed seawater and hydrothermal origin of superior-type banded iron formation (BIF)-hosted Kouambo iron deposit, Palaeoproterozoic Nyong series, Southwestern Cameroon: Constraints from petrography and geochemistry. Ore Geol. Rev. 2017, 80, 860–875. [Google Scholar]
  15. Soh Tamehe, L.; Nzepang, T.M.; Wei, C.T.; Ganno, S.; Ngnotue, T.; Kouankap, N.G.D.; Simon, S.J.; Zhang, J.J.; Nzenti, J.P. Geology and geochemical constrains on the origin and depositional setting of the Kpwa–Atog Boga banded iron formations (BIFs), northwestern Congo craton, southern Cameroon. Ore Geol. Rev. 2018, 95, 620–638. [Google Scholar] [CrossRef]
  16. Longley, R.; Kitto, P.; Thornett, S. Iron Ore. Exploration History of the Mbalam Iron Ore Project; Sundance Resources Ltd.: Perth, WA, Australia, 2013. [Google Scholar]
  17. Cunningham, M.; De Wael, B. Geological Mapping of Badondo and Iron Mineralisation Targets, Republic of Congo. Struct. Geol. Resour. 2012, 54, 54–56. [Google Scholar]
  18. Gatse Ebotehouna, C.; Xie, Y.; Adomako-Ansah, K.; Pei, L. Fluid inclusion and oxygen isotope characteristics of vein quartz associated with the nabeba iron deposit, Republic of Congo: Implications for the enrichment of hypogene ores. Minerals 2019, 9, 677. [Google Scholar] [CrossRef] [Green Version]
  19. Ministère des Mines et de L’Energie, Direction Générale des Mines. Carte Géologique de la Republique du Congo au 1:1000; Ministère des Mines et de L’Energie: Brazzaville, Republic of Congo, 1995.
  20. Pickard, A. SHRIMP U–Pb zircon ages for the Palaeoproterozoic Kuruman Iron Formation, northern Cape Province, South Africa: Evidence for simultaneous BIF deposition on Kaapvaal and Pilbara cratons. Precambr. Res. 2003, 125, 275–315. [Google Scholar] [CrossRef]
  21. Huston, D.L.; Logan, G.A. Barite, BIFs and bugs: Evidence for the evolution of the Earth’s early hydrosphere. Earth Planet. Sci. Lett. 2004, 220, 41–55. [Google Scholar] [CrossRef] [Green Version]
  22. Bekker, A.; Slack, J.F.; Planavsky, N.; Krapez, B.; Hofmann, A.; Konhauser, K.O.; Rouxel, O.J. Iron formation: The sedimentary product of a complex interplay among mantle, tectonic, oceanic, and biospheric processes. Econ. Geol. 2010, 105, 467–508. [Google Scholar] [CrossRef]
  23. Planavsky, N.; Bekker, A.; Rouxel, O.J.; Kamber, B.; Hofmann, A.; Knudsen, A.; Lyons, T.W. Rare earth element and yttrium compositions of Archean and Paleoproterozoic Fe formations revisited: New perspectives on the significance and mechanisms of deposition. Geochim. Cosmochim. Acta 2010, 74, 6387–6405. [Google Scholar] [CrossRef]
  24. Konhauser, K.O.; Planavsky, N.J.; Hardisty, D.S.; Robbins, L.J.; Warchola, T.J.; Haugaard, R.; Lalonde, S.V.; Partin, C.A.; Oonk, P.B.; Tsikos, H. Iron formations: A global record of Neoarchaean to Palaeoproterozoic environmental history. Earth Sci. Rev. 2017, 172, 140–177. [Google Scholar] [CrossRef] [Green Version]
  25. Alibert, C.; McCulloch, M.T. Rare earth element and neodymium isotopic compositions of the banded iron-formations and associated shales from Hamersley, Western Australia. Geochim. Cosmochim. Acta 1993, 57, 187–204. [Google Scholar] [CrossRef]
  26. Hansel, C.M.; Benner, S.G.; Neiss, J.; Dohnalkova, A.; Kukkadapu, R.K.; Fendorf, S. Secondary mineralization pathways induced by dissimilatory iron reduction of ferrihydrite under advective flow. Geochim. Cosmochim. Acta 2003, 67, 2977–2992. [Google Scholar] [CrossRef] [Green Version]
  27. Li, W.; Jin, X.; Gao, B.; Wang, C.; Zhang, L. Analysis of ultra-low level rare earth elements in magnetite samples from banded iron formations using HR-ICP-MS after chemical separation. Anal. Methods 2014, 6, 6125–6132. [Google Scholar] [CrossRef]
  28. Chung, D.; Zhou, M.-F.; Gao, J.-F.; Chen, W.T. In-situ LA–ICP-MS trace elemental analyses of magnetite: The late Palaeoproterozoic Sokoman Iron Formation in the Labrador Trough, Canada. Ore Geol. Rev. 2015, 65, 917–928. [Google Scholar] [CrossRef]
  29. Gourcerol, B.; Thurston, P.; Kontak, D.; Côté-Mantha, O. Interpretations and implications of LA ICP-MS analysis of chert for the origin of geochemical signatures in banded iron formations (BIFs) from the Meadowbank gold deposit, Western Churchill Province, Nunavut. Chem. Geol. 2015, 410, 89–107. [Google Scholar] [CrossRef]
  30. Gourcerol, B.; Kontak, D.J.; Thurston, P.C.; Duparc, Q. Do magnetite layers in algoma-type Banded Iron Formations (BIF) preserve their primary geochemical signature? A case study of samples from three archean BIF-hosted gold deposits. Canad. Mineral. 2016, 54, 605–624. [Google Scholar] [CrossRef]
  31. Ghosh, R.; Baidya, T.K. Mesoarchean BIF and iron ores of the Badampahar greenstone belt, Iron Ore Group, East Indian Shield. J. Asian Earth Sci. 2017, 150, 25–44. [Google Scholar] [CrossRef]
  32. Sun, X.; Zhu, X.; Tang, H.; Luan, Y. In situ LA-ICP-MS trace element analysis of magnetite from the late Neoarchean Gongchangling BIFs, NE China: Constraints on the genesis of high-grade iron ore. Geol. J. 2018, 53, 8–20. [Google Scholar] [CrossRef]
  33. Keyser, W.; Ciobanu, C.L.; Cook, N.J.; Johnson, G.; Feltus, H.; Johnson, S.; Dmitrijeva, M.; Ehrig, K.; Nguyen, P.T. Petrography and trace element signatures of iron-oxides in deposits from the Middleback Ranges, South Australia: From banded iron formation to ore. Ore Geol. Rev. 2018, 93, 337–360. [Google Scholar] [CrossRef]
  34. Meloux, J.; Bigot, M.; Viland, J. Plan Minéral de la République Populaire du Congo; BRGM: Orléans, France, 1986.
  35. Schlüter, T. Geological Atlas of Africa. With Notes on Stratigraphy, Tectonics, Economic Geology, Geohazards, Geosites and Geoscientific Education of Each Country; Springer-Verlag: Berlin, Germany, 2008; p. 307. [Google Scholar]
  36. Dadet, P. Notice Explicative de la Carte Géologique de la République du Congo Brazzaville au 1/500 000: Zone Comprise entre les Parallèles 2 et 5 Sud; Éditions BRGM: Orléans, France, 1969.
  37. Desthieux, F. Notice Explicative de la Carte Géologique de la République du Congo au 1/1.000.000; Ministère des Mines et de L’énergie. Direction Générale des Mines: Brazzaville, République du Congo, 1993; p. 27.
  38. Feybesse, J.; Johan, V.; Triboulet, C.; Guerrot, C.; Mayaga-Mikolo, F.; Bouchot, V.; N’dong, J.E. The West Central African belt: A model of 2.5–2.0 Ga accretion and two-phase orogenic evolution. Precambr. Res. 1998, 87, 161–216. [Google Scholar] [CrossRef]
  39. Milesi, J.; Toteu, S.; Deschamps, Y.; Feybesse, J.; Lerouge, C.; Cocherie, A.; Penaye, J.; Tchameni, R.; Moloto-A-Kenguemba, G.; Kampunzu, H. An overview of the geology and major ore deposits of Central Africa: Explanatory note for the 1: 4,000,000 map. Geology and major ore deposits of Central Africa. J. African Earth Sci. 2006, 44, 571–595. [Google Scholar] [CrossRef]
  40. Dorling, S. Structural Geologogy of the Mbalam Iron Project; Unpublished Technical Report; CSA Global: Perth, WA, Australia, 2011. [Google Scholar]
  41. Gao, J.-F.; Zhou, M.-F.; Lightfoot, P.C.; Wang, C.Y.; Qi, L.; Sun, M. Sulfide saturation and magma emplacement in the formation of the Permian Huangshandong Ni-Cu sulfide deposit, Xinjiang, northwestern China. Econ. Geol. 2013, 108, 1833–1848. [Google Scholar] [CrossRef]
  42. Liu, Y.; Hu, Z.; Gao, S.; Günther, D.; Xu, J.; Gao, C.; Chen, H. In situ analysis of major and trace elements of anhydrous minerals by LA-ICP-MS without applying an internal standard. Chem. Geol. 2008, 257, 34–43. [Google Scholar] [CrossRef]
  43. Taylor, S.R.; McLennan, S.M. The Continental Crust: Its Compositionandevolution; Blackwell Scientific Publications: Hoboken, NY, USA, 1985; pp. 1–328. [Google Scholar]
  44. Bau, M.; Koschinsky, A.; Dulski, P.; Hein, J.R. Comparison of the partitioning behaviours of yttrium, rare earth elements, and titanium between hydrogenetic marine ferromanganese crusts and seawater. Geochim. Cosmochim. Acta 1996, 60, 1709–1725. [Google Scholar] [CrossRef]
  45. Bau, M.; Schmidt, K.; Koschinsky, A.; Hein, J.; Kuhn, T.; Usui, A. Discriminating between different genetic types of marine ferro-manganese crusts and nodules based on rare earth elements and yttrium. Chem. Geol. 2014, 381, 1–9. [Google Scholar] [CrossRef]
  46. Ganno, S.; Ngnotue, T.; Djibril Kouankap, N.G.D.; Nzenti, J.P.; Notsa Fokeng, M. Petrology and geochemistry of the banded iron-formations from Ntem complex greenstones belt, Elom area, Southern Cameroon: Implications for the origin and depositional environment. Chem Erde. 2015, 75, 375–387. [Google Scholar]
  47. Rudnick, R.; Gao, S. Composition of the continental crust. Treatise Geochem. 2003, 3, 1–64. [Google Scholar]
  48. Sun, S.-S.; McDonough, W.F. Chemical and Isotopic Systematics of Oceanic Basalts: Implications for Mantle Composition and Processes; Special Publications; Geological Society: London, UK, 1989; Volume 42, pp. 313–345. [Google Scholar]
  49. McLennan, S.M. Rare earth elements in sedimentary rocks: Influence of provenance and sedimentary processes. Geochem. Mineral. Rare Earth Elements Rev. Mineral. 2018, 21, 169–200. [Google Scholar]
  50. Rao, T.G.; Naqvi, S. Geochemistry, depositional environment and tectonic setting of the BIF’s of the late Archaean Chitradurga schist belt, India. Chem. Geol. 1995, 121, 217–243. [Google Scholar] [CrossRef]
  51. Kato, Y.; Kawakami, T.; Kano, T.; Kunugiza, K.; Swamy, N. Rare-earth element geochemistry of banded iron formations and associated amphibolite from the Sargur belts, south India. J. Southeast. Asian Earth Sci. 1996, 14, 161–164. [Google Scholar] [CrossRef]
  52. Klein, C. Some Precambrian banded iron-formations (BIFs) from around the world: Their age, geologic setting, mineralogy, metamorphism, geochemistry, and origins. Am. Mineral. 2005, 90, 1473–1499. [Google Scholar] [CrossRef]
  53. Ohmoto, H. Nonredox transformations of magnetite-hematite in hydrothermal systems. Econ. Geol. 2003, 98, 157–161. [Google Scholar] [CrossRef]
  54. Posth, N.R.; Köhler, I.; Swanner, E.D.; Schröder, C.; Wellmann, E.; Binder, B.; Konhauser, K.O.; Neumann, U.; Berthold, C.; Nowak, M. Simulating Precambrian banded iron formation diagenesis. Chem. Geol. 2013, 362, 66–73. [Google Scholar] [CrossRef]
  55. Thurston, P.; Kamber, B.; Whitehouse, M. Archean cherts in banded iron formation: Insight into Neoarchean ocean chemistry and depositional processes. Precambr. Res. 2012, 214, 227–257. [Google Scholar] [CrossRef]
  56. Ayres, D. Genesis of iron-bearing minerals in banded iron formation mesobands in the Dales Gorge Member, Hamersley Group, Western Australia. Econ. Geol. 1972, 67, 1214–1233. [Google Scholar] [CrossRef]
  57. Ewers, W.; Morris, R. Studies of the Dales Gorge member of the Brockman iron formation, Western Australia. Econ. Geol. 1981, 76, 1929–1953. [Google Scholar] [CrossRef]
  58. Ahn, J.H.; Buseck, P.R. Hematite nanospheres of possible colloidal origin from a Precambrian banded iron formation. Science 1990, 250, 111–113. [Google Scholar] [CrossRef]
  59. Morris, R. Genetic modelling for banded iron-formation of the Hamersley Group, Pilbara Craton, Western Australia. Precambr. Res. 1993, 60, 243–286. [Google Scholar] [CrossRef]
  60. Smith, A.J.; Beukes, N.J.; Gutzmer, J. The composition and depositional environments of Mesoarchean iron formations of the West Rand Group of the Witwatersrand Supergroup, South Africa. Econ. Geol. 2013, 108, 111–134. [Google Scholar] [CrossRef]
  61. Bau, M.; Alexander, B.W. Distribution of high field strength elements (Y, Zr, REE, Hf, Ta, Th, U) in adjacent magnetite and chert bands and in reference standards FeR-3 and FeR-4 from the Temagami iron-formation, Canada, and the redox level of the Neoarchean ocean. Precambr. Res. 2009, 174, 337–346. [Google Scholar] [CrossRef]
  62. Ghosh, R.; Baidya, T.K. Using BIF magnetite of the Badampahar greenstone belt, Iron Ore Group, East Indian Shield to reconstruct the water chemistry of a 3.3–3.1 Ga sea during iron oxyhydroxides precipitation. Precambr. Res. 2017, 301, 102–112. [Google Scholar] [CrossRef]
  63. Dare, S.A.; Barnes, S.-J.; Beaudoin, G.; Méric, J.; Boutroy, E.; Potvin-Doucet, C. Trace elements in magnetite as petrogenetic indicators. Miner.Depos. 2014, 49, 785–796. [Google Scholar] [CrossRef]
  64. Dupuis, C.; Beaudoin, G. Discriminant diagrams for iron oxide trace element fingerprinting of mineral deposit types. Miner. Depos. 2011, 46, 319–335. [Google Scholar] [CrossRef]
  65. Wang, M.; Wang, W.; Liu, K.; Michalak, P.P.; Wei, K.; Hu, M. In–situ LA–ICP–MS trace elemental analyzes of magnetite: The Tieshan skarn Fe–Cu deposit, Eastern China. Chem Erde. 2017, 77, 169–181. [Google Scholar] [CrossRef]
  66. McLennan, S.; Hemming, S.; McDaniel, D.; Hanson, G. Geochemical approaches to sedimentation, provenance, and tectonics. Spec. Papers Geol. Soc. Am. 1993, 284, 21. [Google Scholar]
  67. Bau, M.; Möller, P. Rare earth element systematics of the chemically precipitated component in Early Precambrian iron formations and the evolution of the terrestrial atmosphere-hydrosphere-lithosphere system. Geochim. Cosmochim. Acta 1993, 57, 2239–2249. [Google Scholar] [CrossRef]
  68. Bau, M. Effects of syn-and post-depositional processes on the rare-earth element distribution in Precambrian iron-formations. Eur. J. Mineral. 1993, 5, 257–267. [Google Scholar] [CrossRef]
  69. Arora, M.; Govil, P.; Charan, S.; Raj, B.U.; Manikyamba, C.; Chatterjee, A.; Naqvi, S. Geochemistry and origin of Archean banded iron-formation from the Bababudan Schist Belt, India. Econ. Geol. 1995, 90, 2040–2057. [Google Scholar] [CrossRef]
  70. Basta, F.F.; Maurice, A.E.; Fontboté, L.; Favarger, P.-Y. Petrology and geochemistry of the banded iron formation (BIF) of Wadi Karim and Um Anab, Eastern Desert, Egypt: Implications for the origin of Neoproterozoic BIF. Precambr. Res. 2011, 187, 277–292. [Google Scholar] [CrossRef]
  71. Bolhar, R.; Kamber, B.S.; Moorbath, S.; Fedo, C.M.; Whitehouse, M.J. Characterisation of early Archaean chemical sediments by trace element signatures. Earth Planet. Sci. Lett. 2004, 222, 43–60. [Google Scholar] [CrossRef]
  72. Cox, G.M.; Halverson, G.P.; Minarik, W.G.; Le Heron, D.P.; Macdonald, F.A.; Bellefroid, E.J.; Strauss, J.V. Neoproterozoic iron formation: An evaluation of its temporal, environmental and tectonic significance. Chem. Geol. 2013, 362, 232–249. [Google Scholar] [CrossRef] [Green Version]
  73. Gurvich, E.G. Metalliferous Sediments of the World Ocean: Fundamental Theory of Deep-Sea Hydrothermal Sedimentation; Springer: Berlin, Germany, 2006. [Google Scholar]
  74. Klein, C.; Beukes, N.J. Geochemistry and sedimentology of a facies transition from limestone to iron-formation deposition in the early Proterozoic Transvaal Supergroup, South Africa. Econ. Geol. 1989, 84, 1733–1774. [Google Scholar] [CrossRef]
  75. Douville, E.; Bienvenu, P.; Charlou, J.L.; Donval, J.P.; Fouquet, Y.; Appriou, P.; Gamo, T. Yttrium and rare earth elements in fluids from various deep-sea hydrothermal systems. Geochim. Cosmochim. Acta 1999, 63, 627–643. [Google Scholar] [CrossRef]
  76. Bau, M.; Dulski, P. Comparing yttrium and rare earths in hydrothermal fluids from the Mid-Atlantic Ridge: Implications for Y and REE behaviour during near-vent mixing and for the Y/Ho ratio of Proterozoic seawater. Chem. Geol. 1999, 155, 77–90. [Google Scholar] [CrossRef]
  77. Yang, X.-Q.; Zhang, Z.-H.; Duan, S.-G.; Zhao, X.-M. Petrological and geochemical features of the Jingtieshan banded iron formation (BIF): A unique type of BIF from the Northern Qilian Orogenic Belt, NW China. J. Asian Earth Sci. 2015, 113, 1218–1234. [Google Scholar] [CrossRef]
  78. Alexander, B.W.; Bau, M.; Andersson, P.; Dulski, P. Continentally-derived solutes in shallow Archean seawater: Rare earth element and Nd isotope evidence in iron formation from the 2.9 Ga Pongola Supergroup, South Africa. Geochim. Cosmochim. Acta 2008, 72, 378–394. [Google Scholar] [CrossRef]
  79. Bhattacharya, H.; Chakraborty, I.; Ghosh, K.K. Geochemistry of some banded iron-formations of the Archean supracrustals, Jharkhand-Orissa region, India. J. Earth Syst Sci. 2007, 116, 245–259. [Google Scholar] [CrossRef]
  80. Bordage, A.; Balan, E.; de Villiers, J.P.; Cromarty, R.; Juhin, A.; Carvallo, C.; Calas, G.; Raju, P.S.; Glatzel, P. V oxidation state in Fe–Ti oxides by high-energy resolution fluorescence-detected X-ray absorption spectroscopy. Phys. Chem. Miner. 2011, 38, 449–458. [Google Scholar] [CrossRef]
  81. Nadoll, P.; Angerer, T.; Mauk, J.L.; French, D.; Walshe, J. The chemistry of hydrothermal magnetite: A review. Ore Geol. Rev. 2014, 61, 1–32. [Google Scholar] [CrossRef]
  82. Toplis, M.J.; Corgne, A. An experimental study of element partitioning between magnetite, clinopyroxene and iron-bearing silicate liquids with particular emphasis on vanadium. Contrib. Mineral. Petrol. 2002, 144, 22–37. [Google Scholar] [CrossRef]
  83. Michard, A.; Albarede, F.; Michard, G.; Minster, J.; Charlou, J. Rare-earth elements and uranium in high-temperature solutions from East Pacific Rise hydrothermal vent field (13 N). Nature 1983, 303, 795. [Google Scholar] [CrossRef]
  84. Alibo, D.S.; Nozaki, Y. Rare earth elements in seawater: Particle association, shale-normalization, and Ce oxidation. Geochim. Cosmochim. Acta 1999, 63, 363–372. [Google Scholar] [CrossRef]
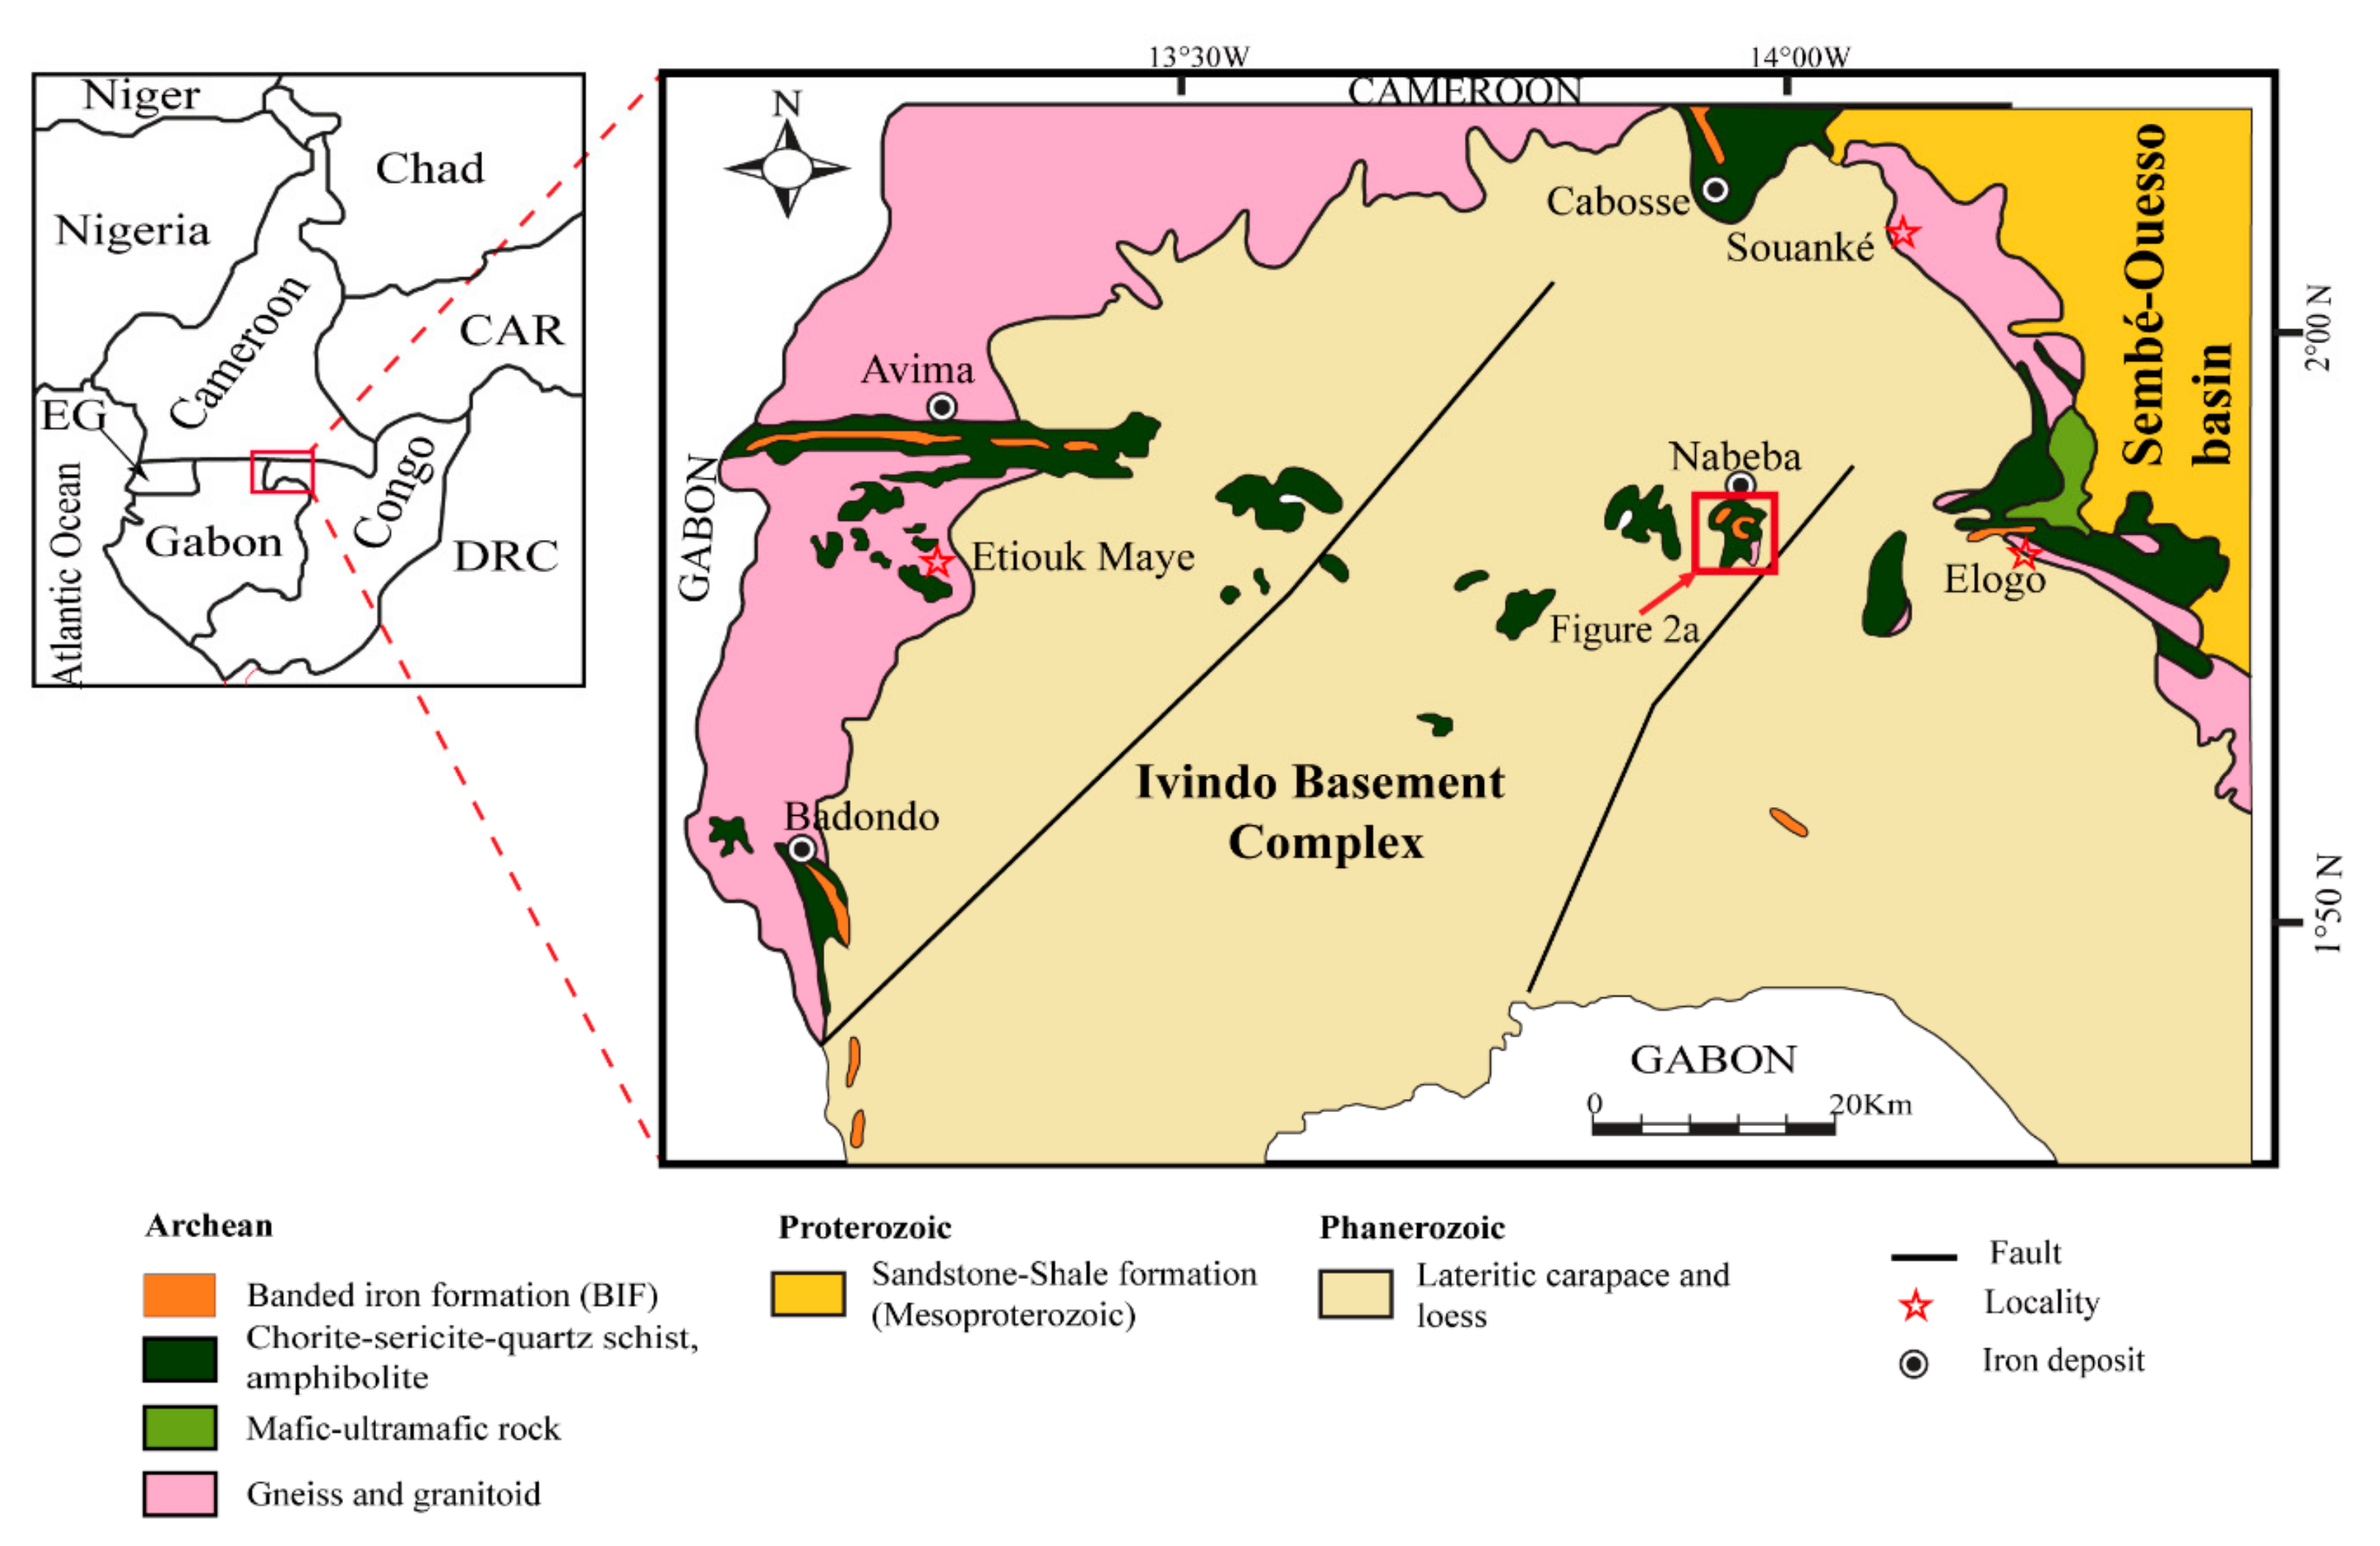
Figure 1. Geological setting of the northwestern Republic of the Congo (modified from [19]). Inset map: Sketched map showing the national border in Central Africa. Abbreviations: CAR, Central African Republic; DRC, Democratic Republic of the Congo; EG, Equatorial Guinea.
Minerals 11 00579 g001
Figure 2. (a) Geologic map of the Nabeba Fe deposit modified from [16]), showing the sampling site; (b) geological profile of the deposit. NB0001D, NB0004D, and NB0012D are diamond drill-hole number at Nabeba.
Minerals 11 00579 g002
Figure 3. Drill-hole stratigraphic columns at the Nabeba BIF deposit.
Minerals 11 00579 g003
Figure 4. Field photos of (a) BIF outcrop at Nabeba, showing minor folding of the alternating hematite and chert layers; (b) oxide facies-BIF, showing the fine alternating layers of chert and iron oxides; (c) oxide facies-BIF, showing the fine alternating layers of chert, specularite, and magnetite, (d) slightly-folded carbonate-oxide facies-BIF, showing the alternating carbonate, magnetite, and chert layers.
Minerals 11 00579 g004
Figure 5. Photomicrographs of the Nabeba oxide facies-BIF: (a) anhedral magnetite partially replaced by hematite (sample CG-C2, reflected-light); (b) hematite, which has completely replaced magnetite (sample CG-C2, reflected-light); (c) granoblastic martite in magnetite pseudomorph with interstitial goethite (sample CG-C5, reflected-light); (d) subhedral-anhedral magnetite partially replaced by hematite at grain boundaries (sample CG-C23, reflected-light). Abbreviations: Gt, goethite; Hem, hematite; Mag, magnetite; Mt, martite; Qtz, quartz.
Minerals 11 00579 g005
Figure 6. Core sample photos (a,b) and photomicrographs of the carbonate-oxide facies-BIF (c,d): (a) folded micro-banding of alternating quartz and ferric minerals (magnetite, siderite, and ferroan-magnesite) cut by a quartz vein (sample CG-NB10); (b) alternating thick quartz-rich and ferric mineral-rich (magnetite, siderite, and ferroan-magnesite) layers (sample CG-NB10); (c) euhedral pyrite inclusions in iron oxide-rich layer (sample CG-NB1). Note the lineation of magnetite, siderite, and quartz; (d) subhedral magnetite in the carbonate layers, mostly dominated by siderite (sample CG-NB1). Abbreviations: Fe-Mgst: ferroan-magnesite; Mag: magnetite; Py: pyrite; Qtz: quartz; Sid: siderite.
Minerals 11 00579 g006
Figure 7. Upper continental crust (UCC)-normalized trace element patterns of the Nabeba BIF. UCC normalizing values from [47].
Minerals 11 00579 g007
Figure 8. Bivariate diagrams showing Al2O3 vs. Nb and Al2O3 vs. Zr.
Minerals 11 00579 g008
Figure 9. PASS-normalized REE patterns of the Nabeba BIF. Normalizing values from McLennan [49].
Minerals 11 00579 g009
Figure 10. PASS-normalized Ce/Ce* vs. Pr/Pr* diagram, showing La and Ce anomalies (after [3]) for the Nabeba BIF.
Minerals 11 00579 g010
Figure 11. Binary diagrams of magnetite chemical compositions from the Nabeba BIF: (a) Mn vs. Mg, (b) Co vs. Mg, (c) Zn vs. Mg, (d) Si vs. Mg, (e) Zn vs. Mn, (f) Ni vs. Co, (g) V vs. Cr, and (h) Cr vs. Ti.
Minerals 11 00579 g011
Figure 12. PAAS-normalized REY patterns of selected average magnetite from the Nabeba oxide facies-BIF.
Minerals 11 00579 g012
Figure 13. Bulk continental crust (BCC)-normalized multi-element diagrams for the magnetite layers from the Nabeba BIF in comparison with selected BIFs (from Musselwhite, Meliadine [30], Badampahar [31], and Middleback Ranges (Magnet Iron) [33]) (all in situ analysis; [30,31,33]) and high-temperature hydrothermal magnetite [63]: (a) oxide facies-BIF magnetite; (b) carbonate-oxide facies-BIF magnetite. Blue area in both diagrams denotes elemental concentration of different spots in the Nabeba BIF magnetite layers, and the grey area denotes the elemental concentration of high-temperature hydrothermal magnetite [63].
Minerals 11 00579 g013
Figure 14. (Ti + V) vs. Ni/(Cr + Mn) discrimination diagram [64] for the Nabeba BIF magnetite. Magnetite from different types of iron deposits, including Kiruna apatite-magnetite, iron-oxide-copper-gold (IOCG), porphyry Cu, magmatic Fe-Ti-V oxide, BIF, and Opemiska-type, are also shown for comparison. The extended BIF field represented by a dashed black lines results from Gourcerol et al. [30]. The general BIF field represented by a dashed blue circle is generated from this study following the magnetite concentrations plots of from this study and Milddleback Ranges BIFs [33], Meliadine BIFs, Musselwhite BIFs [30], Gongchangling BIFs [32], and Sokoman iron formation [28,65].
Minerals 11 00579 g014
Figure 15. Plots of (a) ΣREE vs. Al2O3; (b) P2O5 vs. ΣREE; (c) Y/Ho vs. Zr; (d) (Co+Ni+Cu) vs. ΣREE (after [5]) for the Nabeba BIF.
Minerals 11 00579 g015
Figure 16. PAAS-normalized REY patterns of magnetite and whole-rock BIF (mean values) from Nabeba in relation to the average compositions of hydrothermal fluid [76] and modern seawater [71]. Magnetite geochemical data from Musselwhite, Meliadine [30], Badampahar [31], and Middleback Ranges (Iron Magnet mine) [33] BIFs are also shown for comparison.
Minerals 11 00579 g016
Figure 17. Sm/Yb vs. Eu/Sm plot (modified after Alexander et al. [78]) for the Nabeba BIF and other BIFs shown in Figure 16. Average compositions of high-temperature (>350 °C) hydrothermal fluids [76], low-temperature hydrothermal fluids [83], and Pacific seawater [84] are shown for comparison.
Minerals 11 00579 g017
Table 1. Samples collected from the Nabeba iron deposit.
Sample TypeSample NameLocationCoordinatesDepth (m)BIF FaciesTextureMajor Mineral Assemblage
EastNorth
BIF (Drill Core)1CG-NB 1NBDD012387521203459224Carbonate-oxideFine banded, brown, grey, and black alternating bands Magnetite + siderite + quartz
2CG-NB 2NBDD001D38890020320886OxideBanded, alternation of white, brown, and greyMagnetite + quartz
3CG-NB 3NBDD001D38890020320890OxideFine banded, alternation of white, brown, and greyMagnetite + quartz + hematite
4CG-NB 4NBDD012D387521203459215OxideBanded, cut by quartz veinsMagnetite + quartz
5CG-NB 6NBDD001D38890020320896OxideFine banded, grey, brown, and white fold bandsMagnetite + quartz + hematite
6CG-NB 7NBDD004D388300203588156OxideBanded, brown, and whiteMagnetite + quartz + hematite
7CG-NB 8NBDD004388300203588185OxideBanded, brown, and white, cut by quartz veinsMagnetite + quartz
8CG-NB 9NBDD0012387521203459220OxideFolded banded, brownish, cut by quartz veinsMagnetite + quartz
9CG-NB10NBDD0012387521203459208Carbonate-oxideFines banded, gray to brown, crosscutting veinsMagnetite + quartz + siderite
10CG-NB11NBDD001238752120345998Carbonate-oxideFines banded, gray to brown, and white alternating bands Magnetite + quartz + siderite + ferroan-magnesite
BIF (Outcrop)11CG-C2Outcrop386688202204 OxideFine banded, grey, brown, and white alternating bandsMagnetite + quartz + hematite + martite
12CG-C3Outcrop386221202029 OxideBrown and white alternating bandsMagnetite + quartz + hematite + martite
13CG-C4Outcrop386711202232 Carbonate-oxideBanded, brown, and greyMagnetite + quartz + hematite + ferroan-dolomite
14CG-C6Outcrop387214202232 Carbonate-oxideFine banded, brown, grey, and white rhythmsMagnetite + quartz + hematite + ferroan-dolomite
15CG-C12Outcrop387176202145 OxideBanded, grey to brown slightly weathered, foliated, dominated by hematite bandsMagnetite + hematite + martite + quartz
16CG-C14Outcrop386588202279 Carbonate-oxideBanded, light grey to grey, slightly weathered, presence of sugary quartz in the chert bandsMagnetite + quartz + hematite + ferroan-dolomite
17CG-C21Outcrop386520202354 OxideFine banded, brown, grey, and white rhythmsMagnetite + quartz + hematite + marite
18CG-C23Outcrop386547202390 OxideFine banded, grey slightly weathered, foliated, dominated by hematite-goethite bandsMagnetite + quartz + hematite
19CG-C25Outcrop386720202287 OxideBanded, grey slightly weathered, foliated, dominated by hematite-goethite bands, presence of quartz veins cutting the bandsMagnetite + martite + quartz
Table 2. Major element oxide composition (wt.%) and ratios of the Nababa BIF.
Oxide Facies-BIFCarbonate-Oxide Facies-BIF
Sample NameCG-NB3CG-NB6CG-C2CG-C21CG-C23–1CG-C23–2CG-C25CG-NB1CG-NB10CG-C6
SiO257.4068.3743.7448.0546.4345.4746.2541.5537.2340.26
TiO20.01<0.01<0.01<0.01<0.01<0.01<0.01<0.010.02<0.01
Al2O30.360.050.060.090.110.070.030.180.480.06
TFe2O341.3030.7153.5548.2748.9550.4148.9244.8644.2455.63
Cr2O3<0.01<0.01<0.01<0.01<0.01<0.010.01<0.01<0.01<0.01
MnO0.010.010.010.010.110.12<0.010.440.300.15
MgO0.020.020.030.030.080.080.031.571.990.18
CaO0.010.010.010.020.020.020.030.110.180.01
Na2O<0.01<0.01<0.01<0.01<0.01<0.01<0.01<0.01<0.01<0.01
K2O0.02<0.01<0.01<0.010.020.01<0.01<0.01<0.01<0.01
P2O50.020.010.200.040.020.020.030.010.050.03
SO3<0.01<0.01<0.010.020.020.020.040.220.010.07
LOI 0.140.261.722.723.523.183.9411.1714.953.00
Total99.1599.1897.6096.5395.7696.2295.3488.9484.5096.39
Fe2O3/Al2O3114.72614.20892.50536.33445.00720.141630.67249.22245.78927.17
SiO2/Al2O3159.441367.40729.00533.89422.09649.571541.67230.8377.56671.00
Table 3. Pearson’s correlation matrix for major element oxides of oxide-facies-BIF.
SiO2Al2O3TFe2O3MnOMgOCaOK2OP2O5LOI
SiO21--------
Al2O3−0.736304011-------
TFe2O30.17460635−0.670697941------
MnO−0.697883620.54176046−0.557975741-----
MgO−0.797568510.88406025−0.71983730.868098741----
CaO−0.746438320.93913917−0.778458140.75933990.974458191---
K2O11−1−1notnot1--
P2O5−0.277707870.52483232−0.11711327−0.273482720.188206470.33746412not1-
LOI −0.769546750.90910882−0.762680740.82798350.990664660.9933429610.243257441
Table 4. Pearson’s correlation matrix for major element oxides of carbonate-oxide facies BIF.
SiO2Al2O3TFe2O3MnOMgOCaOP2O5LOI 1000
SiO21-------
Al2O3−0.838566021------
TFe2O30.27337997−0.753293611-----
MnO0.271748740.29641895−0.851417241----
MgO−0.436779710.85635354−0.984707270.747021811---
CaO−0.605621690.94137984−0.931004240.60123020.980357341--
P2O5−0.97401110.69337525−0.0484031−0.482662980.221675760.409644021-
LOI 1000−0.51677650.89976557−0.964783750.683469670.995856390.994231140.309434531
Publisher’s Note: MDPI stays neutral with regard to jurisdictional claims in published maps and institutional affiliations.