Article

Automated Optical Image Analysis of Iron Ore Sinter

1
CSIRO Mineral Resources, P.O. Box 883, Kenmore, QLD 4069, Australia
2
Geology and Mineral Resources, Montanuniversität Leoben, 8700 Leoben, Austria
3
The Australian Research Council (ARC) Research Hub for Advanced Technologies for Australian Iron Ores, The University of Newcastle, Callaghan, NSW 2308, Australia
4
CSIRO Mineral Resources, Research Way, Clayton, VIC 3168, Australia
*
Author to whom correspondence should be addressed.
Minerals 2021, 11(6), 562; https://doi.org/10.3390/min11060562
Submission received: 29 April 2021 / Revised: 21 May 2021 / Accepted: 21 May 2021 / Published: 25 May 2021
(This article belongs to the Special Issue Evolution and Modeling of Iron Ore Sintering Process)

Abstract

:
Sinter quality is a key element for stable blast furnace operation. Sinter strength and reducibility depend considerably on the mineral composition and associated textural features. During sinter optical image analysis (OIA), it is important to distinguish different morphologies of the same mineral such as primary/secondary hematite, and types of silico-ferrite of calcium and aluminum (SFCA). Standard red, green and blue (RGB) thresholding cannot effectively segment such morphologies one from another. The Commonwealth Scientific Industrial Research Organization’s (CSIRO) OIA software Mineral4/Recognition4 incorporates a unique textural identification module allowing various textures/morphologies of the same mineral to be discriminated. Together with other capabilities of the software, this feature was used for the examination of iron ore sinters where the ability to segment different types of hematite (primary versus secondary), different morphological sub-types of SFCA (platy and prismatic), and other common sinter phases such as magnetite, larnite, glass and remnant aluminosilicates is crucial for quantifying sinter petrology. Three different sinter samples were examined. Visual comparison showed very high correlation between manual and automated phase identification. The OIA results also gave high correlations with manual point counting, X-ray Diffraction (XRD) and X-ray Fluorescence (XRF) analysis results. Sinter textural classification performed by Recognition4 showed a high potential for deep understanding of sinter properties and the changes of such properties under different sintering conditions.

1. Introduction

Together with lump iron ore and pellets, iron ore sinter is one of the major feeds for the production of iron in the blast furnace and can constitute up to 70–85% of the total ferrous burden. Sinter is a heterogeneous mix of hematite (primary unreacted or secondary), magnetite, complex ferrite phases known as SFCA (silico-ferrite of calcium and aluminium), silicate phases such as undifferentiated glass and larnite (di-calcium silicate) and un-reacted particles of flux or aluminosilicate gangue [1].
Sinter quality is very important for stable blast furnace operation and two major sinter quality parameters, strength, and reducibility, are both dependent on sinter mineralogy and texture [2,3,4]. To optimize sinter quality, relationships between sinter structure, mineralogy, porosity, the initial sinter mix, and the sintering conditions should be quantified [5,6]. Many techniques have been used to characterize the complex mineralogy of iron ore sinters. These include optical imaging [7,8,9,10,11,12,13], electron beam imaging [14,15,16] and Quantitative X-ray Diffraction (QXRD) [17]. All methods can identify the major phases present in sinter but with varying degrees of success [18]. The textural features (in this study, texture refers to a combination of crystal morphology and porosity) of iron ore sinter, on the other hand, are much harder to quantify, particularly where the chemistry of comparable phases is similar but the crystal morphology varies (e.g., the SFCA group of phases), and also where porosity is micro- and nanometer-sized in scale. For determining porosity, techniques are available such as mercury porosimetry for pore size determination, BET (Brunauer–Emmett–Teller) porosimetry relying on the physical adsorption of gas molecules on a solid surface, as well as more recent techniques involving X-ray based microtomography where 3D imaging enables important features such as pore connectivity to be revealed. The measurement and quantification of textural/morphological features on the other hand, is a more intractable problem.
In this study, we briefly review some of the available techniques used for characterizing the mineralogy of complex iron ore sinters before describing results from an optical image analysis (OIA) technique we have developed that allows the automated identification of major sinter phases and their different morphologies/textures. Importantly, the technique allows automated segmentation of phases with similar chemistry, and hence similar reflectance in reflected light microscopy, thereby giving accurate representation of the phase types present in the sinter. The OIA results are then directly compared with previous chemical and mineralogical results from QXRD, X-ray fluorescence (XRF) and manual point counting (PC) studies reported by [18]. We use the existing comprehensive data set to provide an assessment of the relative strengths and weaknesses of each approach and show how improvements in automated segmentation can lead to an improvement in quantification of texture analysis results.

2. Techniques for Characterising the Mineralogy of Iron Ore Sinter

2.1. Optical-Based Methods

Optical microscope-based manual point counting is the traditional way of characterizing the mineralogy of iron ore sinter. The technique is capable of identifying all phases present as well as identifying the different phase morphologies present such as primary versus secondary hematite and the different SFCA morphological types. Characterization is based on the color, reflectivity and morphology of each phase using a reflected light microscope fitted with a stepping stage. For an experienced microscopist, results can be quite accurate; however, the decision to designate a particular phase/texture is always rendered subjective and can be different between mineralogists.
OIA methods attempt to remove operator bias by relying on thresholding the image signal [19], thereby enabling effective phase discrimination. Thresholding techniques can be applied automatically or manually, and numerous software packages employ this approach. For simple systems, OIA techniques perform extremely well, however in complex systems such as iron ore sinter, OIA can have problems distinguishing between different minerals/phases with similar reflectivity. In addition, OIA techniques based on reflectivity thresholding alone usually cannot distinguish different morphologies of the same, or chemically similar, minerals. In recent years imaging software has been developed that incorporates textural identification methodologies which enable discrimination between the different chemical and morphological types of SFCA phases and between the different hematite types in sinter [8,20].

2.2. X-ray Diffraction-Based Methods

Phase quantification by powder X-ray diffraction methods is capable of providing quantitative mineralogical information of the components present in iron ore sinter. Reliable phase quantification using the Rietveld method is dependent on accurate crystal structure data for the constituent phases being available from the literature for all the phases [21]. QXRD analysis using the Rietveld method reports weight abundances of all crystalline phases included in the model and the quantity of amorphous phase present in the sample, using an external standard. Previous work using QXRD for sinter analysis has identified crystalline phases such as hematite, magnetite, SFCA, SFCA-I, larnite (Ca2SiO4), mordenite and quartz [18]. However, sinter can contain a significant amount of glass (quench melt). Glass by definition is non-crystalline and hence cannot be directly measured by the XRD technique. To account for the presence of glass the accepted procedure is to ascribe any amorphous or non-crystalline material present as glass and model the fit [22]. Honeyands et al. [18] noted that such an approach can potentially overestimate the glass amount, especially if other fine-grained X-ray amorphous material is present. It should be noted that in comparison with imaging methods, QXRD does not give any information on porosity, structure and mineral associations which can be critical for understanding sinter quality and behavior in the blast furnace.

2.3. Electron-Beam Based Methods

Electron-beam methods for sinter characterization are based on Scanning Electron Microscope (SEM) platforms and include QEMSCAN [14,15], the Mineral Liberation Analyser (MLA) [23] and, more recently, the TESCAN Integrated Mineral Analyzer [16], or the ZEISS Mineralogic System [24]. The use of Energy-Dispersive (ED) X-ray spectrometers means that phases are distinguished on the basis of their chemistry and all systems include image analysis software enabling calculation of key textural parameters such as grain size, liberation, locking and mineral associations.
For all SEM-based systems, potential difficulties in characterization and textural analysis occur when phases of similar chemistry have similar average atomic numbers. This results in a lack of contrast in back-scattered electron imaging thereby making mineralogical distinctions and segmentation difficult. For example, recent work by Honeyands et al. [18] showed that application of the TESCAN Integrated Mineral Analyzer (TIMA) to sinter characterization could not segment hematite from magnetite due to the very similar back-scattered electron signal from the two phases. Similar problems were also noted in a recent review by Tonzetic [25]. Furthermore, distinguishing the different subtypes of SFCA on the basis of chemical composition, such as Fe content [26], Si content, or Fe/Si ratio, was also unsuccessful. The QEMSCAN technique was however capable of distinguishing hematite and magnetite, as well as SFCA (prismatic) and SFCA-I (platy), although the iron contents of the two phases detected by QEMSCAN were opposite to those expected [18]. Critically, in a figure showing a comparison of TIMA and QEMSCAN results with image analysis and QXRD results, hematite was combined with magnetite and SFCA was combined with SFCA-I. Donskoi et al. [27] showed that there was clear misidentification of hematite and magnetite using the QEMSCAN methodology in a study comparing its use with OIA characterization of iron ore. In addition to inconsistencies when trying to identify sinter mineralogy, automated SEM techniques are also limited by sample resolution, which is directly connected with imaging time and operating parameters such as accelerating voltage and beam current. To perform analyses economically, high voltages are needed to generate high counts and a beam step size of 5 or even 10 µm is usually required. These affect imaging quality and the technique’s capability to properly characterize structure and micro-porosity, which may in turn affect the mineral abundance results [18,27].
In summary, for minerals such as hematite and SFCA phases it is important to identify the major phases, as well as the different morphologies of such minerals as these will impact sinter parameters such as reducibility and strength. In particular, it is important to distinguish primary hematite, derived from the initial iron ore blend, from secondary hematite, which mainly precipitates during cooling from the sinter melt. Primary hematite mainly comes from unreacted hematite nuclei (microporous and reducible) and typically occurs in association with SFCA bonding phases. Platy SFCA, formed at relatively low sintering temperatures, has typically been associated with good sinter strength and reducibility [28] due to its porous, interlocking texture and forms at lower temperatures than SFCA [29,30]. Secondary hematite, on the other hand, is associated with higher temperatures and melt-formed phases. Its occurrence as secondary skeletal hematite, in particular, has been identified with promoting increased low temperature reduction degradation in the blast furnace [31]. Definition of the boundary between primary and secondary hematite is not always straightforward but is typically based on evidence of melting and/or recrystallisation (i.e., loss of original microtexture and grain morphology) that indicates a reaction. Secondary hematite grains are considered to be those individual grains fully surrounded by melt and with included melt in their structure, whereas primary hematite grains remain substantially in contact with other hematite grains, without the presence of melted phases inside and preserving original morphology. Hematite grains that have undergone solid-state recrystallisation during heating (e.g., those formed from hydrohematite) are, therefore, still considered as primary hematite, unless other evidence of significant reaction (e.g., interstitial SFCA) is present. It is clear that without analyzing the hematite morphology, neither QXRD nor electron beam-based methods can segment primary from secondary hematite.

3. Sample Preparation, Imaging and Methodology

3.1. Sample Preparation

Three sinter samples with binary basicities (mass ratio of CaO/SiO2) ranging from 1.6 to 2.0 were analyzed. Two of these sinter samples were obtained from industrial sinter strands, with the third being produced in a pilot-scale sinter pot. Further sample details including bulk chemistry and previous characterization data can be found in Honeyands et al. [18].
Lump-sized pieces of sinter from different parts of the sinter plug were collected for each sample and these were crushed for representative automated sinter OIA characterization, as described in Honeyands et al. [18]. After crushing and homogenization, a small portion of the −1 mm size range from each sample was collected to prepare a representative epoxy-resin mounted sample. Following the procedures outlined in Donskoi et al. [32], a vertical section from the original mount was then prepared to avoid misrepresentation of the sinter due to possible density segregation. Density segregation during sample mounting represents a significant problem in the preparation of mounted particle samples for OIA due to the large density differences between different sinter phases, e.g., hematite ~5.1 g/cm3 and quartz/glass ~2.6 g/cm3. Sinter phase characterization on a non-vertically sectioned block may give modal results quite different from the mineral abundances in the actual sample [32].
The polishing method employed for preparing polished blocks of sinter samples for image analysis is also critical. For the results reported here, a standard method was used. The vertically mounted samples were plane ground on silicon carbide discs with water as the lubricant, fine ground with 6 µm diamond suspension and polished with 3 and 1 µm diamond suspension. This method, with cleaning in water between stages, resulted in etching and loss of larnite at the surface of the mounts. In the image analysis method used, it was assumed that all micro-porosity within the sinter microstructure was ex-larnite. Evidence to support this approach is presented in the results from samples prepared separately using a water-free method, where the larnite was fully preserved (see “Segmentation of larnite” subsection).

3.2. Sample Imaging

Imaging of the polished sinter samples was performed on a ZEISS optical microscope Imager.Z2m using a moving stage with collection of sets of 4 × 4 MosaiX elementary images. The imaging was performed with a magnification of 200×. Imaging at lower magnification makes automated identification of very fine structured phases (e.g., Platy SFCA) unreliable. However, even a magnification of 200× may not be enough to adequately characterize the fine microstructure of some sinters. Utilization of a higher magnification (e.g., 500×) however will significantly increase imaging time, the size of images and processing time and, therefore, the final cost of processing.

3.3. Optical Image Analysis Software

The OIA system Mineral4/Recognition4 (developed by Commonwealth Scientific Industrial Research Organization, Australia) was initially created for iron ore characterization but was later extended to characterization of other ores, sinters, pellets/lumps and coke [8,33,34,35]. It allows automated collection of images using a ZEISS optical microscope with a motorized stage, as well as automated identification of particles, minerals/phases and porosity. It performs manual, semi-automated and automated measurement of collected images and comprehensive characterization of individual particles/areas which include textural classification, liberation analysis, mineral association analysis and calculation of mineral composition, chemical assay, density, dimensional or textural characteristics for every particle section. Reporting can also be performed for a selected liberation class, texture class or particle group based on user-defined mineral, dimensional, textural or chemical criteria. The specifically developed multi-threshold and textural identification techniques [20] permit a significantly improved phase identification, allowing segmentation of phases with similar reflectivity but different morphology, which is very important in sinter OIA characterization. The software users can develop their own specific textural classification schemes, which can be used for various ores and sinters.

4. Automated Segmentation of Phases in Sinter

4.1. Segmentation of Primary and Secondary Hematite

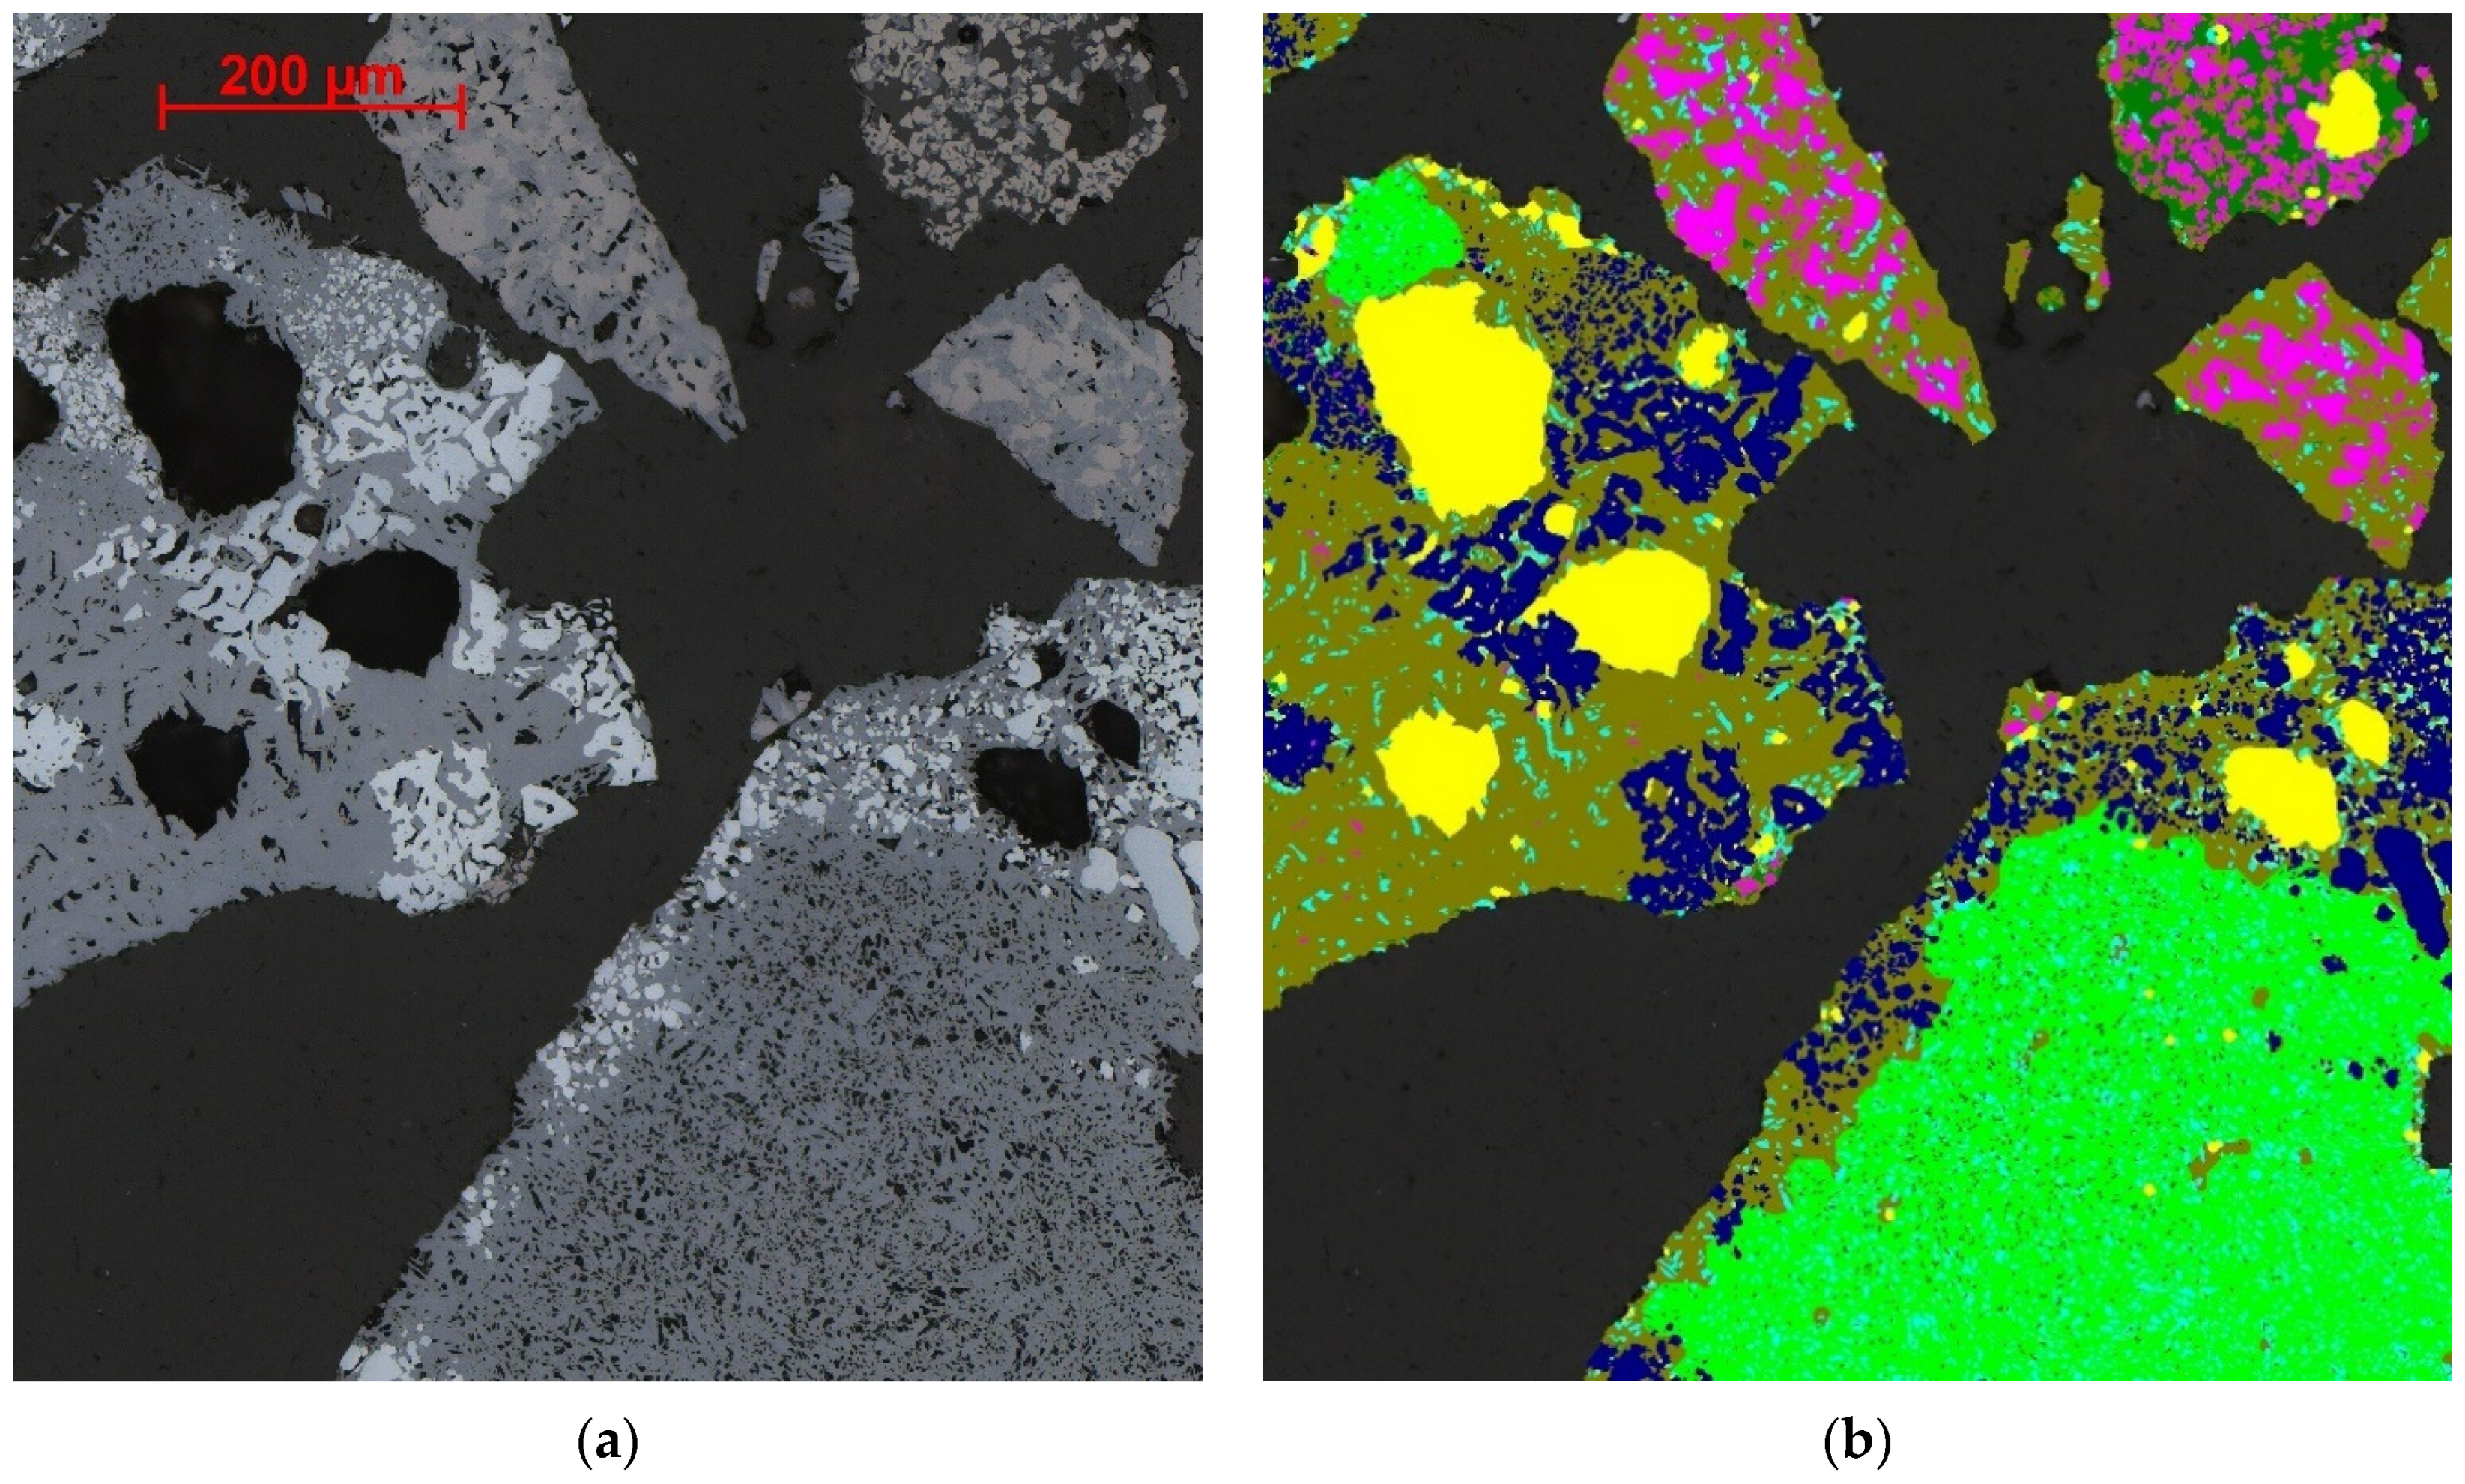
Segmentation of primary (unreacted coarse nuclei and smaller aggregates of unreacted hematite grains) and secondary (crystallized during cooling) hematite in iron ore sinter provides a good example of textural identification [20]. Images in Figure 1 show an original reflected light photomicrograph of a number of sinter particles comprising hematite (primary and secondary), SFCA (both sub-types), magnetite, larnite (washed out, represented by fine porosity) and glass. Hematite appears as the brightest phase (white color, Figure 1), having a very slight greyish tint in some areas due to grain/crystal orientation effects or particle edge relief at the boundary with the mounting resin. There is no difference in color/brightness between primary and secondary hematite particles and, therefore, they cannot be segmented by thresholding [8,19]. The only visible difference between the two hematite types is their crystal shape meaning that segmentation can only be based on morphology. The primary hematite morphology is visible in the large particle at the center of Figure 1a as well as the smaller, bright particle directly above (also shown in Figure 1b as the light blue material). Examination of both particles indicated that they had not significantly changed from their original morphology during the sintering process, i.e., these grains represent remnant stable coarse hematite particle nuclei. In comparison, secondary hematite (dark blue in Figure 1b), which precipitated from the melt phase during cooling, is present mainly in the large particle at the bottom of the figure as relatively smaller grains associated mainly with SFCA (olive), magnetite (magenta) and larnite (cyan). Compared to the primary hematite, the secondary hematite is highly crystalline (euhedral in shape) and mostly coarse-grained. Classification based only on the size of the two different hematite grains would not help for segmentation, as smaller grains of secondary hematite in the lower particle are connected one with another and their combined area is much larger than the smaller particles of primary hematite. Effective segmentation of these two types of hematite is based on the mineralogical associations where SFCA and glass are present within the secondary hematite network while absent within the primary hematite particle.
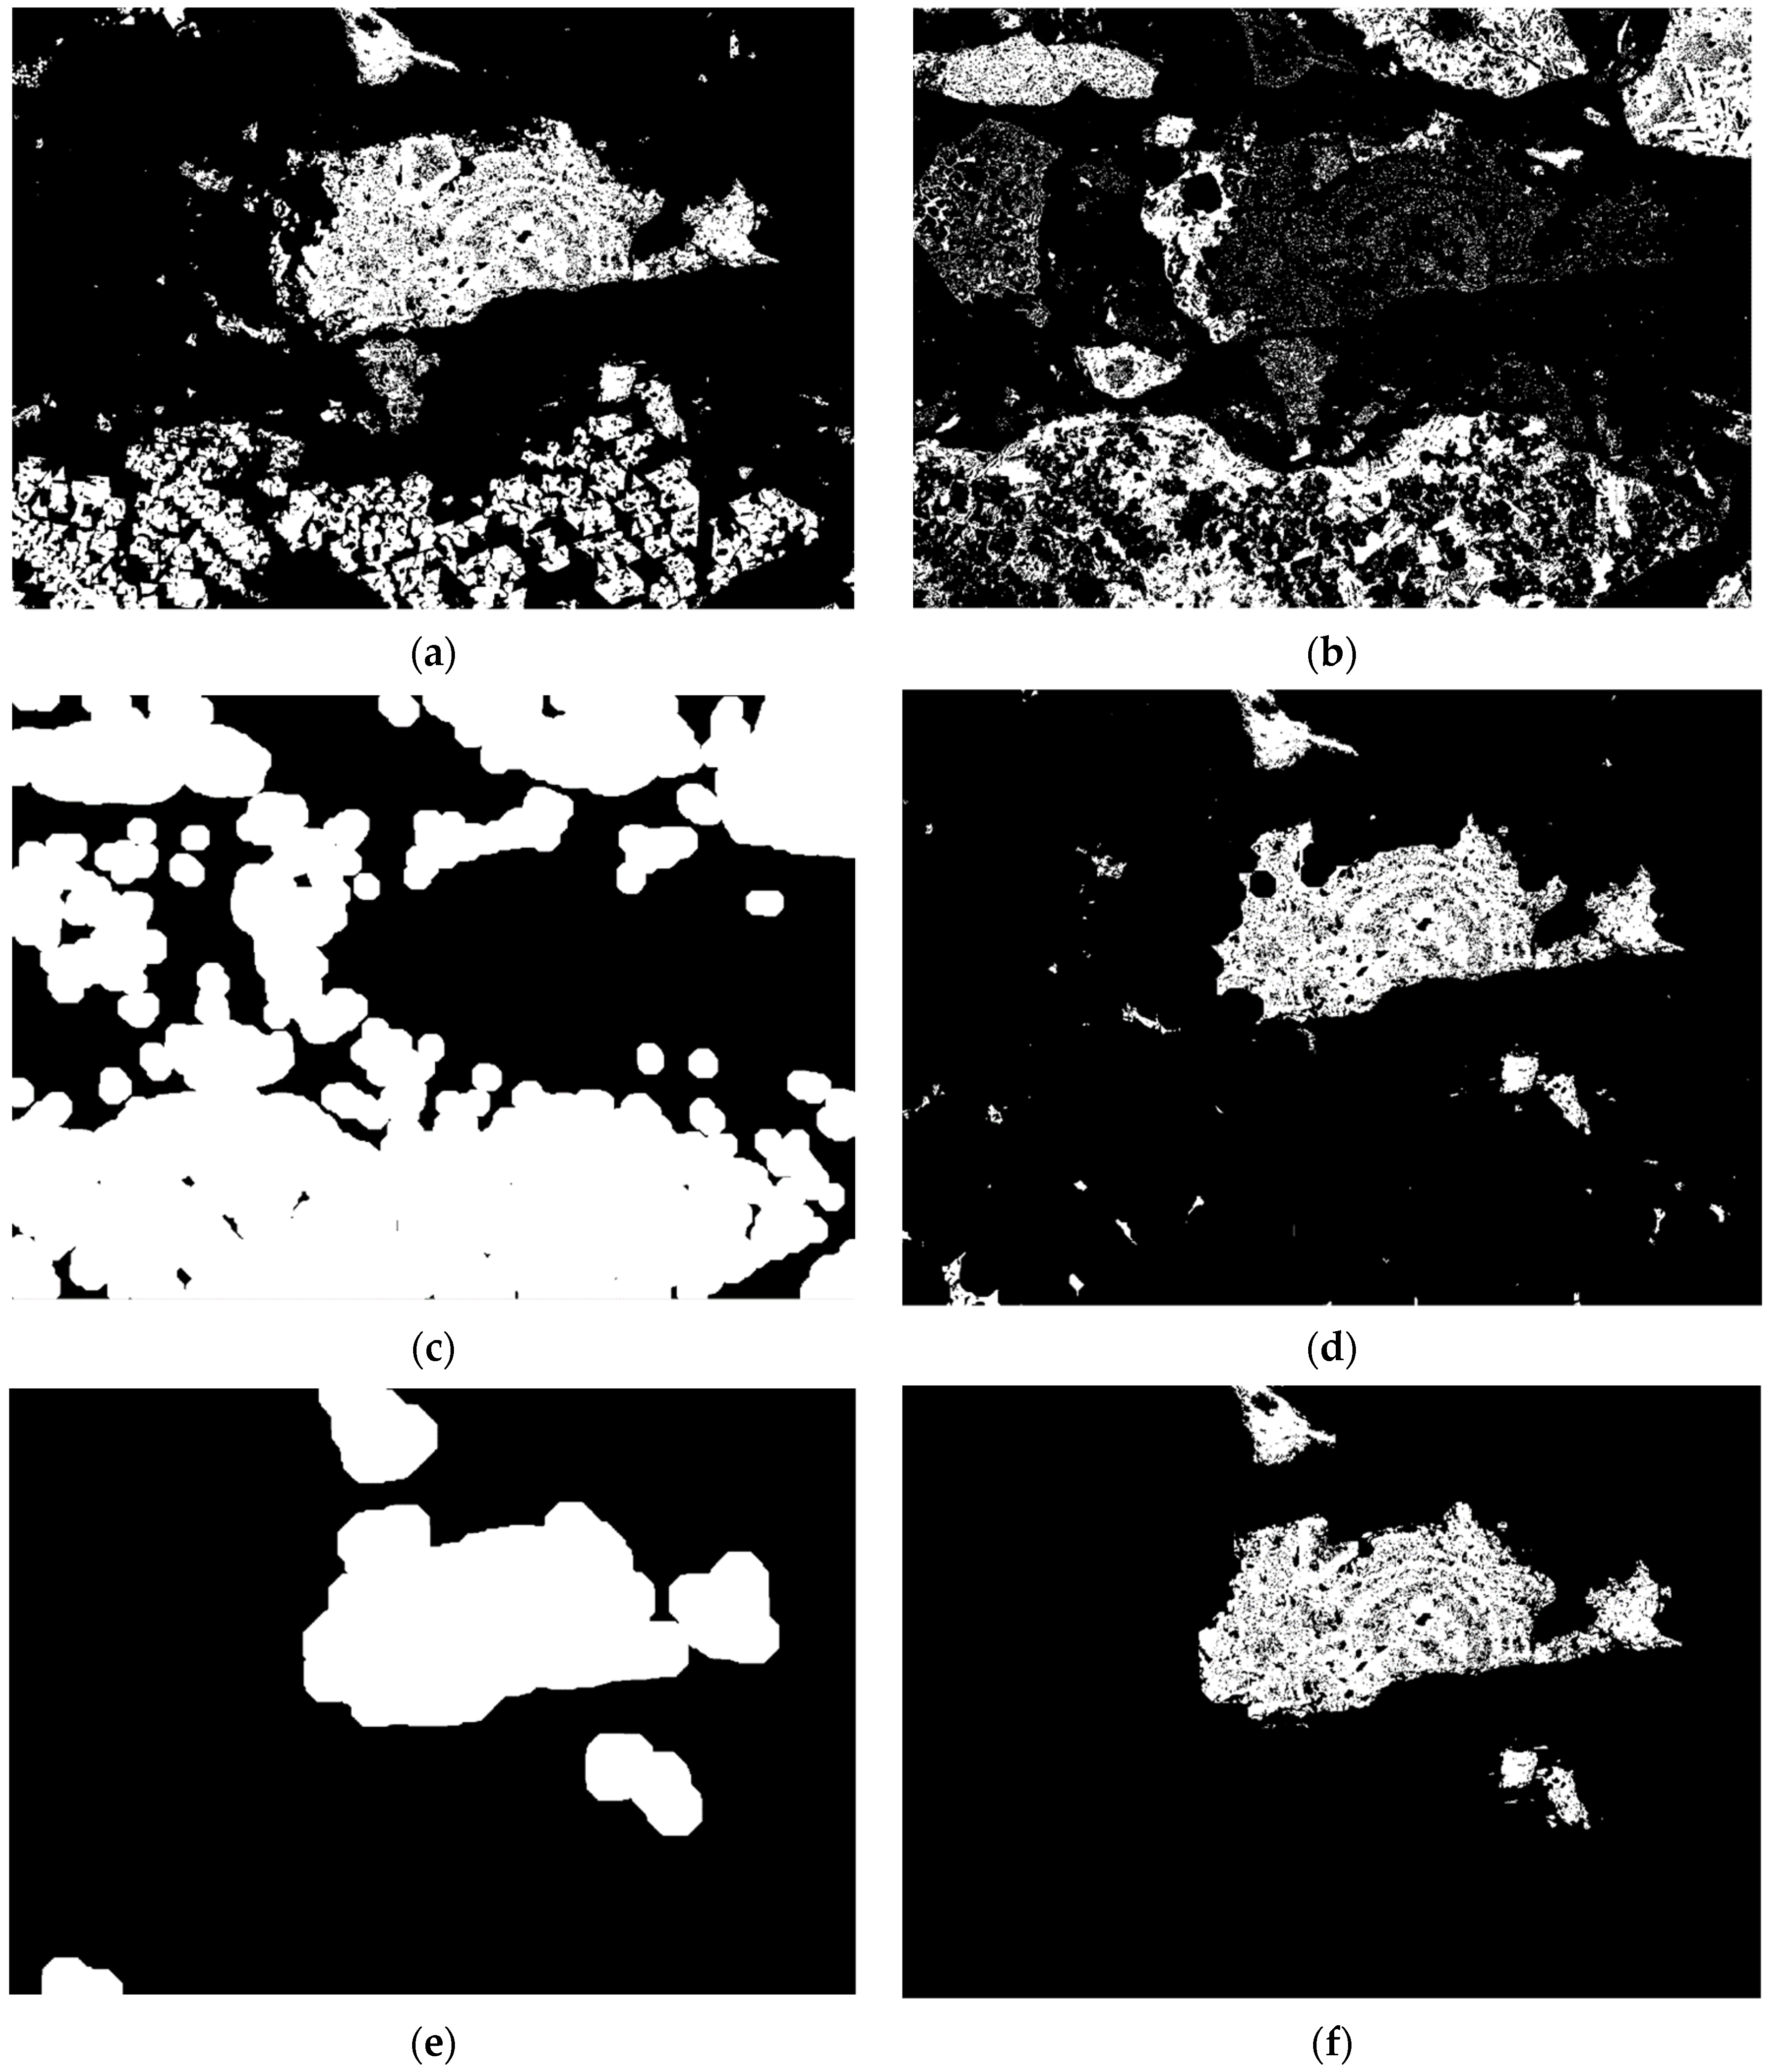
To segment primary hematite from secondary hematite, the textural identification (TI) routine developed within the Mineral4 software initially creates two maps: the first one is a hematite-only map (Figure 2a) and the second includes other phases such as the SFCA sub-types, glass and all other phases darker than the SFCA sub-types, if present (Figure 2b). Magnetite is not included in the second map. Even though it typically occurs in significant abundance in the melted part of the sinter, it may also be present within the primary hematite. After binary processing of the second map involving standard image analysis procedures such as scrapping, erosion and dilation, the TI routine creates a map of areas (Figure 2c) which are associated with glass, total SFCA and other phases involved in the creation of the map shown in Figure 2b. These represent areas where primary hematite should not occur, although secondary hematite may be present. These areas are then removed from the hematite-only map, producing a map which represents the distribution of primary hematite only (Figure 2d). With additional binary processing (scrapping, dilation, erosion and further dilation) the TI routine creates a map of all possible primary hematite areas (Figure 2e).
After scrapping of relatively smaller pieces, the map of possible areas of primary hematite is then overlaid onto the hematite map and only areas common to both maps are left in the resulting image (Figure 2f). Due to the nature of the procedure, some small pieces of secondary hematite may still be present in the final map. Two relatively smaller areas (actually they are part of the large particle at the base of the Figure 1a) and some very fine grains can be seen below the large primary hematite particle (Figure 2f). It is clear, however, (Figure 1a), that these areas are not associated with SFCA/glass, therefore they are identified as primary hematite in this stage of textural identification. However, there are secondary hematite conglomerates in the large particle at the base of Figure 1a which are larger than these two areas. Therefore, if such secondary hematite crystals were fully liberated from other phases a correct classification would be problematic. That is why the final stage of primary hematite map development involves the scrapping of hematite areas less than a certain size (see Figure 1a and Figure 2f). As a result of this final procedure, fine grains such as these two smaller areas, are removed from the primary hematite map. All hematite remaining after the primary hematite was identified is then allocated as secondary hematite (Figure 1b).

4.2. Segmentation of SFCA Microtypes

Work over the past 30–40 years has identified that there are two main types of SFCA phases present in iron ore sinters [36,37]. One is a high-Fe, low-Si form called SFCA-I (e.g., Ca3.2Fe2+0.8Fe3+14.7Al1.3O28), and another is a low-Fe form called SFCA (e.g., Ca2.3Mg0.8Si1.1Al1.5 Fe8.3O20). Together, these two phases can make up a significant volume of iron ore sinter. The two main SFCA sub-types are similar in chemistry and they are difficult to accurately identify using optical microscopy due to their similar reflectivity.
Mineralogists have also identified different SFCA phases based on morphology and a number of descriptive terms have been applied when distinguishing SFCA sub-types. These include terms such as: prismatic [28], platy [36] and dendritic [38]. However, there is no definitive terminology and often sinter petrologists use different terms for the same SFCA morphological types (e.g., prismatic SFCA is often referred to as columnar whereas platy SFCA is sometimes called acicular or fibrous). Industry most often identifies only two different types of SFCA: prismatic SFCA and platy SFCA. It has often been assumed that the mineral phases SFCA and SFCA-I correspond to the prismatic and platy morphologies; however, recent work has thrown some doubt on this correspondence [39].
Platy SFCA can be easily recognized by its typical finer and micro-porous texture compared to prismatic SFCA. Figure 3a shows typical textures associated with the two SFCA sub-types, where the large particle towards the bottom right contains platy SFCA (light green in Figure 3b) and the large particle towards the top left contains prismatic SFCA (olive color in Figure 3b), associated with secondary hematite. Other smaller particles where SFCA is shown in association with magnetite are also present in the images.
Note that iron ore sinter may include other less complex calcium ferrite and ferrite phases [26,30] such as SFC (silico-ferrite of calcium [40], CF (CaO·Fe2O3), CF2 (CaO·2Fe2O3)) etc. In plant and pot-grate sinter these phases are typically minor constituents (not easily detected by XRD) and are included with SFCA in OIA or point counting analyses, if present. These phases usually have reflectivity quite close to SFCA.
To segment platy SFCA from prismatic SFCA, the TI routine within Mineral4 initially creates a map of all SFCA types (including any ferrites) in the image by simple multi-color RGB thresholding (Figure 4a, Donskoi et al. [41,42], also see [9]). From the inverse map of all minerals (excluding dark phases), a map of porosity, epoxy and dark phases such as glass and larnite combined is created (Figure 4b). Magnetite areas are also included in this map.
To automatically identify platy SFCA, any SFCA with interstitial spacing resembling the micro-porosity associated with platy SFCA must be segmented. It should be noted that almost all such porosity was initially likely occupied by larnite and it now resembles micro-porosity due to larnite removal during polishing. For segmentation of these areas, all fine elements representing interstitial spacing between platy SFCA crystals were removed (Figure 4c) from the map in Figure 4b, and a map of only these fine elements created (Figure 4d). Furthermore, a map of fine larnite clusters was identified (Figure 4e) and then this map overlaid on a map of all SFCA microtypes (Figure 4f). Again, relatively small areas not reliably representing platy SFCA were removed (see Figure 3b).
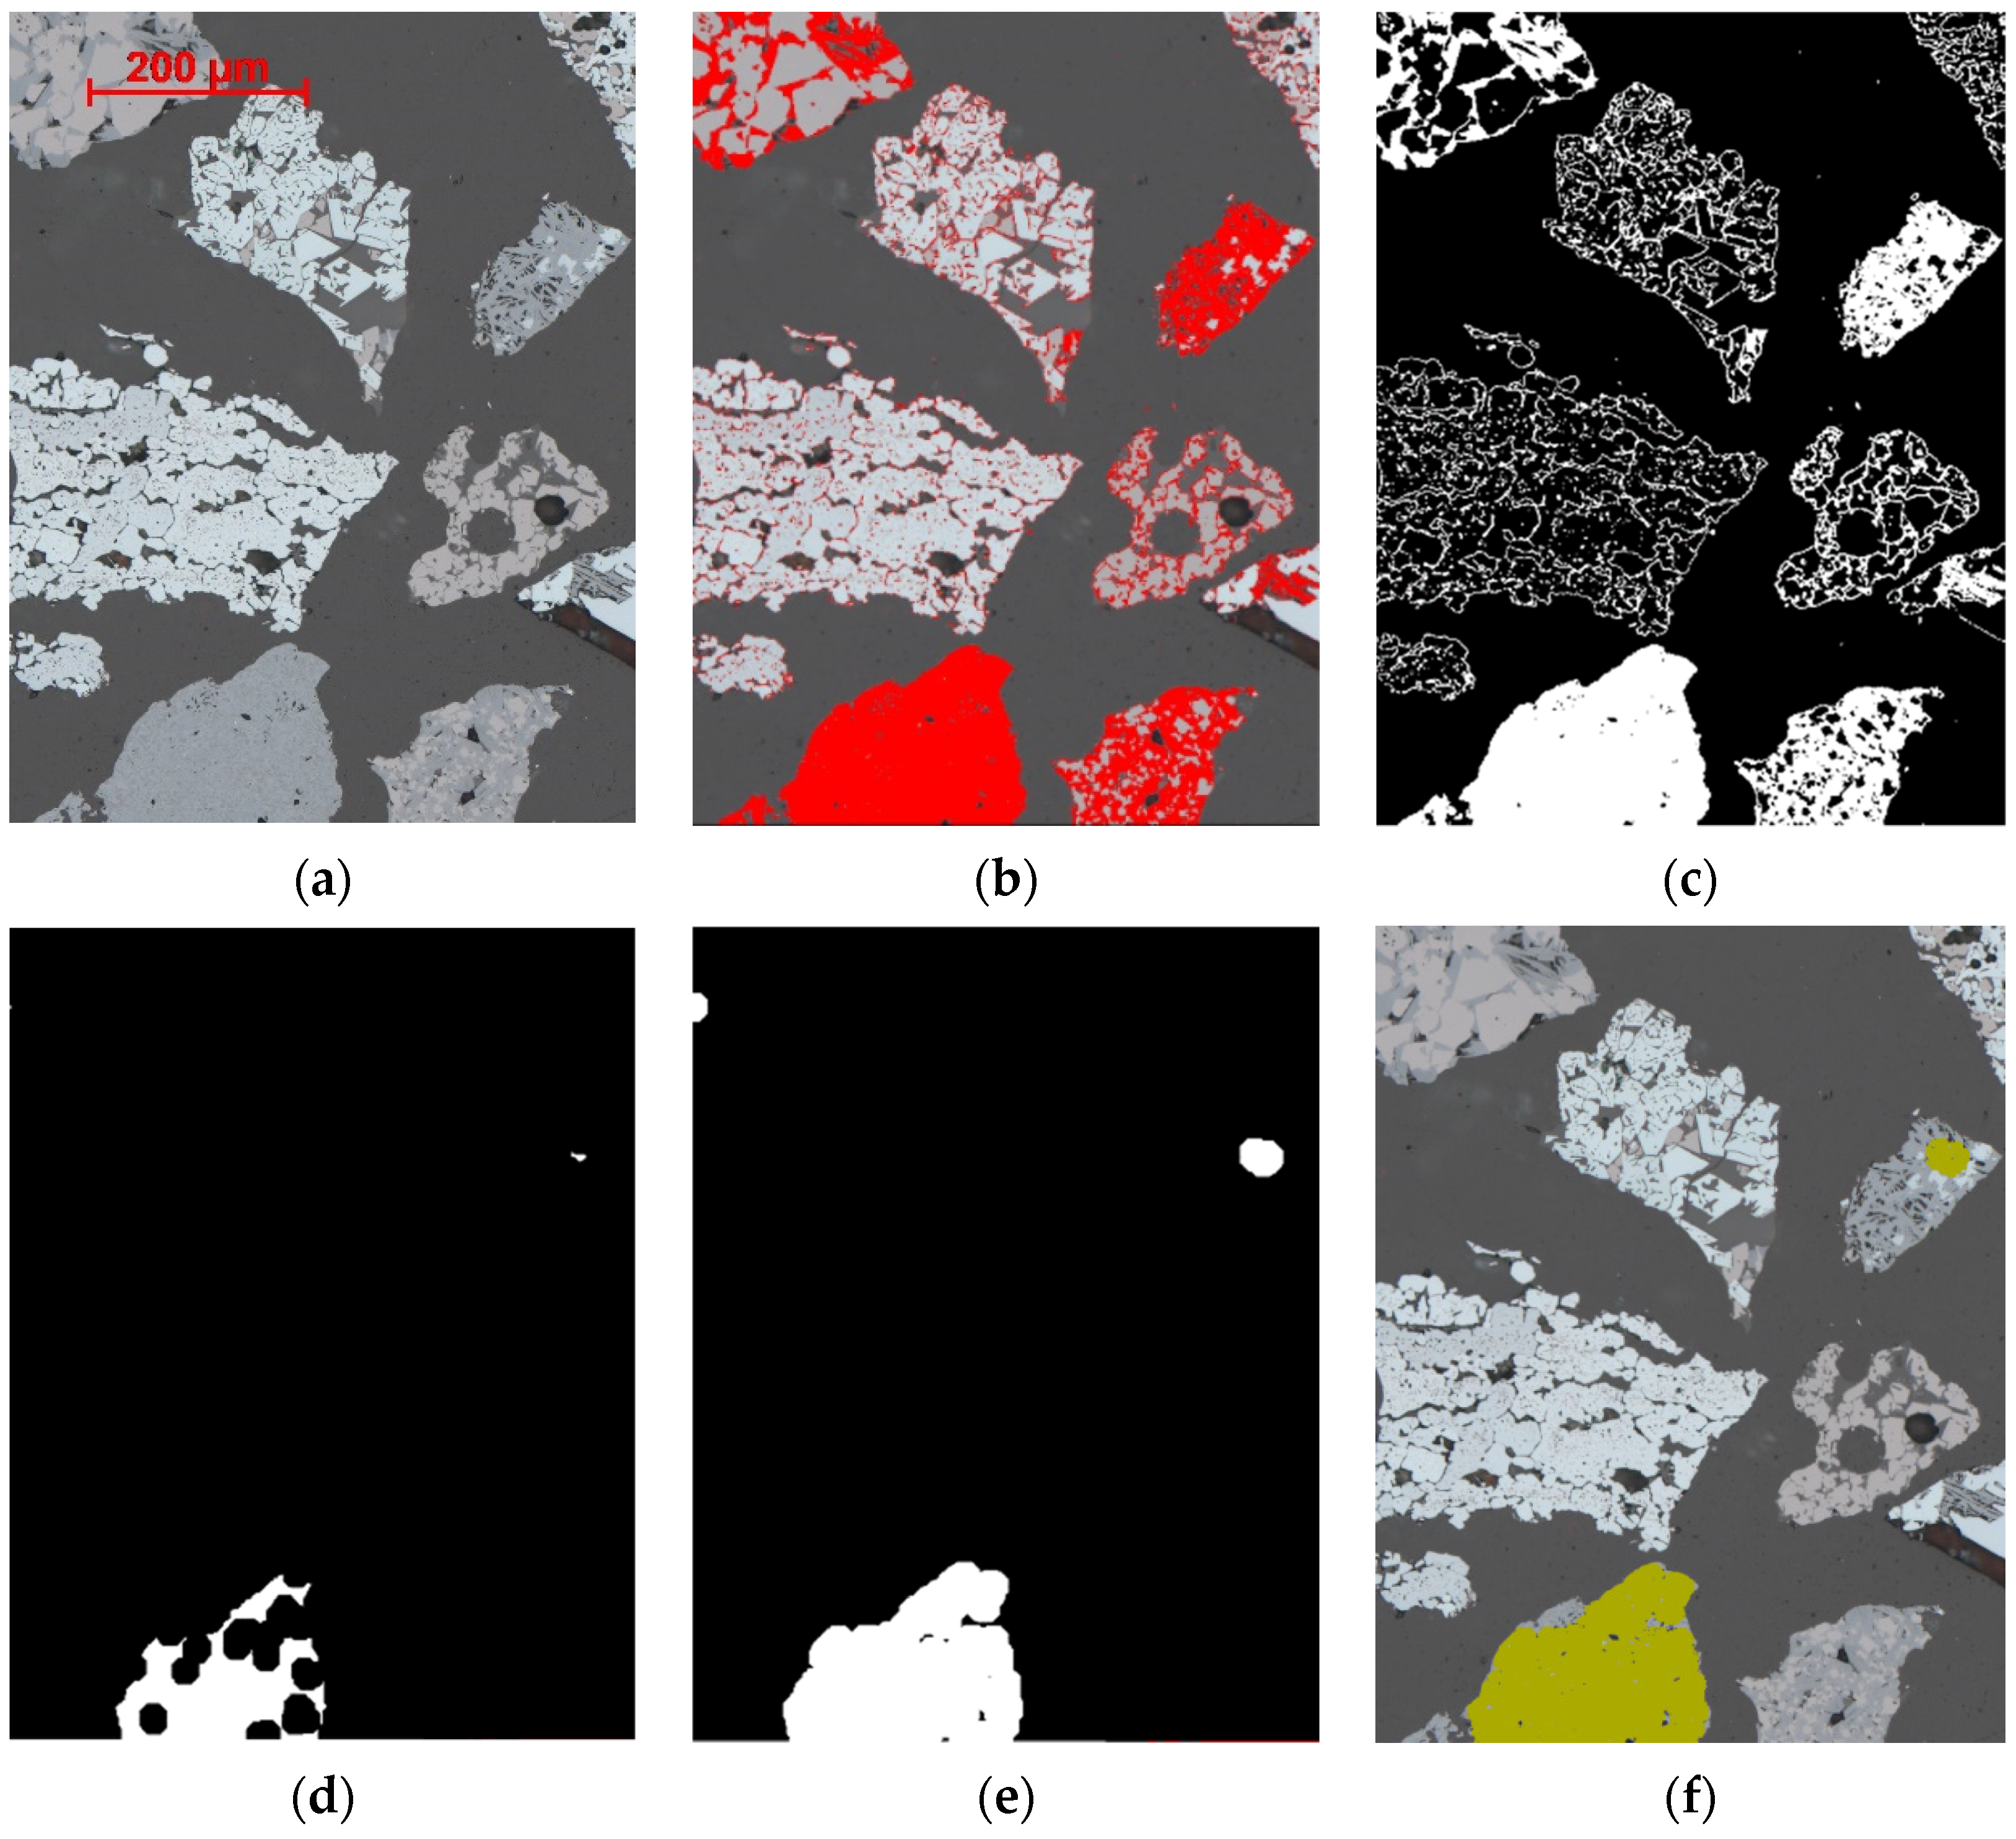
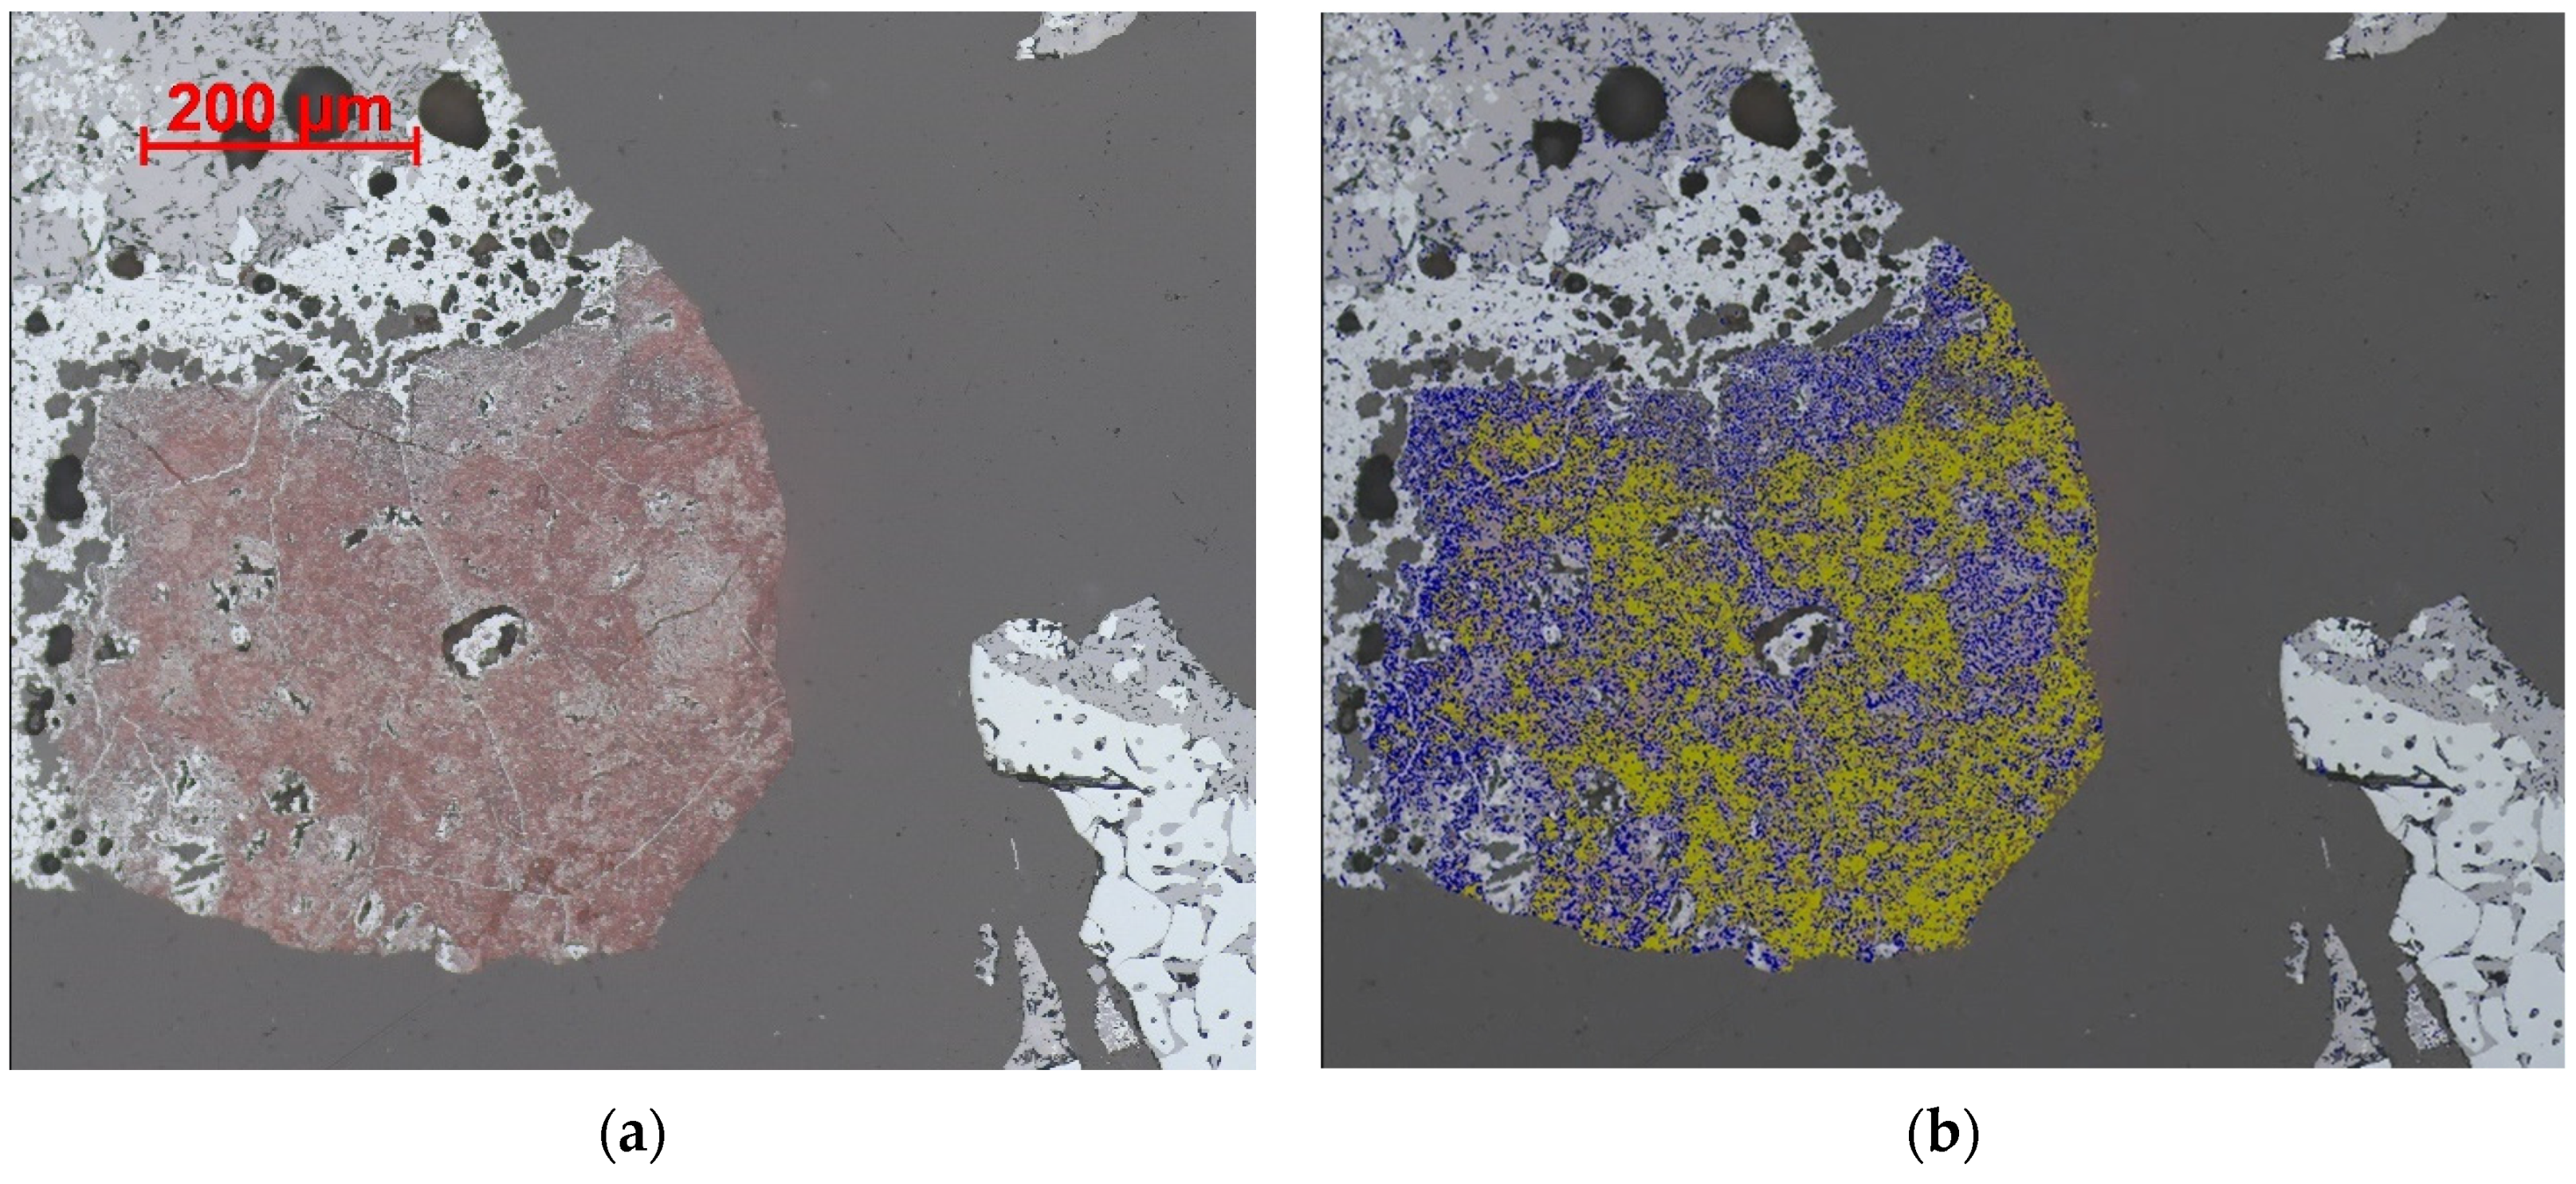
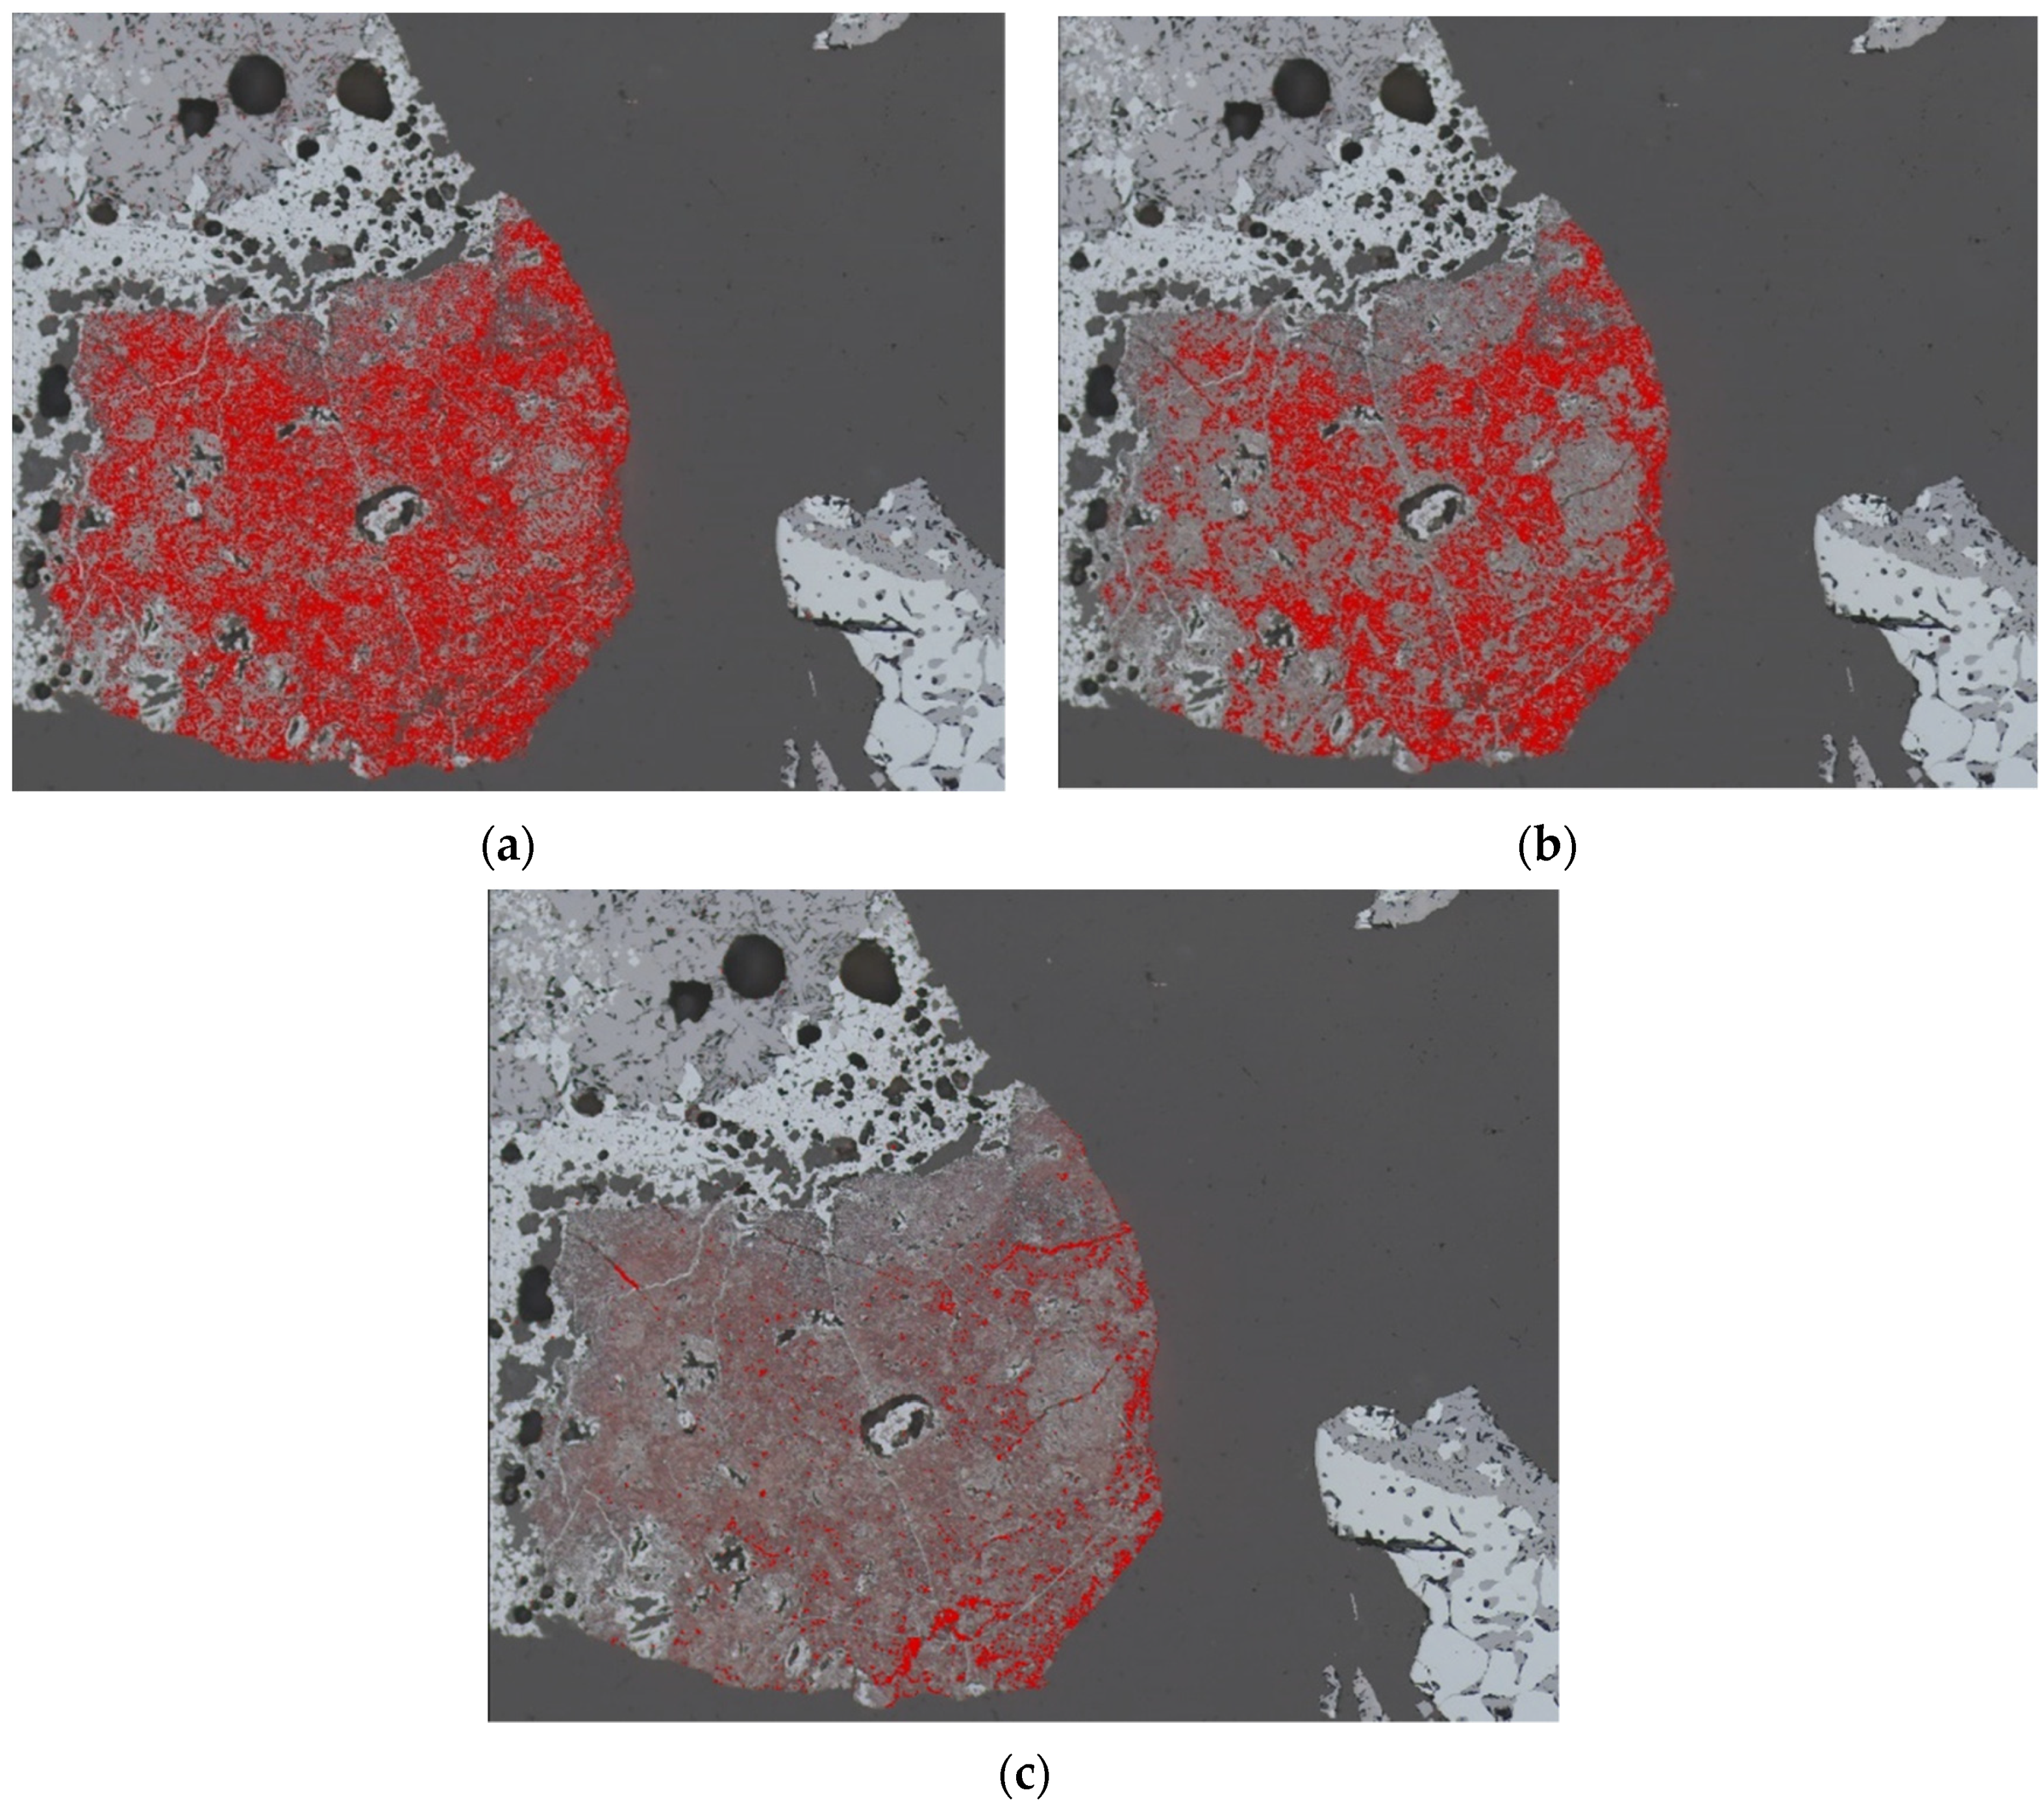
In some areas of iron ore sinter, it has been noted that SFCA can form dense regions (Figure 5a). Textural identification of dense SFCA is simpler than segmentation of primary hematite or platy SFCA. The procedure and results are provided in Figure 5. Initially all SFCA microtypes in the image are thresholded (Figure 5b red color), and the total SFCA map is dilated once to remove very fine cracks/noise or fine larnite associated with SFCA (Figure 5c). It can be seen that not only SFCA dominated areas, but a large number of other mineral boundaries are also present in this map. Next, a strong erosion is applied so all microstructures and areas corresponding to platy SFCA and prismatic SFCA (not dense) are removed (Figure 5d). What remains are the eroded areas of dense SFCA. Later, a strong dilation creates a map of clusters which include areas of dense SFCA (Figure 5e). The size of the SFCA clusters to be identified as dense SFCA is always quite subjective and so the last operation involves scrapping small areas of dense SFCA and overlaying the obtained map onto the overall SFCA map (Figure 5f).

4.3. Segmentation of Magnetite, Glass, Larnite and Aluminosilicate

4.3.1. Magnetite

Magnetite in iron ore sinter is usually distinctly different in morphology and reflectivity from phases such as hematite and the SFCA types. Sometimes however, if the magnetite contains appreciable amounts of solid solution impurities such as Mg, Ca, Al and Si, the magnetite reflectivity changes and it becomes difficult to accurately distinguish it from SFCA with simple thresholding, i.e., their reflectivities may interfere so the visible boundary between them becomes indistinct. Figure 6 shows an example of this situation where the magnetite particle shown at the right-hand side in Figure 6a exhibits the typical magnetite color and reflectivity. In comparison, the particle at the left-hand side of Figure 6a represents a mixture of magnetite and SFCA, and it is difficult to differentiate between the two—it is assumed that the magnetite that is in close proximity to SFCA is highly substituted. In this situation, in order to identify magnetite as well as possible, an operator may need to refer to images of different sinter particles utilizing additional information regarding chemistry (e.g., via SEM examination).

4.3.2. Glass

Reliable segmentation of glass can be very difficult for manual point counting as the reflectivity of glass is very close to the reflectivity of the epoxy resin mounting medium. The boundary between glass and epoxy can be almost invisible (see Figure 7) but is recognizable in many cases at the edge of particles, which assists manual identification (the example within the blue ellipse in Figure 7). However, in cases when a pore is fully filled with either epoxy or glass (no boundary), manual identification can be difficult. The problem can remain even if a boundary is present within a pore not fully filled with epoxy or glass (as in areas within red and white ellipses). However, modern optical systems can recognize more than 16,000 different shades of reflectivity, so glass can be reliably segmented by simple thresholding.
Figure 7 shows a sinter particle mainly consisting of secondary hematite, glass and magnetite (Figure 7a) and mineral map of this particle obtained during automated OIA (Figure 7b). The blue ellipse in Figure 7a demonstrates an area with a boundary between glass and epoxy. To assist the reader the authors have increased the brightness of the figure, however this boundary is still hardly visible. It also should be noted that for better automated segmentation of quartz and also for improved visibility of the boundary between epoxy and glass, a specific dye-based epoxy resin can be used [43].

4.3.3. Larnite

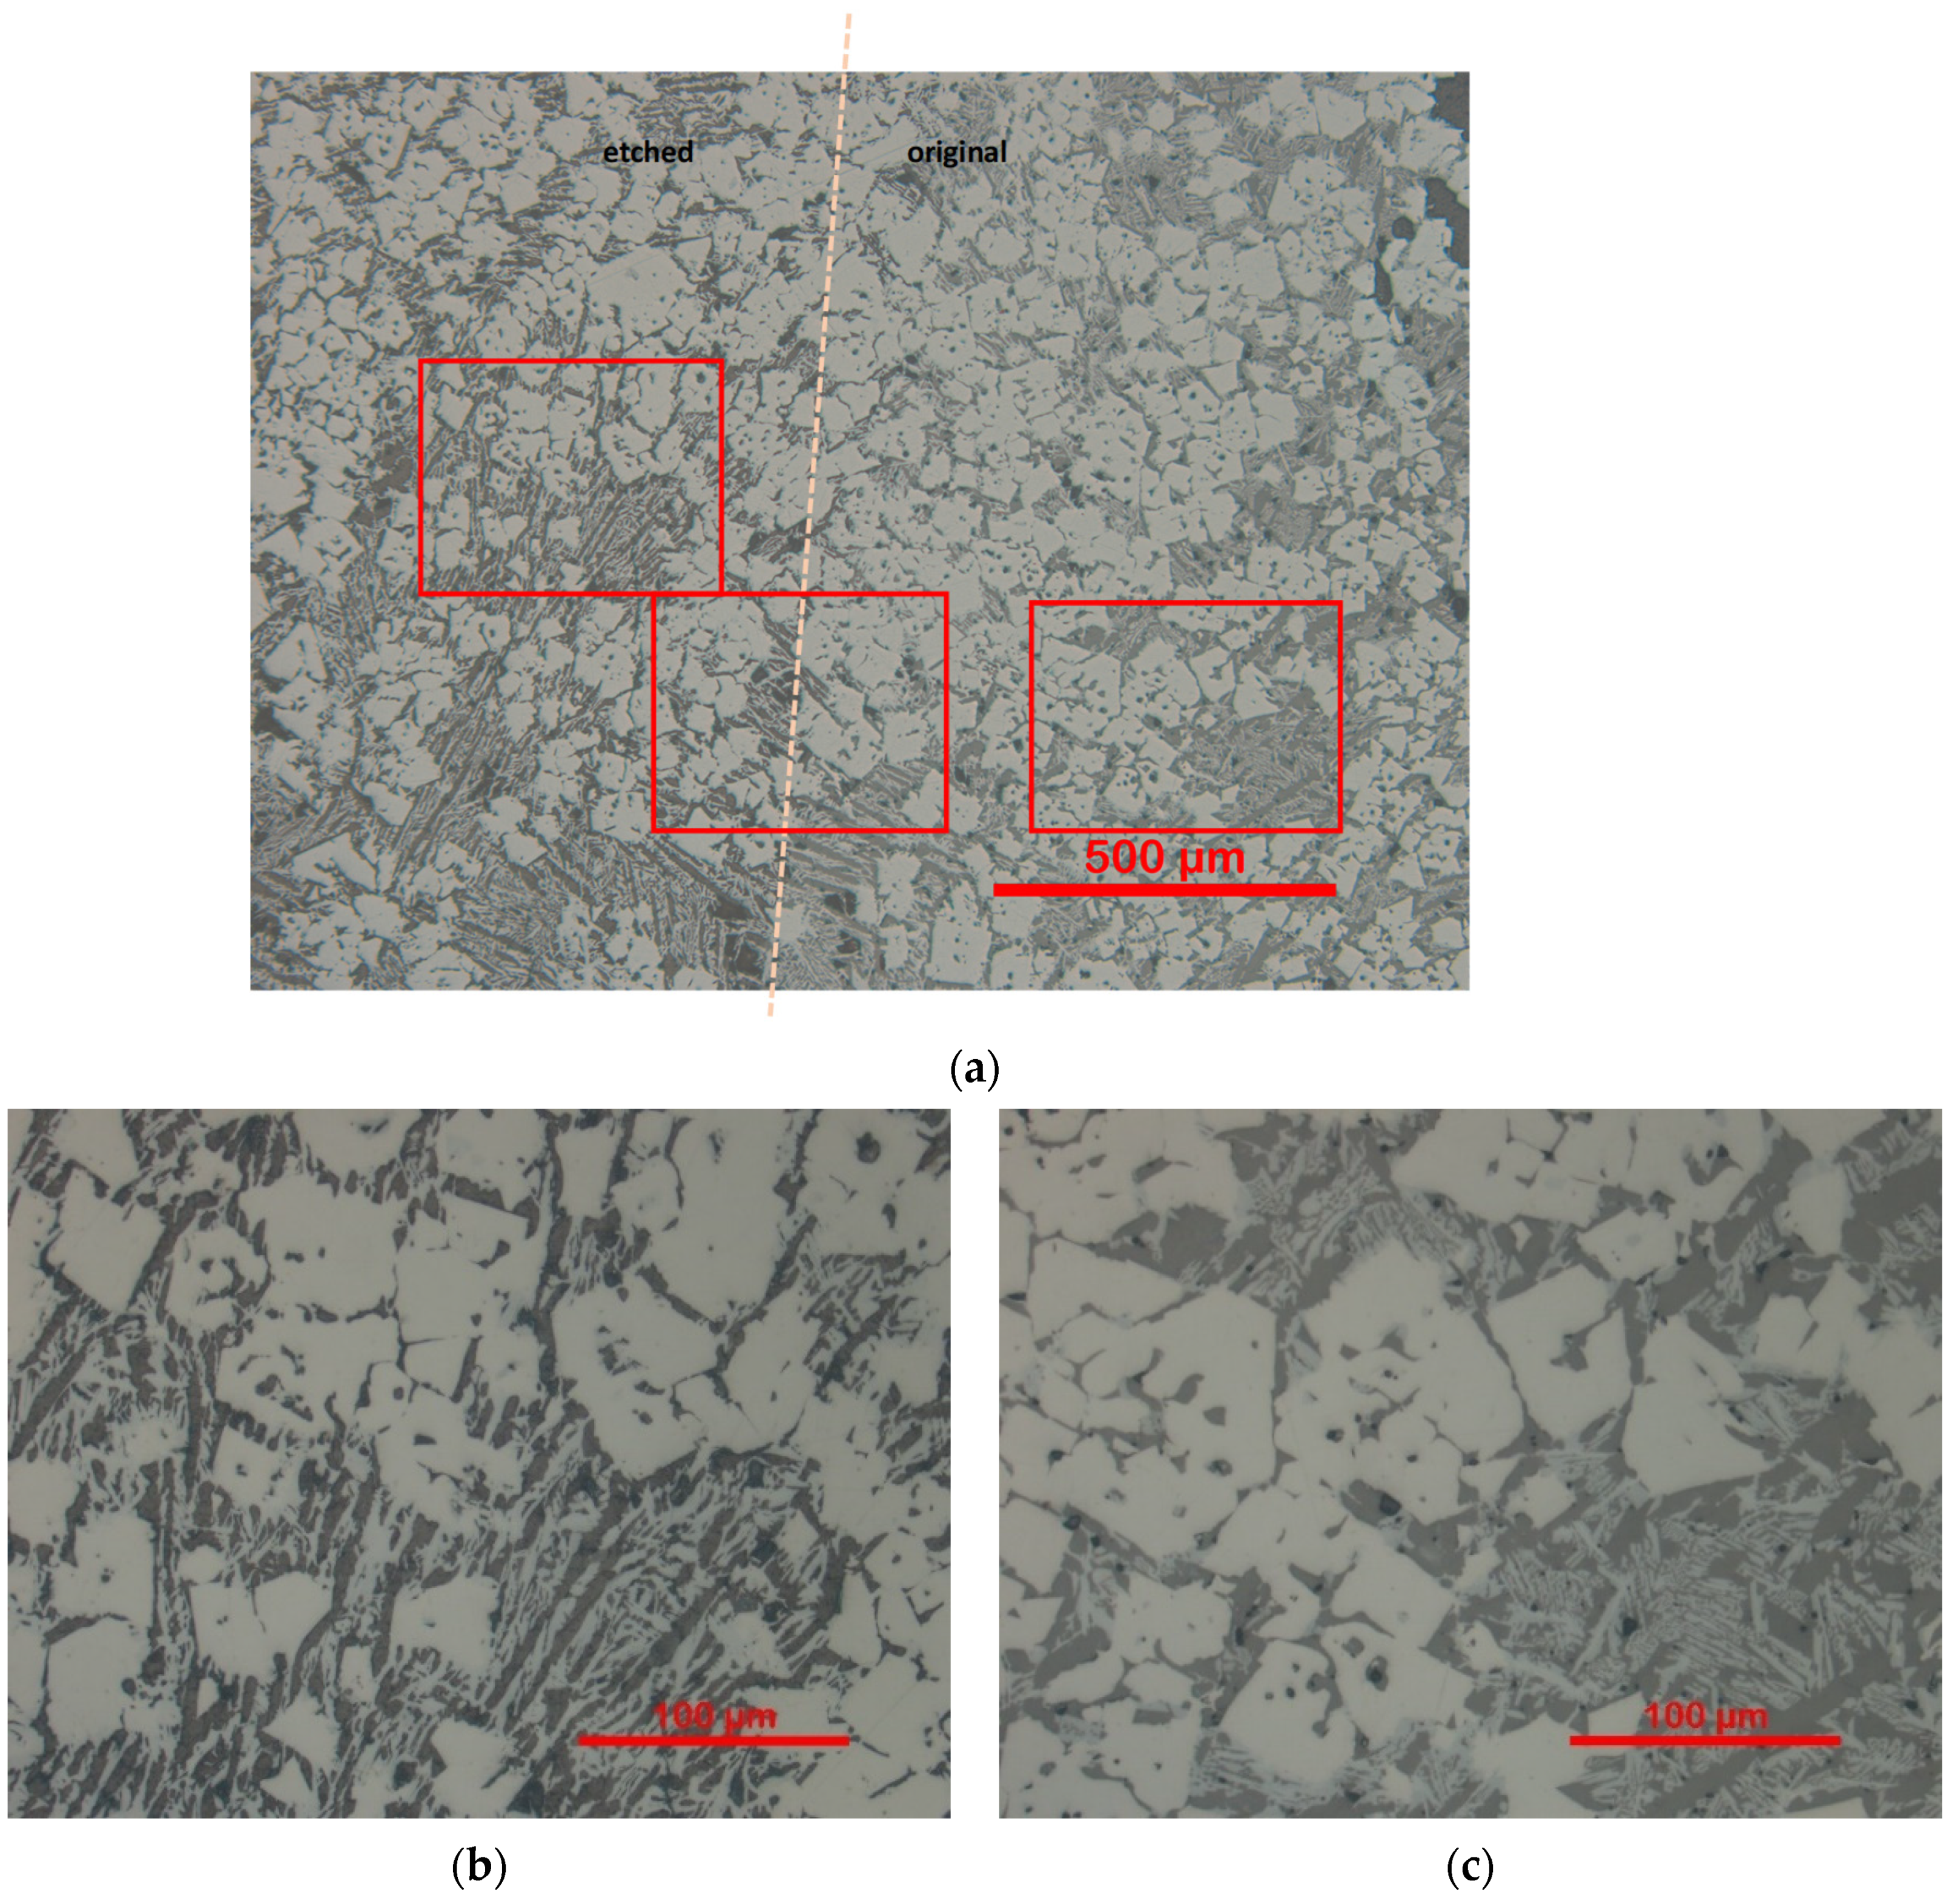
Segmentation of larnite and understanding of its association with other sinter phases is important as the presence of significant amounts of larnite in iron sinter can cause a sinter to weaken or break down, due to dissolution or volume change on phase inversion post-cooling [44,45]. The presence of relatively large amounts of larnite can, therefore, significantly reduce sinter strength. Larnite is soluble in water, therefore it will be washed out from the surface of the sample when using a water-based polishing method [33,45]. Earlier OIA studies of samples prepared using a standard method considered that only elongated porosity represented larnite, and a corresponding textural identification was used [33]. In this approach, the amount of larnite estimated by OIA was always significantly lower than measured by QXRD. Separate analysis of blocks with sinter prepared without removal of larnite (see Figure 8) demonstrated that the vast majority of the interstitial fine space between major phases in sinter is occupied by larnite.
As mentioned earlier, sample preparation is critical to preservation of larnite. The analysis described in this paper was carried out on samples where the larnite was removed during polishing, making the assumption that all micro-porosity with less than a specified area was ex-larnite (not within primary hematite). Reflectivity of larnite and glass is very similar so the advantage of this method is that glass can be segmented separately from larnite.
Figure 9 shows a typical sinter area with the main phases of interest, including secondary hematite (H), magnetite (M) and SFCA (SF), prepared by this method. Note the clear distinction between glass (gl) and spaces where larnite was present (L), as well as the contrast between the epoxy resin mount (E) and glass, improved by dye addition during mounting.
A polishing routine using SiC-based grinding and a water-based diamond suspension as the polishing medium will likely remove water soluble larnite thus generating increased (apparent) porosity in the sample. Figure 8 demonstrates a sinter sample initially prepared using a water-free polishing method where larnite was not removed. Subsequently, the left-hand side of the sample was etched for 30 s in water. After only 30 s of etching the difference is noticeable, demonstrating that when a water-based polishing method is used, very little visible larnite remains, giving the erroneous appearance of significant porosity. In many sinter studies, the interstitial spaces between and inside the SFCA phases, magnetite and glass, are characterized as porosity. It is clear that there is almost no porosity visible in the unetched part of the sample (except large macro-porosity) and almost all the area between the larger magnetite crystals and SFCA phases is filled by larnite (see Figure 8b).
To fully preserve larnite during polishing sinter samples, polishing above 9 µm should be performed by dry means, and from 9 µm down to 1 µm (some laboratories polish down to 0.25 µm) specific polishing lubricants, kerosene or 1-methoxy-2-propanol, can be used. To date, ethylene glycol produced the best results (see Figure 8). For 9 µm polishing it is recommended to use silicon carbide and for 3 µm, and 1 µm, finishing with Al2O3. Following polishing, the surfaces of the polished blocks are typically cleaned by alcohol before imaging. Utilization of alcohol cleaning agents can, however, remove some larnite. Isopropanol neither etches nor dissolves larnite and is preferred.
When using a water-free polishing method, textural identification of larnite in sinter is straightforward. Firstly, a map of all glass/larnite thresholded matter is created and after that, all fine interstitial material is identified as larnite. In this approach all fine glass will also be attributed to larnite. However, when larnite is removed during water-based polishing and map of all micro-porosity is created and processed analogously, the risk of such an approach is that some of the actual fine porosity will be identified as larnite. However, as can be seen from Figure 8, the area percentage of the fine porosity in comparison with the larnite area is very small and, therefore, can be neglected. If polishing was performed without larnite removal and the same larnite identification algorithm was applied, then some fine glass would be identified as larnite and some larnite associated with glass would not be identified as larnite. The error in the proportion of larnite in this case could be higher, but still the total amount of larnite and glass together will be correct. Such segmentation of fine porosity as larnite should be performed only for the melted part of the sinter and any porosity within primary hematite should be excluded as an area for the segmentation of larnite (see Figure 1b).

4.3.4. Aluminosilicates and Quartz

Aluminosilicates in OIA automated segmentation can be subdivided into two types, even though there is no distinct boundary between them. One (darker) is closer by reflectivity to glass (but more reddish) and in OIA reporting often combined with glass. Another type is lighter and significantly interferes in reflectivity with SFCA. This type is very difficult to reliably distinguish from SFCA, as it is usually very fine, associated with SFCA and, therefore, underestimated. This results in extra area being attributed to SFCA and an underestimation in the amount of amorphous matter which may also be reported as glass, if not reported together with dark aluminosilicates. Figure 10 shows a particle containing aluminosilicates and segmentation of aluminosilicate into lighter and darker types. It is evident that the lighter aluminosilicate is strongly associated with SFCA and there is no distinct boundary between them, so the demonstrated segmentation is based purely on experience.
It should also be noted that for better segmentation of some sinter phases multi-thresholding can be used, where instead of using only one set of thresholds in each of the three color channels, two or three such sets are applied (see Figure 4.15 in Donskoi et al. [8] and corresponding discussions for a detailed explanation of this procedure). Figure 11 demonstrates segmentation of dark aluminosilicate using three different thresholding levels. Figure 11a shows segmentation of the brighter part of the dark aluminosilicate. This region also includes an area of lighter aluminosilicate and some SFCA. The light aluminosilicate and SFCA were identified before, so extra segmentation is not a problem because the area of light aluminosilicate and SFCA will be removed from the segmentation at Figure 11a. Such over-segmentation provides insurance that there are no non-identified areas which have reflectivities intermediate between those of light aluminosilicate + SFCA and dark aluminosilicate. Figure 11b demonstrates identification of the intermediate reflectivity part of the dark aluminosilicate. In this identification, the darkest parts are still not segmented. Figure 11c shows segmentation of the least reflective part of the dark aluminosilicate. If the operator attempted to segment this dark aluminosilicate in one thresholding, significant amounts of the glass and epoxy present would be segmented as well.
Reliable quartz identification in epoxy was always a very difficult task because the reflectivities of quartz and epoxy are very similar [43]. Two of the most promising methods reported are the deep learning discrimination [46] and the, border relief-based discrimination method [43] used by the authors. Additional detailed information on identification of non-opaque minerals such as quartz can be found in [42,43,46].

5. Discussion

To demonstrate the application of the aforementioned improvements to the automated OIA characterization of crushed iron ore sinter samples, three sinter samples utilized in a recent sinter comparative characterization study by Honeyands et al. [18] were re-examined using the improved TI component of Mineral4. The three crushed sinter samples UN011, UN154 and UN016, were previously analyzed using a variety of characterization techniques with results reported in [18]. Vertical epoxy blocks were prepared for all samples to overcome the effect of particle density segregation during block preparation [32]. For the first sample, UN011, a standard non-vertical (horizontal) section polished block was also prepared. Both blocks prepared for the first sample were characterized by OIA.
Here we give extended and updated results from the characterization of these sinter samples together with new results on textural classification. Some differences in the OIA results between the data given here and by [18] are due to the improvements/changes in segmentation algorithms for different sinter phases and larger number of minerals identified.

5.1. Comparison of OIA Results with PC

Table 1 gives a comparison between manual point counting and OIA characterization results (in area%) for the three crushed sinter samples. Generally, the difference between manual point counting and OIA results was small and also within the differences in the data obtained by different sinter petrologists. It should be noticed here that OIA procedures can be adjusted according to the understanding/identification of different phases by a certain petrologist. While manual point counting results in this study are in good agreement this is not always the case and the difference between different petrologists can be quite significant [18,47]. In contrast, the OIA software can be used in the same way for different samples and will give more consistent results.
For the sample UN011, OIA data obtained from the non-vertical section for the major phases like hematite and SFCA were much closer to point counting results, due to the fact that point counting for this sample was also undertaken on a non-vertical section. The total amount of hematite obtained by OIA for all samples was always slightly less than that obtained by point counting. Conversely, the amount of larnite segmented by OIA was significantly larger than that obtained by PC. As has already been mentioned, larnite was mainly identified during point counting when elongated interstitial spaces were observed. However, as can be seen from Figure 8, larnite takes almost all interstitial spaces in magnetite/SFCA areas and many grains are not elongated, at least in the presented section area. Therefore, it can be hypothesized that point counting underestimates the amount of larnite in sinter which was confirmed by QXRD results (shown further in Table 2). This affected the calculated percentage of counts for all other minerals, including hematite, offering an explanation for the systematic difference in hematite identification by OIA and PC. Taking the effect of underestimated larnite into account it also can be demonstrated that the amount of SFCA in general is slightly overestimated by OIA. The reason for the overestimation could be due to the presence of some light aluminosilicates. For these samples light aluminosilicates were not significantly represented and due to the strong interference with SFCA (hard to separate properly) were identified together with SFCA as one phase by OIA. In future work it is recommended that chemical composition and attribution of slightly reddish (light) SFCA has to be studied in more detail.

5.2. Comparison of OIA Results with QXRD

Table 2 gives a comparison of QXRD and OIA results (in weight%) for the three samples. To transfer measurements from areal abundances in a block section (corresponding to the volume of that particular phase in a sample) to weight percentages, it is necessary to correct the data by using the densities for each of the phases (given in the column “Density used” in Table 2). A problem arises due to the fact that the chemical composition and density of each identified phase is variable and so here we only use average values which, we acknowledge, may be slightly different for different sinter compositions. The fact that there is not much in the way of systematic differences between the OIA and the QXRD characterization results (excluding data for SFCA and SFCA-I), and taking into account that the areal measurements were close to the PC measurements, it was concluded that, in general, the average density values used for each of the phases shown in Table 2 can be used as a good estimation tool.
Generally, the difference between the OIA calculated data and the QXRD data is larger than that observed when comparing the areal OIA data and the PC data. It should be noted here that different laboratories can give significantly different QXRD results for the same samples [48]. Taking into account the possible variability of the QXRD results, two extra QXRD analyses were performed for samples UN011 and UN016 (extra material for the UN154 sample was not available) and the averaged data are given in Table 2.
The abundance of total amorphous matter reported by QXRD was allocated to glass in Table 2 where it was compared with the amount of glass measured by OIA. The total amorphous, non-crystalline matter determined by QXRD for all sinters was significantly larger than the abundance of glass obtained from OIA, which was generally similar to the PC data. Hence, if the amount of glass was overestimated by QXRD, the presence of other minerals would be underestimated.
The amount of total SFCA (i.e., platy and prismatic SFCA combined) obtained by image analysis was systematically larger than that for the average QXRD results (Table 2). One possibility for this is the potential overestimation of amorphous matter by QXRD which would lead to an underestimation of all other phases. Another potential possibility was that some aluminosilicate was identified as SFCA by OIA. The fact that the amount of amorphous matter obtained by QXRD was systematically larger than the glass abundance obtained from OIA or from PC supports the first possibility. Some addition to the SFCA overestimation by OIA can also be explained by the possible presence in the sinter of other ferrite phases in minor-to-trace quantities which were not reported by QXRD but were recorded by OIA. A further possibility is overestimation of the SFCA density used for recalculation from the phase volume% data by OIA. However, we were reluctant to reduce the density used for SFCA due to the fact that a large part of optically identified SFCA had a higher iron content than stoichiometric SFCA and thus should have had an even higher density.
For sample UN016 (and for UN011) QXRD showed significantly larger amounts of SFCA-I than the amount of platy SFCA measured by OIA. This appears to be a consistent trend for sinters with a large proportion of SFCA-I. This casts further doubt on the assumption that the phase identified as SFCA-I by QXRD is the same micro-platy phase which petrologists identify as platy SFCA.

5.3. Comparison of OIA Results with Bulk Chemistry Determined by XRF

One of the most reliable, cheap, and consistent methods of sinter characterization is chemical assay obtained by XRF spectroscopy. To match data obtained by XRF, the OIA software has to be able to calculate the sinter sample chemical composition. The Mineral4/Recognition4 software allows the input of an average chemical composition for each phase from a suitable reference source or from quantitative measurements taken from electron probe microanalysis. It then enables calculation of a sample chemical composition based on measurements of mineral abundances and average density of each mineral (to provide data in weight%). For the sinters discussed here, measurements to determine the average chemical composition for each mineral were not performed, and instead default compositions were used for each of the phases. Even though the default mineral chemical compositions were taken from average measurements obtained from a different sinter, in general the OIA results reflect all trends exhibited by the XRF results (see Table 3). The estimations for UN016 sinter are closer to the XRF results, which means that average mineral compositions in that sinter are most probably close to the default compositions. Such a comparison of XRF and OIA results indicates that using OIA can provide calculated assay results which are close to actual XRF values.

5.4. Sinter Microtextures and Mineral Associations

The OIA software provides an opportunity to examine in detail sinter microtextural features as well as mineral associations. Here we provide an example of a sinter textural classification scheme, consisting of 58 different classes, used to characterize all three sinter samples. Note that we have included only textures present in the sinters in major abundances (Table 4). For textures named after just one phase it means that the abundance of this phase in the crushed sinter particle is more than 70–75%. If several names of phases are present in the texture title, the first of them means that the presence of the corresponding phase is more than 50%, and the next term denotes the phase second in abundance. If the second term is “Mix”, it means that there was no predominant secondary phase. Similarly, if “Mix” is the third term. Phases combined in one word mean they are considered together in these textures. If phase names are separated by a dash, they are considered together, but the first phase has larger abundance. The term SFCA2 means that both prismatic and platy SFCA (further and in tables, just called SFCA and SFCApl, correspondingly) are combined as one phase.
Recognition4 automatically assigns each particle to a certain textural class [35]. As sinter strength and reduction properties were not available for these sinters no attempt could be made to correlate them with the textural information. However, correlations with sinter basicity and phase composition were established. As expected, there was good correlation between the amount of the “Primary Hematite Porous Mix” texture and the measured amount of primary hematite. However, it should be noted that the significant presence of this texture reflected the high liberation of primary hematite during crushing. The same trend is evident for the “Sec-Prime Hematite Mix” texture.
Textures connected with SFCA (prismatic) such as “SFCA Hematite”, “SFCA HematiteMagnetite”, “SFCA Mix” and “SFCA2-Hematite Mix” strongly correlate with SFCA abundance and sinter basicity. The higher basicity UN154 plant sinter has a considerably lower “Primary Hematite Porous Mix” level than the lower basicity UN011 sinter, as well as less “Sec-Prime Hematite Mix” (i.e., partially reacted hematite), due to a lower level of primary hematite (Table 1). In the UN154 sinter, this is offset by a higher “SFCA Magnetite” level, due to a higher degree of primary hematite reaction resulting in increased bonding phase formation. The “Magnetite-SFCA2 Mix” texture has more than 8% abundance for the first two plant sinter samples and less than 2% for the third pilot-scale sinter, with a similar result for “Magnetite SFCA2”. The much lower level of these associations in UN016 is offset by the much higher level of “SFCA2-Hematite Mix” (18%, compared with less than 7% for UN011 and UN154). In other words, the main matrix association in the UN016 sinter is hematite-SFCA, rather than magnetite-SFCA in UN011 and UN154. This is consistent with higher overall temperature and/or lower oxygen potential under plant sintering conditions, compared with the pot grate sinter. The high “SFCA2-Hematite Mix” content of UN016, compared with UN011, shows a greater association of hematite with the sinter matrix in this case (i.e., greater reaction and assimilation of hematite nuclei).
The relative ratio between the number of particles and their abundance may indicate the relative strength of the different textures. For example, for the texture “Sec-Prime Hematite Mix” in sinter UN011, there were 345 particles that incorporated an area which represented 12.62% of the sample. However, for the texture “Magnetite SFCA2” the 904 particles only represented 6.4% of the sample area, which suggests that this texture was much weaker, or clusters of this texture were much smaller in size than “Sec-Prime Hematite Mix”.
The influence of the textural composition of iron ores on sinter quality is well established [5,49]. The influence of sinter texture on sinter quality has also been extensively studied by industry, but there are only few publications about this present in the open literature [50]. These examples show the potential for textural characterization to reflect sinter properties and provide in depth understanding of the formation of sinter under different conditions, when used in conjunction with sinter modal mineralogy results.
Other textural associations are qualitatively known, although their relationships to sinter metallurgical indices are complex. With the availability of the improved analysis technique presented above, these can now be explored further. For example, physical breakdown of sinter during low temperature reduction is associated with secondary hematite content [51,52]. Secondary hematite associated with glass and larnite is of particular interest, as well as secondary hematite associated with background (porosity), secondary hematite-SFCA, and the relative proportions of these mineralogical association ‘types’ in the sinter. In the absence of a major proportion of platy SFCA in the sinter, magnetite-SFCA is most likely to be the main matrix texture contributing to sinter strength (Tumble Index), other than in high temperature magnetite sintering, where magnetite-magnetite grain bonding provides mechanical strength [53]. Higher levels of magnetite-glass association are likely to be detrimental to unreduced sinter strength, where magnetite grains are largely discrete and not joined by intergranular diffusion bonding. In addition, the level of porosity (both pore size and distribution) associated with primary hematite (i.e., types of stable nuclei and their relationship to original ore texture) is relevant to sinter reducibility and productivity.

6. Conclusions

This study demonstrates that automated optical image analysis is a reliable tool for sinter characterization and textural analysis. However, to obtain non-biased results, vertically sectioned epoxy resin blocks must be prepared. Furthermore, to avoid the removal of larnite or other soluble materials, water-free solvents should be used for all polishing and cleaning before imaging. Such removal, however, can be beneficial in OIA if larnite and glass need to be segmented from one another.
Specific textural identification procedures developed within the OIA software package Mineral4/Recognition4 were demonstrated. These allow for different morphologies of the same sinter phase to be segmented, such as primary hematite from secondary hematite and platy SFCA from prismatic SFCA. The software also allowed for reliable segmentation of other sinter phases such as magnetite, glass, larnite and aluminosilicate. Multiple thresholding was recommended as a way to better segment sinter phases, sometimes involving over-segmentation and subsequent removal of areas corresponding to phases previously identified.
Three sinter samples were analyzed by OIA and the results compared with PC, XRD and XRF results. There was good correspondence between the different datasets, and a detailed comparison of the automatically generated mineral maps with the optical images demonstrated that OIA can perform high-quality mineral segmentation. For one sample, both vertically and horizontally sectioned blocks were prepared. OIA results obtained from a horizontal section were closer to the PC results (performed on a horizontal section) than those OIA results obtained from a vertical section. As expected, OIA results from the vertical section were closer to the QXRD results, due to the absence of any particle segregation error.
In general, PC underestimated the amount of larnite due to the fact that mainly elongated pores were considered by PC as areas where larnite was removed during water-based polishing. This may lead to a slight overestimation of the abundance of the other sinter phases. With regard to larnite OIA segmentation, the assumption that after water-based polishing all micro-porosity, excluding micro-porosity within primary hematite, can be segmented as larnite gave a good agreement with QXRD data.
OIA tends to overestimate the amount of SFCA, which is probably a consequence of the presence of lighter aluminosilicate. This phase has a reflectivity which strongly interferes with the reflectivity of SFCA. Otherwise, the SFCA density, used for the transformation of areal measurements to weight percentages, may have been overestimated. QXRD results suggested that SFCA-I may not be only represented by micro-platy SFCA morphological types.
This study provided the approximate densities of sinter phases that can be used for the transformation of areal mineral abundance (corresponding to volume abundance) to weight percentage. However, it should be noted that different sinters may have different average phase compositions, in which case these densities may need to be modified.
QXRD results may give different results from the actual mineral abundances in a sinter, so these need to be supplemented by other measurements such as XRF, PC, OIA or QXRD from several different laboratories. The proper classification of amorphous material from QXRD is an area of further study.
Bulk sinter chemistry can be calculated from the OIA results. For this, the average composition for each phase in the sinter has to be obtained from an independent source such as electron probe microanalysis. For this study we used default chemical compositions (the same for each sinter) previously obtained from different sinter samples. The results were close to the XRF results and reflected all the major trends.
Textural sinter classification performed by Recognition4 demonstrated the potential for textural characterization of sinter to provide a better understanding of the importance of sinter micro-texture to macro-scale sinter properties and their formation under different sintering conditions.

Author Contributions

Conceptualization, E.D., S.H., J.R.M. and M.I.P.; Data curation, E.D., S.H., H.M. and B.B.; Formal analysis, E.D.; Investigation, E.D., S.H., J.R.M., A.P., M.J.P., H.M., B.B., T.H. and M.I.P.; Methodology, E.D.; Project administration, E.D.; Resources, E.D.; Software, E.D. and A.P.; Supervision, E.D.; Validation, E.D.; Visualization, E.D., J.R.M., H.M. and B.B.; Writing—original draft, E.D., J.R.M. and M.I.P.; Writing—review & editing, E.D., S.H., J.R.M., M.J.P., A.P. and M.I.P. All authors have read and agreed to the published version of the manuscript.

Funding

This research was funded by the Commonwealth Scientific Industrial Research Organization (CSIRO).

Acknowledgments

The authors wish to thank CSIRO Carbon Steel Materials group staff for valuable suggestions and help during this work. We also would like to express our acknowledgment to the internal and external reviewers for useful corrections and comments.

Conflicts of Interest

The authors declare no conflict of interest.

References

  1. Pownceby, M.I.; Clout, J.M.F. Importance of fine ore chemical composition and high temperature phase relations: Applications to iron ore sintering and pelletising. Miner. Process. Extr. Metall. 2003, 112, 44–51. [Google Scholar] [CrossRef]
  2. Harvey, T. Influence of Mineralogy and Pore Structure on the Reducibility and Strength of Iron Ore Sinter. Ph.D. Thesis, University of Newcastle, Callaghan, Australia, 2020; 400p. [Google Scholar]
  3. Wang, W.; Deng, M.; Xu, R.-S.; Xu, W.-B.; Ouyang, Z.-L.; Huang, X.-B.; Xue, Z.-L. Three-dimensional structure and micro-mechanical properties of iron ore sinter. J. Iron Steel Res. Int. 2017, 24, 1007–1015. [Google Scholar] [CrossRef]
  4. Wang, W.; Chen, X.-H.; Xu, R.-S.; Li, J.; Shen, W.-J.; Wang, S.-P. Research progress on multiscale structural characteristics and characterization methods of iron ore sinter. J. Iron Steel Res. Int. 2020, 27, 367–379. [Google Scholar] [CrossRef]
  5. Donskoi, E.; Manuel, J.R.; Lu, L.; Holmes, R.J.; Poliakov, A.; Raynlyn, T.D. Importance of textural information in mathematical modelling of iron ore fines sintering performance. Miner. Process. Extr. Metall. 2017, 127, 103–114. [Google Scholar] [CrossRef]
  6. Sinha, M.; Nistala, S.H.; Chandra, S.; Mankhand, T.R.; Ghose, A.K. Correlating mechanical properties of sinter phases with their chemistry and its effect on sinter quality. Ironmak. Steelmak. 2017, 44, 100–107. [Google Scholar] [CrossRef]
  7. Pirard, E.; Lebichot, S.; Krier, W. Particle texture analysis using polarized light imaging and grey level intercepts. Int. J. Miner. Process. 2007, 84, 299–309. [Google Scholar] [CrossRef]
  8. Donskoi, E.; Poliakov, A.; Manuel, J.R. Automated Optical Image Analysis of Natural and Sintered Iron Ore. In Iron Ore: Mineralogy, Processing and Environmental Sustainability; Lu, L., Ed.; Elsevier Inc.: Cambridge, UK, 2015; pp. 101–159. [Google Scholar]
  9. Donskoi, E.; Poliakov, A.; Manuel, J.R.; Peterson, M.; Hapugoda, S. Industrial Strength Optical Image Analysis System—Mineral4/Recognition4. In Proceedings of the Iron Ore 2013, Perth, Australia, 12–14 August 2013; pp. 227–241. [Google Scholar]
  10. Gomes, O.D.M.; Paciornik, S. Iron ore quantitative characterization through reflected light-scanning electron co-site microscopy. In Proceedings of the Ninth International Congress on Applied Mineralogy, Brisbane, Australia, 8–10 September 2008; pp. 699–702. [Google Scholar]
  11. Gomes, O.D.M.; Paciornik, S. RLM-SEM co-site microscopy applied to iron ore characterization. In Proceedings of the Annals of 2nd International Symposium on Iron Ore, São Luís, Brazil, 22–26 September 2008; pp. 218–224. [Google Scholar]
  12. Iglesias, J.C.A.; Augusto, K.S.; Da Fonseca Martins Gomes, O.; Domingues, A.L.A.; Vieira, M.B.; Casagrande, C.; Paciornik, S. Automatic characterization of iron ore by digital microscopy and image analysis. J. Mater. Res. Technol. 2018, 7, 376–380. [Google Scholar] [CrossRef]
  13. Bückner, B.; Mali, H. Extended Analyses of Iron Ore Sinter by Image Processing. Steel Res. Int. 2020, 91, 02000236. [Google Scholar] [CrossRef]
  14. Gottlieb, P.; Wilkie, G.; Sutherland, D.; Ho-Tun, E.; Suthers, S.; Perera, K.; Jenkins, B.; Spencer, S.; Butcher, A.; Rayner, J. Using quantitative electron microscopy for process mineralogy applications. JOM 2000, 52, 24–25. [Google Scholar] [CrossRef]
  15. Maddren, J.; Ly, C.V.; Suthers, S.P.; Butcher, A.R.; Trudu, A.G.; Botha, P.W.S.K. A new approach to ore characterisation using automated quantitative mineral analysis. In Proceedings of the AusIMM, Iron Ore 2007, Perth, Australia, 20–22 August 2007; pp. 131–132. [Google Scholar]
  16. Hrstka, T.; Gottlieb, P.; Skala, R.; Breiter, K.; Motl, D. Automated mineralogy and petrology—Applications of TESCAN Integrated Mineral Analyzer (TIMA). J. Geosci. 2018, 63, 47–63. [Google Scholar] [CrossRef] [Green Version]
  17. König, U.; Gobbo, L.; Macchiarola, K. Using X-ray diffraction for grade control and minimising environmental impact in iron and steel industries. In Proceedings of the AusIMM, Iron Ore 2011, Perth, Australia, 11–13 July 2011; pp. 49–56. [Google Scholar]
  18. Honeyands, T.; Manuel, J.; Matthews, L.; O’Dea, D.; Pinson, D.; Leedham, J.; Zhang, G.; Li, H.; Monaghan, B.; Liu, X.; et al. Comparison of the mineralogy of iron ore sinters using a range of techniques. Minerals 2019, 9, 333. [Google Scholar] [CrossRef] [Green Version]
  19. Otsu, N. Threshold selection method from gray-level histograms. IEEE Trans. Syst. Man Cybern. 1979, 9, 62. [Google Scholar] [CrossRef] [Green Version]
  20. Donskoi, E.; Poliakov, A. Advances in Optical Image Analysis Textural Segmentation in Ironmaking. Appl. Sci. 2020, 10, 6242. [Google Scholar] [CrossRef]
  21. Rietveld, H. A profile refinement method for nuclear and magnetic structures. J. Appl. Crystallogr. 1969, 2, 65–71. [Google Scholar] [CrossRef]
  22. Scarlett, N.V.Y.; Madsen, I.C. Quantification of phases with partial or no known crystal structures. Powder Diffr. 2006, 21, 278–284. [Google Scholar] [CrossRef]
  23. Figueroa, G.; Möller, K.; Buhot, M.; Gloy, G.; Haberlah, D. Advanced Discrimination of Hematite and Magnetite by Automated Mineralogy. In Proceedings of the 10th International Congress for Applied Mineralogy (ICAM), Trondheim, Norway, 1–5 August 2011; pp. 197–204. [Google Scholar]
  24. Keulen, N.; Malkki, S.N.; Graham, S. Automated quantitative mineralogy applied to metamorphic rocks. Minerals 2020, 10, 47. [Google Scholar] [CrossRef] [Green Version]
  25. Tonžetić, I.Ž. Quantitative analysis of iron ore using SEM-based technologies. In Iron Ore: Mineralogy, Processing and Environmental Sustainability; Lu, L., Ed.; Elsevier Inc.: Cambridge, UK, 2015; pp. 161–189. [Google Scholar]
  26. Nicol, S.; Chen, J.; Pownceby, M.; Webster, N. A review of the chemistry, structure and formation conditions of silico-ferrite of calcium and aluminium (‘SFCA’) phases. ISIJ Int. 2018, 58, 2157–2172. [Google Scholar] [CrossRef] [Green Version]
  27. Donskoi, E.; Manuel, J.R.; Austin, P.; Poliakov, A.; Peterson, M.; Hapugoda, S. Comparative study of iron ore characterization using a scanning electron microscope and optical image analysis. Trans. Inst. Min. Metall. 2014, 122, 217–229. [Google Scholar]
  28. Sasaki, M.; Hida, Y. Considerations on the properties of sinter from the point of sintering reaction. Trans. Iron Steel Inst. Jpn. 1982, 68, 563–571. [Google Scholar] [CrossRef] [Green Version]
  29. Scarlett, N.V.Y.; Pownceby, M.I.; Madsen, I.C.; Christensen, A.N. Reaction sequences in the formation of SFCA and SFCA-I in iron ore sinter. Metall. Mater. Trans. B 2004, 35B, 929–936. [Google Scholar] [CrossRef]
  30. Webster, N.A.S.; Pownceby, M.I.; Madsen, I.C.; Kimpton, J.A. Silico-ferrite of Calcium and Aluminium (SFCA) Iron Ore Sinter Bonding Phases: New Insights into Their Formation During Heating and Cooling. Metall. Mater. Trans. B 2012, 43, 1344–1357. [Google Scholar] [CrossRef]
  31. Lu, L.; Holmes, R.J.; Manuel, J.R. Effects of Alumina on Sintering Performance of Hematite Iron Ores. ISIJ Int. 2007, 47, 349–358. [Google Scholar] [CrossRef] [Green Version]
  32. Donskoi, E.; Raynlyn, T.D.; Poliakov, A. Image analysis estimation of iron ore particle segregation in epoxy blocks. Miner. Eng. 2018, 120, 102–109. [Google Scholar] [CrossRef]
  33. Donskoi, E.; Hapugoda, S.; Lu, L.; Poliakov, A.; Peterson, M.; Haileslassie, A. Advances in Optical Image Analysis of Iron Ore Sinter. In Proceedings of the AusIMM, Iron Ore 2015, Perth, Australia, 13–15 July 2015; pp. 543–548. [Google Scholar]
  34. Donskoi, E.; Poliakov, A.; Manuel, J.R.; Peterson, M.; Hapugoda, S. Novel developments in optical image analysis for iron ore, sinter and coke characterisation. Trans. Inst. Min. Metall. 2015, 124, 227–244. [Google Scholar] [CrossRef]
  35. Donskoi, E.; Suthers, S.P.; Fradd, S.B.; Young, J.M.; Campbell, J.J.; Raynlyn, T.D.; Clout, J.M.F. Utilization of optical image analysis and automatic texture classification for iron ore particle characterisation. Miner. Eng. 2007, 20, 461–471. [Google Scholar] [CrossRef]
  36. McAndrew, J.; Clout, J.M.F. The nature of SFCA and its importance as a bonding phase in iron ore sinter. In Proceedings of the 4th China-Australia Symposium on the Technology of Feed Preparation for Ironmaking, Dampier, Australia, June 1993; pp. 1–15. [Google Scholar]
  37. Mumme, W.G.; Clout, J.M.F.; Gable, R.W. The crystal structure of SFCA-I, Ca3.18Fe3+14.30Fe2+0.55O25, a homologue of the aenigmatite structure type, and new crystal structure refinements of β-CFF, Ca2.99Fe3+14.30Fe2+0.55O25 and Mg-free SFCA, Ca2.45Fe3+9.04Fe2+0.16O20. Neues Jahrb. Für Mineral. Abh. 1998, 173, 93. [Google Scholar] [CrossRef]
  38. Ahsan, S.N.; Mukherjee, T.; Whiteman, J.A.; Whiteman, J.A. Structure of fluxed sinter. Ironmak. Steelmak. 1983, 10, 54–64. [Google Scholar]
  39. Mežibrický, R.; Fröhlichová, M. Silico-ferrite of Calcium and Aluminium Characterization by Crystal Morphology in Iron Ore Sinter Microstructure. ISIJ Int. 2016, 56, 1111–1113. [Google Scholar] [CrossRef] [Green Version]
  40. Pownceby, M.I.; Patrick, T.R.C. Stability of SFC (silico-ferrite of calcium): Solid solution limits, thermal stability and selected phase relationships within the Fe2O3-CaO-SiO2 (FCS) system. Eur. J. Mineral. 2000, 12, 455–468. [Google Scholar] [CrossRef]
  41. Donskoi, E.; Poliakov, A.; Manuel, J.R.; Raynlyn, T.D. Advances in optical image analysis and textural classification of iron ore fines. In Proceedings of the XXV International Mineral Processing Congress—IMPC2010, Brisbane, Australia, 6–10 September 2010; pp. 2823–2836. [Google Scholar]
  42. Donskoi, E.; Manuel, J.R.; Hapugoda, S.; Poliakov, A.; Raynlyn, T.; Austin, P.; Peterson, M. Automated optical image analysis of goethitic iron ores. Trans. Inst. Min. Metall. 2020. [Google Scholar] [CrossRef]
  43. Poliakov, A.; Donskoi, E. Automated relief-based discrimination of non-opaque minerals in optical image analysis. Miner. Eng. 2014, 55, 111–124. [Google Scholar] [CrossRef]
  44. Chan, C.J.; Kriven, W.M.; Young, J.F. Physical stabilization of the β → γ transformation in dicalcium silicate. J. Am. Ceram. Soc. 1992, 75, 1621–1627. [Google Scholar] [CrossRef]
  45. Patrick, T.R.C.; Lovel, R.R. Leaching dicalcium silicates from iron ore sinter to remove phosphorus and other contaminants. ISIJ Int. 2001, 41, 128–135. [Google Scholar] [CrossRef]
  46. Iglesias, J.C.Á.; Santos, R.B.M.; Paciornik, S. Deep learning discrimination of quartz and resin in optical microscopy images of minerals. Miner. Eng. 2019, 138, 79–85. [Google Scholar] [CrossRef]
  47. Honeyands, T.; Manuel, J.; Matthews, L.; O’Dea, D.; Pinson, D.; Leedham, J.; Monaghan, B.; Li, H.; Chen, J.; Hayes, P.; et al. Characterising the mineralogy of iron ore sinters—State-of-the-art in Australia. In Proceedings of the Iron Ore 2017, Perth, Australia, 24–26 July 2017; pp. 49–60. [Google Scholar]
  48. Raven, M.D.; Birch, S.L. Summary of results of an International X-ray Diffraction Round Robin for Mineralogical Analysis of Iron Ores. In Proceedings of the Iron Ore 2017, Perth, Australia, 24–26 July 2017; pp. 599–604. [Google Scholar]
  49. Donskoi, E.; Manuel, J.R.; Clout, J.M.F.; Zhang, Y. Mathematical modelling and optimization of iron ore sinter properties. Isr. J. Chem. 2007, 47, 373–379. [Google Scholar] [CrossRef]
  50. Greco, A.; Jeulin, D.; Serra, J. The Use Of The Texture Analyser To Study Sinter Structure: Application To The Morphology Of Calcium Ferrites Encountered In Basic Sinters Of Rich Iron Ores. J. Microsc. 1979, 116, 199. [Google Scholar] [CrossRef]
  51. Murakami, T.; Kodaira, T.; Kasai, E. Reduction and disintegration behaviour of sinter under N2–CO–CO2–H2–H2O gas at 773 K. ISIJ Int. 2015, 55, 1181–1187. [Google Scholar] [CrossRef] [Green Version]
  52. Shigaki, I.; Sawada, M.; Gennai, N. Increase in low-temperature reduction due to hematite-alumina solid solution and degradation of iron ore sinter and columnar calcium ferrite. Trans. ISIJ 1986, 26, 503–511. [Google Scholar] [CrossRef]
  53. Clout, J.M.F.; Manuel, J.R. Fundamental investigations of differences in bonding mechanisms in iron ore sinter formed from magnetite concentrates and hematite ores. Powder Technol. 2003, 130, 393–399. [Google Scholar] [CrossRef]
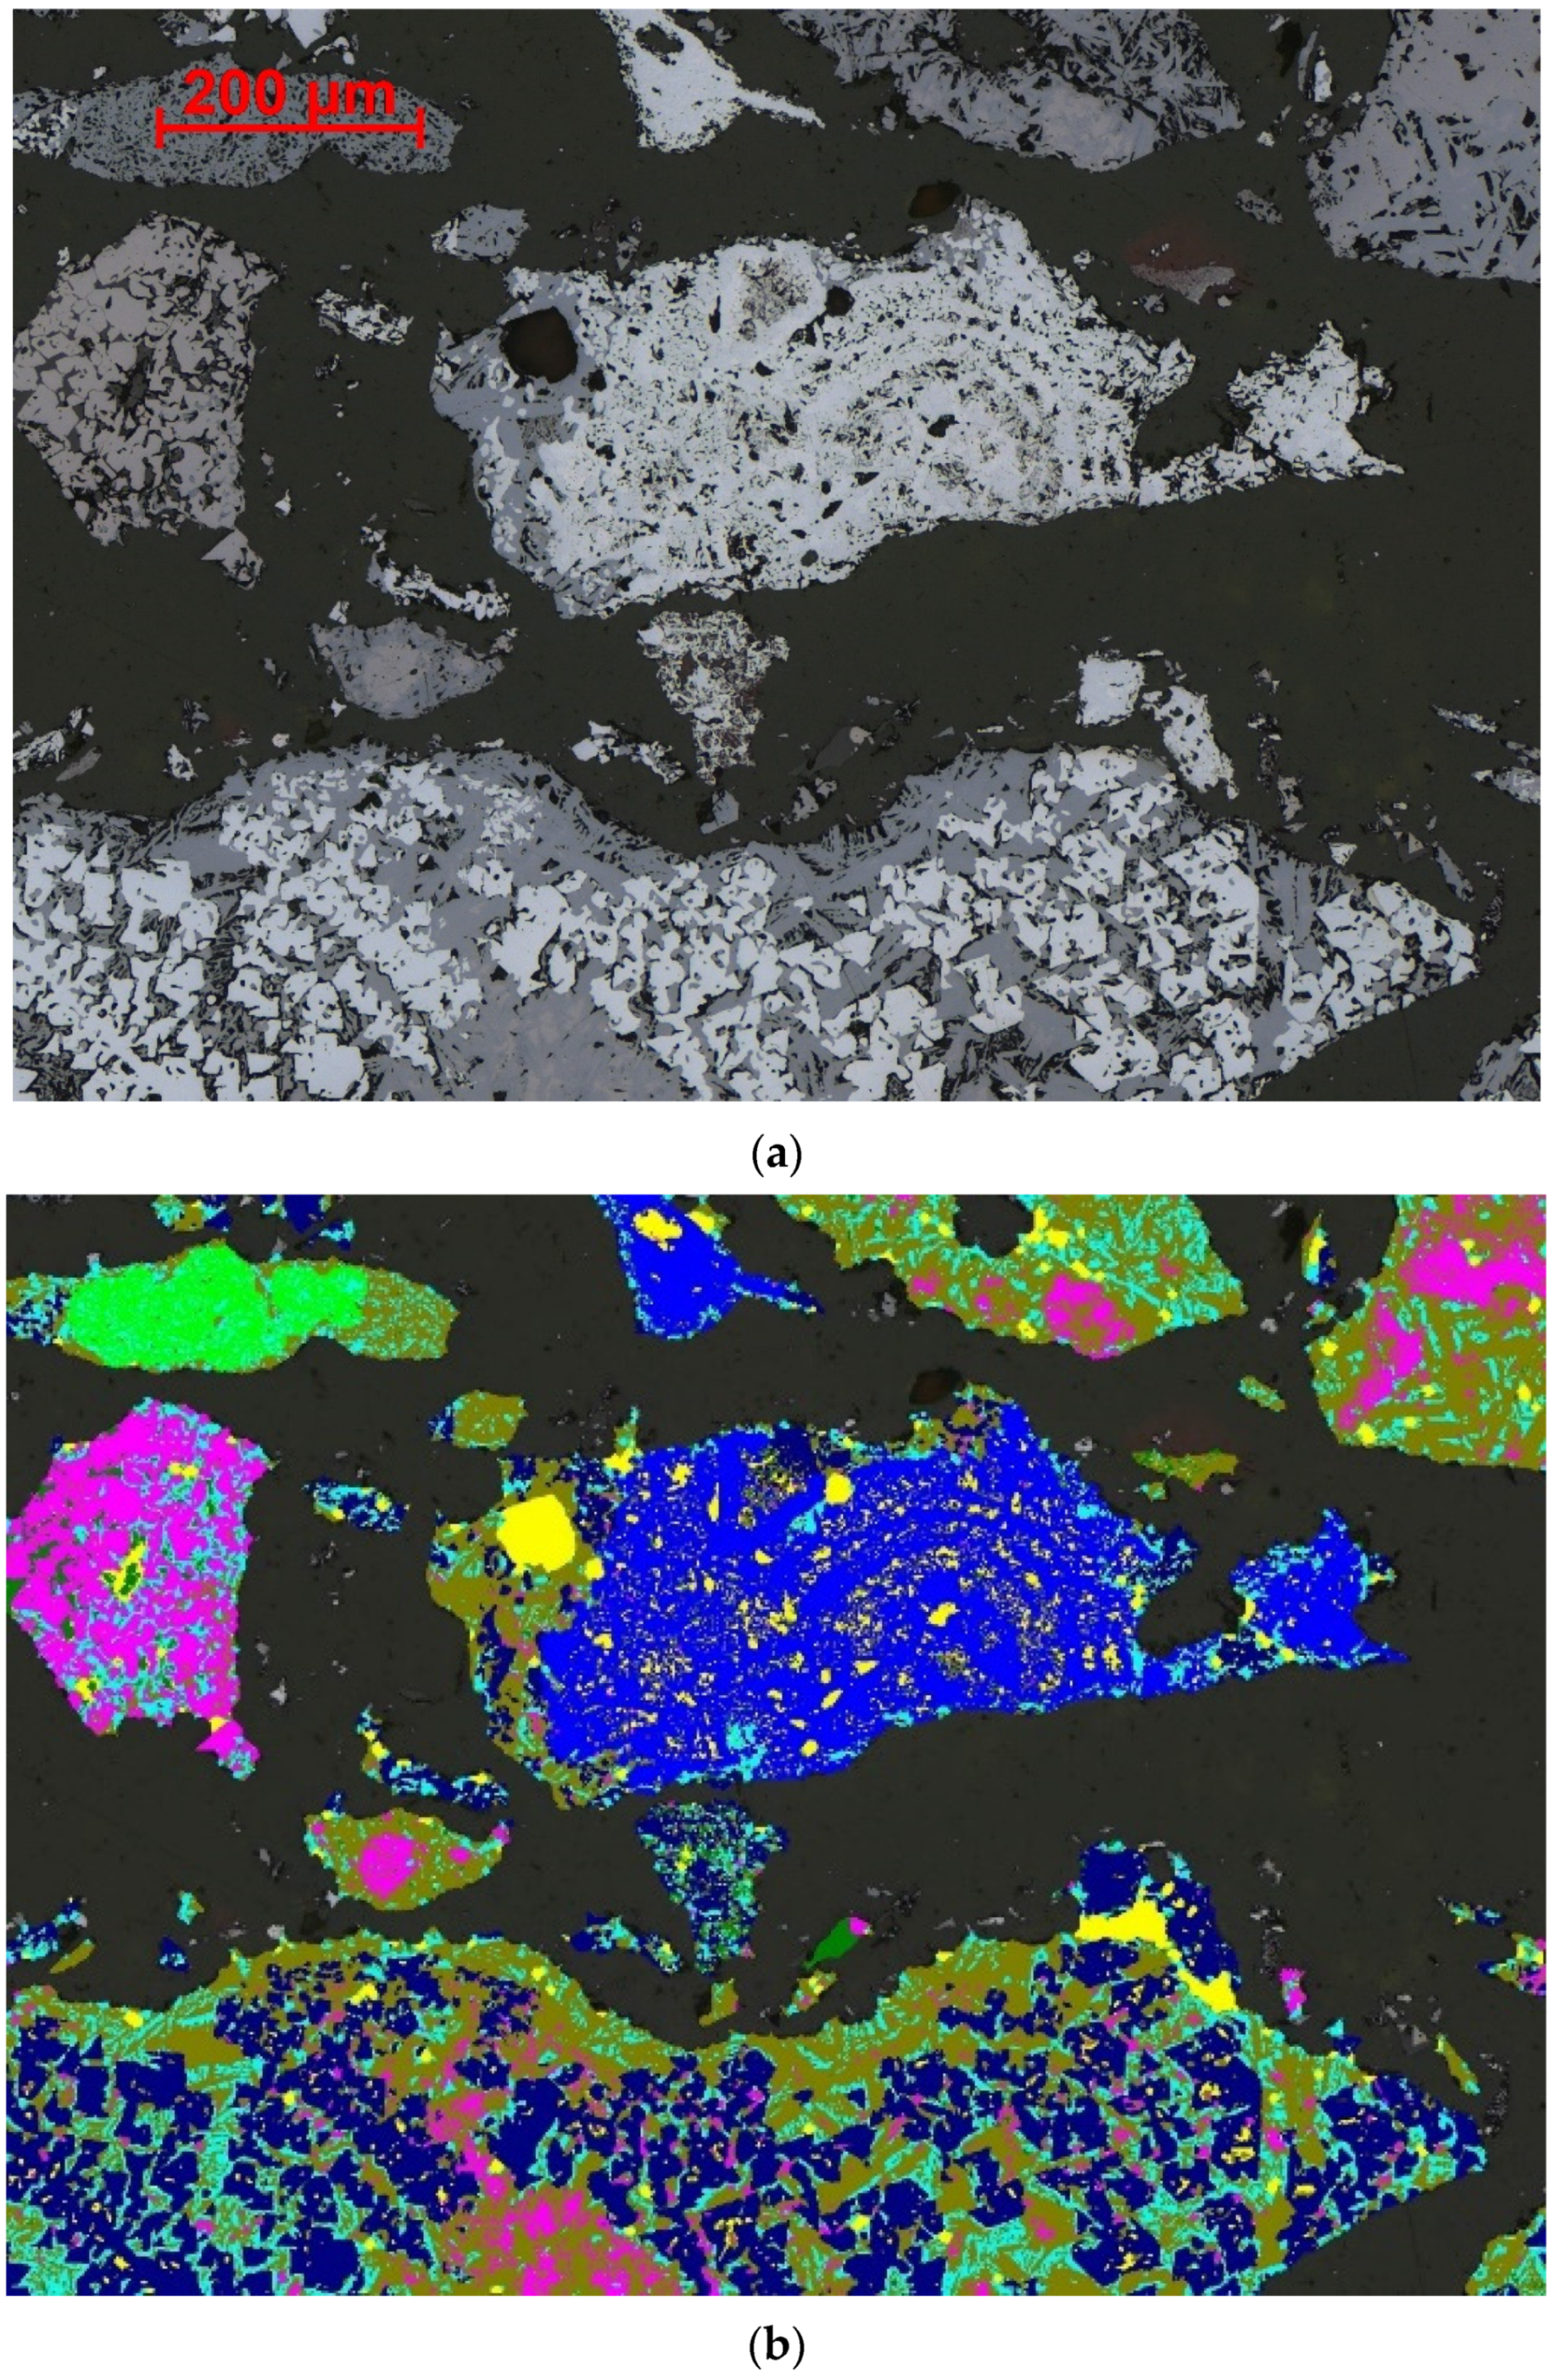
Figure 1. (a) Reflected light photomicrograph of crushed sinter, magnification 200× and, (b) Mineral map of the image in (a) obtained by Mineral4 software after automated image analysis. Key to colors used: primary hematite—light blue; secondary hematite—dark blue; magnetite—magenta; platy SFCA—light green; prismatic/dense SFCA—olive; glass—dark green; larnite—cyan; porosity and epoxy within particles—yellow.
Minerals 11 00562 g001
Figure 2. Textural segmentation of primary hematite in Figure 1a: (a) map of hematite only in the image, (b) map of SFCA (including platy SFCA), glass and all other phases darker than SFCA (c) map of areas associated with glass and SFCA, (d) areas where primary hematite should not be present are removed from the whole hematite map, (e) map of possible areas for primary hematite and (f) areas of primary hematite and some small hematite areas to be removed later based on size criteria.
Minerals 11 00562 g002
Figure 3. (a) Optical photomicrograph of crushed sinter showing particles comprised of either dominantly platy (fibrous) SFCA or prismatic (columnar) SFCA, and (b) Mineral map for the image in (a) obtained after automated image analysis. Key to colors used: primary hematite—light blue; secondary hematite—dark blue; magnetite—magenta; platy SFCA—light green; prismatic/dense SFCA—olive; glass—dark green; larnite—cyan; porosity and epoxy within particles—yellow.
Minerals 11 00562 g003
Figure 4. Textural segmentation of platy/fibrous SFCA in Figure 3: (a) Map of all identified SFCA microtypes in the image (b) map showing the distribution of magnetite, porosity, glass, larnite and epoxy (c) map (b) without larnite (microporosity) (d) map of larnite, (e) clusters identified from the presence of fine larnite, and (f) map of the distribution of platy SFCA before scrapping areas smaller than a certain size.
Minerals 11 00562 g004
Figure 5. Segmentation process for identification of dense SFCA: (a) optical photomicrograph of crushed sinter demonstrating dense SFCA, (b) thresholding of SFCA areas, (c) thresholded map dilated by one pixel, (d) strong erosion of the previous map, (e) strong dilation of the eroded map and (f) olive—finally segmented areas of dense SFCA.
Minerals 11 00562 g005
Figure 6. (a) Image of sinter particles containing magnetite; magnetite is distinctly different from SFCA in the right-hand side particle however the distinction between magnetite and SFCA is very obscure in the left-hand side particle, and (b) Mineral map obtained from automated image analysis. Colors used: primary hematite—light blue; secondary hematite—dark blue; magnetite—magenta; platy SFCA—light green; prismatic/dense SFCA—olive; glass—dark green; larnite—cyan; porosity and epoxy within particles—yellow.
Minerals 11 00562 g006
Figure 7. (a) Optical photomicrograph of crushed sinter demonstrating the presence of glass and pores. Key to colors: pores partially occupied by epoxy—white ellipses; pore partially occupied by glass—red ellipse; boundary between glass and epoxy—blue ellipse. (b) Mineral map obtained from automated image analysis. Key to colors used: primary hematite—light blue; secondary hematite—dark blue; magnetite—magenta; platy SFCA—light green; prismatic/dense SFCA—olive; glass—dark green; larnite—cyan; porosity and epoxy within particles—yellow.
Minerals 11 00562 g007
Figure 8. (a) Reflected light photomicrograph of a polished block containing iron ore sinter showing the effects of polishing. A higher magnification view of the left-hand side of the image (b) which has been etched with water for 30 s, while the right-hand side shows the sample after polishing under water-free conditions (c). Key to phases present: slightly pink—magnetite; light grey—SFCA; dark grey (interstitial)—larnite; darkest grey—pores.
Minerals 11 00562 g008
Figure 9. Higher magnification reflected light photomicrograph of sinter prepared using the standard method (larnite removed). H—hematite; M—magnetite; SF—prismatic SFCA; gl—glass; L—area of former larnite presence; E—epoxy resin; P—pore (pore at right is resin-filled).
Minerals 11 00562 g009
Figure 10. (a) Optical photomicrograph, and (b) corresponding mineral map of crushed sinter demonstrating the segmentation of aluminosilicates. Key to colors used: olive—darker aluminosilicate, blue—lighter aluminosilicate.
Minerals 11 00562 g010
Figure 11. Thresholding of dark aluminosilicate in Figure 10: (a) lighter area of dark aluminosilicate partially including light aluminosilicate, (b) medium reflectivity part, and (c) darkest part.
Minerals 11 00562 g011
Table 1. Comparison of manual point counting (PC) and OIA characterization results for the three crushed sinter samples (all data in area%).
PhaseUN011UN 154UN016
PC1PC2OIA NVSOIA VSPC1PC2OIAPC1PC2OIA
Magnetite28.026.325.425.528.127.127.915.111.913.1
Primary Hematite14.822.617.619.46.75.56.412.017.213.6
Secondary Hematite24.919.819.715.517.619.316.519.215.416.7
Total Hematite39.742.437.334.924.324.822.931.232.630.3
Platy SFCA0.80.90.80.72.81.21.04.06.06.6
SFCA17.318.520.023.029.933.432.838.336.636.2
Total SFCA18.119.420.923.732.734.633.842.342.642.8
Glass6.57.26.97.96.37.57.02.75.34.7
Larnite6.73.79.27.26.85.47.54.93.88.5
Quartz0.00.90.30.70.00.10.50.00.70.6
Dark Aluminosilicate------0.10.1------0.4------0.1
Other1.00.2------1.80.6---3.73.1---
Abbreviation given in the table: PC1, PC2—data obtained by manual point counting by two different operators; OIA—optical image analysis performed using CSIRO software Mineral4/Recognition4; vs.—vertical section sample; NVS—non-vertical (standard preparation) section sample.
Table 2. Comparison of the average QXRD results with data calculated from the OIA characterization results for the three crushed sinter samples (all data in weight%).
PhaseDensity UsedUN011UN154UN016
QXRDOIA NVSOIA VSQXRDOIAQXRDOIA
Magnetite4.929.228.829.227.532.715.115.6
Primary Hematite5.0---20.422.7---7.7---16.6
Secondary Hematite4.8---22.017.4---19.0---19.5
Total Hematite 37.742.440.130.026.736.136.0
SFCA-I (QXRD)/Platy SFCA (OIA)3.81.80.70.60.00.910.26.1
SFCA3.716.017.219.922.329.119.632.6
Total SFCA 17.817.920.522.330.029.938.7
Glass2.59.34.04.614.04.412.42.8
Larnite3.15.56.65.26.25.65.46.4
Quartz2.50.40.20.40.00.30.60.4
Dark Aluminosilicate3.0---0.10.0---0.3---0.0
Table 3. Calculated chemical compositions of the studied sinters. XRF results compared with results calculated from OIA using default mineral compositions (all data in weight%).
PhaseUN011UN154UN016
XRFOIA VSXRFOIAXRFOIA
Fe57.458.656.757.056.956.7
SiO25.64.55.44.75.04.8
Al2O31.81.81.92.21.72.1
CaO9.27.610.08.99.89.7
Table 4. Major textural classis (abundance more than 1% at least for one sinter) from textural classification of the studied sinters.
Particle TextureUN011 (Plant, Basicity 1.66)UN154 (Plant, Basicity 1.85)UN016 (Pot, Basicity 1.99)
No. of ParticlesArea%Wt%No. of ParticlesArea%Wt%No. of ParticlesArea%Wt%
Primary Hematite Porous Mix66214.114.5553.493.831958.418.94
Primary Hematite LowPor. Mix1150.330.39260.780.96611.992.52
Secondary Hematite SFCA26871.411.433213.413.364093.473.52
Secondary Hematite Glass 6031.071.023124.64.111430.260.23
Sec-Prime Hematite SFCA2652.42.43121.921.74474.584.50
Sec-Prime Hematite Mix34512.612.4493.553.39945.595.58
Magnetite SFCA29046.46.544447.457.951711.511.69
Magnetite Glass1882.282.26642.242.22140.180.20
Magnetite Mix4593.243.321041.571.7612.022.28
Magnetite5611.011.11963.003.39820.450.50
Magnetite-Hematite Mix2116.186.33601.591.65171.171.18
Hematite-Magnetite Mix2914.564.611002.022.07400.810.82
SFCApl Mix190.090.08110.350.33741.71.63
SFCA Magnetite5804.074.1165612.712.92175.085.24
SFCA Hematite990.670.66670.410.391373.33.26
SFCA HematiteMagnetite3422.622.483566.416.229010.19.89
SFCA Mix2550.860.82841.931.812002.482.44
SFCA27570.450.419431.191.127794.714.52
SFCA2-Magnetite Hematite662.412.47351.821.87161.151.12
SFCA2-Magnetite Mix5246.426.473618.838.931916.486.56
Magnetite-SFCA2 Mix6638.098.262748.068.171341.541.63
SFCA2-Hematite Mix4264.274.162036.696.5334418.218
Hematite-SFCA2-Magnetite Mix3281.691.701041.741.742006.046.03
HematiteMagnetiteGlass Mix540.990.95422.362.3550.000.00
Publisher’s Note: MDPI stays neutral with regard to jurisdictional claims in published maps and institutional affiliations.