
Analysis of the Effect of Payment Mechanism on Exploitation of Polymetallic Nodules in the Area


Abstract
1. Introduction
2. Research Status of Payment Mechanism
2.1. The Basic Principles and Problems That Need to Be Solved in the Formulation of the Payment Mechanism for Exploitation Regulations
- The system of payments to the Authority shall be fair both to the contractor and to the Authority and shall provide adequate means of determining compliance by the contractor with such system;
- The rates of payments under the system shall be within the range of those prevailing in respect of land-based mining of the same or similar minerals in order to avoid giving deep seabed miners an artificial competitive advantage or imposing on them a competitive disadvantage;
- The system should not be complicated and should not impose major administrative costs on the Authority or on a contractor. Consideration should be given to the adoption of a royalty system or a combination of a royalty and profit-sharing system. If alternative systems are decided upon, the contractor has the right to choose the system applicable to its contract. Any subsequent change in choice between alternative systems, however, shall be made by agreement between the Authority and the contractor.
2.2. The Royalty Types of Land Mining
2.2.1. Unit-Based Royalty
2.2.2. Value-Based Royalty
2.2.3. Profit-Based Royalty
2.2.4. Combination of Value-Based and Profit-Based Royalty
2.2.5. Progressive Value-Based Royalty
2.3. The Payment Mechanism Discussed in the Current Draft Regulations on Exploitation of Mineral Resources in the Area
- Fixed ad valorem—one stage;
- Fixed ad valorem—two stage;
- Variable ad valorem—two stage (fixed first stage, variable second stage);
- Blended profit—two stage (fixed ad valorem first stage, blended profit and fixed ad valorem second stage)
3. Financial Evaluation Model and Parameters
3.1. Financial Evaluation Model
3.1.1. Net Present Value
3.1.2. Internal Rate of Return
3.1.3. Dynamic Investment Payback Period
3.2. Main Parameters in the Financial Model
3.2.1. Composition of a Typical Development System
3.2.2. Analysis Case
3.2.3. Model Parameters
4. Sensitivity Analysis
4.1. Sensitivity Analysis
4.2. Sensitivity Analysis Results
4.3. Risk Analysis Based on Monte Carlo Method
5. Analysis of the Advantages and Disadvantages of Different Payment Mechanisms
5.1. Analysis of the Fixed Ad Valorem—One Stage Payment Mechanism
5.2. Analysis of the Fixed Ad Valorem—Two Stage Payment Mechanism
5.3. Analysis of the Blended Profit—Two Stage Payment Mechanism
5.4. Analysis of the Advantages and Disadvantages of Different Payment Mechanisms
5.4.1. Risk Analysis of Three Payment Mechanisms
5.4.2. The Advantages and Disadvantages of Different Payment Mechanisms
- The ad valorem payment system is not conducive to the promotion of Area mineral resources development technology. Because of the uncertainty of mining technology and mining environment, the contractors have to pay more for the development of new resources. However, ad valorem does not have the function of ensuring the contractor to obtain the basic profit; thus, it will affect the investment of investors in development activities and technological innovation, and it is not conducive to the development and technological progress of Area mineral resources development.
- The blended profit and fixed ad valorem payment system will not greatly increase the complexity of the payment system. Van Nijen pointed out that sources for obtaining contractor mining costs might include ISA recommendations, wherein rules for allowable cost are set out, or through costs reported by contractors for income tax payments to their sponsoring states [7]. In the draft regulation, the contractor is required to submit detailed reports on the mineral output, sales of ore, capital expenditure, and operating costs in mining activities in accordance with international accounting standards, and a strict inspection and audit system (rule 38) is stipulated. Therefore, it is feasible to obtain the production costs and income of the contractor through the above links and then calculate the profits. Moreover, the contractor not only needs to pay the royalty to the Authority, but also needs to pay the corporate income tax according to the profit to the country to which it belongs. In other words, the contractor’s profit is clear. Moreover, even for the Authority, the “owner of mineral resources”, the adoption of ad valorem has its own defects. For example, when the production cost decreases due to technological progress, the ad valorem payment system will not generate more benefits for the Authority; that is to say, other member states cannot share the benefits brought by technological progress.
6. Analysis of the Impact of Polymetallic Nodule Resources Development on Metal Market
6.1. Manganese Market
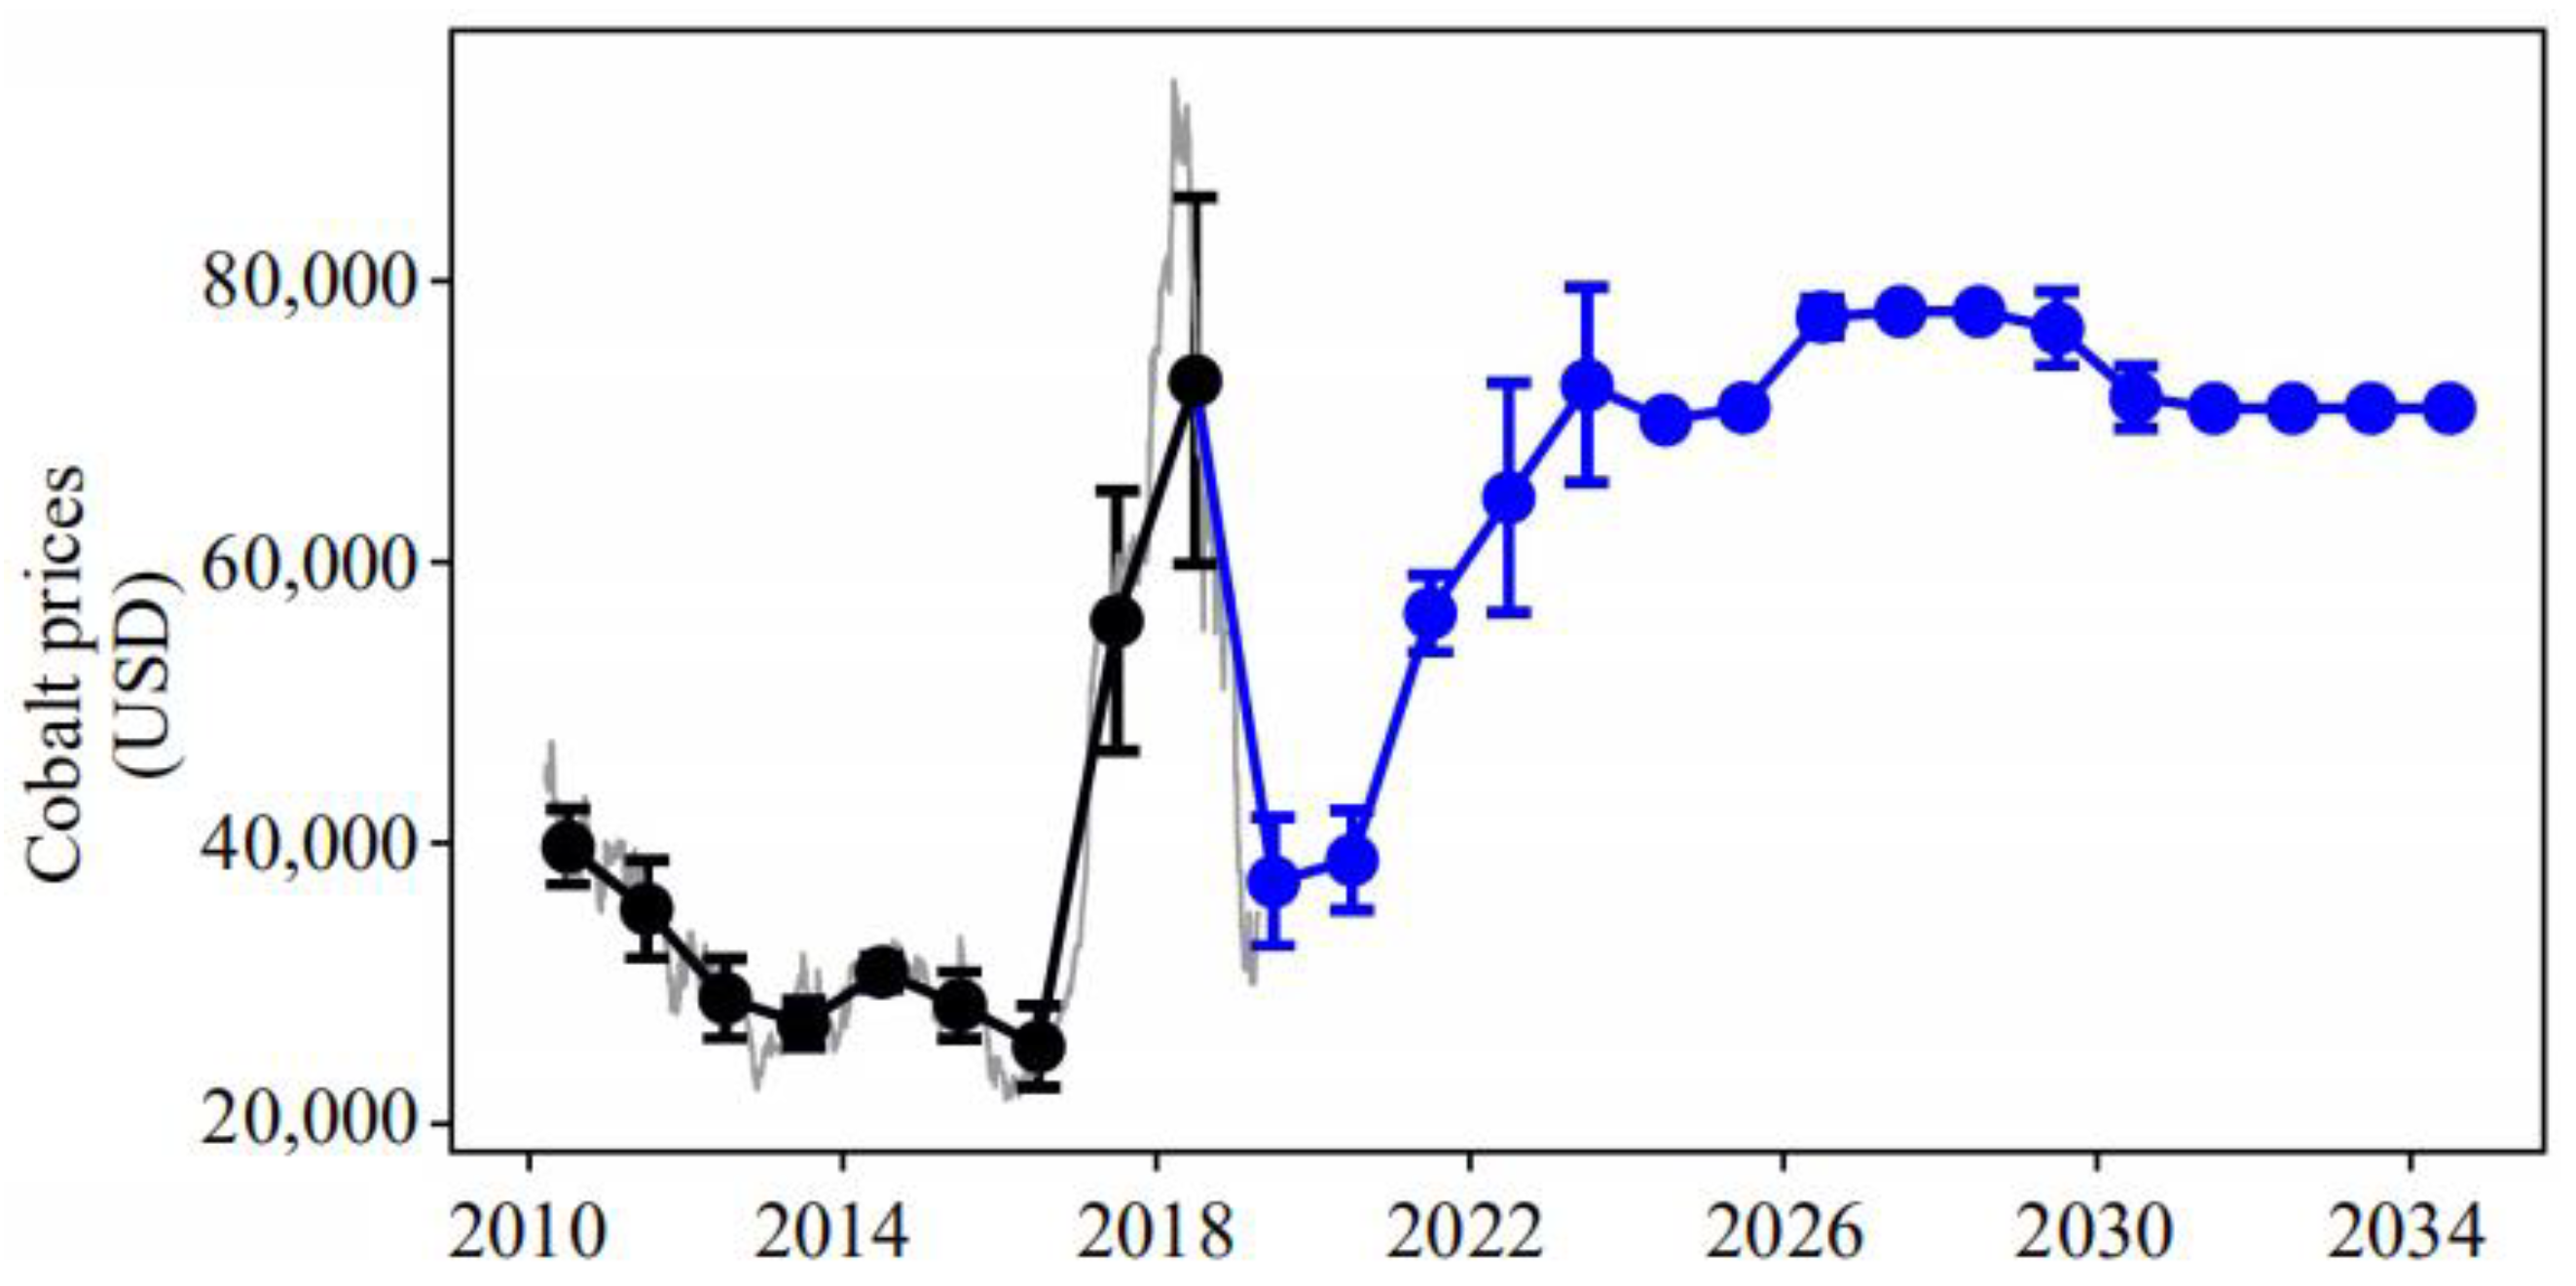
6.2. Cobalt Market
7. Conclusions
- This paper introduced the research status of payment systems in deep-sea mineral resources development regulations. At present, there are four payment systems being discussed. In essence, the first three are value-based payment modes, and the last one is a blended profit and fixed ad valorem payment mode.
- According to the background of Chinese deep-sea mineral resources development project in the Area, by using the discounted cash flow method, this paper constructed a financial model, named the CSU2019 model, determined the main parameters of the model, and compared it with several foreign financial models such as the MIT model.
- According to the sensitivity analysis, the top sensitive factors are annual mining output, manganese grade and price, smelting operation, and investment cost. It can be seen that increasing the output of ore and the value of manganese products and reducing the smelting cost are very important to improve the economic benefits of deep-sea polymetallic nodule development.
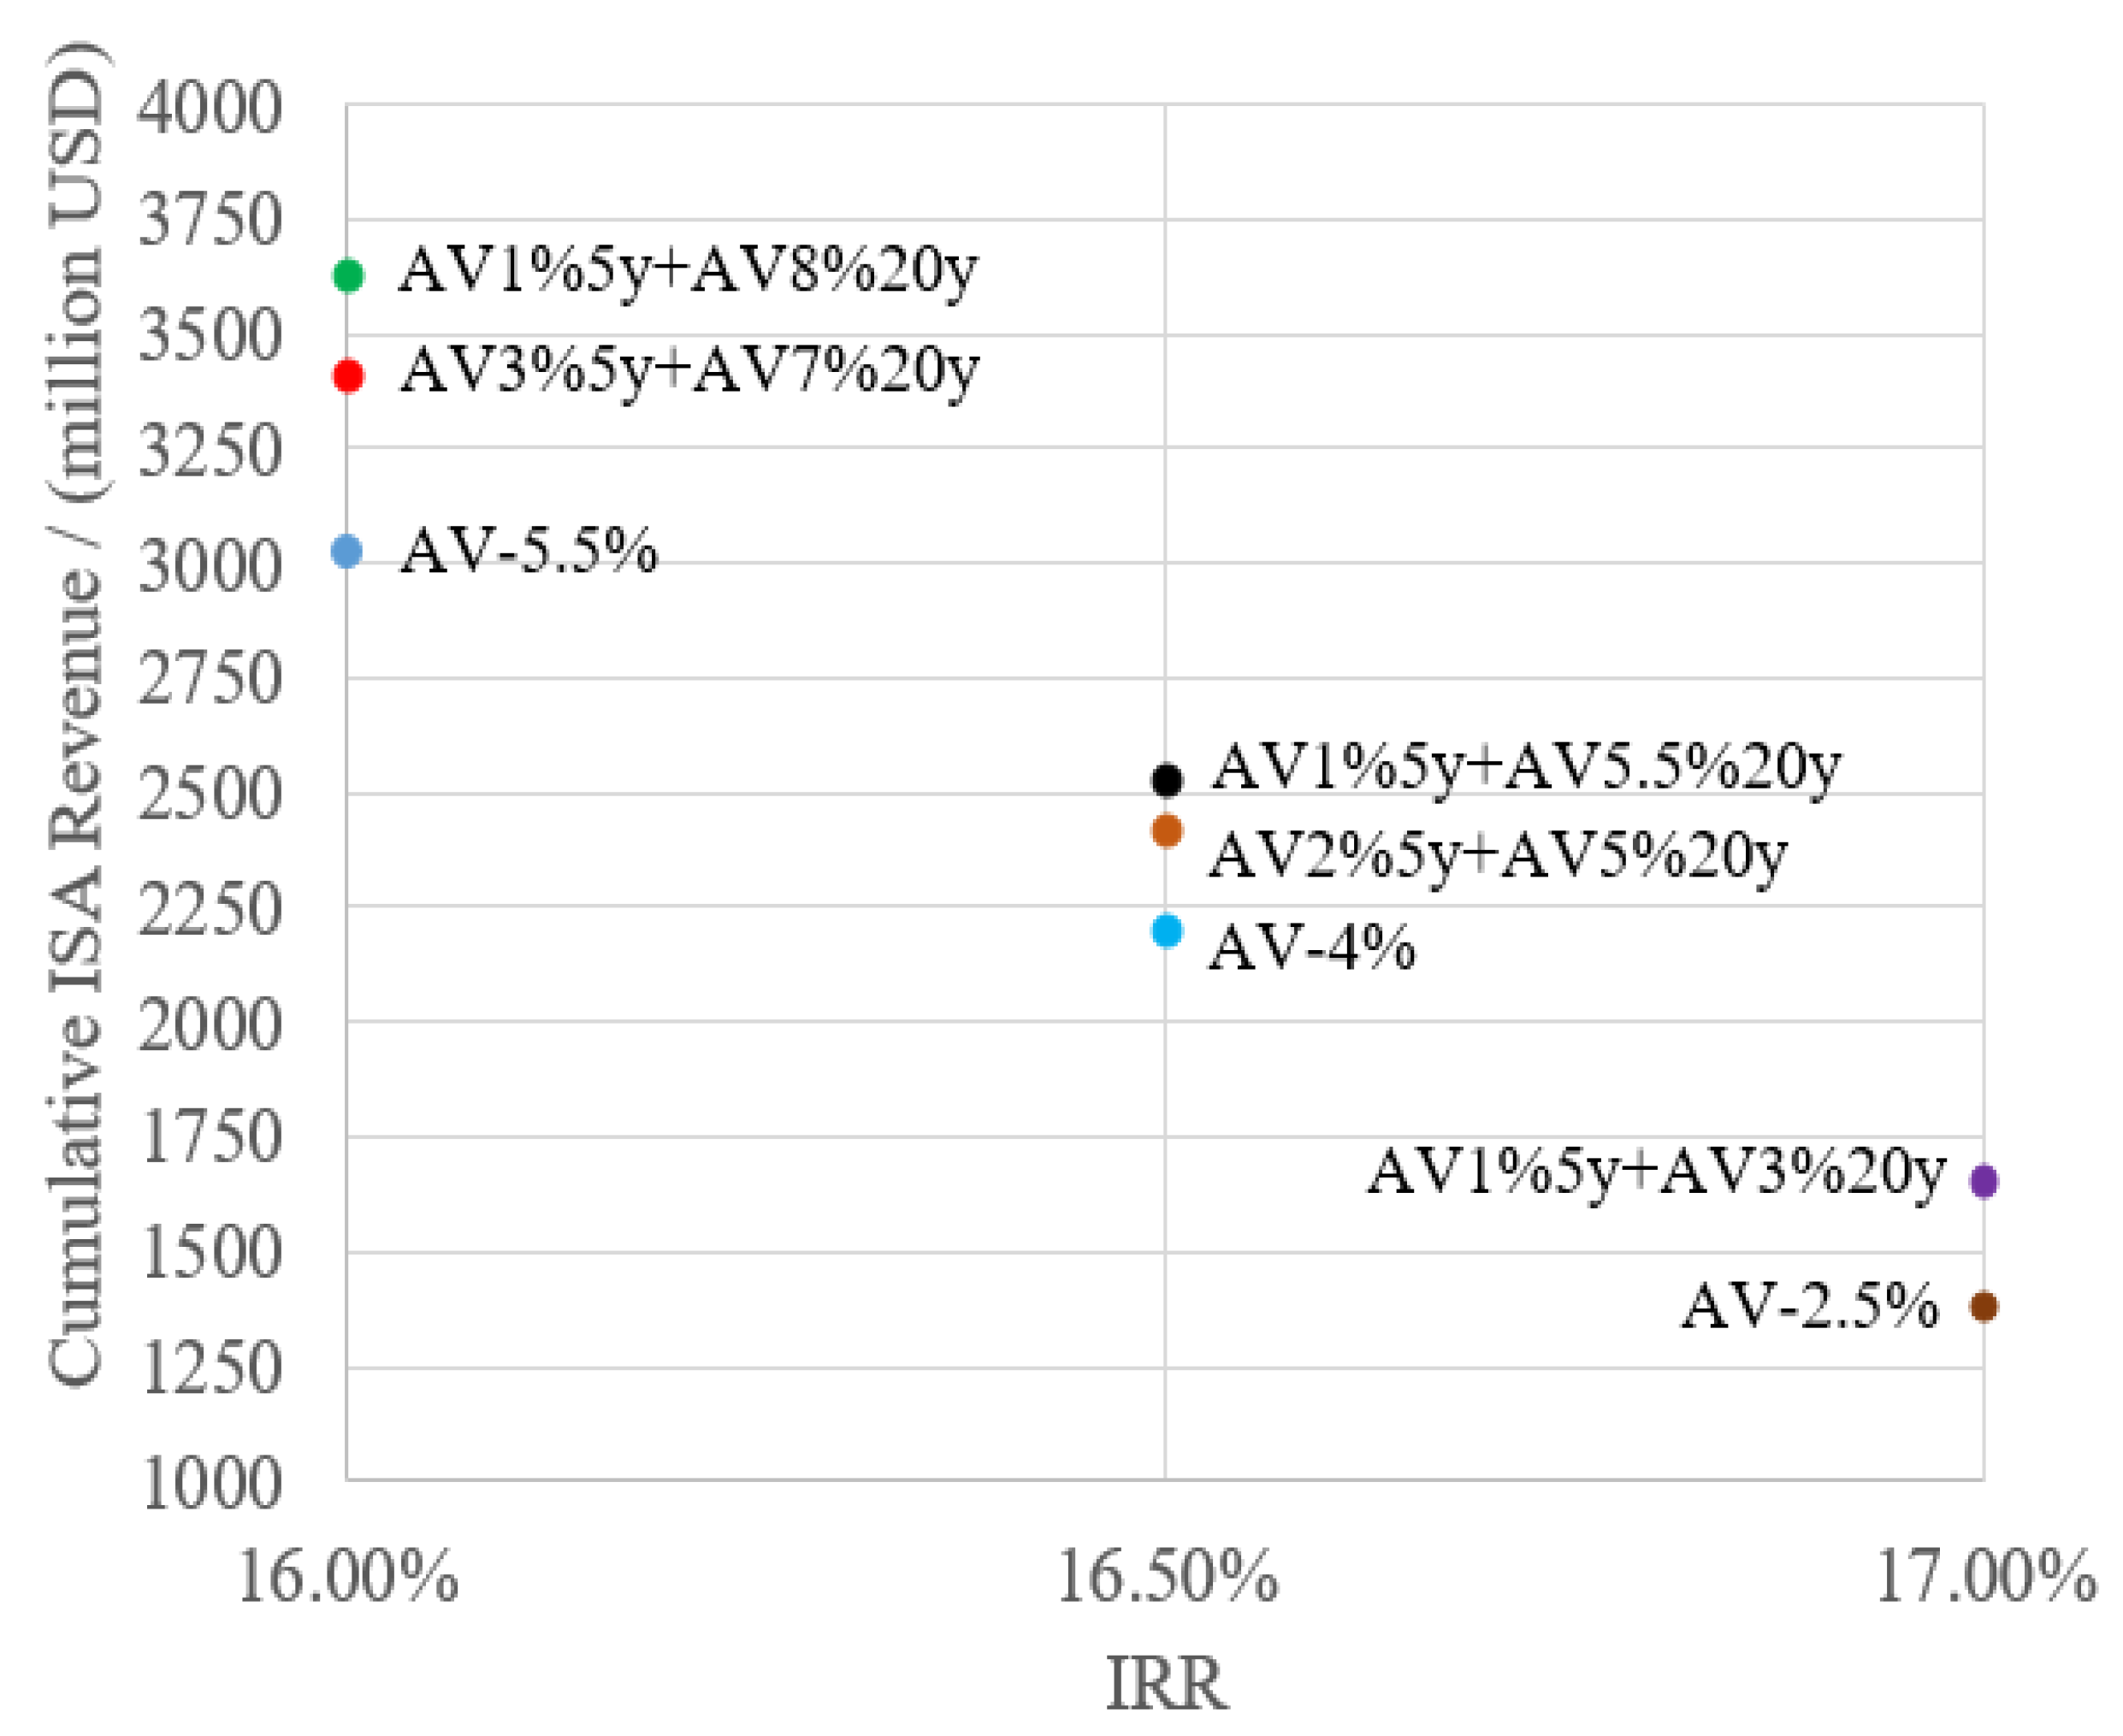
- On the basis of the COMRA project, the CSU2019 model was applied to calculate and analyze the impact of different payment systems and payment rates on the economic indicators of the project and the cumulative ISA revenue. Under the same internal rate of return (IRR), when adopting the fixed ad valorem—two stage payment system or blended profit—two stage payment system, the cumulative ISA revenue is always higher than that of the fixed ad valorem—one stage payment system.
- The fixed ad valorem—two stage payment system and blended profit—two stage payment system have their own advantages and disadvantages. If we only choose the value-based payment model, it is relatively less conducive to the promotion of Area mineral resources development technology, and it is relatively less conducive to sharing the benefits brought by the progress of mining technology. The blended profit and fixed ad valorem payment mode will not increase the complexity of the payment system.
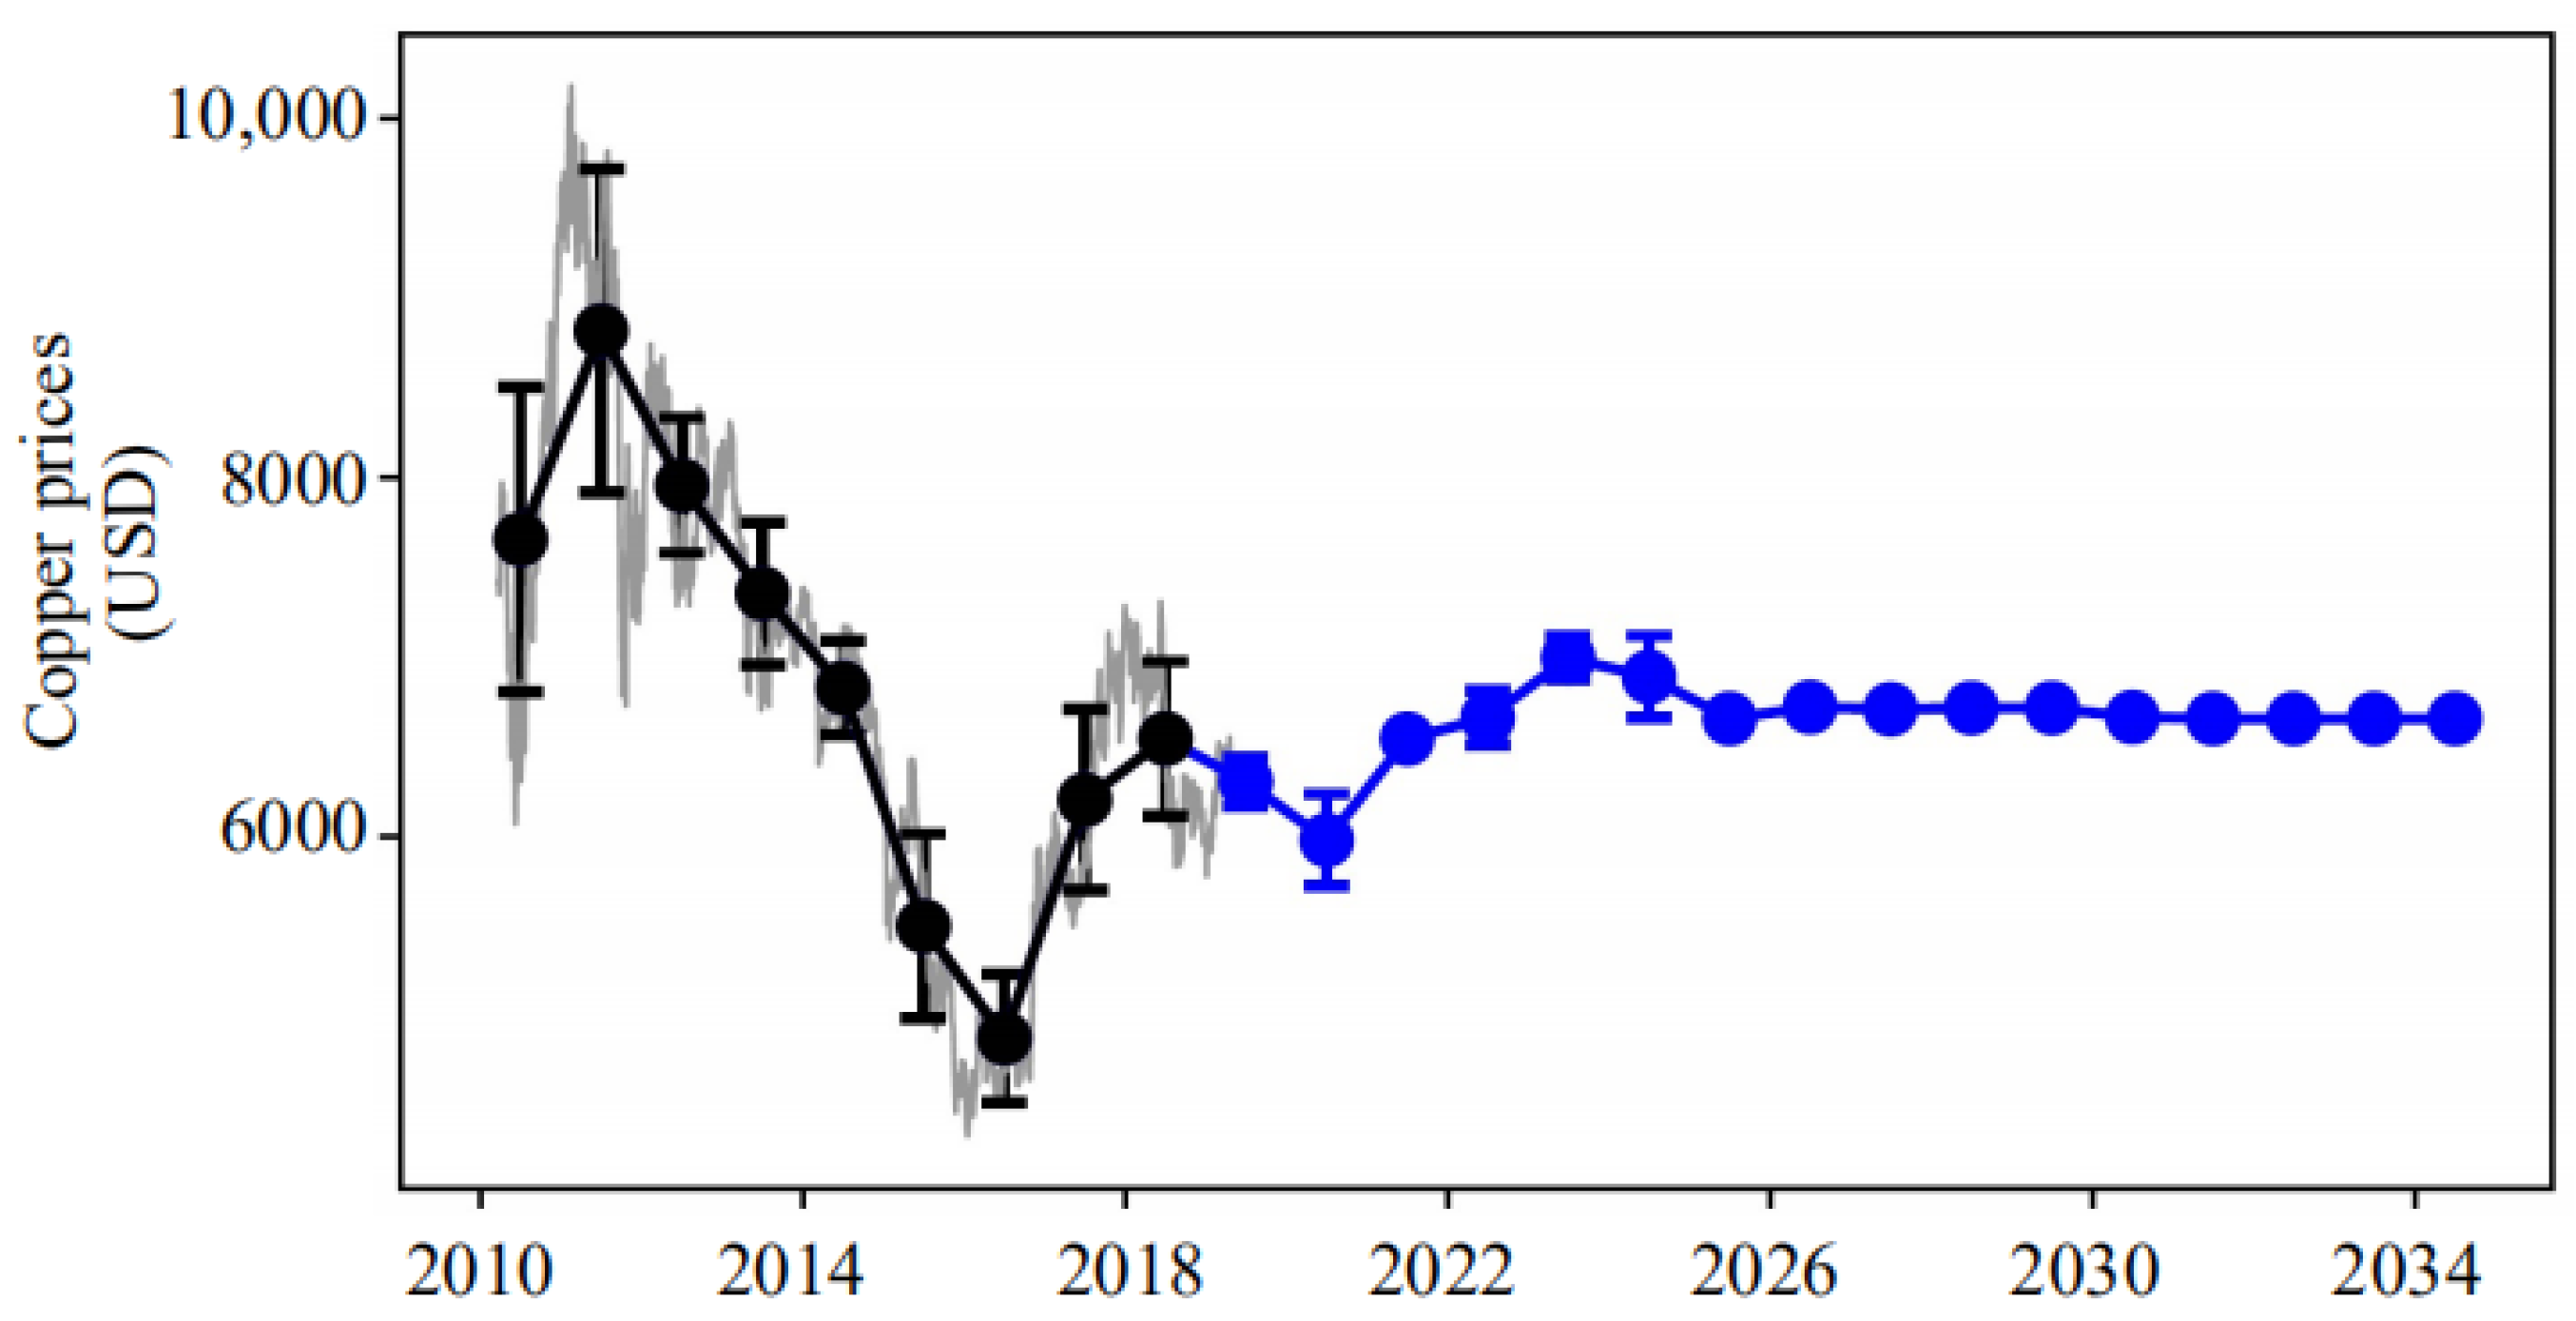
- The determination of the key factors of metal prices in the above economic evaluation and analysis was based on the prediction of metal price under the current land mining production conditions. In fact, some metals in deep-sea mineral resources have huge production capacity relative to the current market demand or land mining output, which may have a huge impact on the corresponding metal market price, especially manganese and cobalt. Considering the limited demand and huge energy consumption of EMM, it is obviously inappropriate to regard EMM as the only product of manganese in various financial models. It is necessary to consider silicon–manganese alloy and manganese-rich slag as products or adopt various forms of manganese products.
Author Contributions
Funding
Institutional Review Board Statement
Informed Consent Statement
Data Availability Statement
Acknowledgments
Conflicts of Interest
References
- Lodge, M. New Developments in Deep Seabed Mining; Hamburg Business Club: Hamburg, Germany, 2018. [Google Scholar]
- United Nations Office of Legal Affairs; International Seabed Authority. Marine Mineral Resources: Scientific Advances and Economic Perspectives; United Nations: New York, NY, USA, 2004; pp. 18–26. [Google Scholar]
- U. S. Geological Survey. Mineral Commodity Summaries 2020; U. S. Geological Survey: Washington, DC, USA, 2020.
- United Nations. United Nations Convention on the Law of the Sea (A/CONF.62/122); United Nations: New York, NY, USA, 1982. [Google Scholar]
- United Nations. Agreement for the implementation of Part XI of the United Nations Convention on the law of the sea of 10 December 1982 (A/RES/48/263); United Nations: New York, NY, USA, 1994. [Google Scholar]
- International Seabed Authority. Draft Regulations on Exploitation of Mineral Resources in the Area (ISBA/25/C/WP.1); International Seabed Authority: Kingston, Jamaica, 2019. [Google Scholar]
- Van Nijen, K.; Van Passel, S.; Brown, C.G.; Lodge, M.W.; Segerson, K.; Squires, D. The Development of a Payment Regime for Deep Sea Mining Activities in the Area through Stakeholder Participation. Int. J. Mar. Coast. Law 2019, 34, 1–39. [Google Scholar] [CrossRef]
- Van Nijen, K.; Van Passel, S.; Squires, D. A Stochastic Techno-Economic Assessment of Seabed Mining of Polymetallic Nodules in the Clairon Clipperton Fracture Zone. Mar. Policy 2018, 95, 133–141. [Google Scholar] [CrossRef]
- Volkmann, S.E.; Kuhn, T.; Lehnen, F. A comprehensive approach for a techno-economic assessment of nodule mining in the deep sea. Miner. Econ. 2018, 31, 319–336. [Google Scholar] [CrossRef]
- Kirchain, R.; Field, R.R.; Roth, R. Financial Mechanisms for Polymetallic Nodule Mining: A Comparison of Four Economic Models; Council of International Seabed Authority: Kingston, Jamaica, 2019. [Google Scholar]
- Pietro, G. Mineral Royalties and Other Mining Specific Taxes; Centre for Exploration Targeting: Crawley, Australia, 2012. [Google Scholar]
- Mergani, H.; Osanloo, M.; Parichehp, M. Ultimate Pit Limit Determination Considering Mining Royalty in Open-Pit Copper Mines. In Proceedings of the 28th International Symposium on Mine Planning and Equipment Selection—MPES 2019; Springer: Berlin/Heidelberg, Germany, 2019. [Google Scholar]
- Otto, J.; Andrews, C.B.; Cawood, F.; Doggett, M.; Guj, P.; Stermole, F.; Stermole, J.; Tilton, J. Mining Royalties: A Global Study of Their Impact on Investors, Government, and Civil Society; World Bank Publications: Washington, DC, USA, 2016. [Google Scholar]
- Daniel, P.; Keen, M.; Mcpherson, C. The Taxation of Petroleum and Minerals. Economãa 2010, 43, 3757–3763. [Google Scholar]
- Roth, R.; Kirchain, R.; Peacock, T. Financial Payment System Working Group Meeting; Financial Payment System Working Group Meeting: Kingston, Jamaica, 2020. [Google Scholar]
- International Seabed Authority. Report of the Chair on the Outcome of the Third Meeting of the Open-Ended Working Group of the Council in Respect of the Development and Negotiation of the Financial Terms of a Contract under Article 13, Paragraph 1, of Annex III to the United Nations Convention on the Law of the Sea and Section 8 of the Annex to the Agreement Relating to the Implementation of Part XI of the United Nations Convention on the Law of the Sea of 10 December 1982; Council of International Seabed Authority: Kingston, Jamaica, 2020. [Google Scholar]
- Götze, U.; Northcott, D.; Schuster, P. Discounted Cash Flow Methods. In Investment Appraisal; Springer Texts in Business and Economics; Springer: Berlin/Heidelberg, Germany, 2015. [Google Scholar]
- International Seabed Authority. Available online: https://www.isa.org.jm/map/china-ocean-mineral-resources-research-and-development-association (accessed on 22 May 2001).
- Liu, C.; Hu, Z.H.; Li, Y.; Liu, S.J. Forecasting copper prices by decision tree learning. Resour. Policy 2017, 52, 427–434. [Google Scholar] [CrossRef]
- Charlot, P.; Marimoutou, V. On the relationship between the prices of oil and the precious metals revisiting with a multivariate regime-switching decision tree. Energy Econ. 2014, 44, 456–467. [Google Scholar] [CrossRef]
- Kirchain, R.; Roth, R.; Frank, R.; Muñoz-Royo, C.; Peacock, T. Report1 to the International Seabed Authority on the Development of an Economic Model and System of Payments for the Exploitation of Polymetallic Nodules in the Area; Massachusetts Institute of Technology: Cambridge, MA, USA, 2019. [Google Scholar]
- Borgonovo, E. Sensitivity Analysis; Springer International Publishing: Cham, Switzerland, 2017. [Google Scholar]
- Zio, E. The Monte Carlo Simulation Method for System Reliability and Risk Analysis; Springer: London, UK, 2013. [Google Scholar]
- Shanxi Lianzhi Information Technology Co., Ltd. Available online: http://www.cbcie.com/mn/index.html (accessed on 10 April 2019).


| Royalty Types | Advantages | Disadvantages |
|---|---|---|
| Unit-based royalty | The administration is simple and efficient. Income stability and transparency are high. | Income maximization is low. |
| Value-based royalty | Market is highly sensitive. The administration is simple and efficient. Income stability and transparency are moderate. | The level of income maximization is average. It is easy to ignore the potential value of minerals. |
| Profit-based payment mechanism | Income maximization is high. | The administration is complex and inefficient. Income stability and transparency are low. |
| Combination of value-based and profit-based royalty | Income maximization is high. Income stability and transparency are moderate. | The administration is complex and inefficient. |
| Progressive value-based royalty | Market is sensitive. Income stability and transparency are moderate. | It is easy to ignore the potential value of minerals. |
| Production Plan | Construction period (years) | 3 | |
| Commercial mining period (years) | 25 | ||
| Annual production capacity (10,000 dry tons) | 300 | ||
| Capital Expenditure (Million USD) | Pre-feasibility and feasibility study | 310 | 8.8% |
| Mining system | 800 | 22.73% | |
| Transportation system | 410 | 11.65% | |
| Smelting system | 2000 | 56.82% | |
| Total | 3520 | 100% | |
| Operating Expense (Million USD/year) | Mining system | 300 | 29.65 |
| Transportation system | 112 | 11.07 | |
| Smelting system | 600 | 59.28 | |
| Total | 1012 | 100% | |
| Manganese Grade | Recovery Rate | Nickel Grade | Recovery Rate | Copper Grade | Recovery Rate | Cobalt Grade | Recovery Rate |
|---|---|---|---|---|---|---|---|
| 27.15% | 90% | 1.27% | 87% | 1.02% | 88% | 0.22% | 83% |
| Administrative Expenses or Taxes | Amount or Tax Rate | Illustration |
|---|---|---|
| Application fee for exploitation contract | 1,000,000 USD | Reference to exploration regulations |
| Annual management fee | 100,000 USD/year | Reference to exploration regulations |
| Annual fixed fee | 1,000,000 USD/year | Reference to the Convention |
| Royalty | - | Research object of financial model |
| Corporate income tax | 25% | Refer to Chinese standards |
| Value-added tax | 8% | Considering the deduction in practice |
| Insurance | 1,500,000 USD/year | Considering environment protection |
| Parameter Name | CSU2019 | MIT2018 | AG2018 | BMWi2017 |
|---|---|---|---|---|
| Modeling Method and Evaluation Metrics | ||||
| DCF method | √ | √ | √ | √ |
| IRR | √ | √ | √ | X |
| NPV | √ | √ | X | √ |
| Pt | √ | X | X | X |
| Price and Taxes | ||||
| Price determination method | Prediction algorithm and expert conjecture | Prediction method and expert conjecture | Current market price | Average price in recent years |
| Royalties | √ | √ | √ | X |
| Management expenses | √ | √ | X | X |
| Corporate income tax | 25% | 25% | 25% | X |
| Value-added tax | 8% | 0 | 0 | 0 |
| Parameter Name | CSU2019 | MIT2018 | AG2018 | BMWi2017 |
|---|---|---|---|---|
| Production Situation and Project Cycle | ||||
| Analysis period (years) | 28 | 37 | 35 | 16 |
| Development cycle (years) | 28 (3) | 30 (3) | 28 (3) | 16 (4) |
| Annual capacity (million dry tons) | 3 | 3 | 3 | 3 |
| Types of metal extraction | Cu/Ni/Co/Mn | Cu/Ni/Co/Mn | Cu/Ni/Co/Mn | Cu/Ni/Co |
| Manganese product plan | Electrolytic manganese | Electrolytic manganese | Electrolytic manganese | X |
| Capital Expenditure (Million USD) | ||||
| Feasibility study | 310 | 313 | 360 | - |
| Mining and transportation system | 1210 | 1643 | 1276 | 789 |
| Smelting system | 2000 | 2072 | 2415 | 1,543 |
| Operating Expense (Million USD/year) | ||||
| Mining and transportation | 412 | 413 | 450 | 91.5 |
| Smelting | 600 | 654 | 670 | 321 |
| Metal Price (USD/ton) | ||||
| Cobalt | 67,261 | 55,535 | 91,000 | 28,946 |
| Copper | 6635 | 6965 | 6886 | 6745 |
| Manganese | 1685 | 1640 | 2040 | 980 |
| Nickel | 12,692 | 22,962 | 14,840 | 14,920 |
| Metal Grade | ||||
| Cobalt | 0.22% | 0.21% | 0.25% | 0.18% |
| Copper | 1.02% | 1.07% | 1.2% | 1.18% |
| Manganese | 27.15% | 28.4% | 27% | 31.5% |
| Nickel | 1.27% | 1.3% | 1.3% | 1.4% |
| Recovery Rate | ||||
| Cobalt | 83% | 85% | 85% | 85% |
| Copper | 88% | 90% | 90% | 95% |
| Manganese | 90% | 90% | 95% | n/a |
| Nickel | 87% | 95% | 95% | 95% |
| Sensitivity Ranking | Sensitive Factors | Absolute Value of After-Tax NPV Sensitivity Coefficient | Absolute Value of After-Tax IRR Sensitivity Coefficient |
|---|---|---|---|
| 1 | Annual capacity | 13.89 | 1.67 |
| 2 | Manganese grade and price | 7.78 | 0.92 |
| 3 | Smelting operating expense | 4.01 | 0.48 |
| 4 | Smelting capital expenditure | 3.43 | 0.47 |
| 5 | Nickel grade and price | 2.65 | 0.32 |
| 6 | Cobalt grade and price | 2.27 | 0.27 |
| 7 | Mining operating expense | 2.03 | 0.24 |
| 8 | Mining capital expenditure | 1.31 | 0.18 |
| 9 | Copper grade and price | 1.12 | 0.13 |
| 10 | Transportation operating expense | 0.74 | 0.094 |
| 11 | Transportation capital expenditure | 0.68 | 0.088 |
| 12 | Royalty rate | 0.31 | 0.037 |
| Risk Variables | Distribution Type | Expected Value | Distribution Interval | Range of Variation | |
|---|---|---|---|---|---|
| Annual ore output (10,000 tons) | Trigonometric distribution | 300 | 250–315 | −17% to +5% | |
| Annual operating cost (million USD) | Trigonometric distribution | 1012 | 759–1265 | ±25% | |
| Fixed investment (million USD) | Trigonometric distribution | 3210 | 2407.5–4012.5 | ±25% | |
| Metal grade | Mn | Trigonometric distribution | 27.15% | 25.79–28.51% | ±5% |
| Co | Trigonometric distribution | 0.22% | 0.21–0.23% | ±5% | |
| Ni | Trigonometric distribution | 1.27% | 1.21–1.33% | ±5% | |
| Cu | Trigonometric distribution | 1.02% | 0.97–1.07% | ±5% | |
| Metal prices (USD/ton) | Mn | Trigonometric distribution | 1685 | 1263.75–2106.25 | ±25% |
| Co | Trigonometric distribution | 67261 | 50,445.75–84,076.25 | ±25% | |
| Ni | Trigonometric distribution | 12692 | 9519–15,865 | ±25% | |
| Cu | Trigonometric distribution | 6635 | 4976.25–8293.75 | ±25% | |
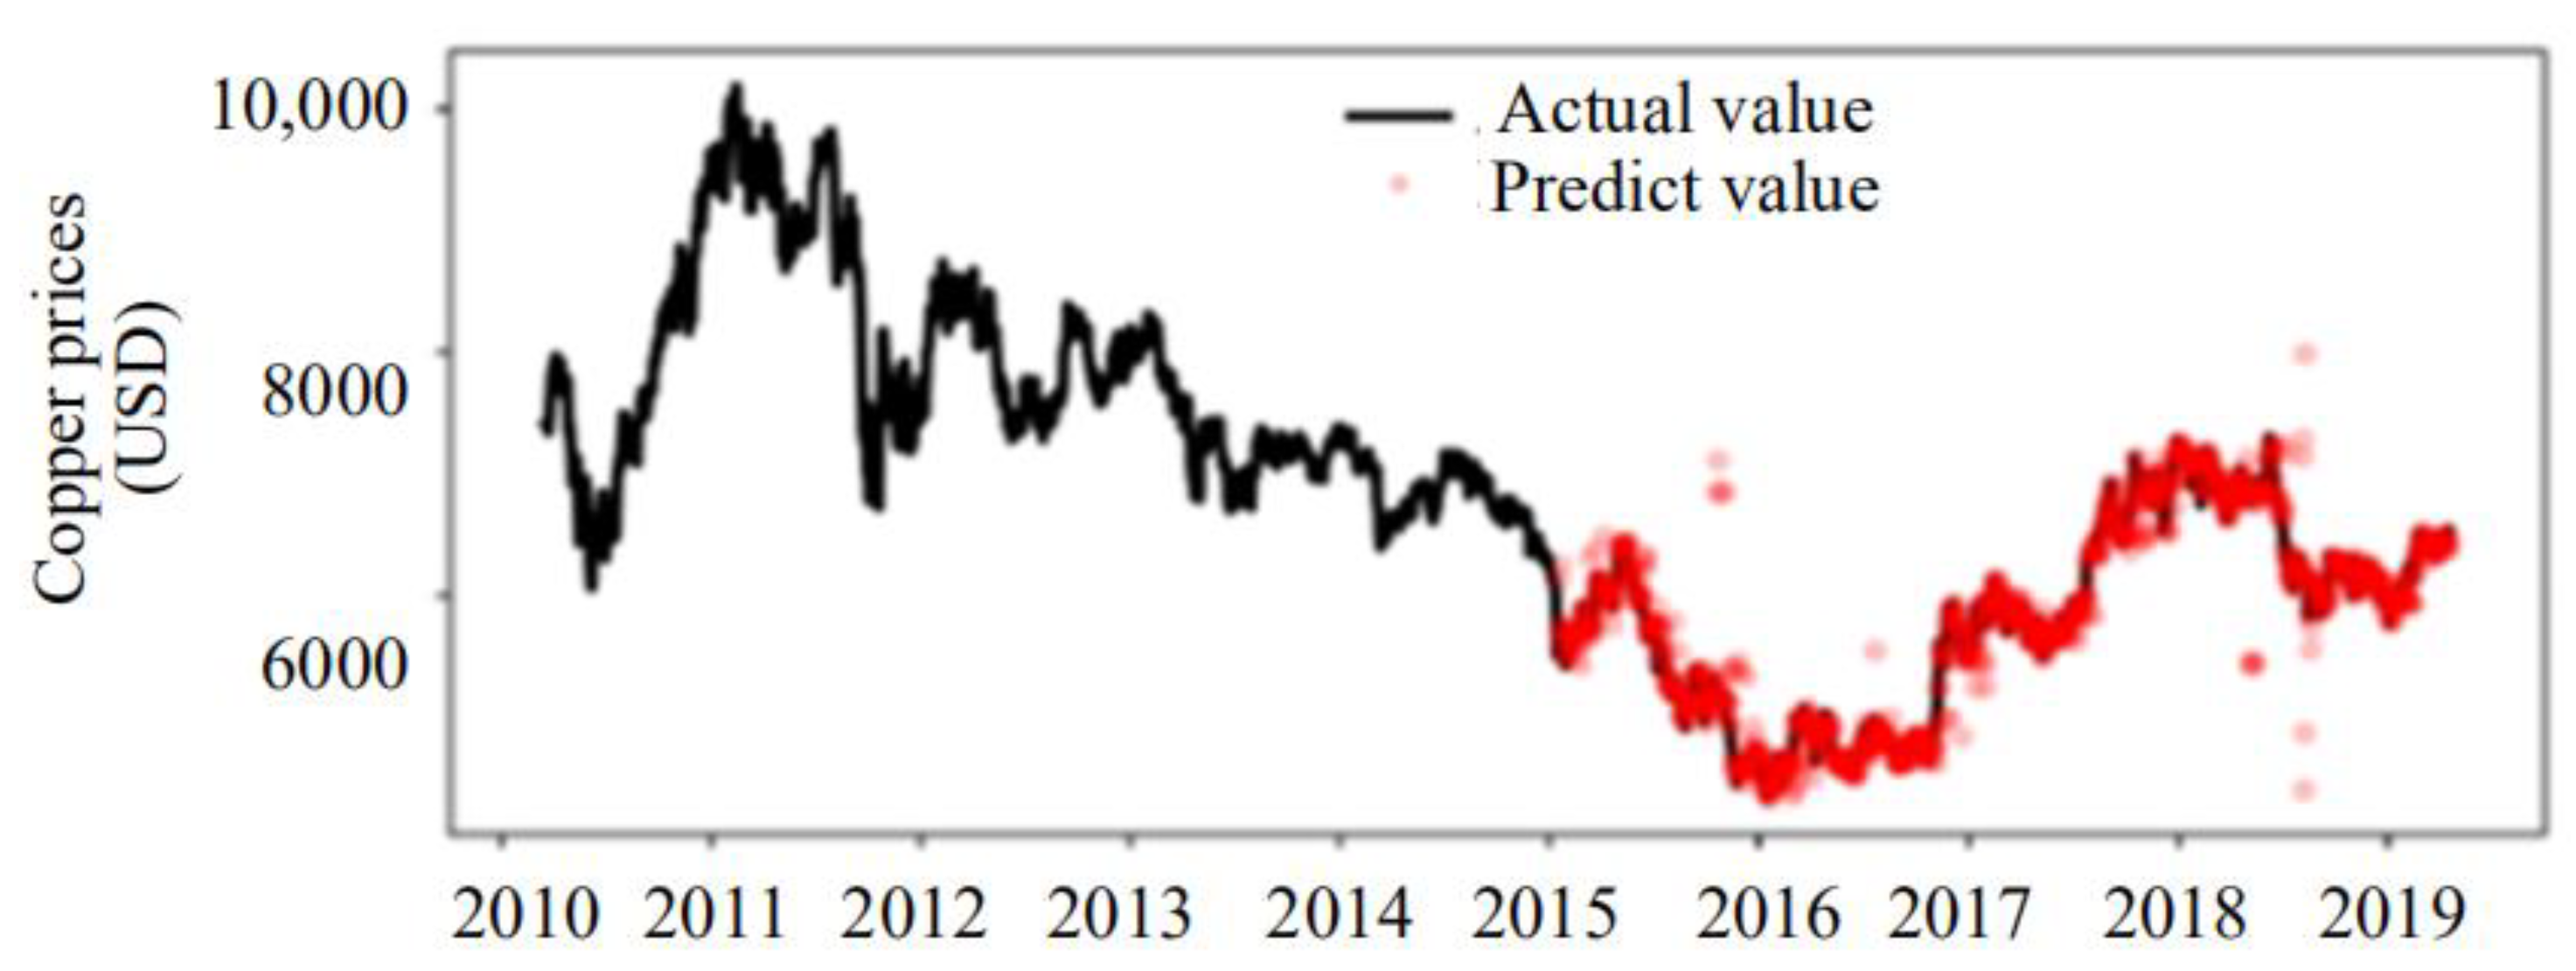
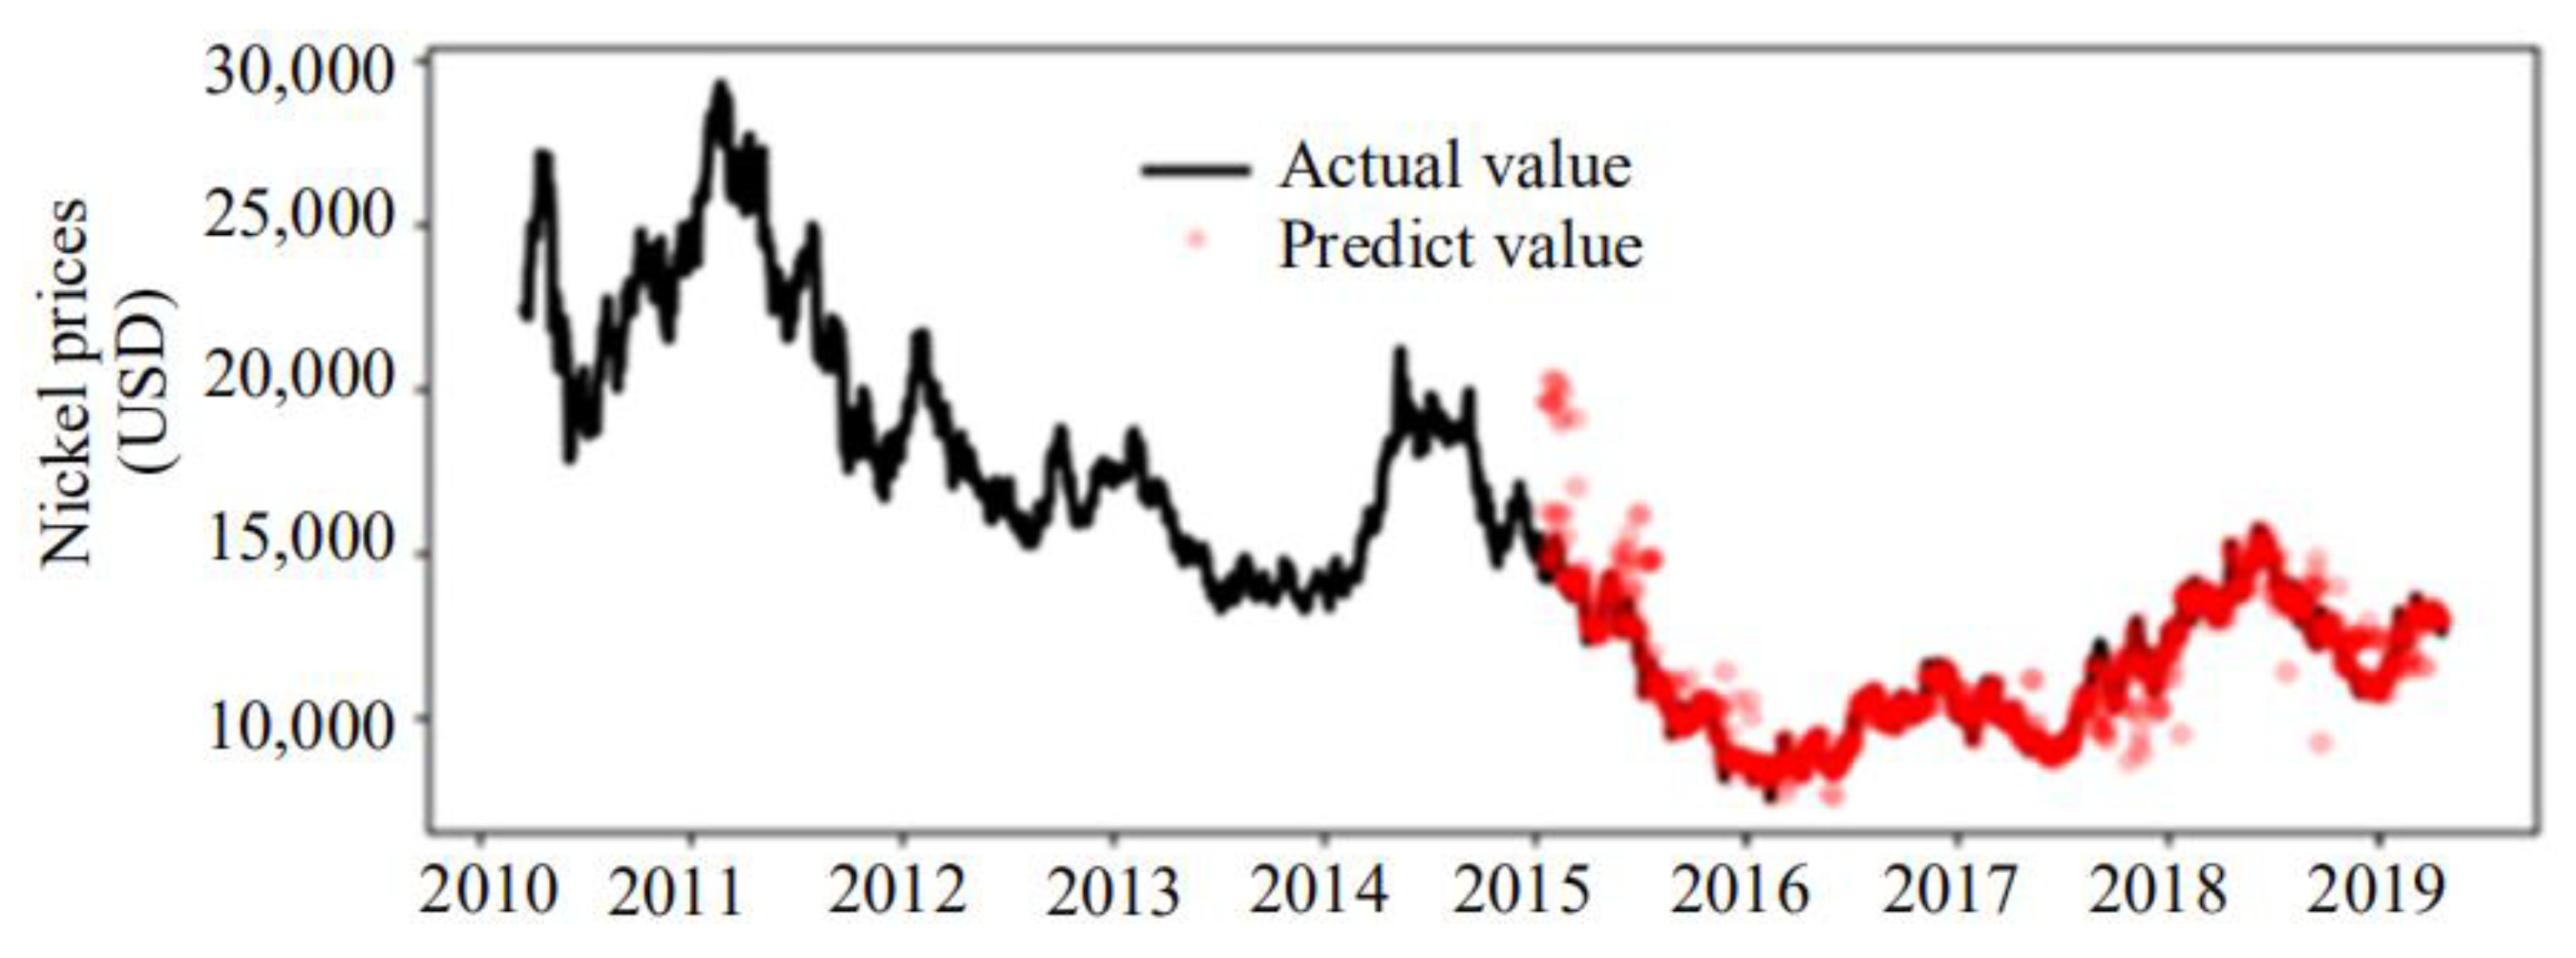
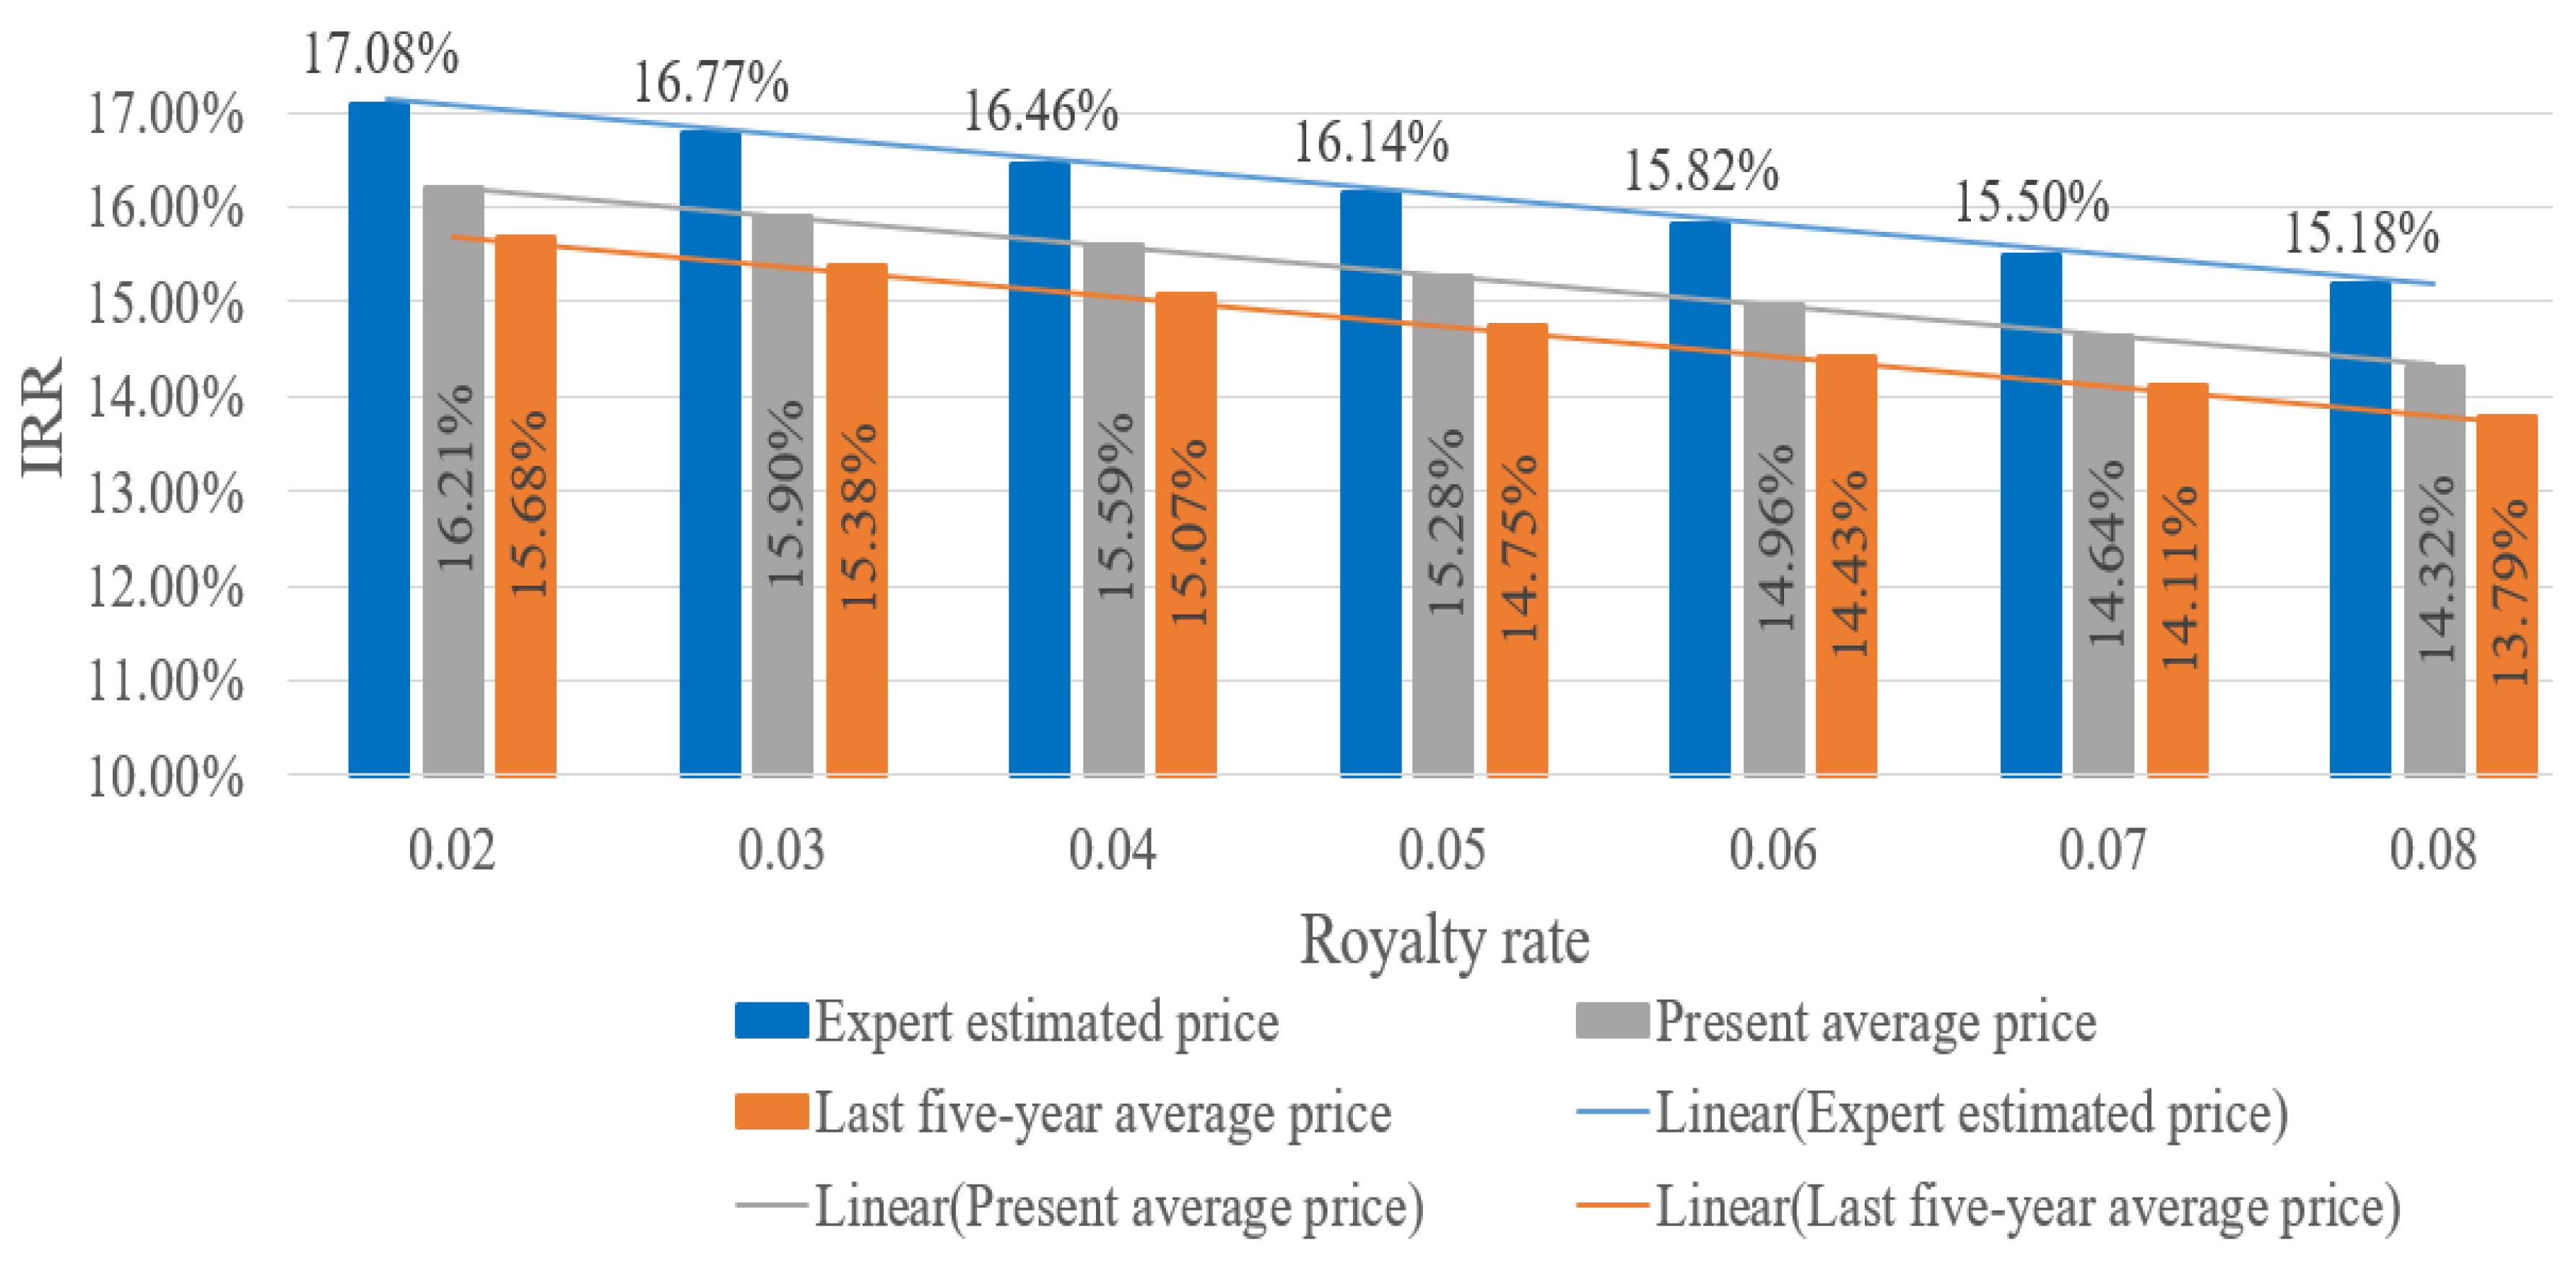
| Types of Metals | 2015–2019 5 Year Average Price (USD/ton) | 2020.1–2020.12 Present Average Price (USD/ton) | Expert Estimated Price (USD/ton) |
|---|---|---|---|
| Mn | 1798 | 1649 | 1685 |
| Ni | 11,769 | 15,849 | 12,692 |
| Co | 41,999 | 40,085 | 67,261 |
| Cu | 5823 | 6745 | 6635 |
| Payment Systems | IRR | ISA Annual Revenue (Million USD) | ISA Cumulative Revenue (Million USD) |
|---|---|---|---|
| AV5.5% | 16% | 121.17 | 3029.14 |
| AV1%5y + AV8%20y | 16% | 22.03/176.24 | 3634.97 |
| AV3%5y + AV7%20y | 16% | 66.09/154.21 | 3414.67 |
| AV4% | 16.5% | 88.12 | 2203.01 |
| AV1%5y + AV5.5%20y | 16.5% | 22.03/121.17 | 2533.47 |
| AV2%5y + AV5%20y | 16.5% | 44.06/110.15 | 2423.32 |
| AV2.5% | 17% | 55.08 | 1376.88 |
| AV1%5y + AV3%20y | 17% | 22.03/66.09 | 1431.96 |
| Payment Systems | IRR | After-tax NPV (Million USD) | ISA Annual Revenue (Million USD) | ISA Cumulative Revenue (Million USD) |
|---|---|---|---|---|
| AV5.5% | 16% | 217.55 | 121.17 | 3029.14 |
| AV3% + PB17% | 16% | 217.76 | 88.12/--- | 3449.89 |
| AV4% | 16.5% | 322.89 | 88.12 | 2203.01 |
| AV2% + PB13% | 16.5% | 323.32 | 44.06/--- | 2519.12 |
| AV2.5% | 17% | 428.23 | 55.08 | 1376.88 |
| AV1% + PB8.5% | 17% | 436.15 | 22.03/--- | 1505.75 |
| Payment Scheme | Maximum IRR | Minimum IRR |
|---|---|---|
| AV4% | 24.59% | 3.34% |
| AV1%5y + AV5.5%20y | 24.67% | 4.81% |
| AV2% + PB13% | 24.94% | 6.08% |
| Payment System | Influence on the Authority | Influence on Contractors | Main Advantages and Disadvantages |
|---|---|---|---|
| Ad valorem royalty | The difficulty of tax collection and the administrative cost are medium. | Does not reflect production costs and profits. | The contractors bear all the risks; it is not conducive to the development and technological progress. |
| Blended profit and fixed ad valorem | The requirements of accounting and auditing are high, and the management cost is high. | Reflects profitability and reduces risk. | ISA bears certain risks with the contractors; it encourages investment and technology development at early stage. |
| Metal | Copper | Nickel | Cobalt | Manganese |
|---|---|---|---|---|
| Annual production of four metals for a single development contract (10,000 tons) | 2.7 | 3.3 | 0.55 | 73 |
| Global supply of four metals in 2018 (10,000 tons) | 2300 | 190 | 15 | 1890 |
| Proportion | 0.12% | 1.75% | 3.75% | 3.86% |
Publisher’s Note: MDPI stays neutral with regard to jurisdictional claims in published maps and institutional affiliations. |
© 2021 by the authors. Licensee MDPI, Basel, Switzerland. This article is an open access article distributed under the terms and conditions of the Creative Commons Attribution (CC BY) license (http://creativecommons.org/licenses/by/4.0/).
Share and Cite
Li, Y.; Liu, C.; Su, S.; Li, M.; Liu, S. Analysis of the Effect of Payment Mechanism on Exploitation of Polymetallic Nodules in the Area. Minerals 2021, 11, 221. https://doi.org/10.3390/min11020221
Li Y, Liu C, Su S, Li M, Liu S. Analysis of the Effect of Payment Mechanism on Exploitation of Polymetallic Nodules in the Area. Minerals. 2021; 11(2):221. https://doi.org/10.3390/min11020221
Chicago/Turabian StyleLi, Yan, Chang Liu, Sihan Su, Mengdan Li, and Shaojun Liu. 2021. "Analysis of the Effect of Payment Mechanism on Exploitation of Polymetallic Nodules in the Area" Minerals 11, no. 2: 221. https://doi.org/10.3390/min11020221
APA StyleLi, Y., Liu, C., Su, S., Li, M., & Liu, S. (2021). Analysis of the Effect of Payment Mechanism on Exploitation of Polymetallic Nodules in the Area. Minerals, 11(2), 221. https://doi.org/10.3390/min11020221