Article

Analysis of the Effect of Payment Mechanism on Exploitation of Polymetallic Nodules in the Area

1
College of Mechanical and Electrical Engineering, Central South University, Changsha 410083, China
2
National Key Laboratory of Deep-Sea Mineral Researches Development and Utilization Technology, Changsha 410083, China
3
School of Business, Central South University, Changsha 410083, China
*
Author to whom correspondence should be addressed.
Minerals 2021, 11(2), 221; https://doi.org/10.3390/min11020221
Submission received: 27 January 2021 / Revised: 17 February 2021 / Accepted: 19 February 2021 / Published: 21 February 2021
(This article belongs to the Special Issue Exploration of Polymetallic Nodules)

Abstract

:
The international seabed area (i.e., the “Area”) is rich in mineral resources. According to the United Nations Convention on the Law of the Sea (UNCLOS) and the relevant implemented agreements, in 2012, the International Seabed Authority (ISA) began to develop the regulations for the exploitation of mineral resources in the Area. The most important part of the regulations involves determining the distribution of benefits from the exploitation of mineral resources in the Area between the ISA and the contractors. The establishment of a financial model to evaluate the economic benefits and compare the distribution scheme was the basic method relied on in the current study of payment mechanism. According to the characteristics of the exploitation project of mineral resources in the Area, the discounted cash flow method was selected to construct the financial model. Taking China’s deep-sea mineral resources development project in the Area as the background, the main parameters of the model were determined. A comparative study of similar financial models with Massachusetts Institute of Technology (MIT) and other foreign countries was carried out, in addition to a sensitivity analysis of parameters. On the basis of the assurance that the contractor’s internal rate of return was not lower than the level of the land mining enterprise, the financial model was used to calculate the internal rate of return and the revenue of royalty under different payment mechanisms and rates. The advantages and disadvantages of different payment mechanisms in the exploitation of mineral resources in the area were analyzed. Lastly, the possible impacts of deep-sea polymetallic nodule mining on Terrestrial metal markets were highlighted.

1. Introduction

The ocean accounts for about 70% of the Earth’s surface area, and the international seabed outside of national jurisdiction accounts for about 54% of the seabed area [1]. The international seabed (also known as the “Area”) is rich in deep-sea mineral resources. At present, polymetallic nodules, cobalt-rich crusts, and polymetallic sulfides are considered to have commercial development prospects. These minerals, which are widely distributed in the global ocean floor, are rich in metals such as manganese, nickel, cobalt, and copper. Deep-sea mineral resources have great development prospects. Taking polymetallic nodules as an example, according to the analysis of relevant United Nations agencies and experts, if a nodule abundance of 10 kg per square meter and a total metal grade of copper, nickel, and cobalt of 2.5% are set as the boundary conditions, it is estimated that the area of only the Pacific Ocean seabed meeting the conditions for commercial mining is about 4.25 million square kilometers, of which the reserves of copper, nickel, cobalt, and manganese are 0.3, 0.39, 0.078, and 8.6 billion tons, respectively [2]. According to data from the United States (US) Geological Survey, the global terrestrial copper, nickel, cobalt, and manganese reserves in 2018 were only 0.83, 0.089, 0.0069, and 0.76 billion tons [3].
The United Nations Convention on the Law of the Sea (hereinafter referred to as “the Convention”) stipulates that the Area and its resources are the common heritage of mankind, and its exploration and exploitation should be carried out for the benefit of all mankind. The International Seabed Authority (ISA) was established to administer the sea on behalf of all mankind in accordance with the Convention [4]. In 1994, the agreement relating to the implementation of Part XI of the United Nations Convention on the Law of the Sea of 10 December 1982 (hereinafter referred to as “the Agreement”) further stipulates that “the resources of the area shall be developed in accordance with sound commercial principles”, and requires the Authority to “formulate rules, regulations, and procedures with the development activities in the Area” [5].
From 2000 to 2012, the Authority completed and issued the “Regulations on Prospecting and Exploration” for polymetallic nodules, polymetallic sulfides, and cobalt-rich crusts. With the completion of the regulations on prospecting and exploration of three kinds of deep-sea mineral resources and the increasing concern of the international community on the commercial development of mineral resources in the Area, the Authority began to deploy the formulation of mineral resources development regulations (hereinafter referred to as “exploitation regulations”) in the Area at its 18th Council in 2012. In essence, the exploitation regulations will be a comprehensive mineral resources development management system in the Area, which needs to contain various elements. The payment mechanism is the most important aspect of the exploitation regulations. In the 2019 version of the draft exploitation regulations [6], there were 26 rules related to the payment mechanism, accounting for about one-quarter of all the rules (107 in total).
The ISA has carried out a lot of work in the formulation of exploitation regulations and payment mechanisms, and it has jointly held several seminars on payment mechanism with various organizations and institutions. In May 2016, the International Seabed Authority held the first seminar on mining payment mechanism in the Area in San Diego, the United States. It summarized the stakeholder survey feedback of payment mechanisms conducted by the Commission of Law and Technology in 2015. On the basis of the payment mechanism proposed by the Bellagio seminar in Italy, the impact of different payment mechanisms on the Authority and contractors was compared in terms of operability, fairness, and risk. In December 2016, the second deep-sea mining payment mechanism seminar was held in London. The basic variables and influencing factors of the financial model were discussed, and a preliminary financial model was proposed. In April 2017, the third seminar on payment mechanisms for deep-sea mining was held in Singapore to study the impact of royalties according to the proposed financial model and hypothetical data [7]. In the second part of the 24th session of the ISA in 2018, the Council accepted the proposal of Germany and established an open-ended financial working group to discuss the financial model.
Financial models are an indispensable tool in the study of payment mechanisms for exploitation regulation. Van Nijen presented a detailed, vertical, stochastic techno-economic assessment from a contractor’s perspective, and the economic performance measured by the internal rate of return was compared using deterministic and probabilistic commodity price forecasting models [8]. Considering geological, economic, financial, technical, and operational aspects, Sebastian Ernst Volkmann proposed a spatial planning tool to assess the techno-economic requirements and implications of manganese nodule mining on deep-sea deposits [9]. In the discussion of exploitation regulation formulation, MIT was entrusted by the Authority to carry out a study of the financial model (MIT2018 for short). Furthermore, some contractors, i.e., government departments of Member States, also carried out a study of the financial model for exploitation of polymetallic nodules in the Area. During the 24th Assembly of the Authority in 2018, the African Group submitted a financial model (AG2018) to the Assembly. The research team of Central South University introduced a financial analysis model (CSU2018), as well as the results of economic evaluation and risk assessment, at the side event jointly held by the Authority and China Ocean Mineral Resources Research and Development (R&D) Association (hereinafter referred to as “COMRA”), and they put forward suggestions for the formulation of a payment mechanism on this basis. At the meeting of the Council on 20 July, the representative of Germany made a speech and submitted a formal proposal, requesting that “the Council should ask Prof. Roth to compare and synthesize the reports and studies, including the economic study by Germany on the Economic Benefits of Commercial Deep-Sea Mining Operations of 30 September 2016, the African Group on the Payment Mechanism and other Financial Matters submitted on 9 July 2018, and the economic model of COMRA presented on 17 July 2018 during the side-event”. The Council accepted the proposal of the German delegation. In February 2019, the MIT research team published a Comparative Research Report on four financial models (i.e., German Federal Ministry for Economic Affairs and Energy (BMWi)2017, AG2018, CSU2018, and MIT2018) after half a year of research [10].

2. Research Status of Payment Mechanism

2.1. The Basic Principles and Problems That Need to Be Solved in the Formulation of the Payment Mechanism for Exploitation Regulations

The payment mechanism is the core aspect of the exploitation regulations. The Agreement [5] adopted in 1994 clearly declared that “the provisions of paragraphs 3 to 10 of Article 13 of Annex III of the Convention shall not apply” and proposed a new “Financial Clause of the Contract” (Section 8 of the annex), stipulating that “the rules, regulations, and procedures for formulating the financial terms of the contract shall be based on the following principles”:
  • The system of payments to the Authority shall be fair both to the contractor and to the Authority and shall provide adequate means of determining compliance by the contractor with such system;
  • The rates of payments under the system shall be within the range of those prevailing in respect of land-based mining of the same or similar minerals in order to avoid giving deep seabed miners an artificial competitive advantage or imposing on them a competitive disadvantage;
  • The system should not be complicated and should not impose major administrative costs on the Authority or on a contractor. Consideration should be given to the adoption of a royalty system or a combination of a royalty and profit-sharing system. If alternative systems are decided upon, the contractor has the right to choose the system applicable to its contract. Any subsequent change in choice between alternative systems, however, shall be made by agreement between the Authority and the contractor.
Although the “financial terms of the contract” in the Agreement established the basic principles that should be followed in the formulation of the payment mechanism for the exploitation regulations, there are still some problems to be solved, such as how to implement the spirit of the principles of the Convention and the Agreement, and how to determine the royalty rate and related time nodes in the payment mechanism.
First is the issue of fairness. Point (a) of the “Financial Clause of the Contract” of the Implementation Agreement requires that “the payment mechanism shall treat both the contractor and the administration fairly”. However, as a kind of benefit distribution, the contractor undoubtedly requires to obtain due returns and profits from their own investment in accordance with the “sound commercial principles”, while the Authority needs to fight for the rights and interests of the “principle of common heritage of mankind” on behalf of all countries and people. What is fairness? Of course, point (b) of the financial terms of the contract specifies the level of revenue that the contractor should receive, which may be used as a benchmark to define “fairly”.
Second is the issue of comparability. The Implementation Agreement requires that, in the payment mechanism, “the payment rates should not exceed the general range of the payment rates for land-based mining of the same or similar minerals”. However, land mining is carried out under the jurisdiction of a sovereign state. Each country has its own financial system. The payment rates are not consistent, and the purposes of the fees paid are also different. Which country’s payment rate should be used as a reference standard? On the other hand, the occurrence status of deep-sea minerals and land-based minerals is completely different, and the mineral characteristics are also very different. The equipment and operation methods used in deep-sea mining and land-based mining are also very different. Are the payment rates “not beyond the general range” as close as possible in absolute value? Or is the benefit basically the same when paying the same cost? From the perspective of the theory of technology and economy and the practice of land mining, the internal rate of return is often regarded as an indicator that can comprehensively measure the level of economic benefits of a mining project. The payment rates of the Area development projects should be reasonable if they are determined to make the internal rate of return within the general range of the internal rate of return of land mining projects.

2.2. The Royalty Types of Land Mining

Under most jurisdictions throughout the world, mineral resources are, with some rare exceptions, in public rather than private ownership. Mineral resources are finite and nonrenewable in the sense that their extraction permanently depletes a country’s resource inventory [11]. Royalty involves making a payment to the owner of mineral resources as compensation for transferring to the payer the ownership of that mineral or the right to sell that mineral [12]. An important connotation of the royalty is to levy fees for the resources withdrawn, which mainly includes the following types: (1) unit-based royalty; (2) value-based royalty; (3) profit-based royalty; (4) combination of value-based and profit-based royalty; (5) progressive value-based royalty [13,14].

2.2.1. Unit-Based Royalty

Unit-based royalty is based on a fee levied per unit volume or weight. Compared with other valuation methods, unit-based royalty is direct and easy to operate. The unit-based royalty is mainly used for industrial minerals and crude oil in some countries. It is usually more suitable for those minerals with large weight or volume, homogeneity, and low price, such as industrial minerals (sand, gravel, cobble, limestone, and dimension stone) or volume sales (coal, iron ore, salt, phosphate, potassium, and sulfur).

2.2.2. Value-Based Royalty

Value-based royalty (or ad valorem royalties) has high market sensitivity and rationality. It is based on the total value of minerals generated or mined. The calculation method is equal to the payment rate multiplied by the value of minerals. This method is the same as the unit-based royalty, regardless of whether the mine is profitable or losing money. It has to pay the royalty according to value. However, unlike the unit-based royalty, value-based royalty is positively correlated with mineral prices.

2.2.3. Profit-Based Royalty

Profit-based royalty is levied at a certain percentage of the profit obtained after subtracting the costs required for mining. It is commonly used in the mining of high-value minerals such as gold, silver, and gemstones, and it is also mainly used in developed countries. Profit-based royalty is a payment method that takes into account the developer’s ability to pay. This is the payment method that most contractors prefer. In this way, more consideration is given to the interests of the enterprise, which is conducive to mobilizing the enthusiasm of the enterprise; however, it will affect the financial revenue, especially when the market situation is bad. When the enterprise’s profits are low or when there are losses, it cannot pay the royalties. Profit-based royalty is based on whether it is profitable or not, which is different from the classical resource rent [11]. Unit-based royalty and value-based royalty do not consider the profitability of commercial mining projects, because these two payment mechanisms only focus on the quantity of minerals produced or the value of minerals produced or sold. Many countries have already applied this profit-based payment mechanism. For example, oil and gas exploitation in Western Australia is based on the collection of profit-based royalty.
According to the introduction of the above royalty types, their advantages and disadvantages are summarized in Table 1.

2.2.4. Combination of Value-Based and Profit-Based Royalty

A hybrid system of value-based and profit-based royalty takes into account the interests of the administration and the contractor. There are two ways to deal with this kind of mechanism. One is to calculate the value-based royalty and profit-based royalty and then pay the higher of the two. The other is to mix the value-based and profit-based payment mechanism and pay both at the same time. For example, the project cycle can be divided into two stages, whereby the first stage only adopts the value-based payment mechanism, and the second stage adopts the combination of value-based and profit-based royalties. This mode can not only ensure the interests of the contractor in the early stage, but also ensure the overall interests of the Authority in the whole project cycle.

2.2.5. Progressive Value-Based Royalty

While considering the owner’s revenue, if the collection of royalties is to be sustainable, the affordability of the payer must be considered. Therefore, in order to reduce the burden of enterprises, some countries adopt the progressive value-based payment mechanism, which adjusts the payment rate according to the annual metal price changes. For example, in order to encourage oil investors in northern Canada, the Canadian government adopts a progressive tax rate to collect royalty.

2.3. The Payment Mechanism Discussed in the Current Draft Regulations on Exploitation of Mineral Resources in the Area

The third meeting of the open-ended finance working group of the International Seabed Authority was held in Jamaica in February 2020. At the meeting, MIT reported the four payment mechanisms listed below [15]. ISA’s third financial working group meeting outcome report (ISBA/26/C/8) [16] recommended that “stakeholders submit comments to the secretariat before 23 March 2020, with the purpose of further improving the model’s various assumptions”.
  • Fixed ad valorem—one stage;
  • Fixed ad valorem—two stage;
  • Variable ad valorem—two stage (fixed first stage, variable second stage);
  • Blended profit—two stage (fixed ad valorem first stage, blended profit and fixed ad valorem second stage)

3. Financial Evaluation Model and Parameters

3.1. Financial Evaluation Model

The financial evaluation model of deep-sea polymetallic nodules in this study was constructed on the basis of the discounted cash flow (DCF) method [17]. This research was mainly aimed at three microeconomic evaluation metrics, namely, net present value (NPV), financial internal rate of return (IRR), and dynamic investment payback period to establish a corresponding evaluation metric mathematical model. The specific objective function structure is described below.

3.1.1. Net Present Value

Net present value consists of discounting all future cash flows (both in- and outflow) of each year within the project computation period according to a given discount rate (benchmark yield rate) before summing them together. NPV is a common dynamic evaluation metric to evaluate the profitability of a project during its calculation period. The objective function is constructed as follows:
N P V = n t C I n C O n / ( 1 + i ) n
where NPV is the net present value, CIn is the cash inflow, COn is the cash outflow, i is the discount rate, and t is the project calculation period.
This method can be used to calculate and evaluate the profitability of development projects within the construction and production service years. When applying the N P V evaluation plan, for an independent plan, N P V 0 should be satisfied before the plan can be accepted.

3.1.2. Internal Rate of Return

The internal rate of return refers to the discount rate when the sum of the present value of the financial net cash flows of each year of the project during the entire calculation period is equal to zero, that is, the discount rate when the financial net present value of the project is equal to zero. After the financial internal rate of return is calculated, it is compared with the benchmark rate of return i c . If I R R i c , the project is economically acceptable; if I R R < i c , the project is economically unacceptable. The objective function is constructed as follows:
n t C I n C O n ( 1 + I R R ) n = 0
where IRR is the financial internal rate of return, CIn is the cash inflow, COn is the cash outflow, and t is the project calculation period.

3.1.3. Dynamic Investment Payback Period

The dynamic payback period refers to the period of time required to recover all investments while taking into account the time value of money, that is, the time required for the project from the beginning of the investment to when the accumulated discounted cash flow is equal to 0. The payback period is an important economic indicator reflecting the financial repayment ability of the project. The calculation formula is constructed as follows:
P t = ( n 0 1 ) + | C F ( n 0 1 ) | C F n 0
where n0 is the number of years with a positive cumulative net cash flow, CFn0 is the present value of net cash flow in a positive year, and CF(n0−1) is the present value of accumulated net cash flow in the previous year.
For an independent conventional investment plan, by comparing the definitions of NPV and IRR, the conclusions below can be drawn.
For an independent conventional investment plan, the conclusions of the IRR and NPV are consistent; the NPV indicator is easy to calculate and shows the time distribution of the project’s cash flow, but the degree of return in the investment cannot be obtained, and it is affected by external parameters such as the discount rate. The calculation of IRR is more complex, but it can reflect the degree of return in the investment. The calculation of IRR is not affected by external parameters and depends entirely on the cash flow of the investment process. NPV is the absolute value, whereas IRR is the ratio. A scheme with a lower IRR may have a larger NPV due to its larger scale, which is more worthy of construction. Therefore, both IRR and NPV must be taken into consideration when determining the project scheme.

3.2. Main Parameters in the Financial Model

3.2.1. Composition of a Typical Development System

At present, no actual commercial polymetallic nodule development system has been established. Therefore, research on the technical and economic evaluation of Area mineral resources development can only be based on the current typical development system plan, generally including the mining system, transportation system, and smelting system, as outlined below.
The mining system includes underwater mining vehicles, pumps and lifting pipes, surface mining ships, and ship-borne operation support equipment and mineral dehydration equipment. In actual operations, underwater auxiliary operation robots and surface auxiliary vessels may also be required.
The transportation system mainly includes transportation ships, dock loading and unloading equipment, and warehouses, which can be built by contractors or rented.
The smelting and processing system mainly includes the beneficiation and smelting plant, as well as grinding, smelting, and other facilities. Because the beneficiation and smelting process of marine minerals is different from that of land minerals, and the processing quantity is also large, it is generally not possible to directly use the equipment of existing beneficiation plants. It is necessary to redesign and construct the processing system for metallurgical processing.
In the subsequent economic evaluation model, capital expenditure and operating expense are estimated according to the current typical development system.

3.2.2. Analysis Case

This article takes the polymetallic nodule exploration contract area of the COMRA in the Area (referred to as the “COMRA project”) as an example to carry out economic evaluation research, and the corresponding financial model is referred to as the “CSU2019” model, in which only some parameters are adjusted compared with the CSU2018 model, to calculate the impact of payment system on project economic evaluation metrics.
In 2001, COMRA signed an exploration contract with ISA and obtained about 150,000 km2 of polymetallic nodule exploration area in the Clarion–Clipperton Fracture Zone (CCZ). After several years of exploration and regional abandonment, about 75,000 km2 of contract area was reserved in the western part of the Clarion–Clipperton Fracture Zone, which was divided into the west block and east block (Figure 1) [18]. According to systematic exploration work in the contract area, assuming that boundary abundance is 10 kg/m2, the cutoff grade (nickel equivalent grade) is 1.68%, the slope is ≤5°, the ore-bearing block can be delineated. The evaluation results showed that the west block of contract area has a resource reserve capacity with an annual output of three million tons of dry nodules and 20 years of production.

3.2.3. Model Parameters

(1) Business parameters of mining enterprises
It is assumed that the annual ore mining volume is three million tons of dry weight, the infrastructure period is 3 years, and the commercial mining period is 25 years. The financial model of CSU2019 is based on the consideration of recycling “four metals”, extracting the four metals of manganese, nickel, cobalt, and copper from nodules. The final manganese product is assumed to be electrolytic manganese metal (EMM). The capital expenditure and operating expense of the project are considered according to the mining system, transportation system, and processing system. The main business parameters of mining enterprises used in the model are shown in Table 2; the metal grade and smelting recovery rate are shown in Table 3.
(2) Price
This study uses the metal price prediction method developed on the basis of decision tree machine learning [19,20] to predict and analyze the future prices of copper, nickel, and cobalt.
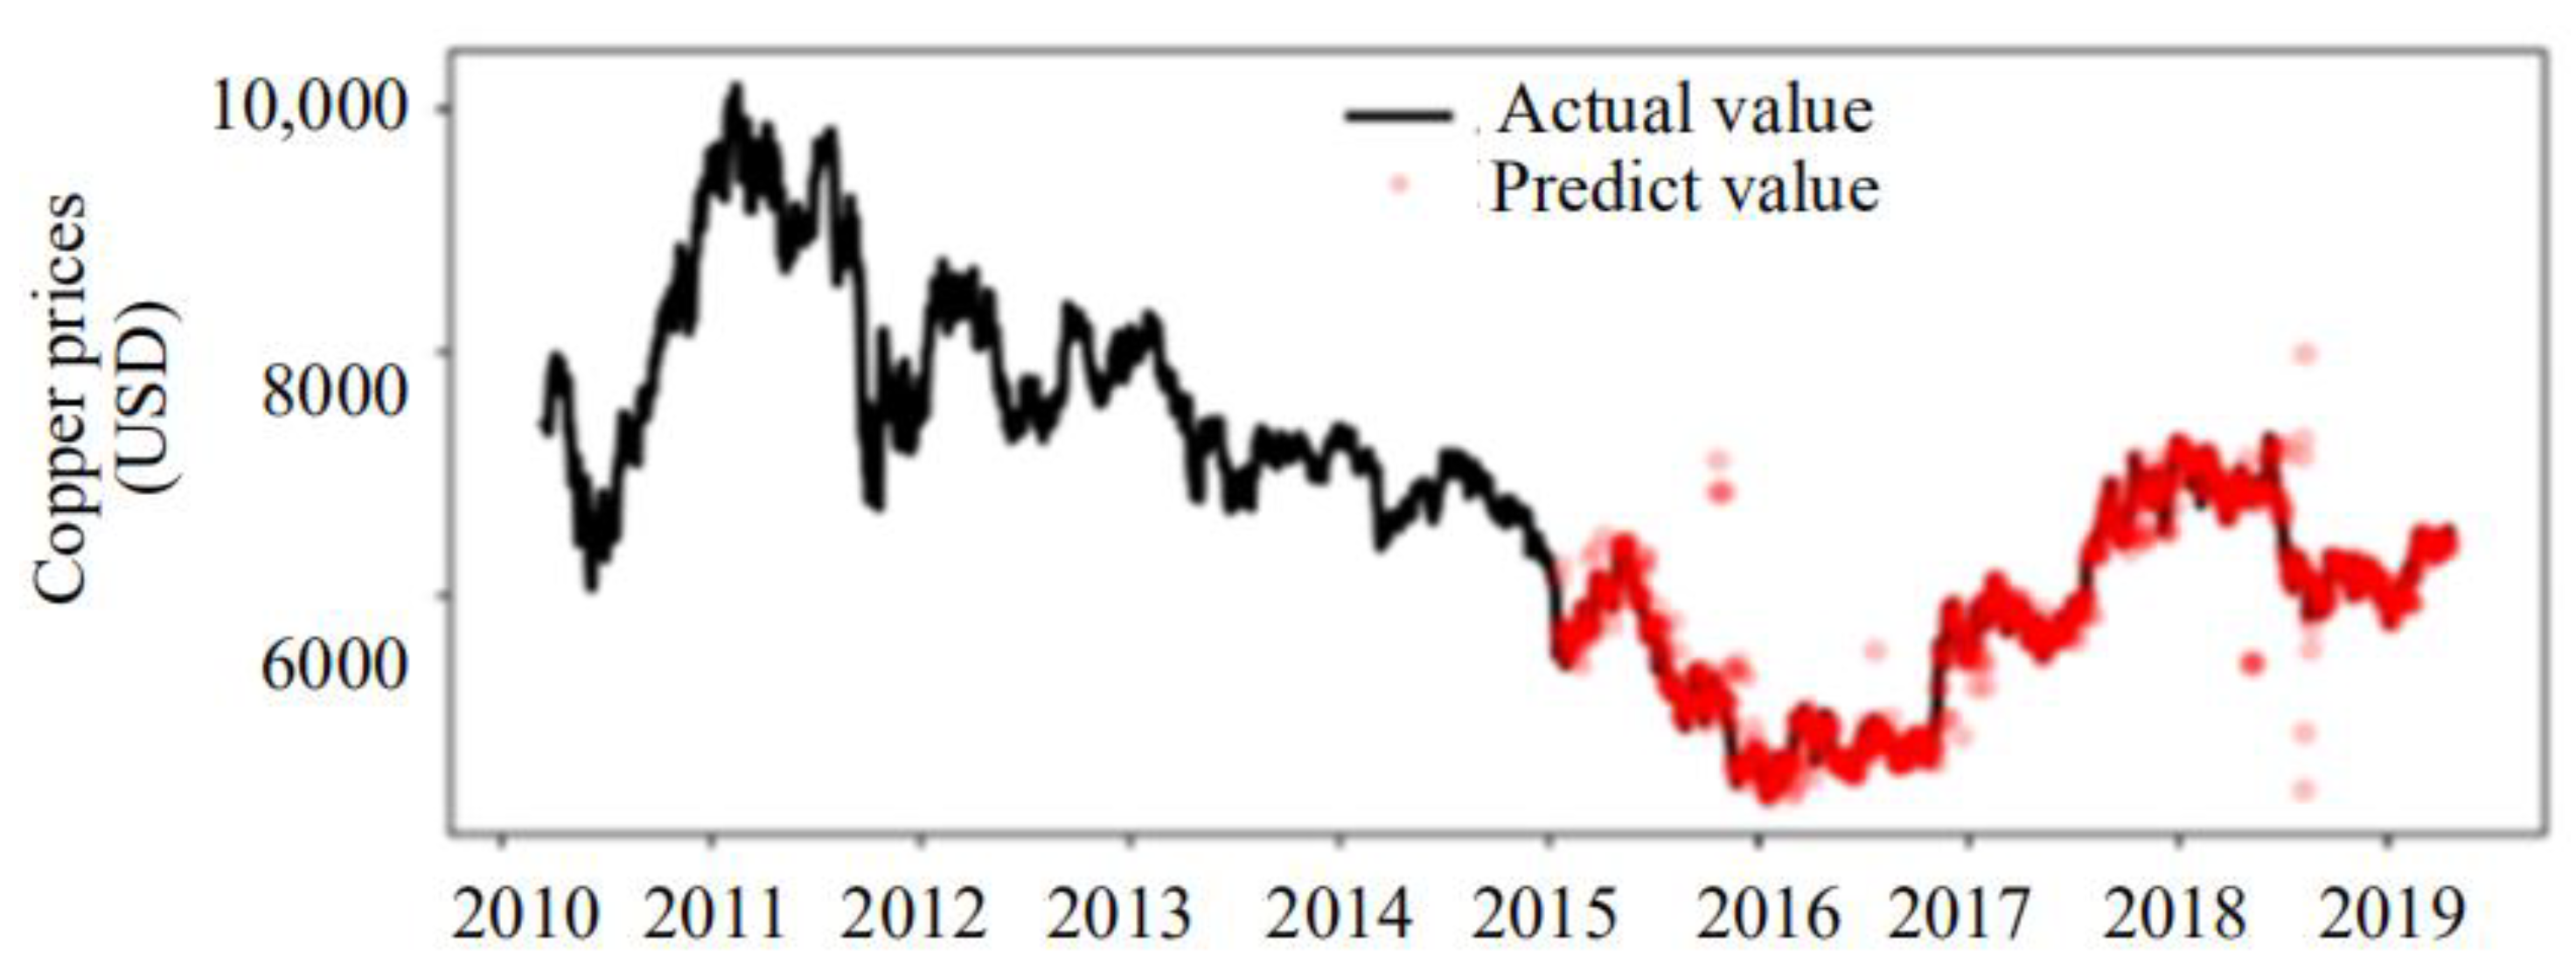
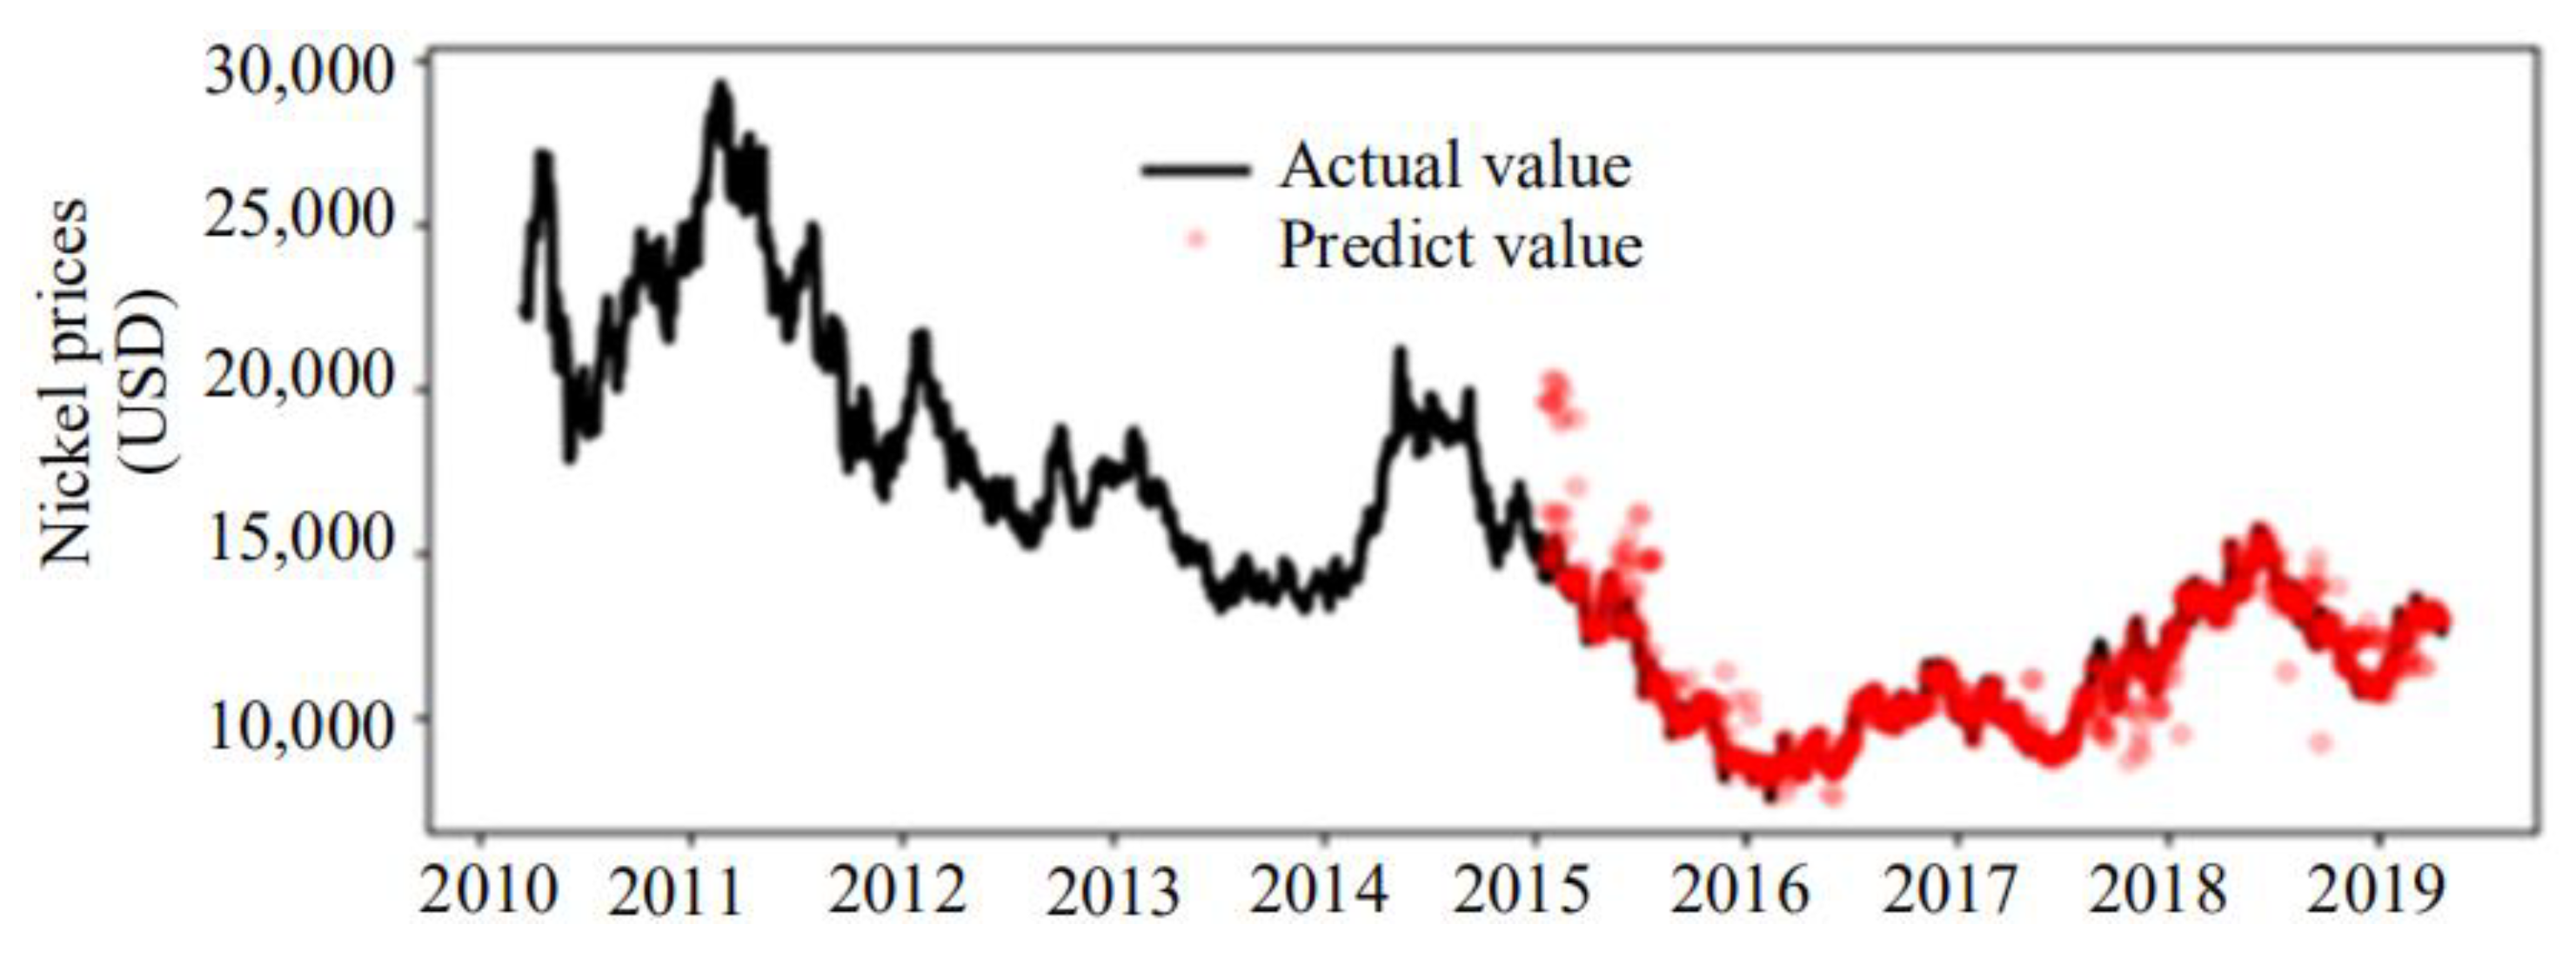
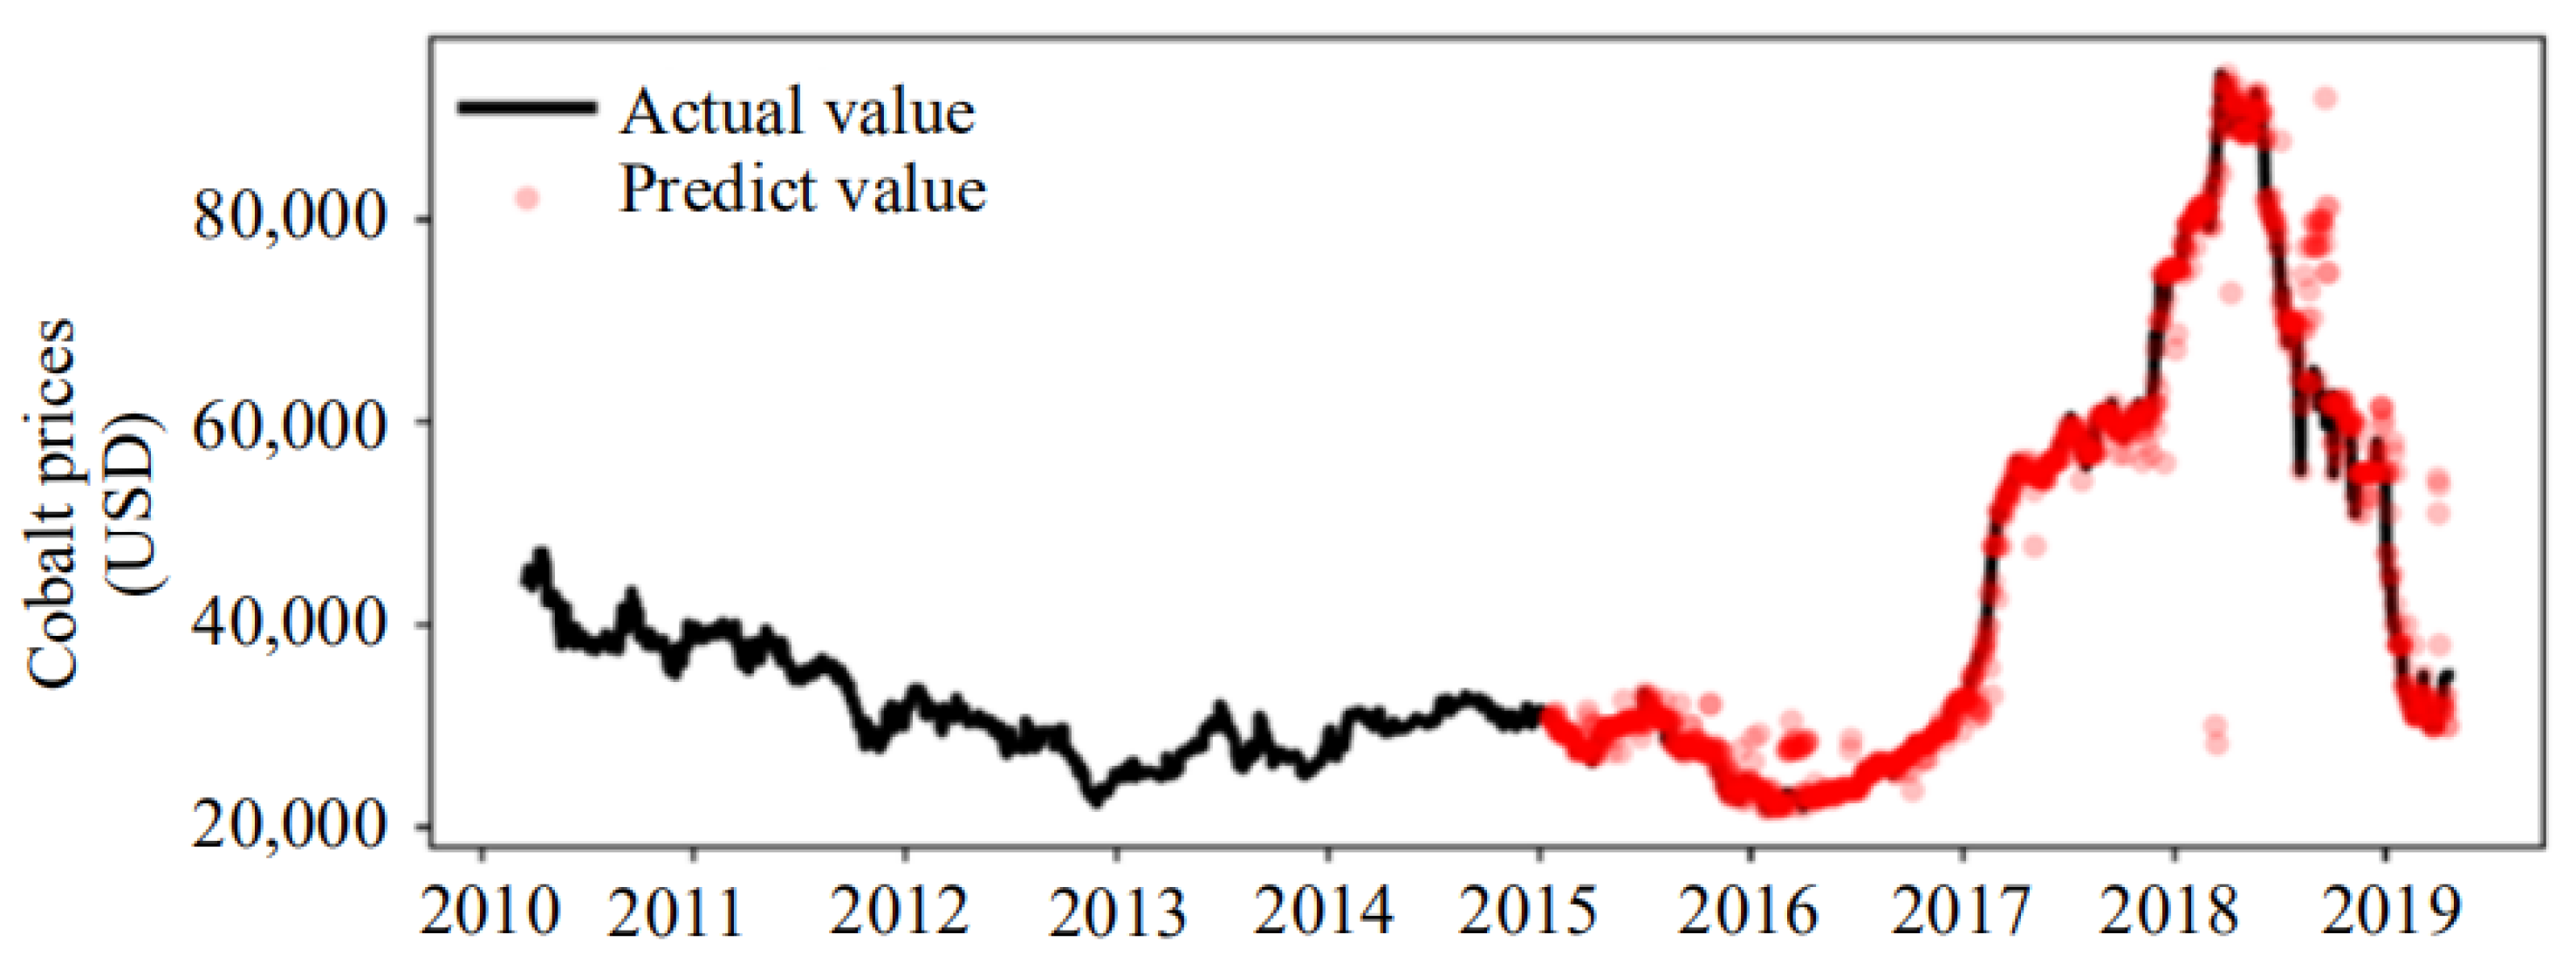
First, the daily prices of copper, nickel, and cobalt during 2010–2019 were obtained from http://www.investing.com (accessed on 10 April 2019). Then, using the actual prices of copper, nickel, and cobalt, as well as other selected impact data from 2010 to 2014, as historical price data, the metal prediction method developed on the basis of decision tree machine learning was used to train the decision tree model, according to historical data sets. The prices of copper, nickel, and cobalt were predicted from 2015 to 2019 (red dots in the figure) and compared with the actual prices of copper, nickel, and cobalt from 2015 to 2019 to observe the feasibility and accuracy of the forecasting methods used. From the comparison of the three graphs in Figure 2, Figure 3 and Figure 4, we can see that the predicted value is in good agreement with the actual value, indicating that the metal prediction method developed on the basis of decision tree machine learning can be used to predict future copper, nickel, and cobalt metal prices.
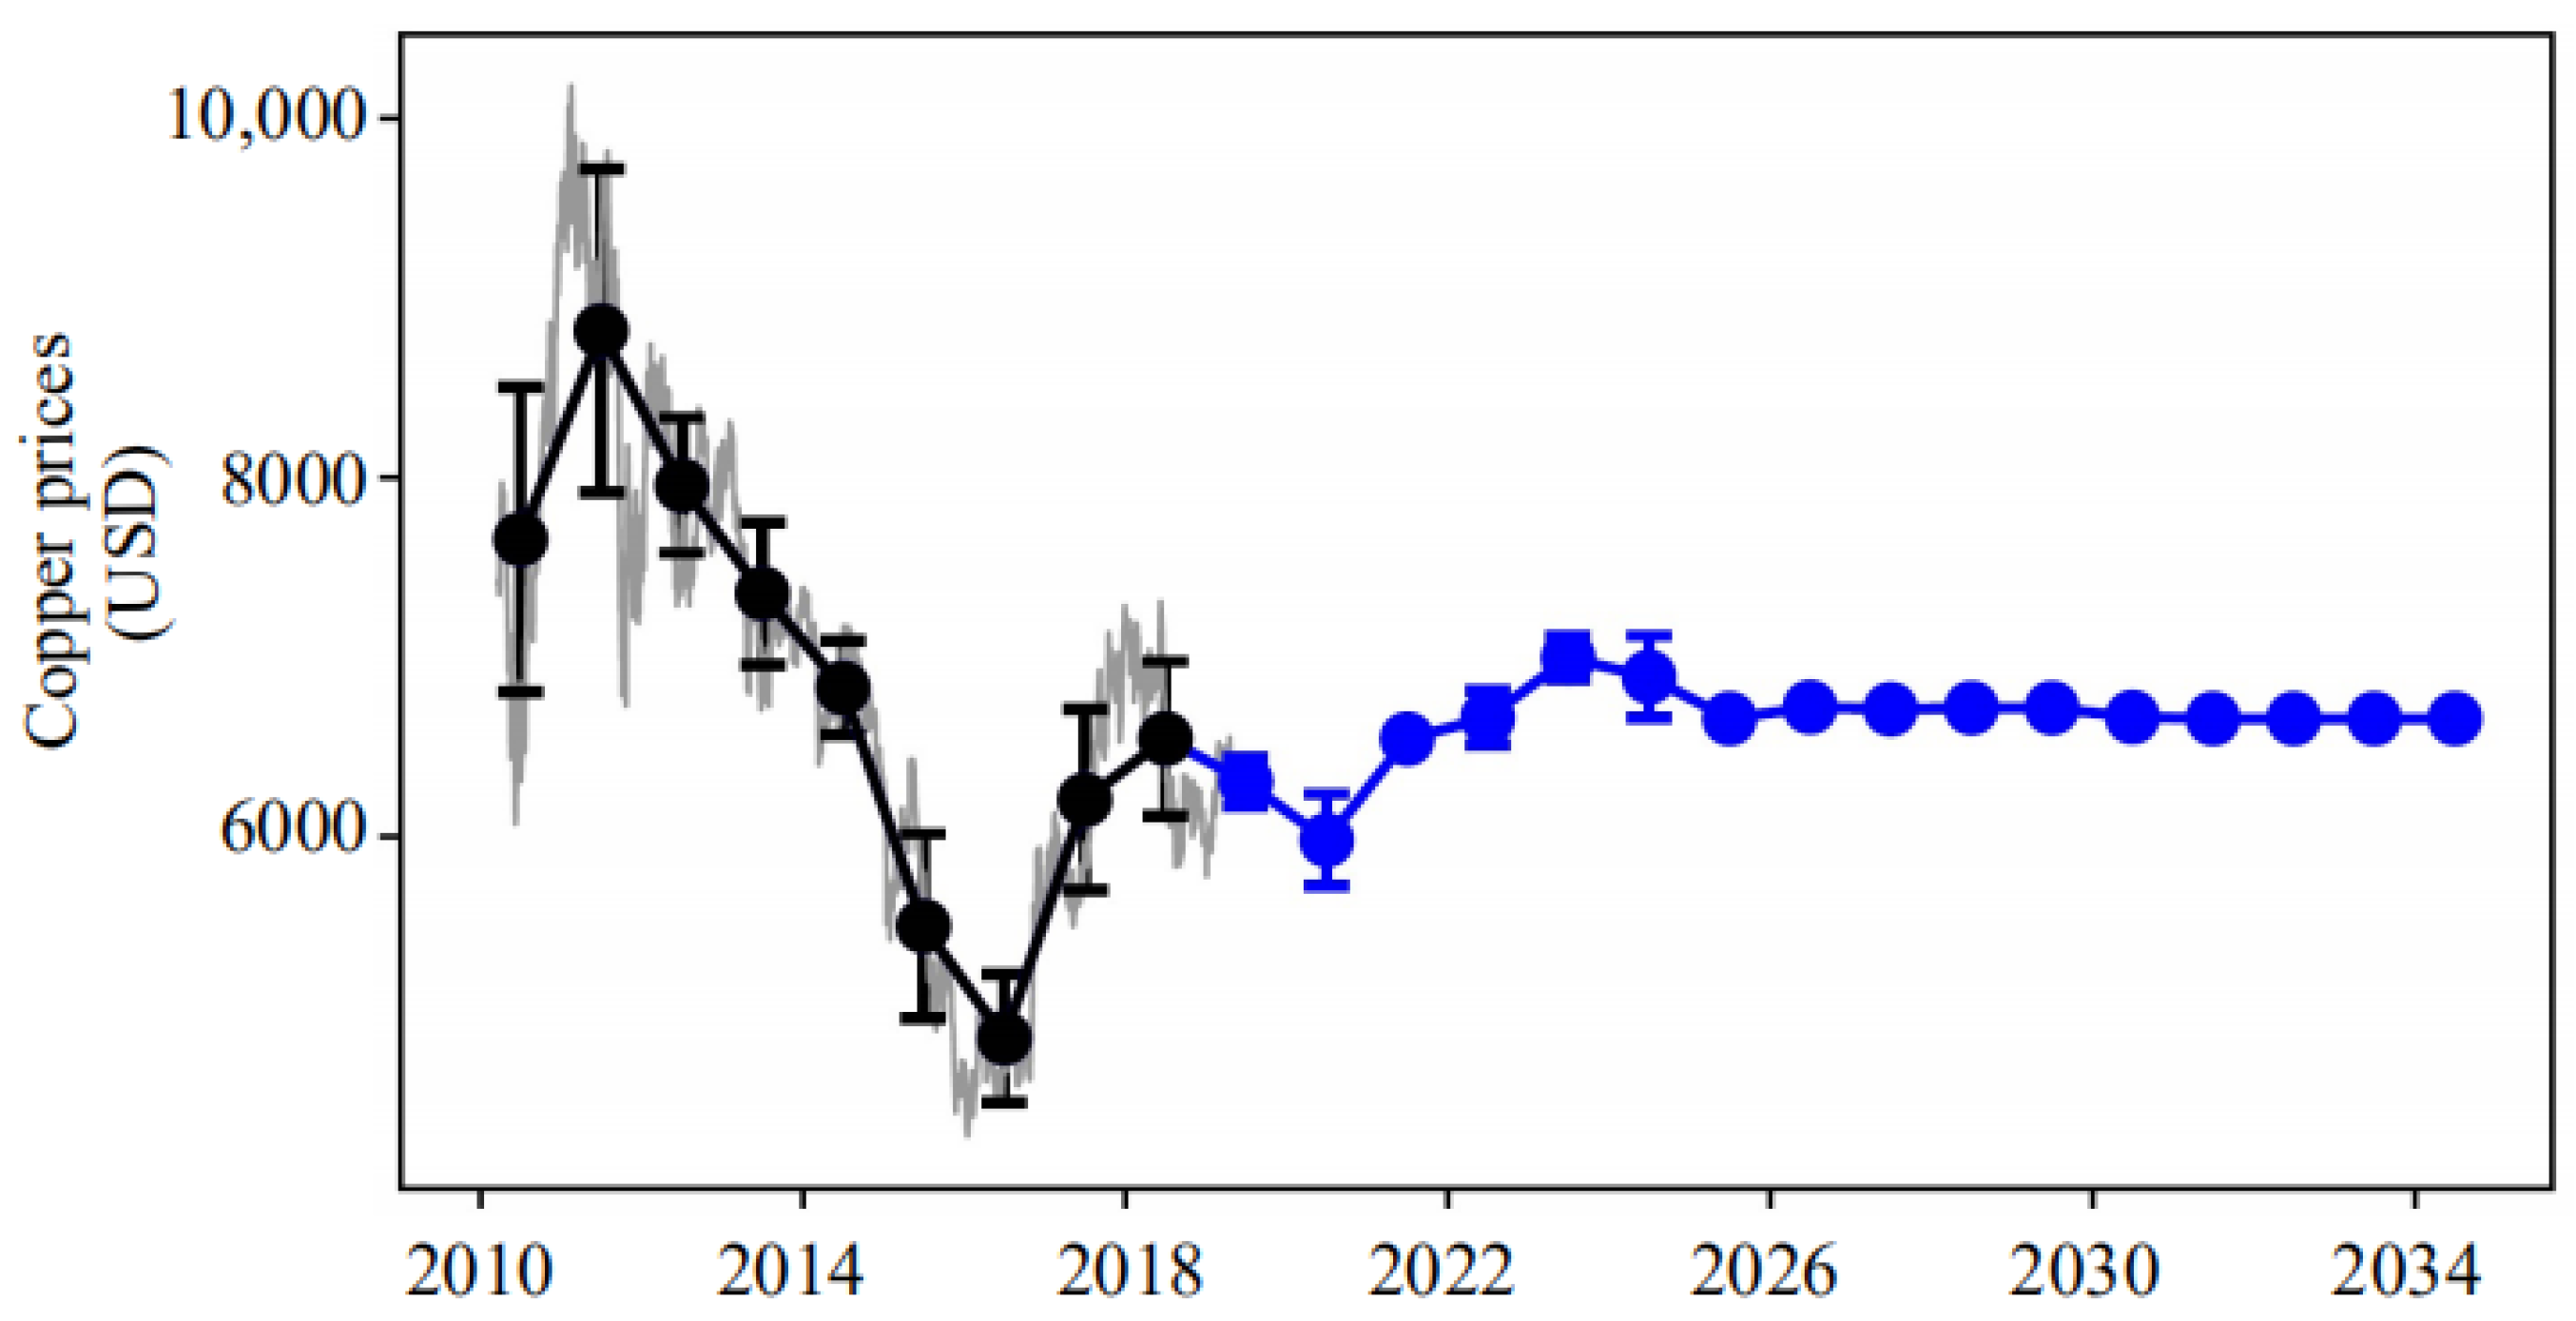
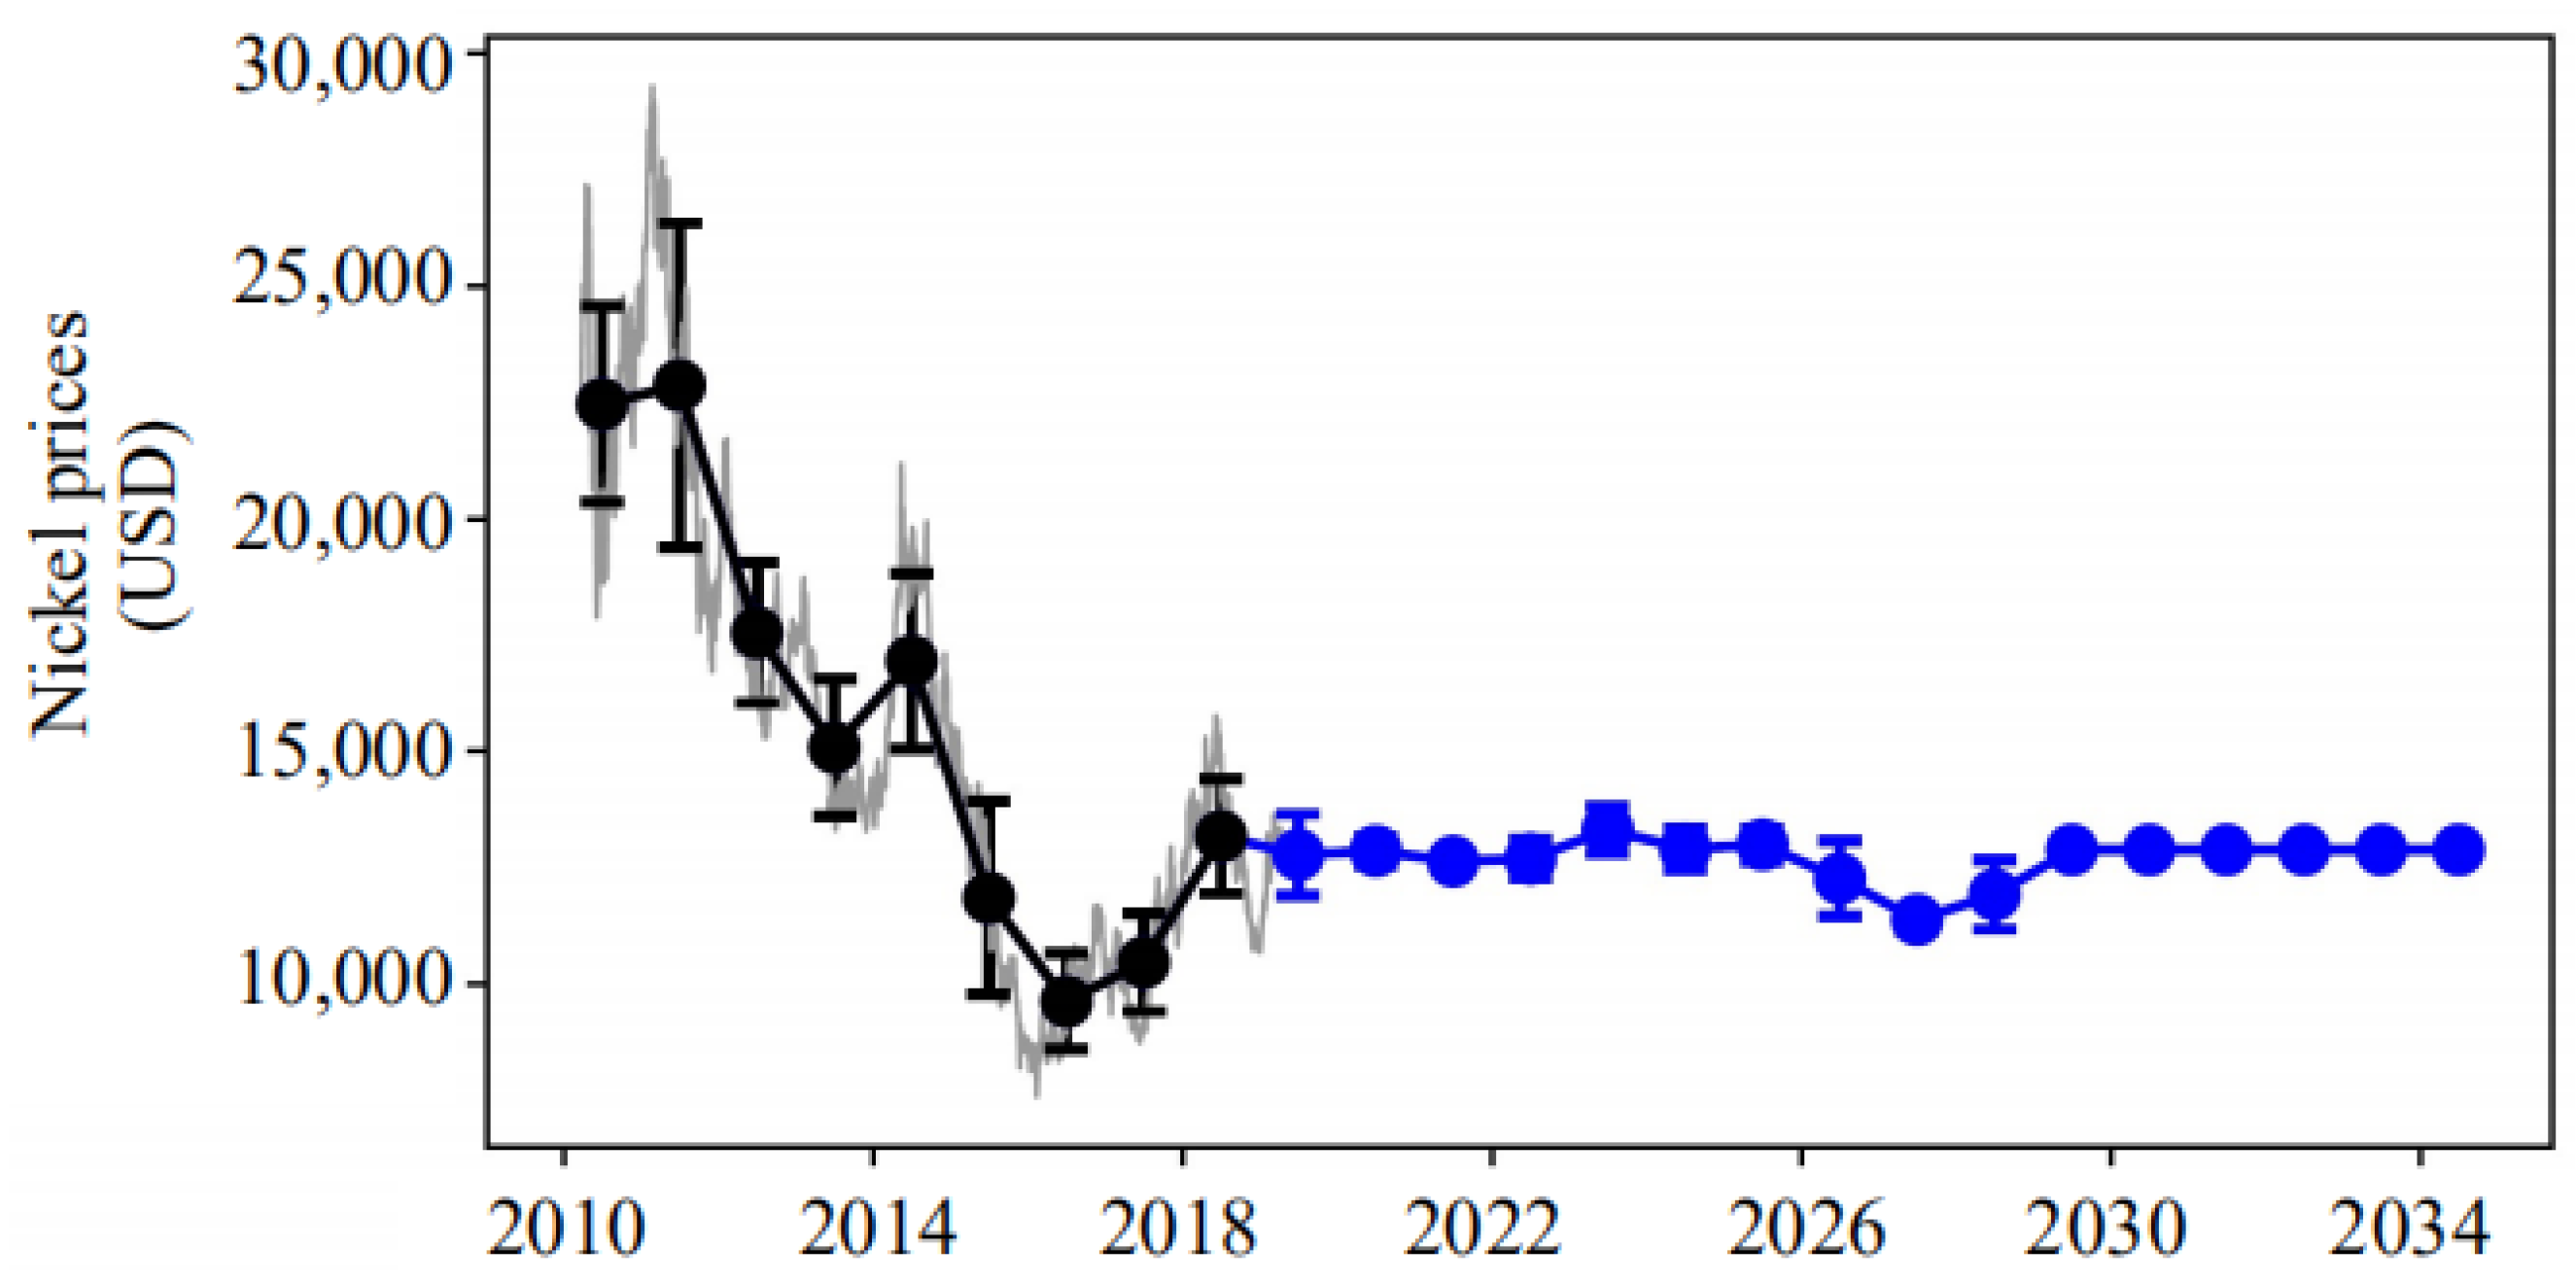
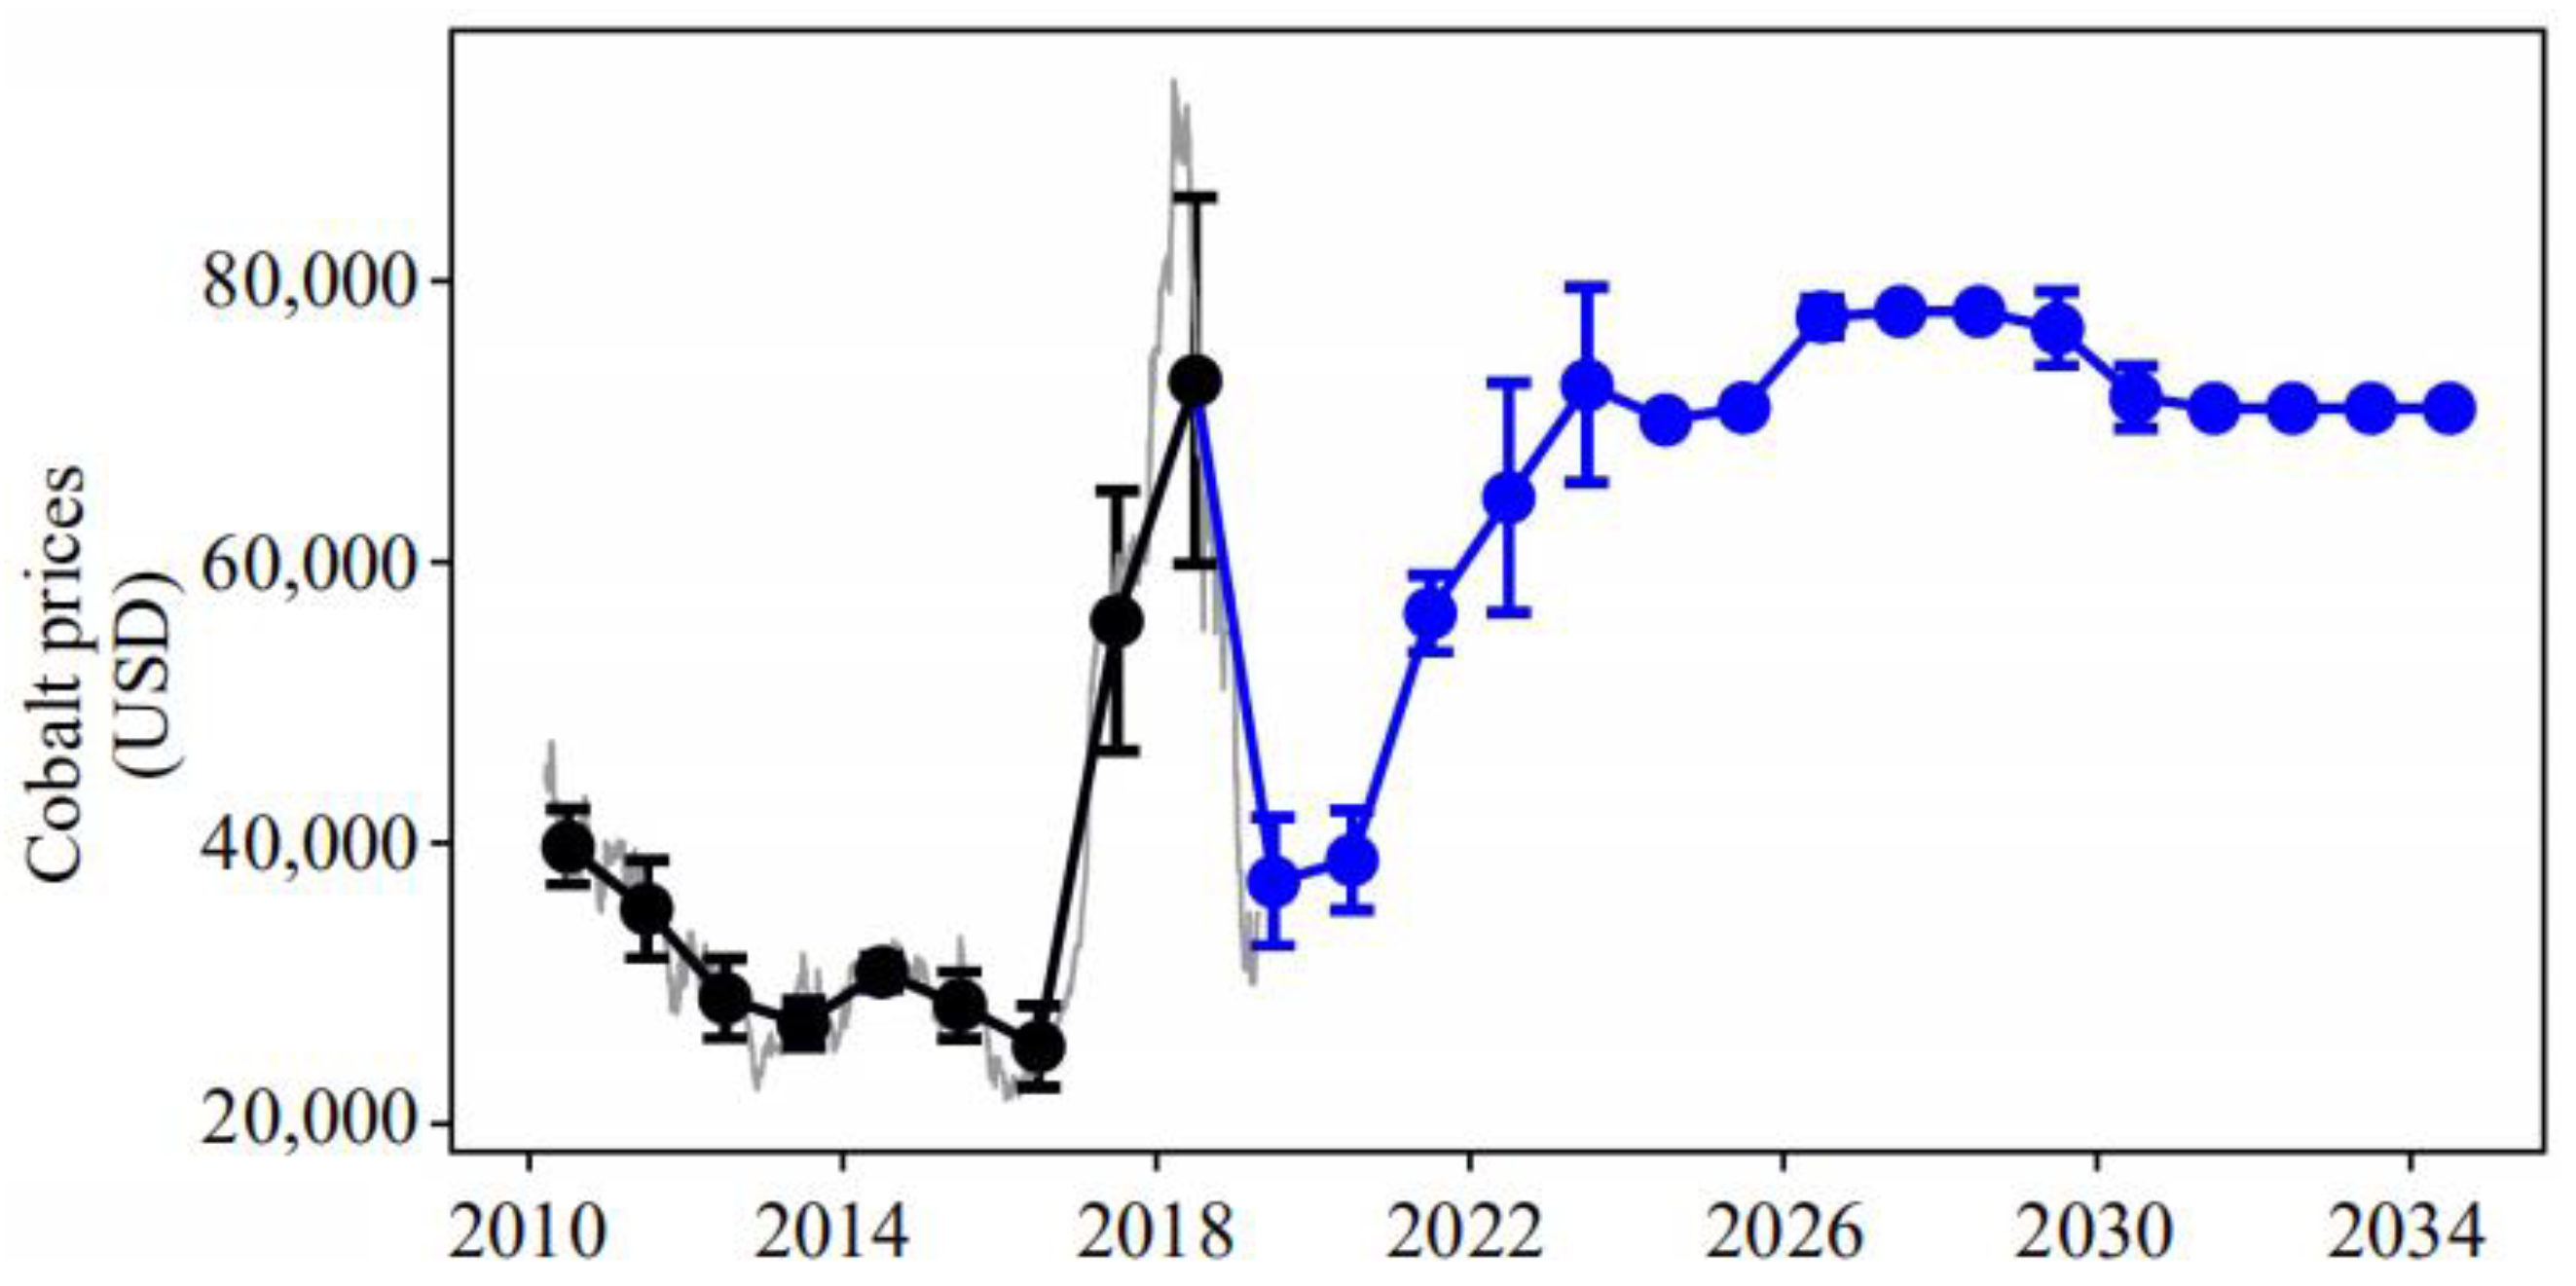
According to the above work, this study took the actual prices of copper, nickel, and cobalt from 2010 to 2018 as the historical data and used the developed price forecasting method to forecast the prices of copper, nickel, and cobalt in the next 16 years from 2019 to 2034. The results are shown in Figure 5, Figure 6 and Figure 7. The annual average prices in the next 16 years are 6635 USD/ton for copper, 12,692 USD/ ton for nickel, and 67,261 USD/ ton for cobalt.
(3) Administrative expenses and taxes in financial model
According to the draft regulations on exploitation of mineral resources in the Area and the actual situation in China, several administrative expenses and taxes, shown in Table 3, were considered in the CSU2019 financial model.
The first four items in Table 4 are the fees to be paid to the ISA, which are mentioned in the draft exploitation regulations, but the amount is not specified. The exploration regulations of the Authority stipulate that the application fee and annual management fee for each exploration contract are 500,000 USD/year and 47,000 USD/year, respectively. Considering that the exploitation contract is far more complex than the exploration contract, it is assumed that the application fee and annual management fee for exploitation contract are 1,000,000 USD/year and 100,000 USD/year, respectively. Annex III of the Convention stipulates that the annual fixed fee is 1,000,000 USD/year, although the implementation agreement stipulates that this provision has been amended and it is no longer applicable; nevertheless, the seminar on the payment system of the Authority suggests that this amount should be considered temporarily. The royalty is the main element of the payment system; thus, it is also a key aspect of the financial model. In this research, it was used as the independent variable of the model to carry out the calculation and research of economic indicators.
The corporate income tax and value-added tax (VAT) are the taxes that the contractor should pay to the sponsoring state. The tax system of each country is different. The corporate income tax rate in China is 25%. Since April 2019, China’s basic VAT rate has been reduced to 13%. According to a consultation with the financial experts of the mining group, in this financial model, VAT after deduction was assumed as 8%.
Environmental protection-related costs will certainly be a cash outflow for the contractor and are still being discussed in the draft regulation. The MIT team considered an environmental protection fund expenditure of 500 million USD per mining area in its financial model [21]. In this financial model, we refer to the practice of Nautilus mining in Canada and consider the annual commercial insurance of 1.5 million USD as the cost of environmental insurance.
The choice of discount rate has a significant impact on economic evaluation metrics such as the net present value. China’s 2017 “benchmark yield reference table of various industries” suggests that the benchmark yield of “strip mining” is 17% and that of “copper smelting” is 13%. The discount rate used in this study was assumed as 15%.
To summarize, a comparison of the modeling method and main parameters of the financial model of Central South University in 2019 with other financial models [10] is shown in Table 5 and Table 6.

4. Sensitivity Analysis

4.1. Sensitivity Analysis

Sensitivity analysis allows evaluating the impact on the economic evaluation metrics of the project when the uncertain factors of the polymetallic nodule development project change, as well as calculating the sensitivity coefficient and critical point to identify the sensitive factors and determine their impact degree. By changing the assumptions and parameters of the model, we can get the impact of different factors on the project revenue. In order to identify the key sensitive factors, single-factor sensitivity analysis is usually carried out.
The sensitivity coefficient refers to the ratio of the change percentage of project evaluation metrics to the change percentage of uncertain factors [22]. It can be calculated as follows:
S A F = Δ A / A Δ F / F
where SAF is the sensitivity coefficient of evaluation metric A to uncertain factors F, Δ F / F is the change rate of uncertainty F, and Δ A / A is the change rate of metric A.
S A F > 0 means that the evaluation metric changes in the same direction as the uncertain factors; S A F < 0 indicates that the evaluation metric changes in the opposite direction to the uncertain factors. The sensitivity coefficient is higher when the value of | S A F | is larger.

4.2. Sensitivity Analysis Results

In this study, we selected the annual capacity, operating expense, capital expenditure, royalty rate, metal price, and metal grade of the COMRA project as the analysis variables, and we took the CSU2019 model in Table 4 and Table 5 as the basic data. The rate of change was studied from −30% to 30% with an interval of 10%. The sensitivity of each variable was investigated. The calculation results of the sensitivity coefficient and sensitivity ranking are shown in Table 7.
It can be seen that the annual ore output is most sensitive. In the actual development process, having the equipment and a mining area that meet the design production capacity and maintaining stable production are the basic conditions to ensure the benefit of the project. In addition, although the market price of manganese is far lower than that of cobalt, nickel and copper, its grade is far higher than that of these three metals; thus, the impact of manganese grade and price on the economic metrics of the project is still far higher than that of the other three metals.

4.3. Risk Analysis Based on Monte Carlo Method

The deep-sea polymetallic nodule mining project has the characteristics of a long implementation period, large investment, and irreversibility. At the same time, the attributes of the production object (ore body) are complex and changeable, and the current polymetallic nodule development technology itself also has a variety of uncertainties. These characteristics make the project investment and exploration work arrangement affected by many uncertain factors. These uncertain factors are random in a certain range, and the probability of various changes is not the same.
On the basis of the above sensitivity analysis, this paper studied the probability distribution of some risk variables (annual ore output, metal grade, metal price, annual operating cost, and fixed investment) with a greater impact on the mining project and analyzed the probability distribution type, confidence interval, and confidence degree. In this study, triangular distribution was used to establish a probability distribution model of risk variables. The distribution of risk variables is shown in Table 8. Then, the function of IRR was established with these five factors as variables. The Monte Carlo simulation method was used for risk analysis of the deep-sea polymetallic nodule mining project [23].

5. Analysis of the Advantages and Disadvantages of Different Payment Mechanisms

This study used the CSU2019 financial model and economic evaluation analysis software, taking the COMRA project as the background, to calculate and analyze the impact of different payment systems and royalty rates on the project economic metrics and ISA revenue, as well as discussed the reasonable payment systems and royalty rates.

5.1. Analysis of the Fixed Ad Valorem—One Stage Payment Mechanism

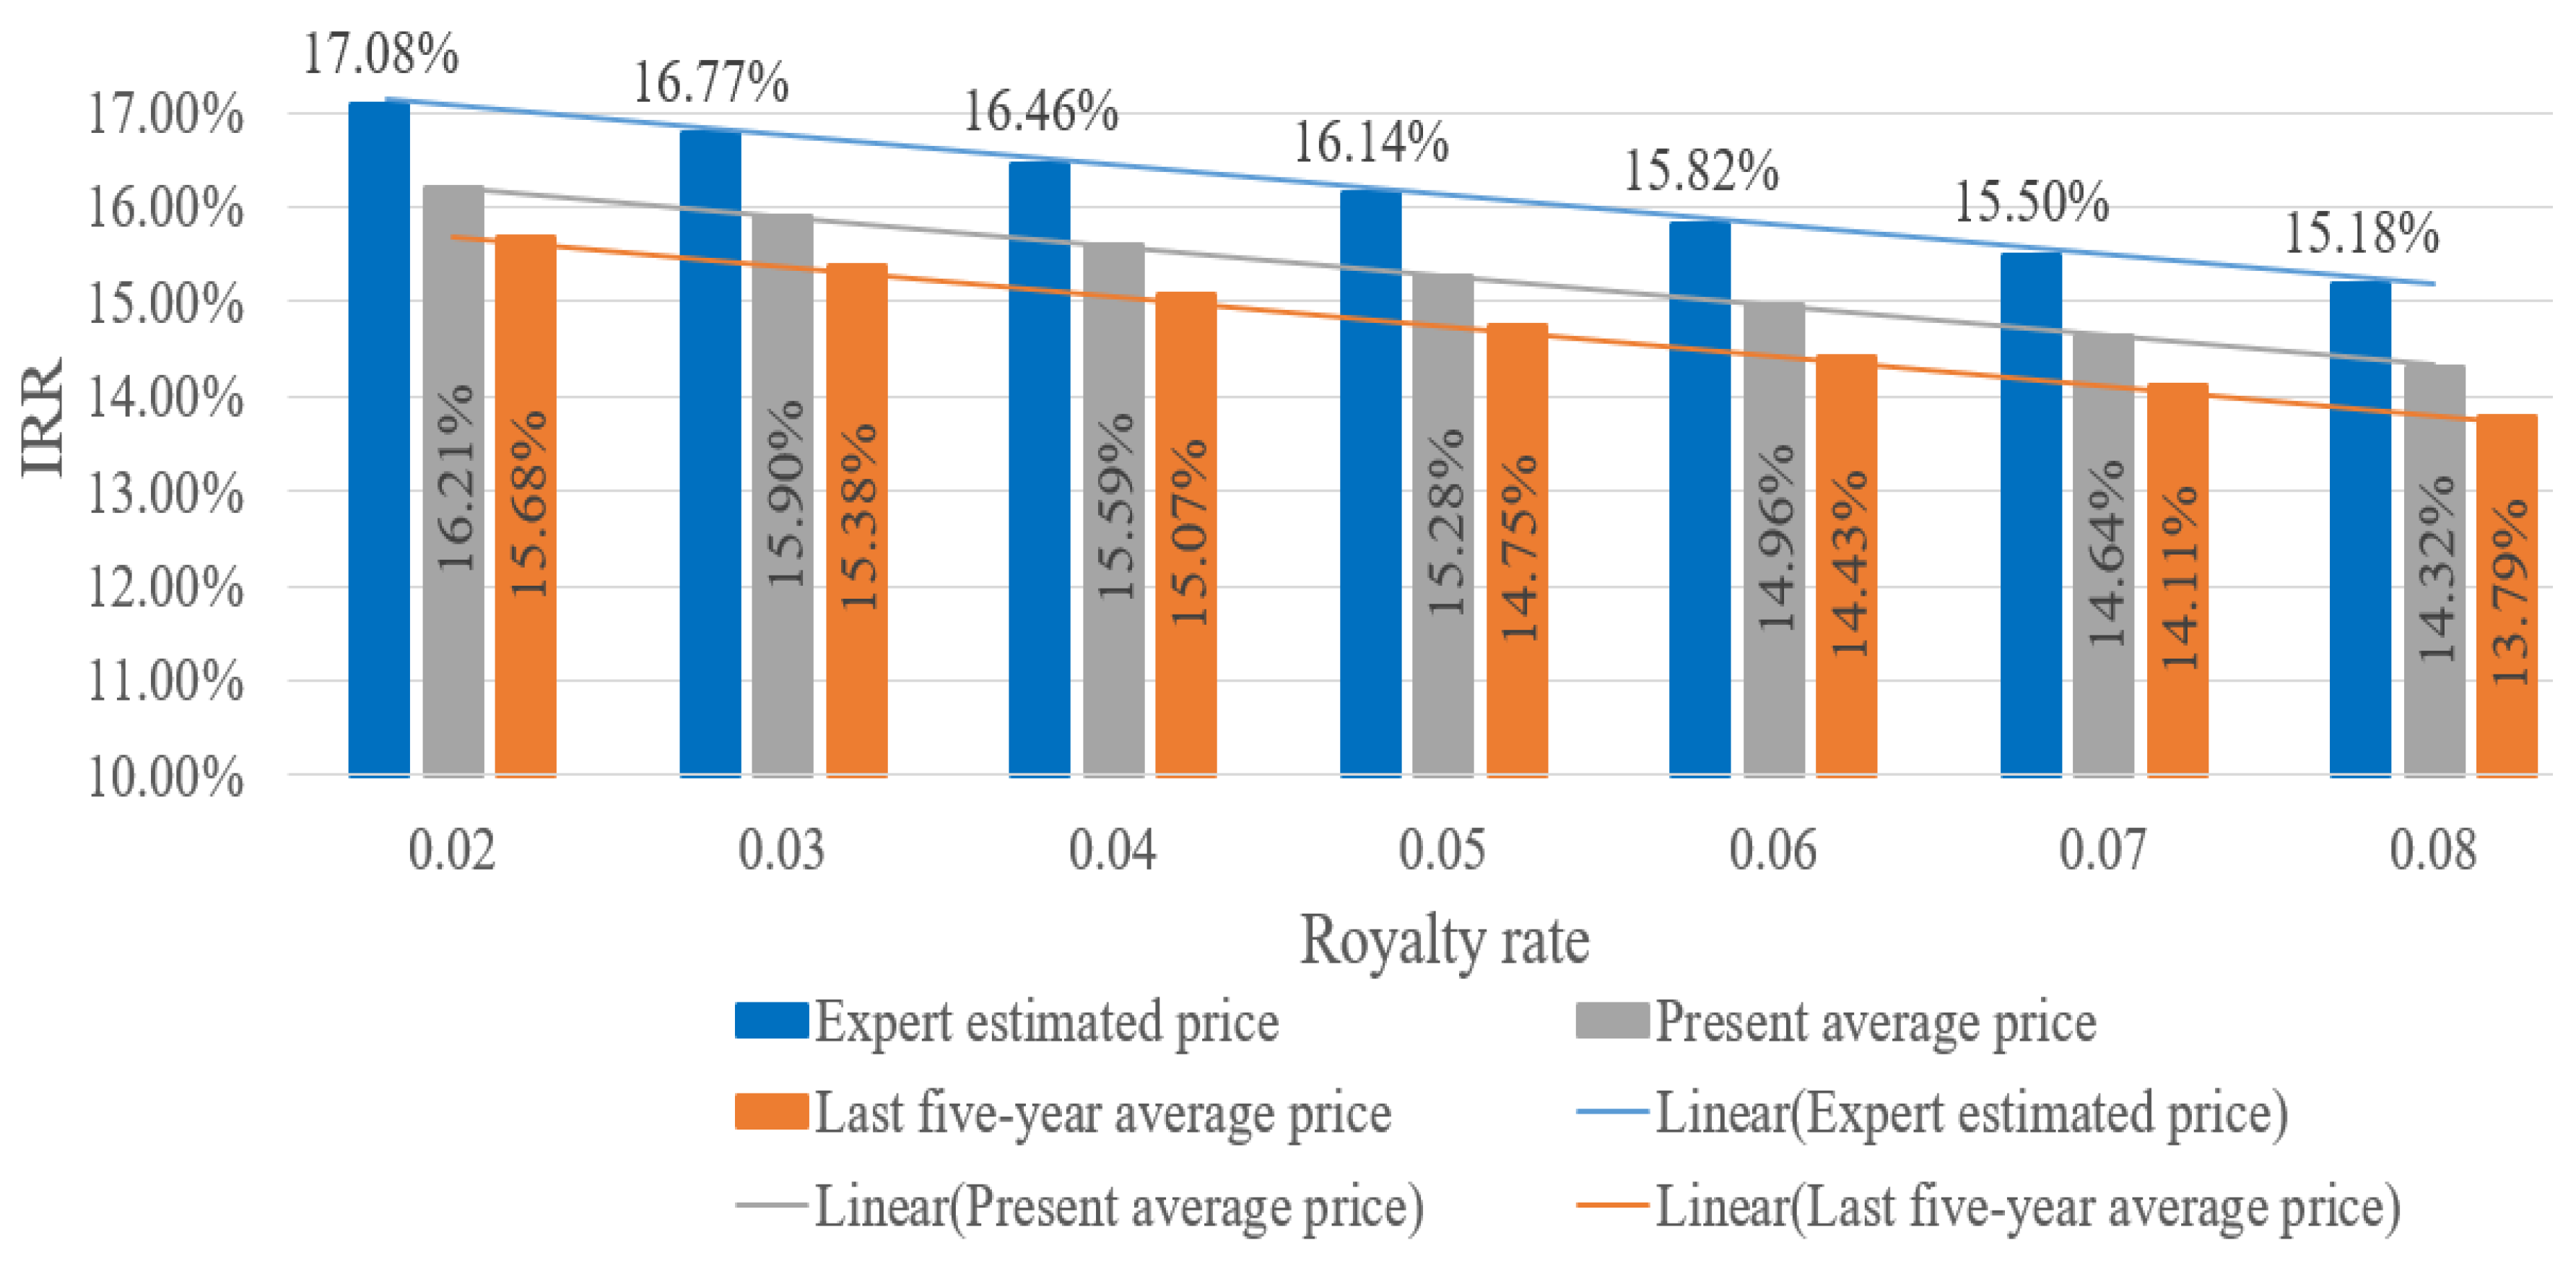
The metal grade of polymetallic nodules is relatively clear and basically stable, but the prices of the four metals are always changing, which will inevitably lead to a change in project evaluation metrics. Therefore, three sets of metal prices, as shown in Table 9, were discussed in the study. The royalty rate was changed from 2% to 8%. Figure 8 shows that the royalty rate has a great impact on the economic evaluation metric. According to the average price of the last 5 years, when the ad valorem royalty rate is equal to 4%, IRR would fall to 15.07%. If 15% is the threshold value of IRR, the fixed ad valorem royalty rate should not exceed 4% according to the average price of the last 5 years.

5.2. Analysis of the Fixed Ad Valorem—Two Stage Payment Mechanism

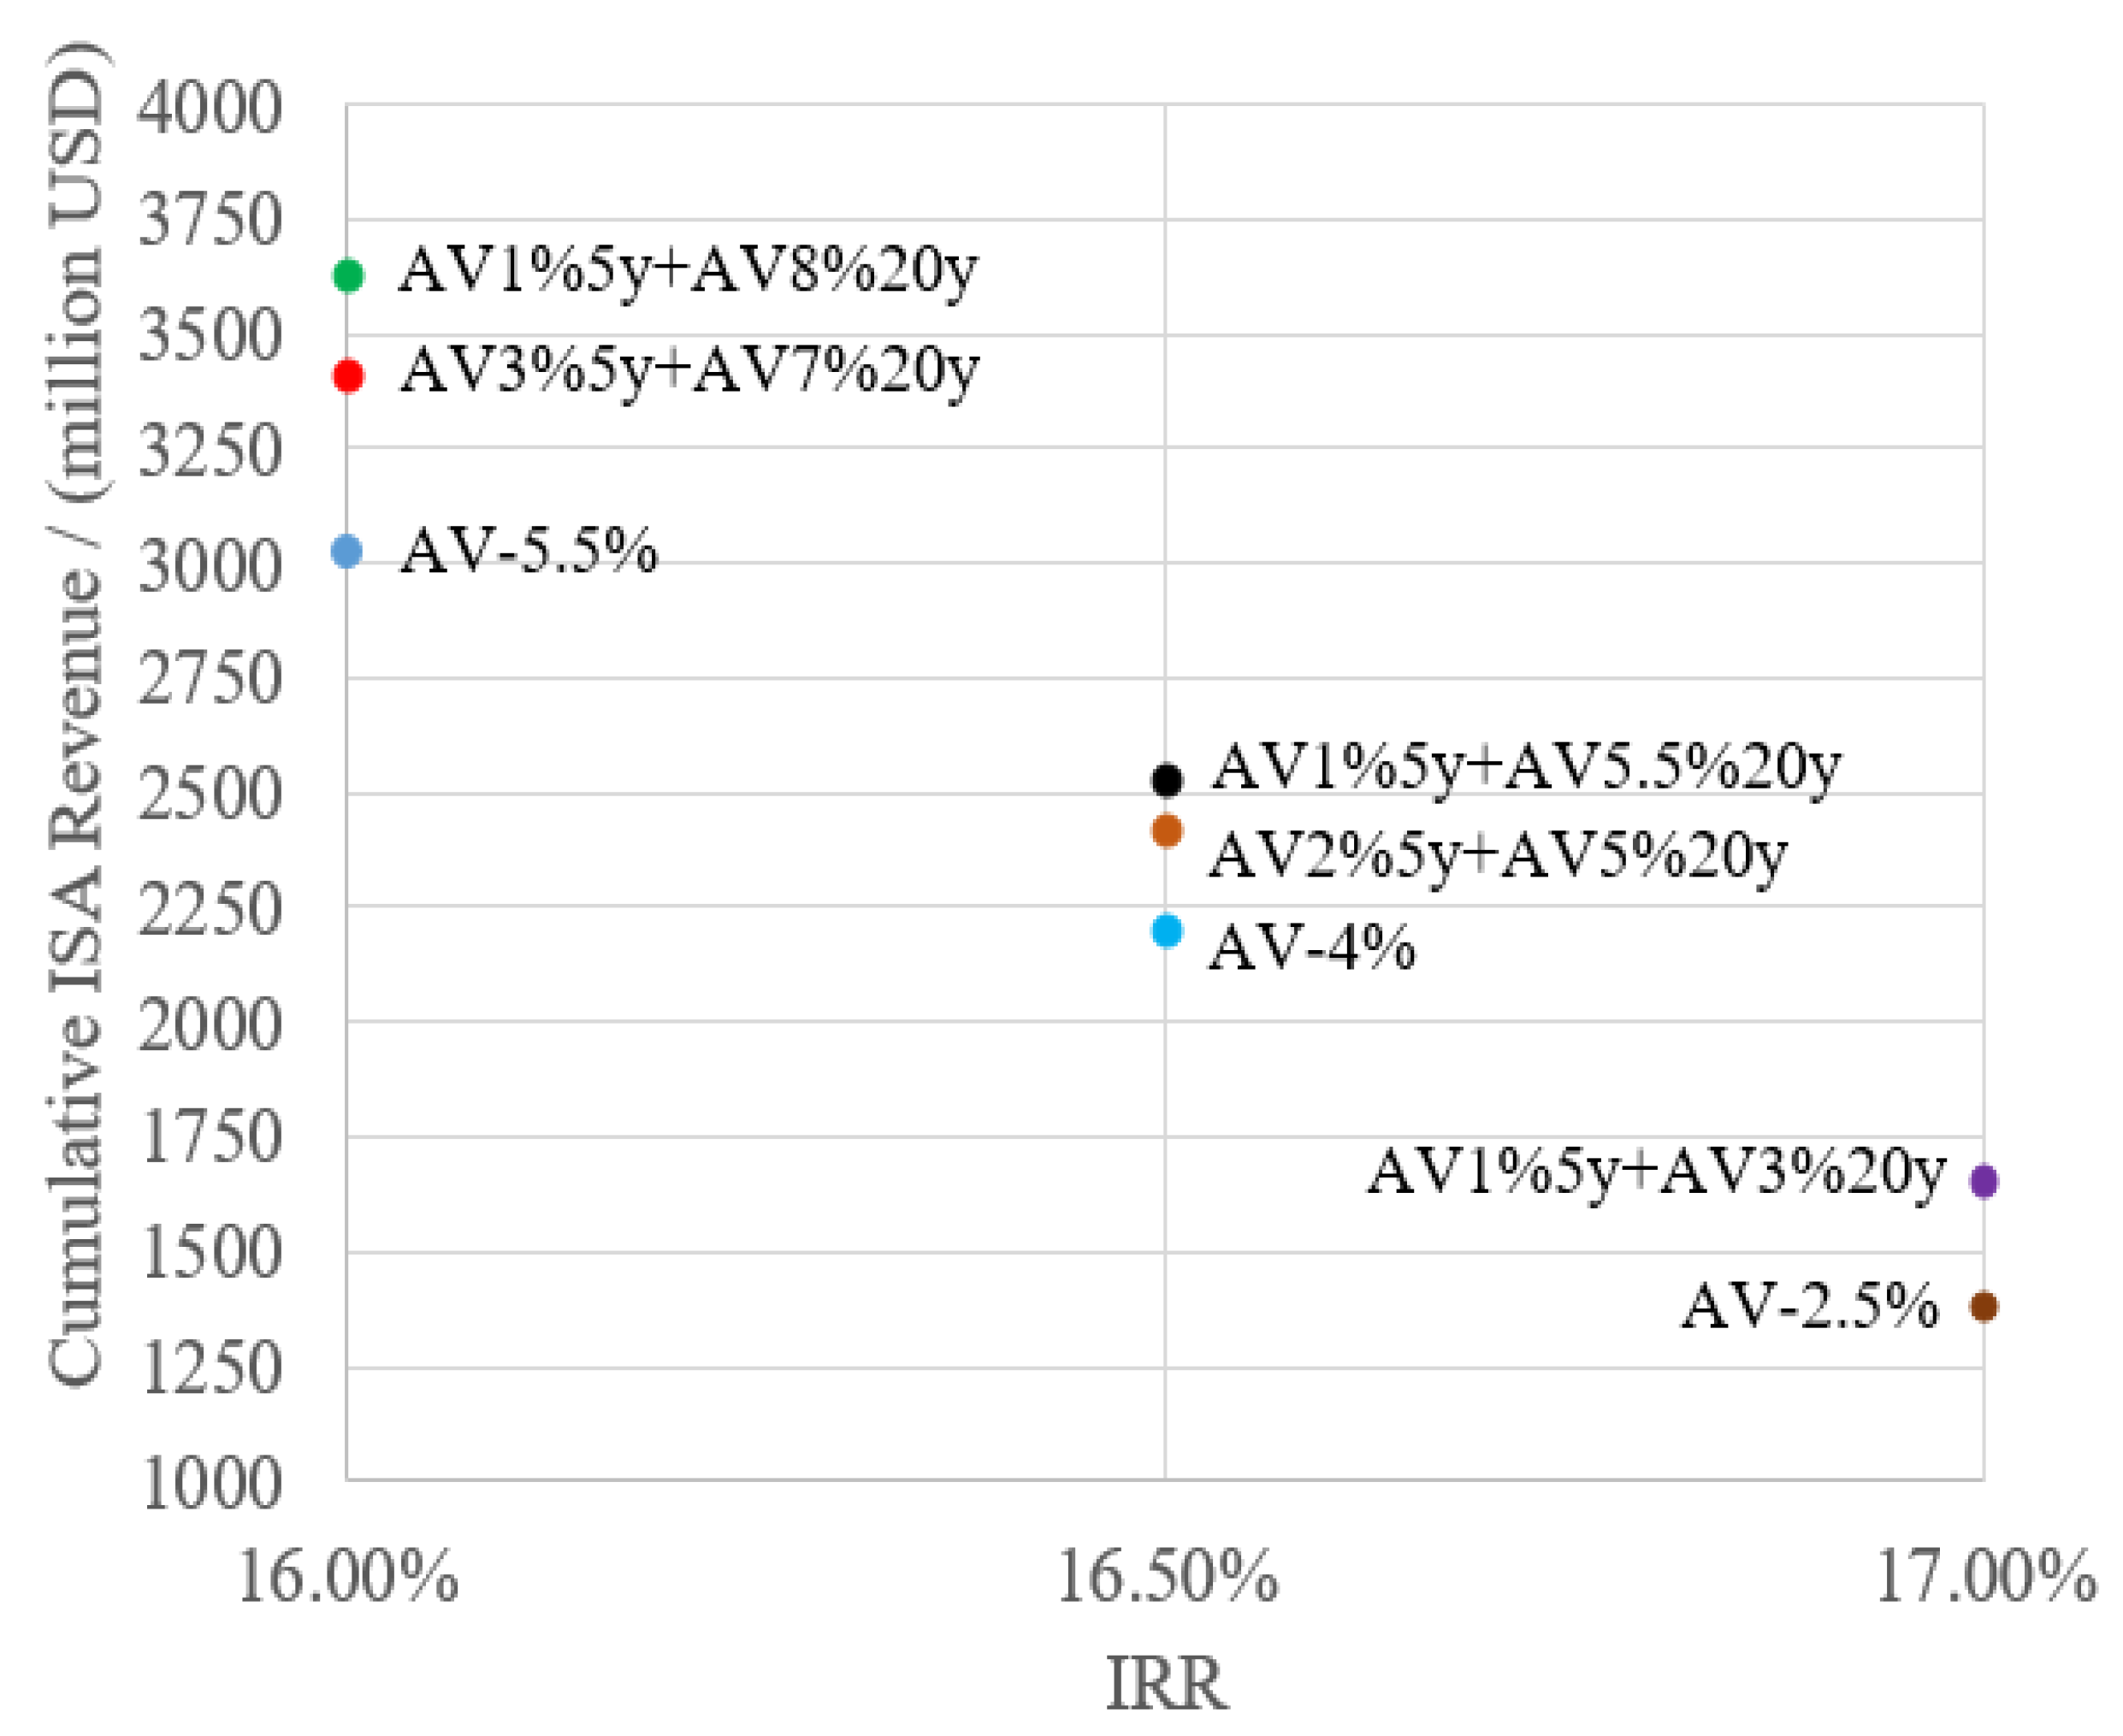
The fixed ad valorem—two stage is proposed for the purpose of reducing the economic burden of the contractor in the early stage of commercial production. The fixed ad valorem rates are given in two stages. Considering the COMRA project, this study used the established financial model to calculate the economic indicators of the project with different fixed ad valorem rates and compared the results with fixed ad valorem—one stage. The specific conditions were as follows: the three targets of internal rate of return (IRR) were 16%, 16.5% and 17%; the first stage (initial stage of commercial production) was 5 years, and the second stage (stable production) was 20 years. According to the above assumptions and the basic data of the CSU2019 financial model in Table 5 and Table 6, the results are shown in Table 10. In order to intuitively observe and compare the economic metrics under different payment systems, a scatter diagram was generated, as shown in Figure 9.
It can be seen from Table 10 and Figure 9 that, when the IRR is the same, the cumulative ISA revenue of the fixed ad valorem—two stage is higher than that of the fixed ad valorem—one stage; when the IRR is the same, if the fixed ad valorem rate in the second stage is higher, the cumulative ISA revenue is accordingly higher.

5.3. Analysis of the Blended Profit—Two Stage Payment Mechanism

The adoption of the ad valorem system would bring revenue to ISA as long as the minerals in the Area are mined and sold, which is obviously in line with the wishes of the Authority, while the royalty is paid according to the profits from investment and production, which is beneficial for the contractor to reduce costs and economic risks in the early stage of commercial production. It can be inferred that, if blended profit and fixed ad valorem is adopted, both the Authority’s and the contractor’s demands can be accommodated to a certain extent.
Similar to the previous research method, under the background of the COMRA project, we chose the appropriate ad valorem rate and profit-based rate to form a number of payment schemes, taking into account the interests of both the Authority and the contractor. The specific setting conditions were as follows: the three targets of internal rate of return (IRR) were 16%, 16.5%, and 17%; the first stage was 5 years long and the second stage was 20 years long. In the first stage, fixed ad valorem was adopted, whereas blended profit and fixed ad valorem was adopted in the second stage. The results of blended profit—two stage were compared with those of fixed ad valorem—one stage. According to the basic data of the CSU2019 financial model in Table 5 and Table 6, the results are shown in Table 11.
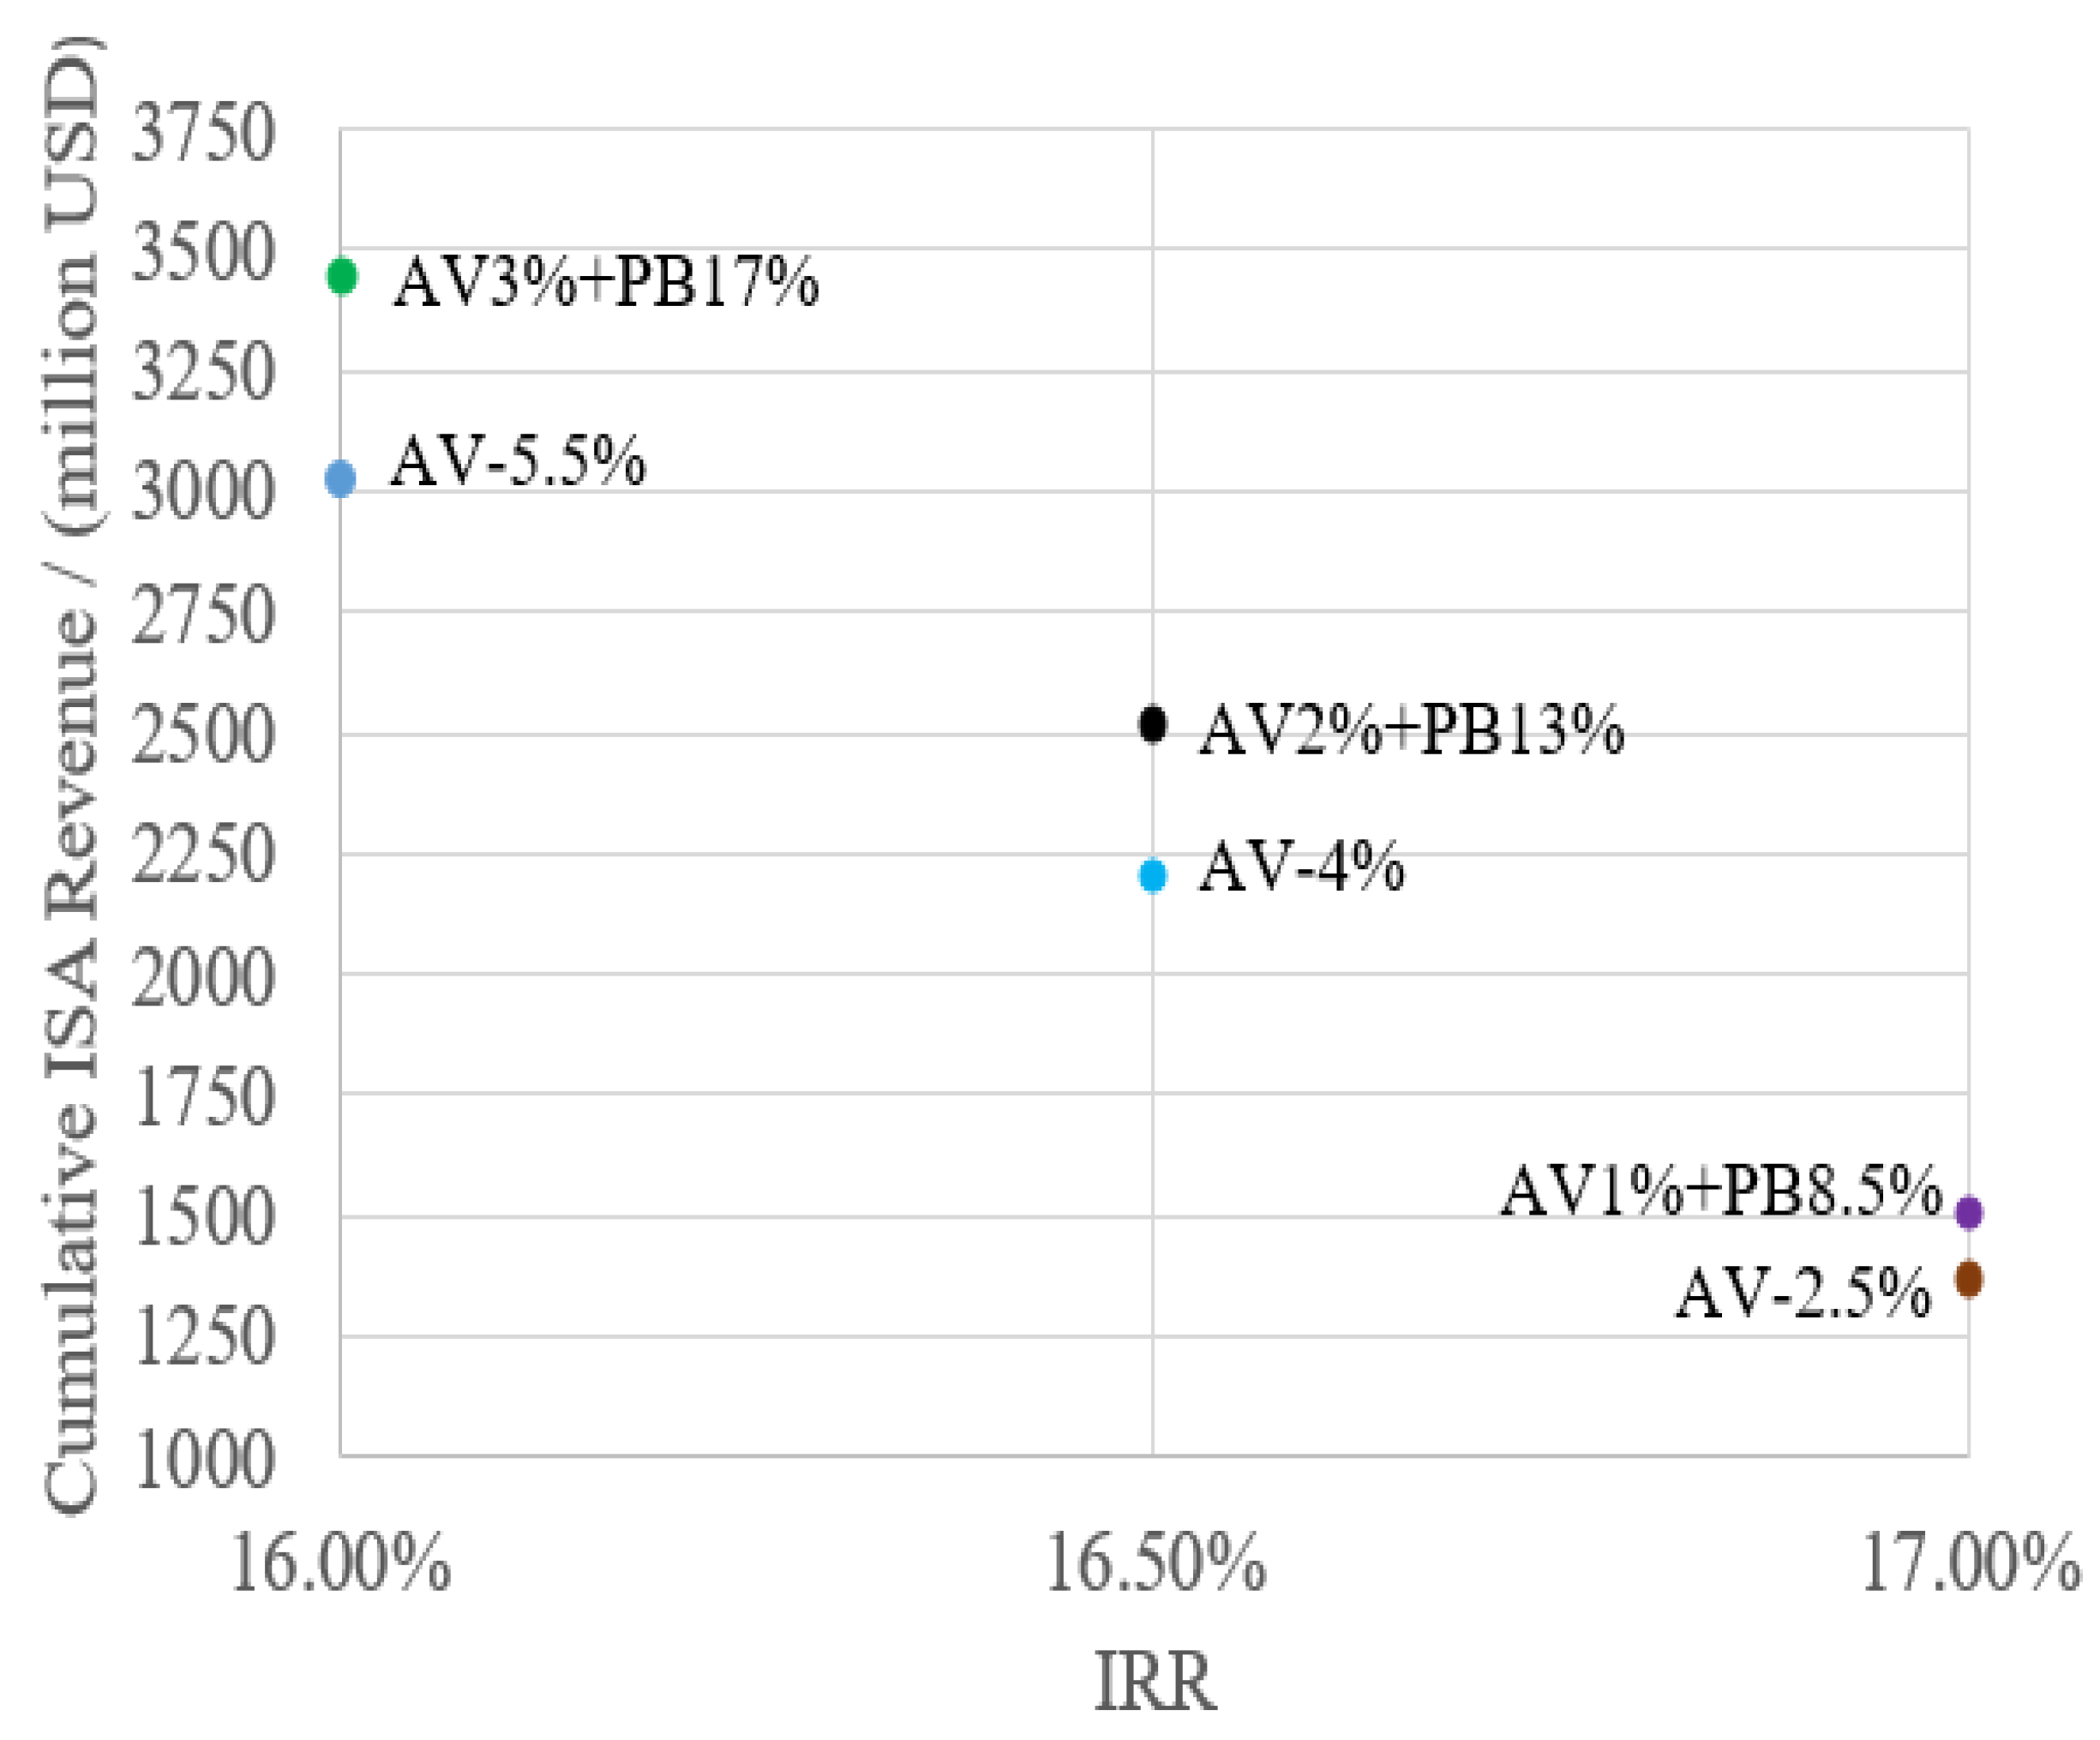
Similarly, the data in Table 11 were plotted as a scatter diagram in which the symbol AV represents ad valorem and PB represents profit-based royalty.
It can be seen from Table 11 and Figure 10 that, when the two schemes have the same IRR, the cumulative ISA revenue under the ad valorem (AV) + ad valorem (PB) scheme is always higher than that under the ad valorem only scheme.

5.4. Analysis of the Advantages and Disadvantages of Different Payment Mechanisms

5.4.1. Risk Analysis of Three Payment Mechanisms

As mentioned in Section 4.3, there are certain risks in the project. A risk analysis of various payment mechanisms was carried out. In this paper, the payment mechanisms with an IRR of 16.5%, namely, AV4%, AV1%5y + AV5.5%20y, and AV2% + Pb13%, were selected as a case study.
The risk variables are shown in Table 8, and 2000 random sampling simulation calculations were carried out. The hurdle rate, which is the minimum rate of return on capital required by investors, was assumed to be 15% in this study. The distribution frequency histogram and cumulative probability distribution diagram of IRR were obtained, as shown in Figure 11. The maximum and minimum values of IRR in risk analysis are shown in Table 12.
If the IRR is greater than the hurdle rate, the project is considered acceptable; otherwise, the project is rejected. It can be seen from Table 12 that the minimum IRR values of the projects are all less than the hurdle rate; thus, the projects have risks. It can be concluded from Figure 11 that the project investment risk is about 56% when the AV4% payment scheme is adopted, 50% when the AV1%5y + AV5.5%20y payment scheme is adopted, and 39% when the AV2% + Pb13% payment scheme is adopted.

5.4.2. The Advantages and Disadvantages of Different Payment Mechanisms

Here, a qualitative analysis and a comparison were carried out for the ad valorem royalty and the blended profit and fixed ad valorem royalty schemes in exploitation regulations.
The ad valorem royalty was calculated and levied according to the value of minerals. Obviously, it responds to the market situation, can change with the fluctuation of mineral market price, and can ensure the revenue of the Authority when the metal price rises.
The blended profit and fixed ad valorem payment system is a mechanism that adopts a lower ad valorem payment in the early stage of commercial development and adopts a blended profit and fixed ad valorem scheme in the later stage. Although it may increase the complexity of management and administrative costs, the profit of contractors can be considered. It is beneficial for the contractor to reduce the loss when the ore quality is poor and the production cost is high. In the early stage of commercial development, contractors and investors will face higher risks, which come from unknown technology, the cost of high-tech development, the lack of mature commercial viability, higher capital cost, etc. Therefore, the combination of ad valorem and profit at an early stage can reduce the cost of the contractor as much as possible (royalty is also a kind of cost), so as to reduce the risk of the contractor to a certain extent, thereby encouraging the contractor and investors to explore new technologies and invest in commercial development activities. As for the ISA, although, in the early stage, it bears certain risks with the contractors and the revenue for the ISA is low, in the later stage, the ISA can share profits with the contractors to obtain higher revenue as compensation for the risk in the early stage, thus guaranteeing cumulative revenue. This blended payment system not only reduces the risk of project development, but also guarantees the benefits of contractors and ISA. According to the above analysis results, a table a compiled, as shown in Table 13.
Obviously, there are advantages and disadvantages when using any payment system. If only the ad valorem payment system is selected, it is not conducive to promoting the development of mineral resources in the Area.
  • The ad valorem payment system is not conducive to the promotion of Area mineral resources development technology. Because of the uncertainty of mining technology and mining environment, the contractors have to pay more for the development of new resources. However, ad valorem does not have the function of ensuring the contractor to obtain the basic profit; thus, it will affect the investment of investors in development activities and technological innovation, and it is not conducive to the development and technological progress of Area mineral resources development.
  • The blended profit and fixed ad valorem payment system will not greatly increase the complexity of the payment system. Van Nijen pointed out that sources for obtaining contractor mining costs might include ISA recommendations, wherein rules for allowable cost are set out, or through costs reported by contractors for income tax payments to their sponsoring states [7]. In the draft regulation, the contractor is required to submit detailed reports on the mineral output, sales of ore, capital expenditure, and operating costs in mining activities in accordance with international accounting standards, and a strict inspection and audit system (rule 38) is stipulated. Therefore, it is feasible to obtain the production costs and income of the contractor through the above links and then calculate the profits. Moreover, the contractor not only needs to pay the royalty to the Authority, but also needs to pay the corporate income tax according to the profit to the country to which it belongs. In other words, the contractor’s profit is clear. Moreover, even for the Authority, the “owner of mineral resources”, the adoption of ad valorem has its own defects. For example, when the production cost decreases due to technological progress, the ad valorem payment system will not generate more benefits for the Authority; that is to say, other member states cannot share the benefits brought by technological progress.

6. Analysis of the Impact of Polymetallic Nodule Resources Development on Metal Market

Assuming that the annual production capacity of polymetallic nodules in a single exploitation contract is three million tons, the metal content is the average for CCZ nodules, and the recovery rates are within typical values, the proportion of metal production in the Area to land-based production is given in Table 14 [24].
The prediction of metal price in the economic evaluation analysis was based on the current land mining production conditions. It is clear that some metals in the deep-sea mineral resources may have a significant impact when related to the current market demand or land mining production, especially manganese and cobalt.

6.1. Manganese Market

The global production of manganese in 2018 was about 18.9 million tons. When calculating according to three million tons of polymetallic nodules per year in one mining area, the annual output of manganese in a single mining area is 730,000 tons. Assuming that 10 mining areas are simultaneously mined, manganese metal production can reach 7.3 million tons, accounting for about 38.6% of the global manganese market supply. Such structural changes in market supply and demand can lead to changes in metal prices that can be difficult to predict mathematically. It is very unlikely that the industry could consume such high amounts of manganese. If the consumption of manganese increases by a few percent per year, shortages may arise by 2030. Even then, the production of about 18 million tons of polymetallic nodules (5–6 exploitation exploration contracts) after 2030 will most likely be sufficient. Scenarios in which any deficit in manganese supply cannot be covered by land-based mining are possible but difficult to define and predict.
In addition, each ton of EMM consumes 7000 kWh. When calculating according to the annual output of three million tons, the annual electricity consumption is 5.1 billion kWh. At present, the installed capacity of China’s medium-sized thermal power station is 1000 MW, with 35% loss, and the annual generating capacity is 5.694 billion kWh. The annual electricity consumption of electrolytic manganese in a mining area is almost equal to the annual power generation of a medium-sized thermal power station, and the energy consumption is too large.
EMM is clearly not suitable as the sole product, and it is necessary to consider silicon–manganese alloy and manganese-rich slag as products or in various product forms.

6.2. Cobalt Market

The global supply of cobalt in 2018 was about 146,000 tons. The production of cobalt metal from a single mining area (calculated for an annual output of three million tons of polymetallic nodules, 0.22% cobalt grade, and 83% smelting recovery rate) can reach 5500 tons, accounting for 3.75% of the global market supply. Assuming that 10 mining areas are simultaneously mined, cobalt metal production can reach 55,000 tons, accounting for about 37.5% of the global market supply.
There are, however, predictions that the demand for cobalt may increase strongly within the next couple of years, mainly due to the expected production of Nickel-Manganese-Cobalt (NMC)batteries. In such a situation, cobalt production from terrestrial mines may not meet the market needs in this respect if the increases in demand are rapid. In such a case, the increased production from polymetallic nodules will likely not have a negative impact on the market.

7. Conclusions

  • This paper introduced the research status of payment systems in deep-sea mineral resources development regulations. At present, there are four payment systems being discussed. In essence, the first three are value-based payment modes, and the last one is a blended profit and fixed ad valorem payment mode.
  • According to the background of Chinese deep-sea mineral resources development project in the Area, by using the discounted cash flow method, this paper constructed a financial model, named the CSU2019 model, determined the main parameters of the model, and compared it with several foreign financial models such as the MIT model.
  • According to the sensitivity analysis, the top sensitive factors are annual mining output, manganese grade and price, smelting operation, and investment cost. It can be seen that increasing the output of ore and the value of manganese products and reducing the smelting cost are very important to improve the economic benefits of deep-sea polymetallic nodule development.
  • On the basis of the COMRA project, the CSU2019 model was applied to calculate and analyze the impact of different payment systems and payment rates on the economic indicators of the project and the cumulative ISA revenue. Under the same internal rate of return (IRR), when adopting the fixed ad valorem—two stage payment system or blended profit—two stage payment system, the cumulative ISA revenue is always higher than that of the fixed ad valorem—one stage payment system.
  • The fixed ad valorem—two stage payment system and blended profit—two stage payment system have their own advantages and disadvantages. If we only choose the value-based payment model, it is relatively less conducive to the promotion of Area mineral resources development technology, and it is relatively less conducive to sharing the benefits brought by the progress of mining technology. The blended profit and fixed ad valorem payment mode will not increase the complexity of the payment system.
  • The determination of the key factors of metal prices in the above economic evaluation and analysis was based on the prediction of metal price under the current land mining production conditions. In fact, some metals in deep-sea mineral resources have huge production capacity relative to the current market demand or land mining output, which may have a huge impact on the corresponding metal market price, especially manganese and cobalt. Considering the limited demand and huge energy consumption of EMM, it is obviously inappropriate to regard EMM as the only product of manganese in various financial models. It is necessary to consider silicon–manganese alloy and manganese-rich slag as products or adopt various forms of manganese products.

Author Contributions

This paper emerged from the long-term cooperation of the authors. Conceptualization, S.L. and Y.L.; methodology, Y.L. and C.L.; software, S.S.; validation, Y.L. and M.L.; formal analysis, S.S.; writing—original draft preparation, Y.L.; writing—review and editing, C.L. and M.L.; funding acquisition, S.L. All authors read and agreed to the published version of the manuscript.

Funding

This research was funded by COMRA and the National Social Science Foundation of China, grant numbers 12ZD210.

Institutional Review Board Statement

Not applicable.

Informed Consent Statement

Not applicable.

Data Availability Statement

Not applicable.

Acknowledgments

The authors would like to thank the editors and anonymous reviewers for their careful work and thoughtful suggestions that helped improve this paper substantially.

Conflicts of Interest

The authors declare no conflict of interest.

References

  1. Lodge, M. New Developments in Deep Seabed Mining; Hamburg Business Club: Hamburg, Germany, 2018. [Google Scholar]
  2. United Nations Office of Legal Affairs; International Seabed Authority. Marine Mineral Resources: Scientific Advances and Economic Perspectives; United Nations: New York, NY, USA, 2004; pp. 18–26. [Google Scholar]
  3. U. S. Geological Survey. Mineral Commodity Summaries 2020; U. S. Geological Survey: Washington, DC, USA, 2020.
  4. United Nations. United Nations Convention on the Law of the Sea (A/CONF.62/122); United Nations: New York, NY, USA, 1982. [Google Scholar]
  5. United Nations. Agreement for the implementation of Part XI of the United Nations Convention on the law of the sea of 10 December 1982 (A/RES/48/263); United Nations: New York, NY, USA, 1994. [Google Scholar]
  6. International Seabed Authority. Draft Regulations on Exploitation of Mineral Resources in the Area (ISBA/25/C/WP.1); International Seabed Authority: Kingston, Jamaica, 2019. [Google Scholar]
  7. Van Nijen, K.; Van Passel, S.; Brown, C.G.; Lodge, M.W.; Segerson, K.; Squires, D. The Development of a Payment Regime for Deep Sea Mining Activities in the Area through Stakeholder Participation. Int. J. Mar. Coast. Law 2019, 34, 1–39. [Google Scholar] [CrossRef] [Green Version]
  8. Van Nijen, K.; Van Passel, S.; Squires, D. A Stochastic Techno-Economic Assessment of Seabed Mining of Polymetallic Nodules in the Clairon Clipperton Fracture Zone. Mar. Policy 2018, 95, 133–141. [Google Scholar] [CrossRef]
  9. Volkmann, S.E.; Kuhn, T.; Lehnen, F. A comprehensive approach for a techno-economic assessment of nodule mining in the deep sea. Miner. Econ. 2018, 31, 319–336. [Google Scholar] [CrossRef] [Green Version]
  10. Kirchain, R.; Field, R.R.; Roth, R. Financial Mechanisms for Polymetallic Nodule Mining: A Comparison of Four Economic Models; Council of International Seabed Authority: Kingston, Jamaica, 2019. [Google Scholar]
  11. Pietro, G. Mineral Royalties and Other Mining Specific Taxes; Centre for Exploration Targeting: Crawley, Australia, 2012. [Google Scholar]
  12. Mergani, H.; Osanloo, M.; Parichehp, M. Ultimate Pit Limit Determination Considering Mining Royalty in Open-Pit Copper Mines. In Proceedings of the 28th International Symposium on Mine Planning and Equipment Selection—MPES 2019; Springer: Berlin/Heidelberg, Germany, 2019. [Google Scholar]
  13. Otto, J.; Andrews, C.B.; Cawood, F.; Doggett, M.; Guj, P.; Stermole, F.; Stermole, J.; Tilton, J. Mining Royalties: A Global Study of Their Impact on Investors, Government, and Civil Society; World Bank Publications: Washington, DC, USA, 2016. [Google Scholar]
  14. Daniel, P.; Keen, M.; Mcpherson, C. The Taxation of Petroleum and Minerals. Economãa 2010, 43, 3757–3763. [Google Scholar]
  15. Roth, R.; Kirchain, R.; Peacock, T. Financial Payment System Working Group Meeting; Financial Payment System Working Group Meeting: Kingston, Jamaica, 2020. [Google Scholar]
  16. International Seabed Authority. Report of the Chair on the Outcome of the Third Meeting of the Open-Ended Working Group of the Council in Respect of the Development and Negotiation of the Financial Terms of a Contract under Article 13, Paragraph 1, of Annex III to the United Nations Convention on the Law of the Sea and Section 8 of the Annex to the Agreement Relating to the Implementation of Part XI of the United Nations Convention on the Law of the Sea of 10 December 1982; Council of International Seabed Authority: Kingston, Jamaica, 2020. [Google Scholar]
  17. Götze, U.; Northcott, D.; Schuster, P. Discounted Cash Flow Methods. In Investment Appraisal; Springer Texts in Business and Economics; Springer: Berlin/Heidelberg, Germany, 2015. [Google Scholar]
  18. International Seabed Authority. Available online: https://www.isa.org.jm/map/china-ocean-mineral-resources-research-and-development-association (accessed on 22 May 2001).
  19. Liu, C.; Hu, Z.H.; Li, Y.; Liu, S.J. Forecasting copper prices by decision tree learning. Resour. Policy 2017, 52, 427–434. [Google Scholar] [CrossRef]
  20. Charlot, P.; Marimoutou, V. On the relationship between the prices of oil and the precious metals revisiting with a multivariate regime-switching decision tree. Energy Econ. 2014, 44, 456–467. [Google Scholar] [CrossRef] [Green Version]
  21. Kirchain, R.; Roth, R.; Frank, R.; Muñoz-Royo, C.; Peacock, T. Report1 to the International Seabed Authority on the Development of an Economic Model and System of Payments for the Exploitation of Polymetallic Nodules in the Area; Massachusetts Institute of Technology: Cambridge, MA, USA, 2019. [Google Scholar]
  22. Borgonovo, E. Sensitivity Analysis; Springer International Publishing: Cham, Switzerland, 2017. [Google Scholar]
  23. Zio, E. The Monte Carlo Simulation Method for System Reliability and Risk Analysis; Springer: London, UK, 2013. [Google Scholar]
  24. Shanxi Lianzhi Information Technology Co., Ltd. Available online: http://www.cbcie.com/mn/index.html (accessed on 10 April 2019).
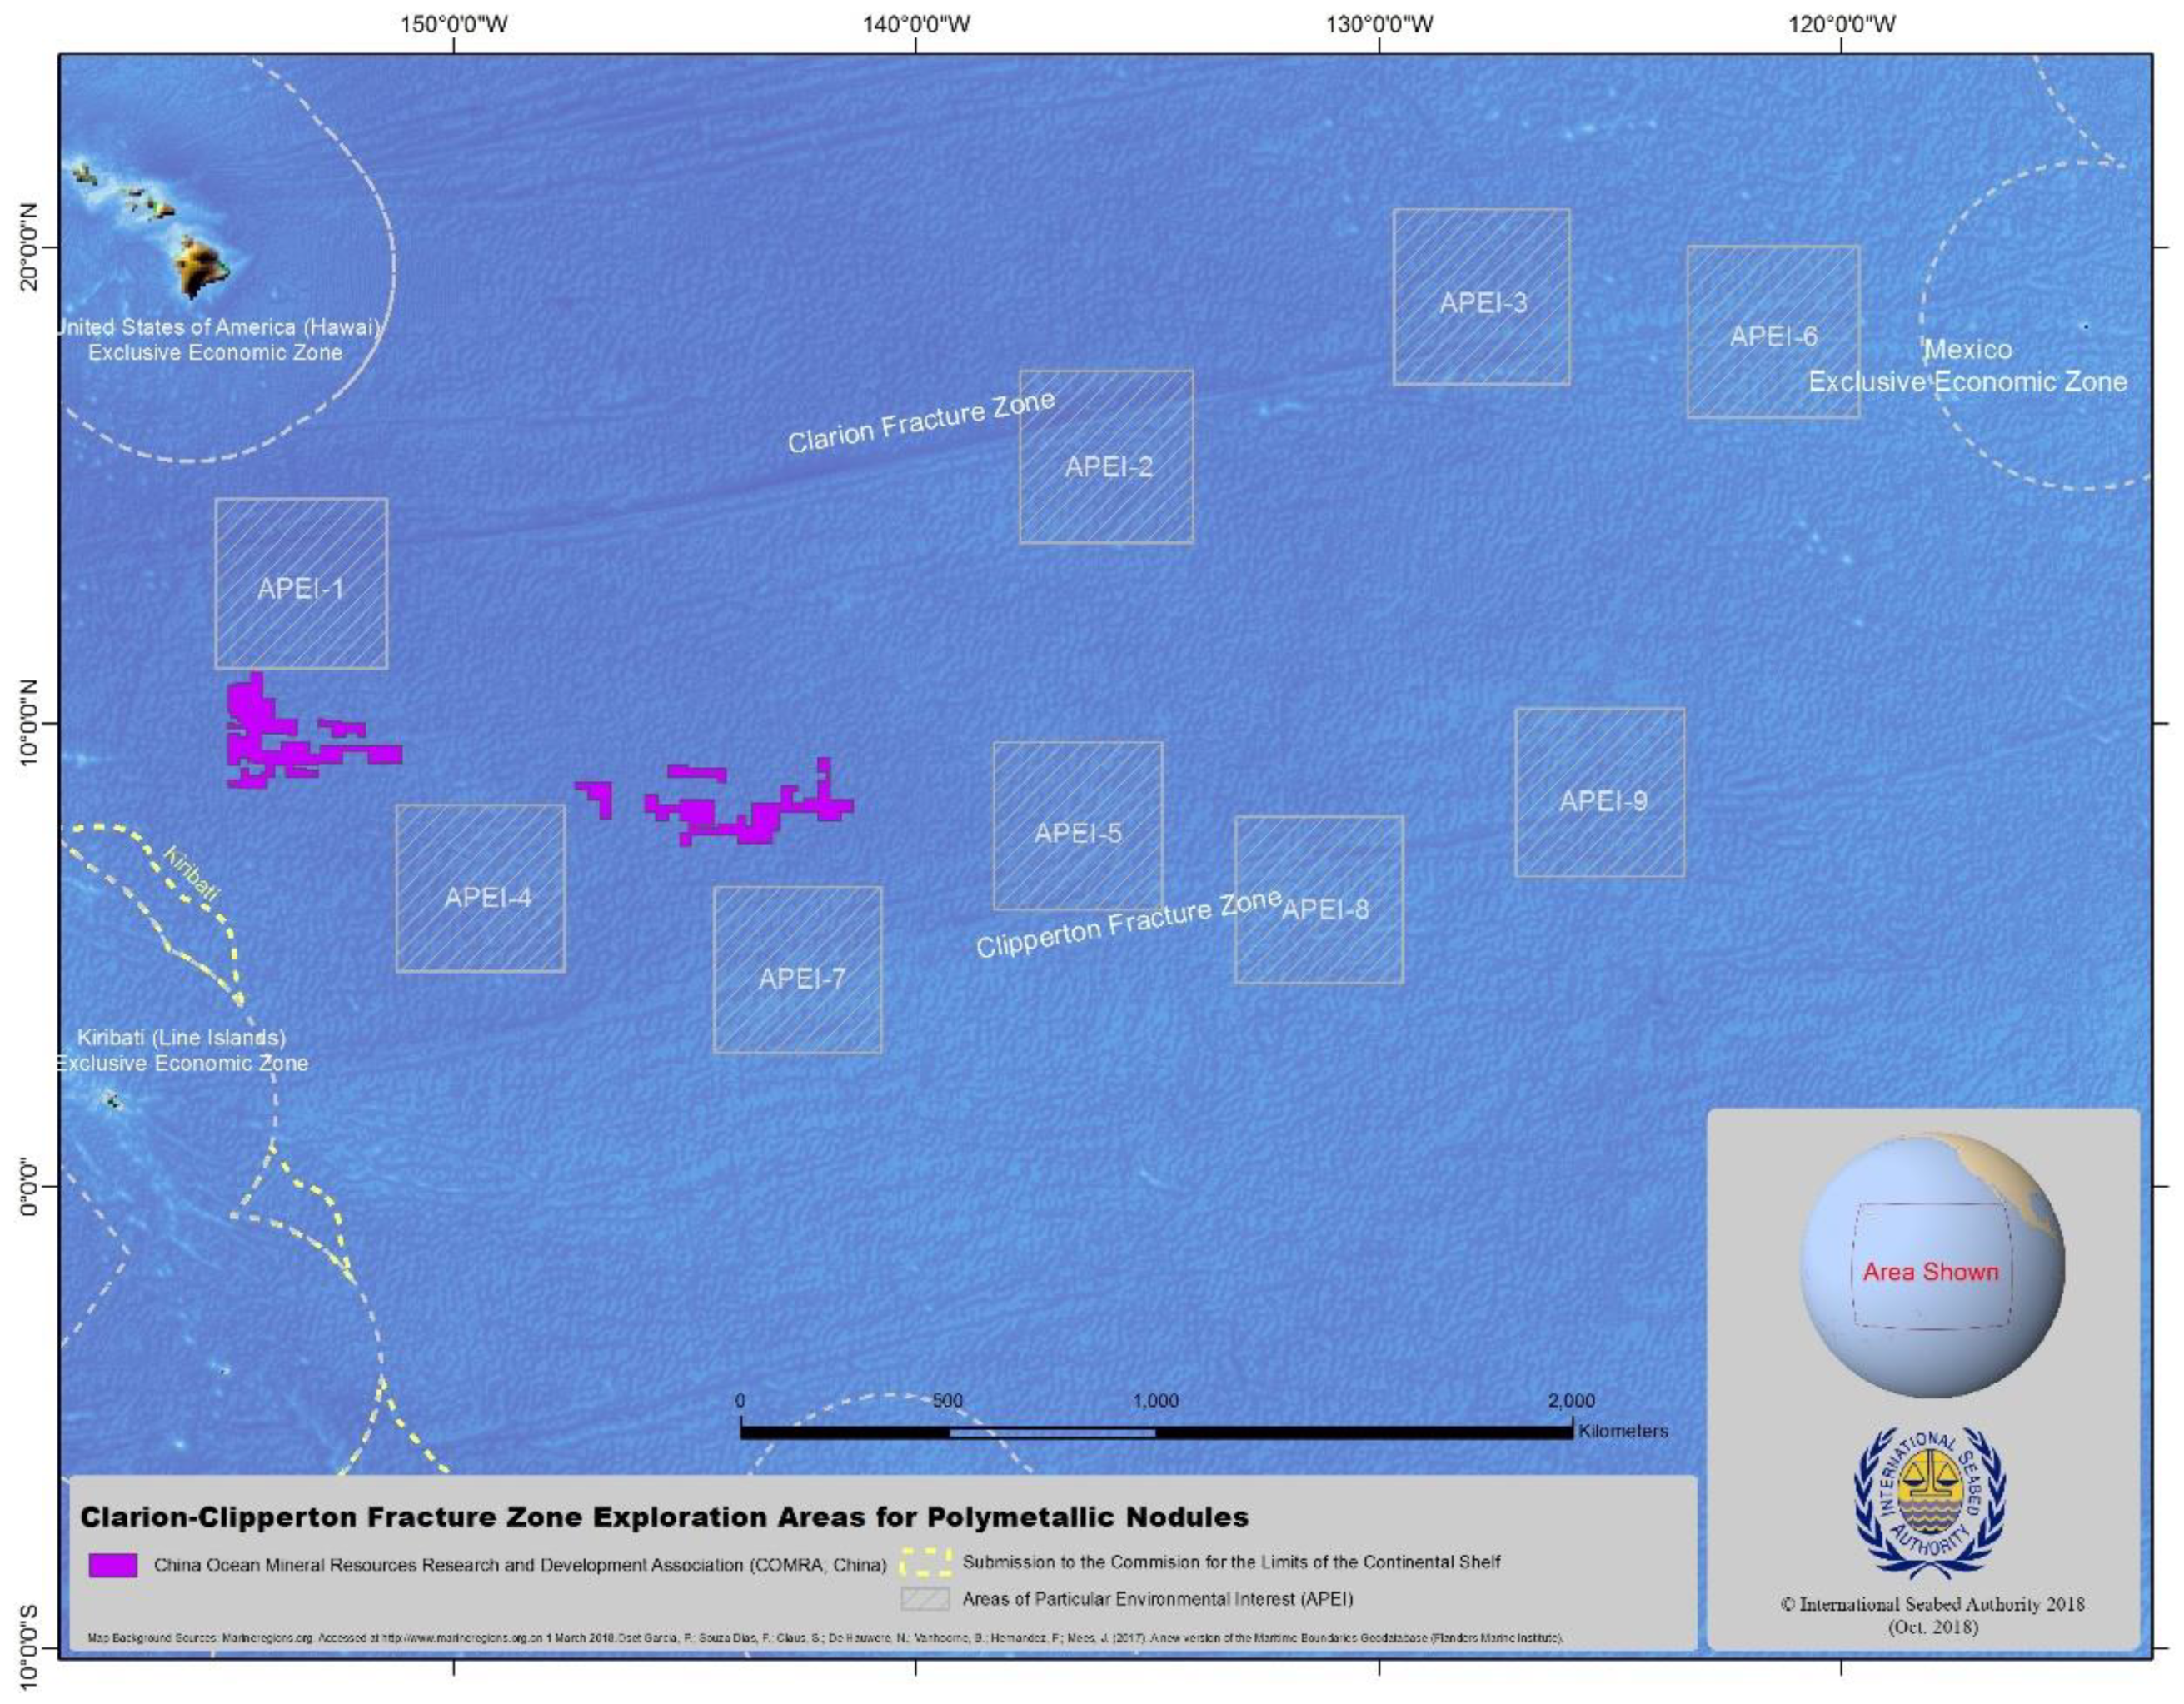
Figure 1. Schematic diagram of the polymetallic nodule exploration contract area of the China Ocean Mineral Resources Research and Development (R&D) Association (COMRA) (from http://www.isa.org.jm (accessed on 10 April 2019)).
Minerals 11 00221 g001
Figure 2. Comparison of predictive and actual copper price.
Minerals 11 00221 g002
Figure 3. Comparison of predictive and actual nickel price.
Minerals 11 00221 g003
Figure 4. Comparison of predictive and actual cobalt price.
Minerals 11 00221 g004
Figure 5. Forecast results of copper price in the next 16 years. The blue curve represents the forecast value of medium and long-term prices, and the circle represents the annual price, the square represents the forecast price with error analysis.
Minerals 11 00221 g005
Figure 6. Forecast results of nickel price in the next 16 years.
Minerals 11 00221 g006
Figure 7. Forecast results of cobalt price in the next 16 years.
Minerals 11 00221 g007
Figure 8. After-tax IRR with different royalty rates and metal prices.
Minerals 11 00221 g008
Figure 9. IRR and cumulative ISA revenue with different payment systems.
Minerals 11 00221 g009
Figure 10. IRR and cumulative ISA revenue with different payment systems.
Minerals 11 00221 g010
Figure 11. Distribution frequency histogram and cumulative probability distribution of IRR. (Note: the red bar indicates that the project is feasible). (a):AV4% (b): AV1%5y + AV5.5%20y (c): AV2% + PB13%.
Minerals 11 00221 g011
Table 1. Advantages and disadvantages of various royalty types.
Royalty TypesAdvantagesDisadvantages
Unit-based royaltyThe administration is simple and efficient.
Income stability and transparency are high.
Income maximization is low.
Value-based royaltyMarket is highly sensitive.
The administration is simple and efficient.
Income stability and transparency are moderate.
The level of income maximization is average.
It is easy to ignore the potential value of minerals.
Profit-based payment mechanismIncome maximization is high.The administration is complex and inefficient.
Income stability and transparency are low.
Combination of value-based and profit-based royaltyIncome maximization is high.
Income stability and transparency are moderate.
The administration is complex and inefficient.
Progressive value-based royaltyMarket is sensitive.
Income stability and transparency are moderate.
It is easy to ignore the potential value of minerals.
Table 2. The main business parameters of the mining enterprises in the Central South University (CSU) 2019 model. USD, United States dollar.
Production PlanConstruction period (years)3
Commercial mining period (years)25
Annual production capacity (10,000 dry tons)300
Capital Expenditure
(Million USD)
Pre-feasibility and feasibility study3108.8%
Mining system80022.73%
Transportation system41011.65%
Smelting system200056.82%
Total3520100%
Operating Expense
(Million USD/year)
Mining system30029.65
Transportation system11211.07
Smelting system60059.28
Total1012100%
Table 3. Metal grade and smelting recovery rate in the CSU2019 model.
Manganese GradeRecovery RateNickel GradeRecovery RateCopper GradeRecovery RateCobalt GradeRecovery Rate
27.15%90%1.27%87%1.02%88%0.22%83%
Table 4. Administrative supervision and taxes to be considered in the financial model.
Administrative Expenses or TaxesAmount or Tax RateIllustration
Application fee for exploitation contract1,000,000 USDReference to exploration regulations
Annual management fee100,000 USD/yearReference to exploration regulations
Annual fixed fee1,000,000 USD/yearReference to the Convention
Royalty-Research object of financial model
Corporate income tax25%Refer to Chinese standards
Value-added tax8%Considering the deduction in practice
Insurance1,500,000 USD/yearConsidering environment protection
Table 5. Financial model method and tax consideration. IRR, internal rate of return; NPV, net present value. AG, African Group.
Parameter NameCSU2019MIT2018AG2018BMWi2017
Modeling Method and Evaluation Metrics
DCF method
IRRX
NPVX
PtXXX
Price and Taxes
Price determination methodPrediction algorithm and expert conjecturePrediction method and expert conjectureCurrent market priceAverage price in recent years
RoyaltiesX
Management expensesXX
Corporate income tax25%25%25%X
Value-added tax8%000
Table 6. Main cost and price parameters of each financial model.
Parameter NameCSU2019MIT2018AG2018BMWi2017
Production Situation and Project Cycle
Analysis period (years)28373516
Development cycle (years)28 (3)30 (3)28 (3)16 (4)
Annual capacity (million dry tons)3333
Types of metal extractionCu/Ni/Co/MnCu/Ni/Co/MnCu/Ni/Co/MnCu/Ni/Co
Manganese product planElectrolytic manganeseElectrolytic manganeseElectrolytic manganeseX
Capital Expenditure (Million USD)
Feasibility study310313360-
Mining and transportation system121016431276789
Smelting system2000207224151,543
Operating Expense (Million USD/year)
Mining and transportation41241345091.5
Smelting600654670321
Metal Price (USD/ton)
Cobalt67,26155,53591,00028,946
Copper6635696568866745
Manganese168516402040980
Nickel12,69222,96214,84014,920
Metal Grade
Cobalt0.22%0.21%0.25%0.18%
Copper1.02%1.07%1.2%1.18%
Manganese27.15%28.4%27%31.5%
Nickel1.27%1.3%1.3%1.4%
Recovery Rate
Cobalt83%85%85%85%
Copper88%90%90%95%
Manganese90%90%95%n/a
Nickel87%95%95%95%
Table 7. Sensitivity coefficient and sensitivity ranking.
Sensitivity RankingSensitive FactorsAbsolute Value of After-Tax NPV Sensitivity CoefficientAbsolute Value of After-Tax IRR Sensitivity Coefficient
1Annual capacity13.891.67
2Manganese grade and price7.780.92
3Smelting operating expense4.010.48
4Smelting capital expenditure 3.430.47
5Nickel grade and price2.650.32
6Cobalt grade and price2.270.27
7Mining operating expense2.030.24
8Mining capital expenditure1.310.18
9Copper grade and price1.120.13
10Transportation operating expense 0.740.094
11Transportation capital expenditure0.680.088
12Royalty rate0.310.037
Table 8. Distribution types and distribution intervals of risk variables
Risk VariablesDistribution TypeExpected ValueDistribution IntervalRange of Variation
Annual ore output (10,000 tons)Trigonometric distribution300250–315−17% to +5%
Annual operating cost (million USD)Trigonometric distribution1012759–1265±25%
Fixed investment (million USD)Trigonometric distribution32102407.5–4012.5±25%
Metal gradeMnTrigonometric distribution27.15%25.79–28.51%±5%
CoTrigonometric distribution0.22%0.21–0.23%±5%
NiTrigonometric distribution1.27%1.21–1.33%±5%
CuTrigonometric distribution1.02%0.97–1.07%±5%
Metal prices (USD/ton)MnTrigonometric distribution16851263.75–2106.25±25%
CoTrigonometric distribution6726150,445.75–84,076.25±25%
NiTrigonometric distribution126929519–15,865±25%
CuTrigonometric distribution66354976.25–8293.75±25%
Table 9. Three sets of metal prices were used in the study.
Types of Metals2015–2019 5 Year
Average Price
(USD/ton)
2020.1–2020.12 Present
Average Price
(USD/ton)
Expert Estimated Price
(USD/ton)
Mn179816491685
Ni11,76915,84912,692
Co41,99940,08567,261
Cu582367456635
Note 1: The average prices of Cu/Ni/Co are from London Metal Exchange (LME). The average Mn price is from http://www.asianmetal.cn (accessed on 10 April 2019).
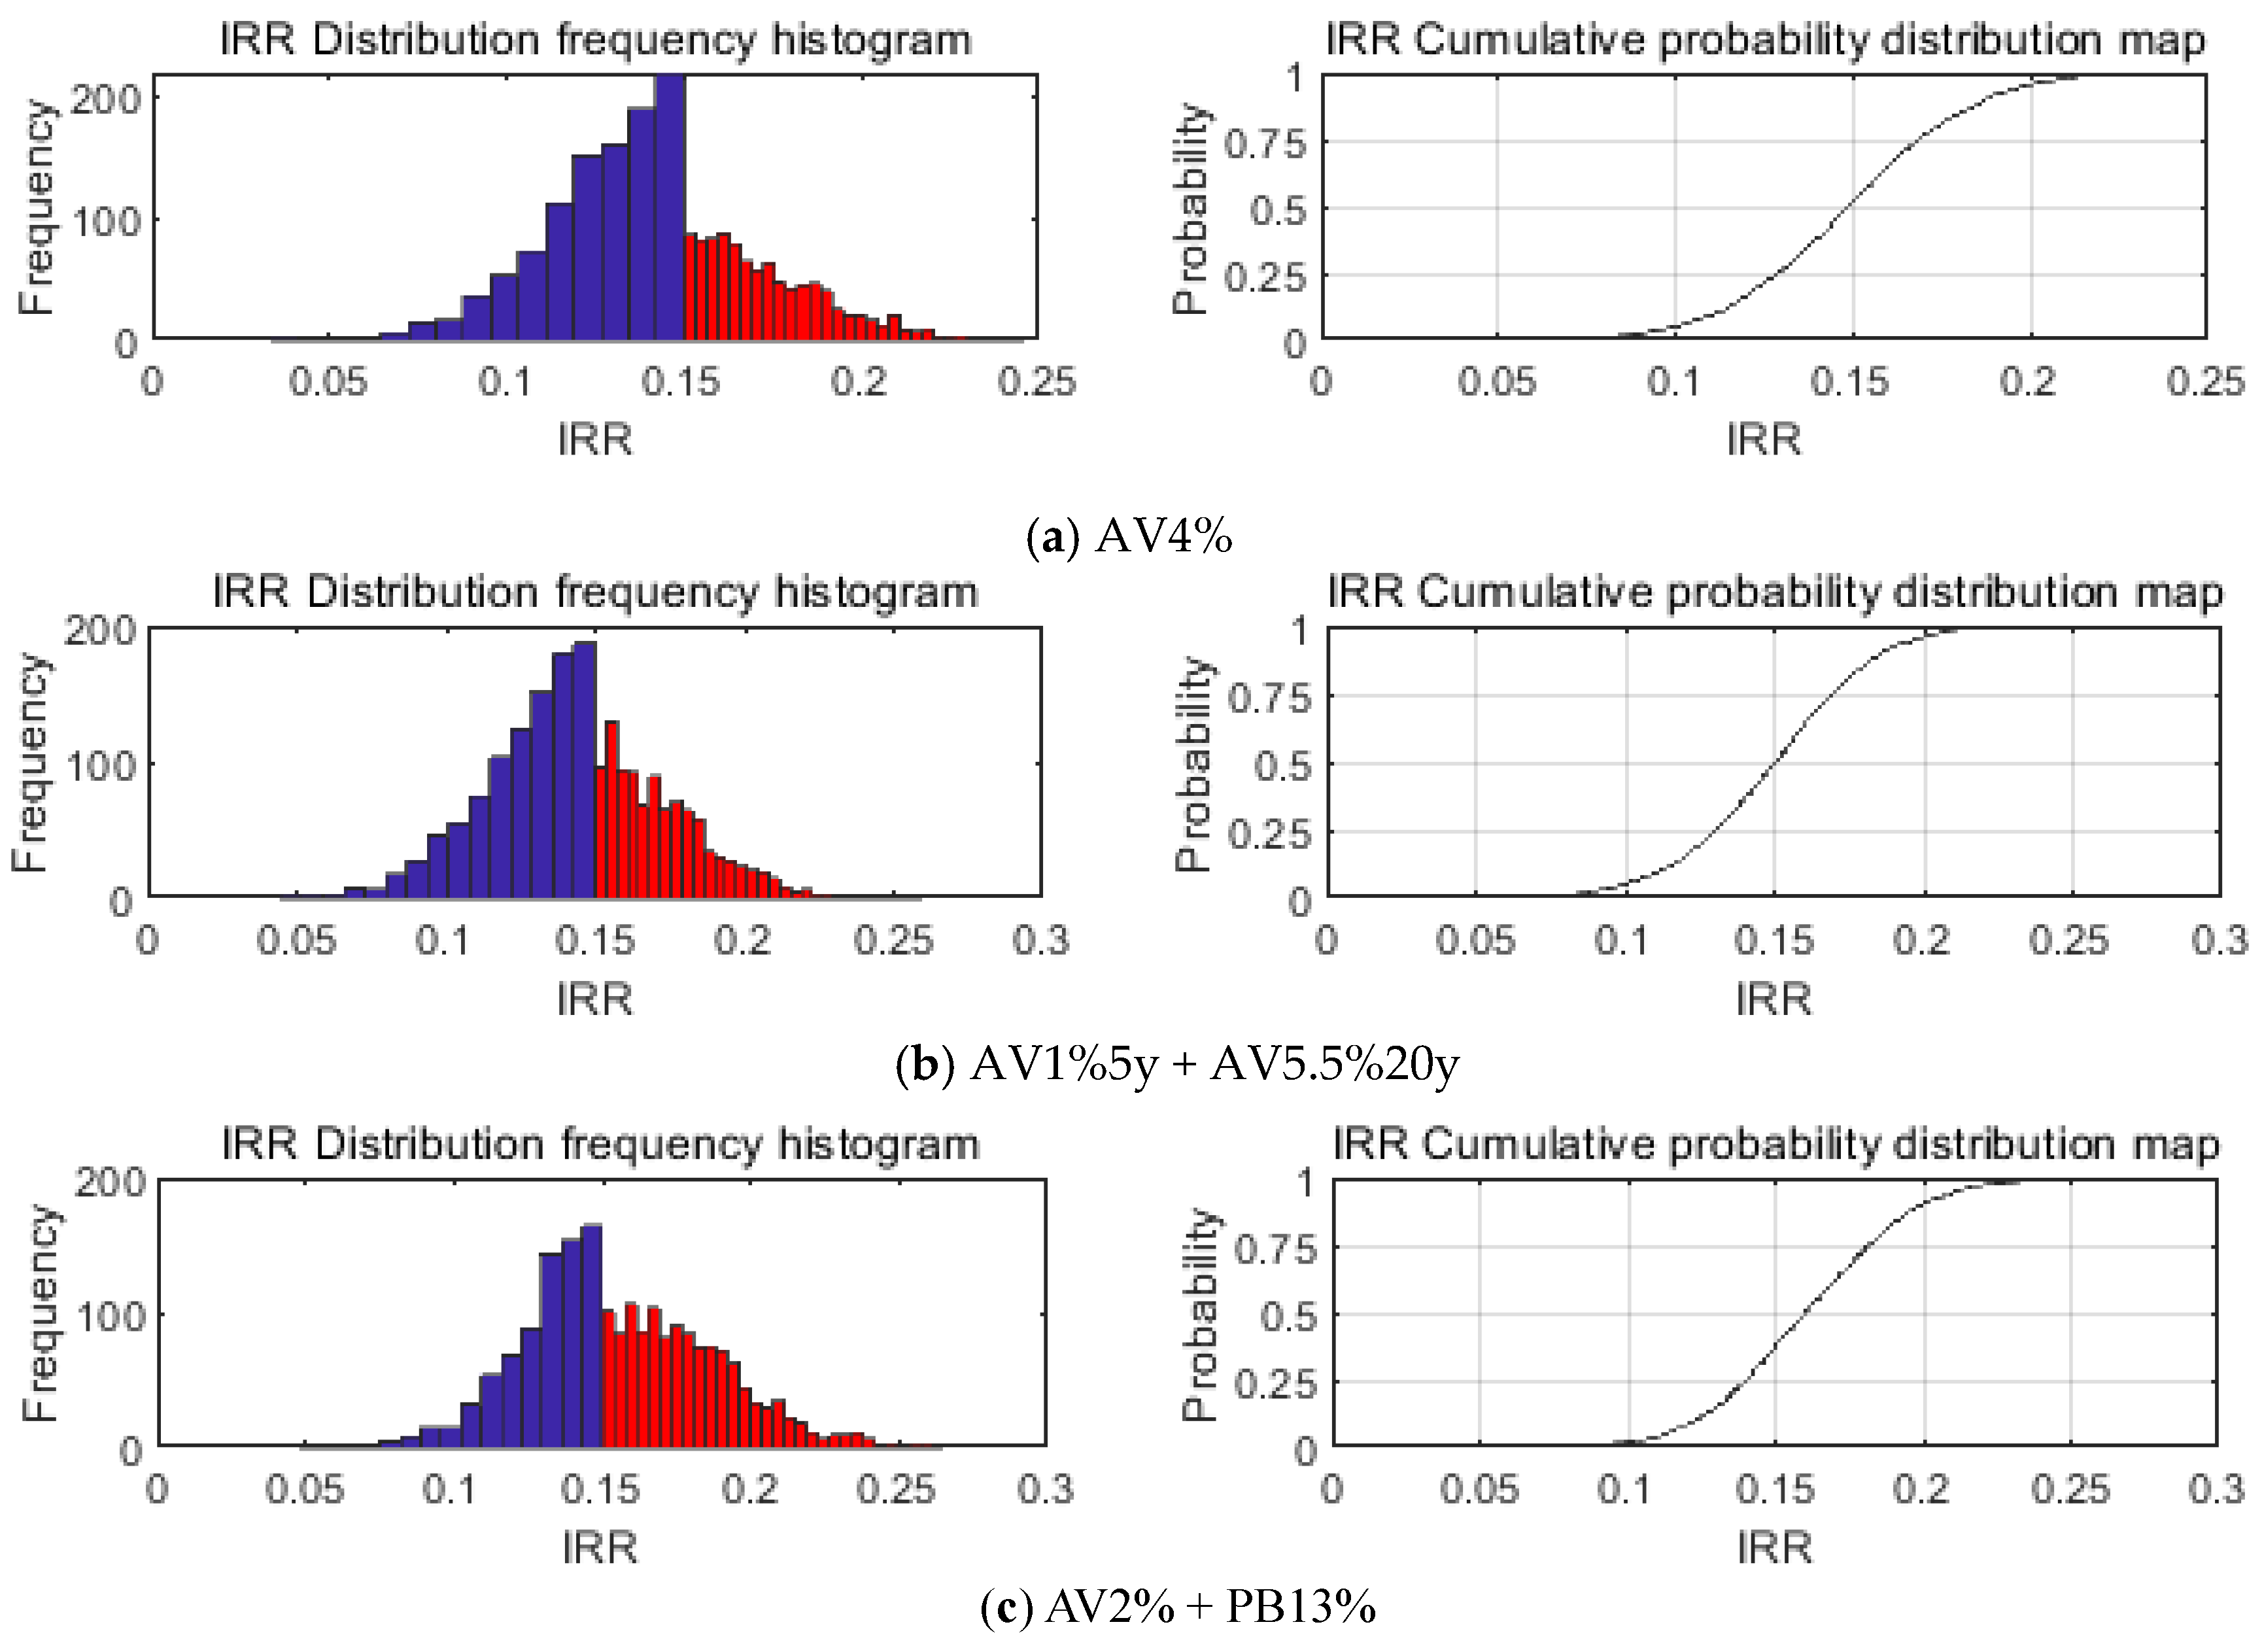
Table 10. Economic metrics of the project with different payment systems.
Payment SystemsIRRISA Annual Revenue
(Million USD)
ISA Cumulative Revenue
(Million USD)
AV5.5%16%121.173029.14
AV1%5y + AV8%20y16%22.03/176.243634.97
AV3%5y + AV7%20y16%66.09/154.213414.67
AV4%16.5%88.122203.01
AV1%5y + AV5.5%20y16.5%22.03/121.172533.47
AV2%5y + AV5%20y16.5%44.06/110.152423.32
AV2.5%17%55.081376.88
AV1%5y + AV3%20y17%22.03/66.091431.96
Note: For example, AV1%5y + AV8%20y is divided into two stages of 5 years and 20 years, with a 1% ad valorem royalty rate for the first 5 years and an 8% ad valorem royalty rate for the next 20 years.
Table 11. Economic metrics of the project with different payment systems.
Payment SystemsIRRAfter-tax NPV
(Million USD)
ISA Annual Revenue
(Million USD)
ISA Cumulative Revenue
(Million USD)
AV5.5%16%217.55121.173029.14
AV3% + PB17%16%217.7688.12/---3449.89
AV4%16.5%322.8988.122203.01
AV2% + PB13%16.5%323.3244.06/---2519.12
AV2.5%17%428.2355.081376.88
AV1% + PB8.5%17%436.1522.03/---1505.75
Note: For example, AV3% + PB17% is divided into two stages of 5 years and 20 years. An ad valorem rate 3% is used in the first 5 years, and a profit-based rate of 17% is used in the second 20 years. Other ad valorem + profit combinations follow this notation. --- Since the ad valorem + profit combination is adopted in the next 20 years, the annual equity fund is dynamic.
Table 12. Maximum value and minimum value of IRR in risk analysis.
Payment SchemeMaximum IRRMinimum IRR
AV4%24.59%3.34%
AV1%5y + AV5.5%20y24.67%4.81%
AV2% + PB13%24.94%6.08%
Table 13. The influence, advantages, and disadvantages of different payment systems.
Payment SystemInfluence on the AuthorityInfluence on ContractorsMain Advantages and Disadvantages
Ad valorem royaltyThe difficulty of tax collection and the administrative cost are medium.Does not reflect production costs and profits.The contractors bear all the risks; it is not conducive to the development and technological progress.
Blended profit and fixed ad valoremThe requirements of accounting and auditing are high, and the management cost is high.Reflects profitability and reduces risk.ISA bears certain risks with the contractors; it encourages investment and technology development at early stage.
Table 14. Polymetallic nodule metal production in relation to land production for a single mining contract in the Clarion–Clipperton Fracture Zone (CCZ).
MetalCopperNickelCobaltManganese
Annual production of four metals for a single development contract (10,000 tons)2.73.30.5573
Global supply of four metals in 2018 (10,000 tons)2300190151890
Proportion0.12%1.75%3.75%3.86%
Publisher’s Note: MDPI stays neutral with regard to jurisdictional claims in published maps and institutional affiliations.