Article

An Application of Simultaneous Stochastic Optimization at a Large Open-Pit Gold Mining Complex under Supply Uncertainty

by
Mélanie LaRoche-Boisvert
and
Roussos Dimitrakopoulos
*
COSMO—Stochastic Mine Planning Laboratory, Department of Mining and Materials Engineering, McGill University, 3450 University Street, Montreal, QC H3A 0E8, Canada
*
Author to whom correspondence should be addressed.
Minerals 2021, 11(2), 172; https://doi.org/10.3390/min11020172
Submission received: 6 January 2021 / Revised: 25 January 2021 / Accepted: 30 January 2021 / Published: 7 February 2021

Abstract

:
The simultaneous stochastic optimization of mining complexes optimizes various components of the related mineral value chain jointly while considering material supply (geological) uncertainty. As a result, the optimization process capitalizes on the synergies between the components of the system while not only quantifying and considering geological uncertainty, but also producing strategic mine plans, maximizing the net present value. This paper presents an application of simultaneous stochastic optimization at a large gold mining complex. The complex contains three open-pit mines, three stockpiles, a waste dump, and a processing facility. Material hardness management is integrated at the processing facility. The case study generated production schedules for each mineral deposit considered, as well as an overall assessment of the project and related forecasts. It resulted in an 18 year life-of-asset and identified the semi-autogenous grinder (SAG) mill as the bottleneck of the operation.

1. Introduction

Mining complexes or mineral value chains are systems composed of various components, including mines, stockpiles, processors, waste dumps, tailings facilities, transportation, and so on [1,2,3,4,5]. The simultaneous stochastic optimization (SSO) approach integrates all components of a mineral value chain into a single mathematical formulation to maximize the production and net present value (NPV) over the life of the related mining complex. By considering the interactions between the components of a mineral value chain, the SSO approach defines the extraction sequences for the mines considered, cut-off grades, stockpile management, and blending at the processing facilities to maximize NPV over the life of the assets involved. The approach also manages material supply uncertainty and the related risk based on geostatistical simulations of the relevant properties of the mineral deposits involved, which reproduce the local variability and uncertainty of the available material [6,7].
Traditional mine planning and optimization methods treat the major components of the related mineral value chain separately in a sequential fashion and are deterministic, ignoring the interdependencies of the components and failing to manage the technical risks arising from an uncertain material supply. Global optimizers have been developed to optimize jointly different components of a mining complex [8,9,10,11,12,13]; however, they are deterministic and make certain approximations. Stochastic optimization frameworks have been developed to incorporate and manage the uncertainty in the optimization of a mineral value chain. These approaches use stochastic simulations of mineral deposits to quantify the material supply uncertainty and manage the associated risks [14,15,16], as well as determine optimal cut-off grade policies [17,18,19]. Ramazan and Dimitrakopoulos [14,15] present a stochastic integer program to optimize a mineral deposit’s extraction schedule, maximizing NPV and minimizing deviations from ore tonnage, grade, and metal quantity and quality targets. Mai et al. [20] propose a stochastic integer programming model to maximize the NPV of a mineral deposit and minimize the risks of not meeting production targets under geological uncertainty. However, the approach aggregates blocks to reduce the computational requirements of the optimization problem. Morales et al. [21] present a method to optimize mine and mill operations under grade, recovery, and mill throughput uncertainty. Menabde et al. [17] extend Blasor, the optimization tool presented by Stone et al. [9], to include geological uncertainty and cut-off grade optimization based on grade bins. In addition, the optimization tool sequences multiple pits, as opposed to a single deposit, as in the previously discussed methods, to ensure product and quality requirements are respected while maximizing NPV.
The above previously discussed stochastic optimization methods aim to maximize the value of the mine by maximizing the economic value of the blocks extracted under an uncertain material supply. These economic values are determined prior to the optimization process under the assumption that each block will be processed individually, ignoring transformations caused by the blending and nonlinear interactions of materials. The simultaneous stochastic optimization (SSO) approach shifts the focus from the maximization of the economic values of blocks to the maximization of the value of the final product generated by the mining complex. This allows the approach to account for the effects of the blending and nonlinear interactions of materials on the products generated. Montiel and Dimitrakopoulos [1,2] present a model for the simultaneous stochastic optimization of mining complexes, including production scheduling, destination policy, processing, operating modes at the processing facilities, and transportation alternatives under material supply uncertainty. In addition, the approach considers material supply from underground mines [22]. Goodfellow and Dimitrakopoulos [4,5] develop a generalized simultaneous stochastic optimization approach to jointly optimize the different components of a mineral value chain under geological uncertainty. The method easily accommodates different types of mining complexes of varying sizes and their relevant components, such as open-pit mines, stockpiles, processing facilities, waste dumps, and tailings dams. However, it does not directly incorporate operating modes, transportation alternatives, or material supply from sources other than open-pit mines. This approach has been applied to different case studies incorporating market supply uncertainty [23], waste management [24], tailings management [25], and nonadditive attributes such as hardness [26]. In addition, the approach has been extended into a dynamic simultaneous stochastic optimizer to include capital investments [27,28]. Finally, Paithankar et al. [29] propose a model for the simultaneous stochastic optimization of extraction schedules and cut-off grades considering grade uncertainty and stockpiling.
The work herein presents a case study of SSO [4,5] at the Rosebel Gold Mines (RGM) mining complex in Suriname, owned by the IAMGOLD Corporation. The case study considers three RGM deposits for a total of 1.07 million blocks. The case study includes three stockpiles, a waste dump, and a processing facility. Each mine considers four material types, which are treated differently throughout the mineral value chain. The direct block simulation (DBSIM) method [30,31] is used to generate geostatistical simulations of gold grades within each deposit considered, representing the material supply uncertainty of the mining complex. The case study considers an elaborate haulage cost scheme to accurately represent the costs related to transporting the materials from sources to destinations. Finally, the case study integrates material hardness management at the semi-autogenous grinder (SAG) mill. In the subsequent sections, an overview of the SSO method is presented. Then, the case study at the above-mentioned gold mining complex demonstrates the practical aspects of the SSO method. Conclusions follow.

2. Method

The stochastic mathematical programming model for the simultaneous stochastic optimization [4] applied in the present study is outlined in this section.

2.1. Definitions and Notation

Throughout the mineral value chain, the materials are defined as the products extracted from mines and/or that are the results of blending, separation, or processing activities. These materials are described by attributes that represent their properties, such as mass or metal quantity. These attributes can be separated into two categories. Primary attributes ( 𝓅 P ) are additive and can be passed on from one location to another; their value is denoted as v 𝓅 i t 𝓈 . Hereditary attributes ( h H ) are of interest at a specific location; their value is denoted as v h i t 𝓈 = f h i ( v 𝓅 i t 𝓈 ) . Hereditary attributes facilitate the inclusion of nonlinear transformation functions within the SSO framework.
Material is obtained from the mines, 𝓂 M , by extracting a set of blocks, or selective mining units (SMU), b B 𝓂 . Each block is assigned a bin or cluster, 𝒸 C , according to geological attributes such as grade and material type. Cluster membership is scenario-dependent, 𝓈 S , and defines the destinations, i O ( 𝒸 ) , to which extracted blocks can be sent; the destination policy is scenario-independent. The blocks are mined at a cost of m c b t = m c b t 0 ( 1 + 𝒹 ) t , where 𝒹 represents the economic discount rate. The set T represents the number of scheduling periods or years, t T . A block b is eligible to be extracted if its set of predecessors according to the related slope constraints, O b , is fully extracted. Mineability constraints ensure that the schedules produced by the optimization process are feasible. As such, blocks within block b ’s smoothing window, W b , are subject to a penalty cost, c 𝓂 t s m o o t h = c 𝓂 t 0 s m o o t h ( 1 + r ) t , applied to the number of blocks within the window mined in a different period than that of b . Additionally, a block b ¯ b lying at a certain vertical distance (i.e., the sink rate distance) above another block b is subject to a penalty cost, c 𝓂 t s i n k = c 𝓂 t 0 s i n k ( 1 + r ) t , applied when the blocks b and b ¯ are mined in the same period (further discussion of smoothing and sink rates can be found in Section 2.4). The total amount of material mined cannot exceed the mining capacity; any excess will incur a penalty cost, M C h t = M C h t 0 ( 1 + r ) t . The extracted material is hauled to its destination i O ( 𝓂 ) at a cost of h c 𝓂 i t = h c 𝓂 i t 0 ( 1 + 𝒹 ) t . Material sent to a stockpile i S can be reclaimed at a cost of r c h i t = r c h i t 0 ( 1 + 𝒹 ) t and sent to an eligible destination, j O ( i ) . The material sent to a processor i is processed at a cost of p c h i t = p c h i t 0 ( 1 + 𝒹 ) t . Deviations from quantity and quality constraints at the processor are penalized by c h i t + = c h i t 0 + ( 1 + r ) t and c h i t = c h i t 0 ( 1 + r ) t , according to whether the deviations exceed the bound or are in deficit, respectively. The deviation penalties are subject to the geological risk discount rate, r , which reduces their magnitude over time, effectively deferring deviations to later periods (please see further comments in Section 2.3). The revenue generated by the final products delivered by the mining complex is represented by p h i t = p h i t 0 ( 1 + 𝒹 ) t .

2.2. Decision Variables

The formulation proposed by Goodfellow and Dimitrakopoulos [4] defines four critical decisions variables. First, the scenario-independent binary block extraction decision variable, x b t , holds a value of one if block b B 𝓂 is extracted in period t T , and holds a value of zero otherwise. Second, the processing stream decision variable, y i j t 𝓈 , is a real number between zero and 1, indicating the proportion of material being sent from location i S to location j O ( i ) in period t T and scenario 𝓈 S . This decision variable is scenario-dependent as the model assumes that once the material is extracted and sent to a destination, its uncertainty is revealed. This assumption allows the processing stream decision variables to adapt to each uncertainty scenario. Third, the scenario-dependent binary cluster membership variable, θ b 𝒸 𝓈 , holds a value of one if block b B 𝓂 belongs to cluster 𝒸 C in scenario 𝓈 S , and holds a value of zero otherwise. Finally, the scenario-independent binary destination policy variable, z 𝒸 j t , holds a value of one if the cluster 𝒸 C is sent to destination j O ( 𝒸 ) , and holds a value of zero otherwise. It is important to note that a cluster can be assigned to a single destination; however, multiple clusters can be assigned to the same destination.
Additional decision variables include the scenario-dependent surplus, d h i t 𝓈 + , and deficiency, d h i t 𝓈 , variables. These represent the quantity exceeding an upper-bound target ( U h i t ) or the shortage from a lower-bound target ( L h i t ), respectively, for attribute h H at destination i S in period t T and scenario 𝓈 S .

2.3. Objective Function

The objective Function (1) of the Goodfellow and Dimitrakopoulos [4] two-stage stochastic integer programming model maximizes the expected profits of the products generated by the mineral value chain while minimizing the risks of failing to meet capacity, blending, and mineability requirements.
max 1 | S | 𝓈 S t T ( i h H 𝓅 h i t v h i t 𝓈 P a r t   I i h H p c h i t v h i t 𝓈 P a r t   I I 𝓂 M b B 𝓂 i O ( 𝓂 ) 𝒸 C h c 𝓂 i t x b t θ b 𝒸 𝓈 z c i t P a r t   I I I i S h H r c h i t v h i t 𝓈 P a r t   I V M C t d t 𝓈 m i n e P a r t   V i h H P C h i t + d h i t 𝓈 p r o c e s s P a r t   V I i h H S A G h i t + d h i t 𝓈 S A G P a r t   V I I ) t T 𝓂 M b B 𝓂 ( m c b t x b t P a r t   V I I I + c 𝓂 t 𝓈 𝓂 o o t h d b t s m o o t h P a r t   I X + b ¯ b c 𝓂 t s i n k d b b ¯ t s i n k P a r t   X )
Part I maximizes the revenues generated by the products produced. Parts II, III, IV, and VIII aim to minimize the cost of processing, hauling, reclaiming, and mining, respectively. Parts V, VI, and VII minimize the deviations from mining, mineral processing, and SAG mill capacities, respectively, while Parts IX and X minimize deviations from smoothing and sink rate constraints, respectively. The cashflows are subject to an established economic discount rate, 𝒹 , while the deviation penalty costs are subject to a geological risk discount rate, r [32]. The geological risk discount rate reduces the magnitude of the penalty cost over time, deferring the risk of failing to meet production requirements to later periods, when more information will become available.

2.4. Constraints

The objective function is subject to constraints, including reserve, slope, destination policy, and so on. Only select constraints of particular interest to the case study presented in this paper are presented; comprehensive definitions and explanations for the remaining constraints can be found in Goodfellow and Dimitrakopoulos [4]. The different processing streams of the mineral value chain can only accept certain material types based on their geometallurgical attributes. Each processing stream is subject to a capacity constraint; deviations from the capacity constraints are calculated using Equations (2) and (3) and are penalized in the objective Function (1). Similarly, the material extracted from the mines is subject to the mining capacity (4).
v h i t 𝓈 d h i t 𝓈 p r o c e s s P r o c e s s i n g C a p t T ,   𝓈 S ,   i , h H
v h i t 𝓈 d h i t 𝓈 S A G S A G A v a i l t T ,   𝓈 S ,   i , h H
𝓂 M b B 𝓂 x b t × t o n n a g e b d t 𝓈 m i n e M i n i n g C a p t T , 𝓈 S  
In order to ensure a mineable schedule, a smoothing constraint (5) is applied. Based on the methodology presented in Dimitrakopoulos and Ramazan [32], a smoothing window, W b , is defined centered around block b . The number of blocks that make up this window is defined according to a smoothing radius: All blocks whose centers reside within a certain distance of block b ’s center are considered to be in block b ’s smoothing window. Constraint (5) counts the number of blocks that are scheduled to be mined in a different period than that of block b ; this number ( d b t s m o o t h ) is then penalized in part VIII of the objective Function (1). In addition, a sink rate constraint (6) also ensures a mineable schedule by limiting the mine’s vertical advance rate in any period. If a block b is mined in the same period as the overlying block b ¯ b , located at a distance equivalent to the sink rate plus the block’s length in the vertical direction, the deviation variable, d b t s i n k , takes on a value of one and is penalized in part IX of the objective Function (1).
| W b | x b t b ¯ W b x b ¯ t d b t s m o o t h 𝓂 M , b B 𝓂 , t T
x b t + b ¯ b x b ¯ t d b t s i n k 1 𝓂 M , b B 𝓂 , t T

2.5. Solution Approach

The simultaneous stochastic optimization of mining complexes requires a metaheuristic solution approach due to the large number of decision variables that must be considered. The metaheuristic approach used in this work is the simulated annealing [33] extended to consider multiple perturbation neighborhoods and adaptive neighborhood search [2,4,5].

3. Case Study at a Gold Mining Complex

3.1. Overview

The SSO mathematical programming formulation described previously is applied to the Rosebel Gold Mines (RGM) mining complex in Suriname. The case study considers three deposits: Rosebel Mine, Pay Caro Mine, and Royal Hill Mine, as shown in Figure 1. Each deposit has four material types: Waste, laterite/saprolite, transition, and hard rock [34]. The extracted material can be sent to the processor, related stockpile, or waste dump. At the processor, constraints are considered on the material throughput at the SAG mill and on the total tonnage of material sent to the processor.
Each deposit consists of blocks of 16 × 12 × 9 m3, for a combined total of 1.07 million mining blocks: 0.26 million at Rosebel Mine, 0.38 million at Pay Caro Mine, and 0.43 million at Royal Hill Mine. The material uncertainty is quantified using 10 stochastic simulations of the gold grades per mine, for a total of 1000 uncertainty scenarios. Note that Albor and Dimitrakopoulos [35] determined that 10 to 12 simulations are sufficient to obtain a stable solution for the stochastic optimization of mining complexes. The simulated realizations of the three deposits are generated using the direct block simulation (DBSIM) method [30,31]. Each deposit is separated into different geological domains that were simulated separately.
The economic parameters used in the optimization process are listed in Table 1. The mining cost is separated into the drill and blast cost, loading cost, dump maintenance cost, and closure cost while the total processing cost is separated into processing cost, administration cost, and sustaining capital cost, to account for the different costs associated with the different material types. In addition, the haulage costs are separated from the mining costs to account for differences in the haulage distance from the different mineral deposits to the different processing stream destinations. For example, the Rosebel Mine is furthest from the processor and, therefore, has the highest transportation cost, while the Pay Caro Mine is closest and, therefore, has the lower transportation cost. Furthermore, an incremental mining cost is included to account for the increased cost of mining deeper into each pit. Table 2 summarizes the targets for each component of the mineral value chain, including the stockpiles and processors. Table 3 denotes the mineability constraints applied to create smooth schedules.

3.2. Results

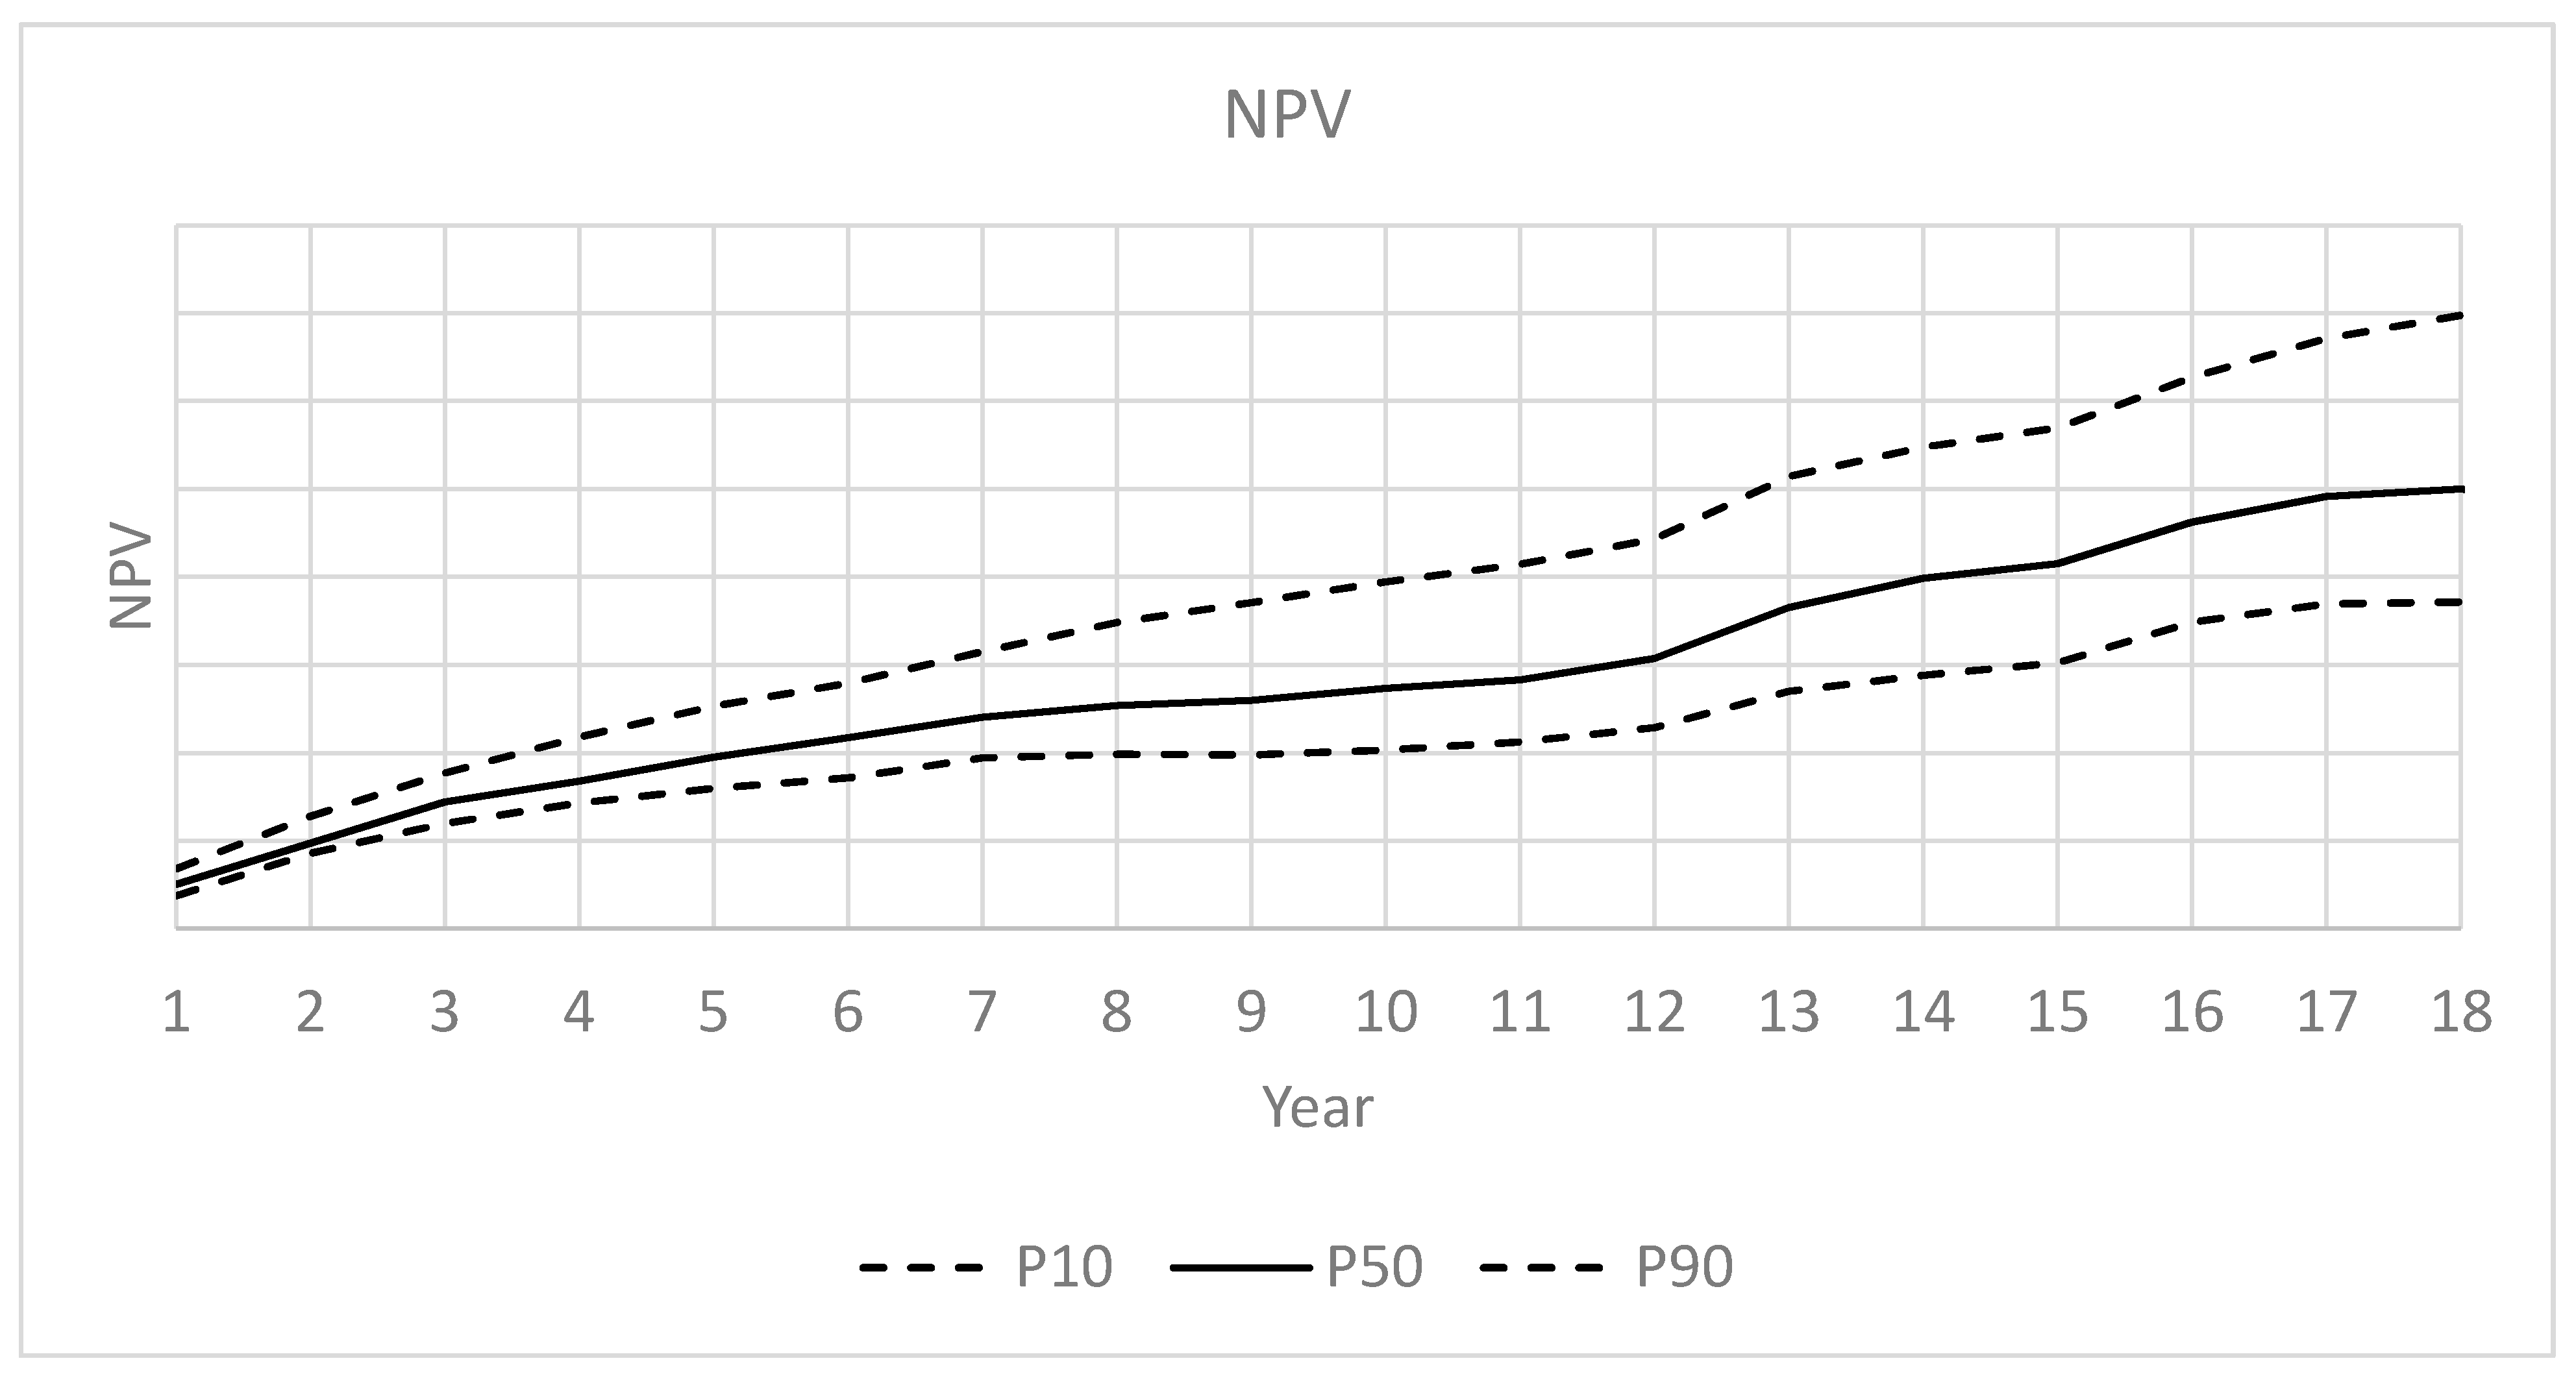
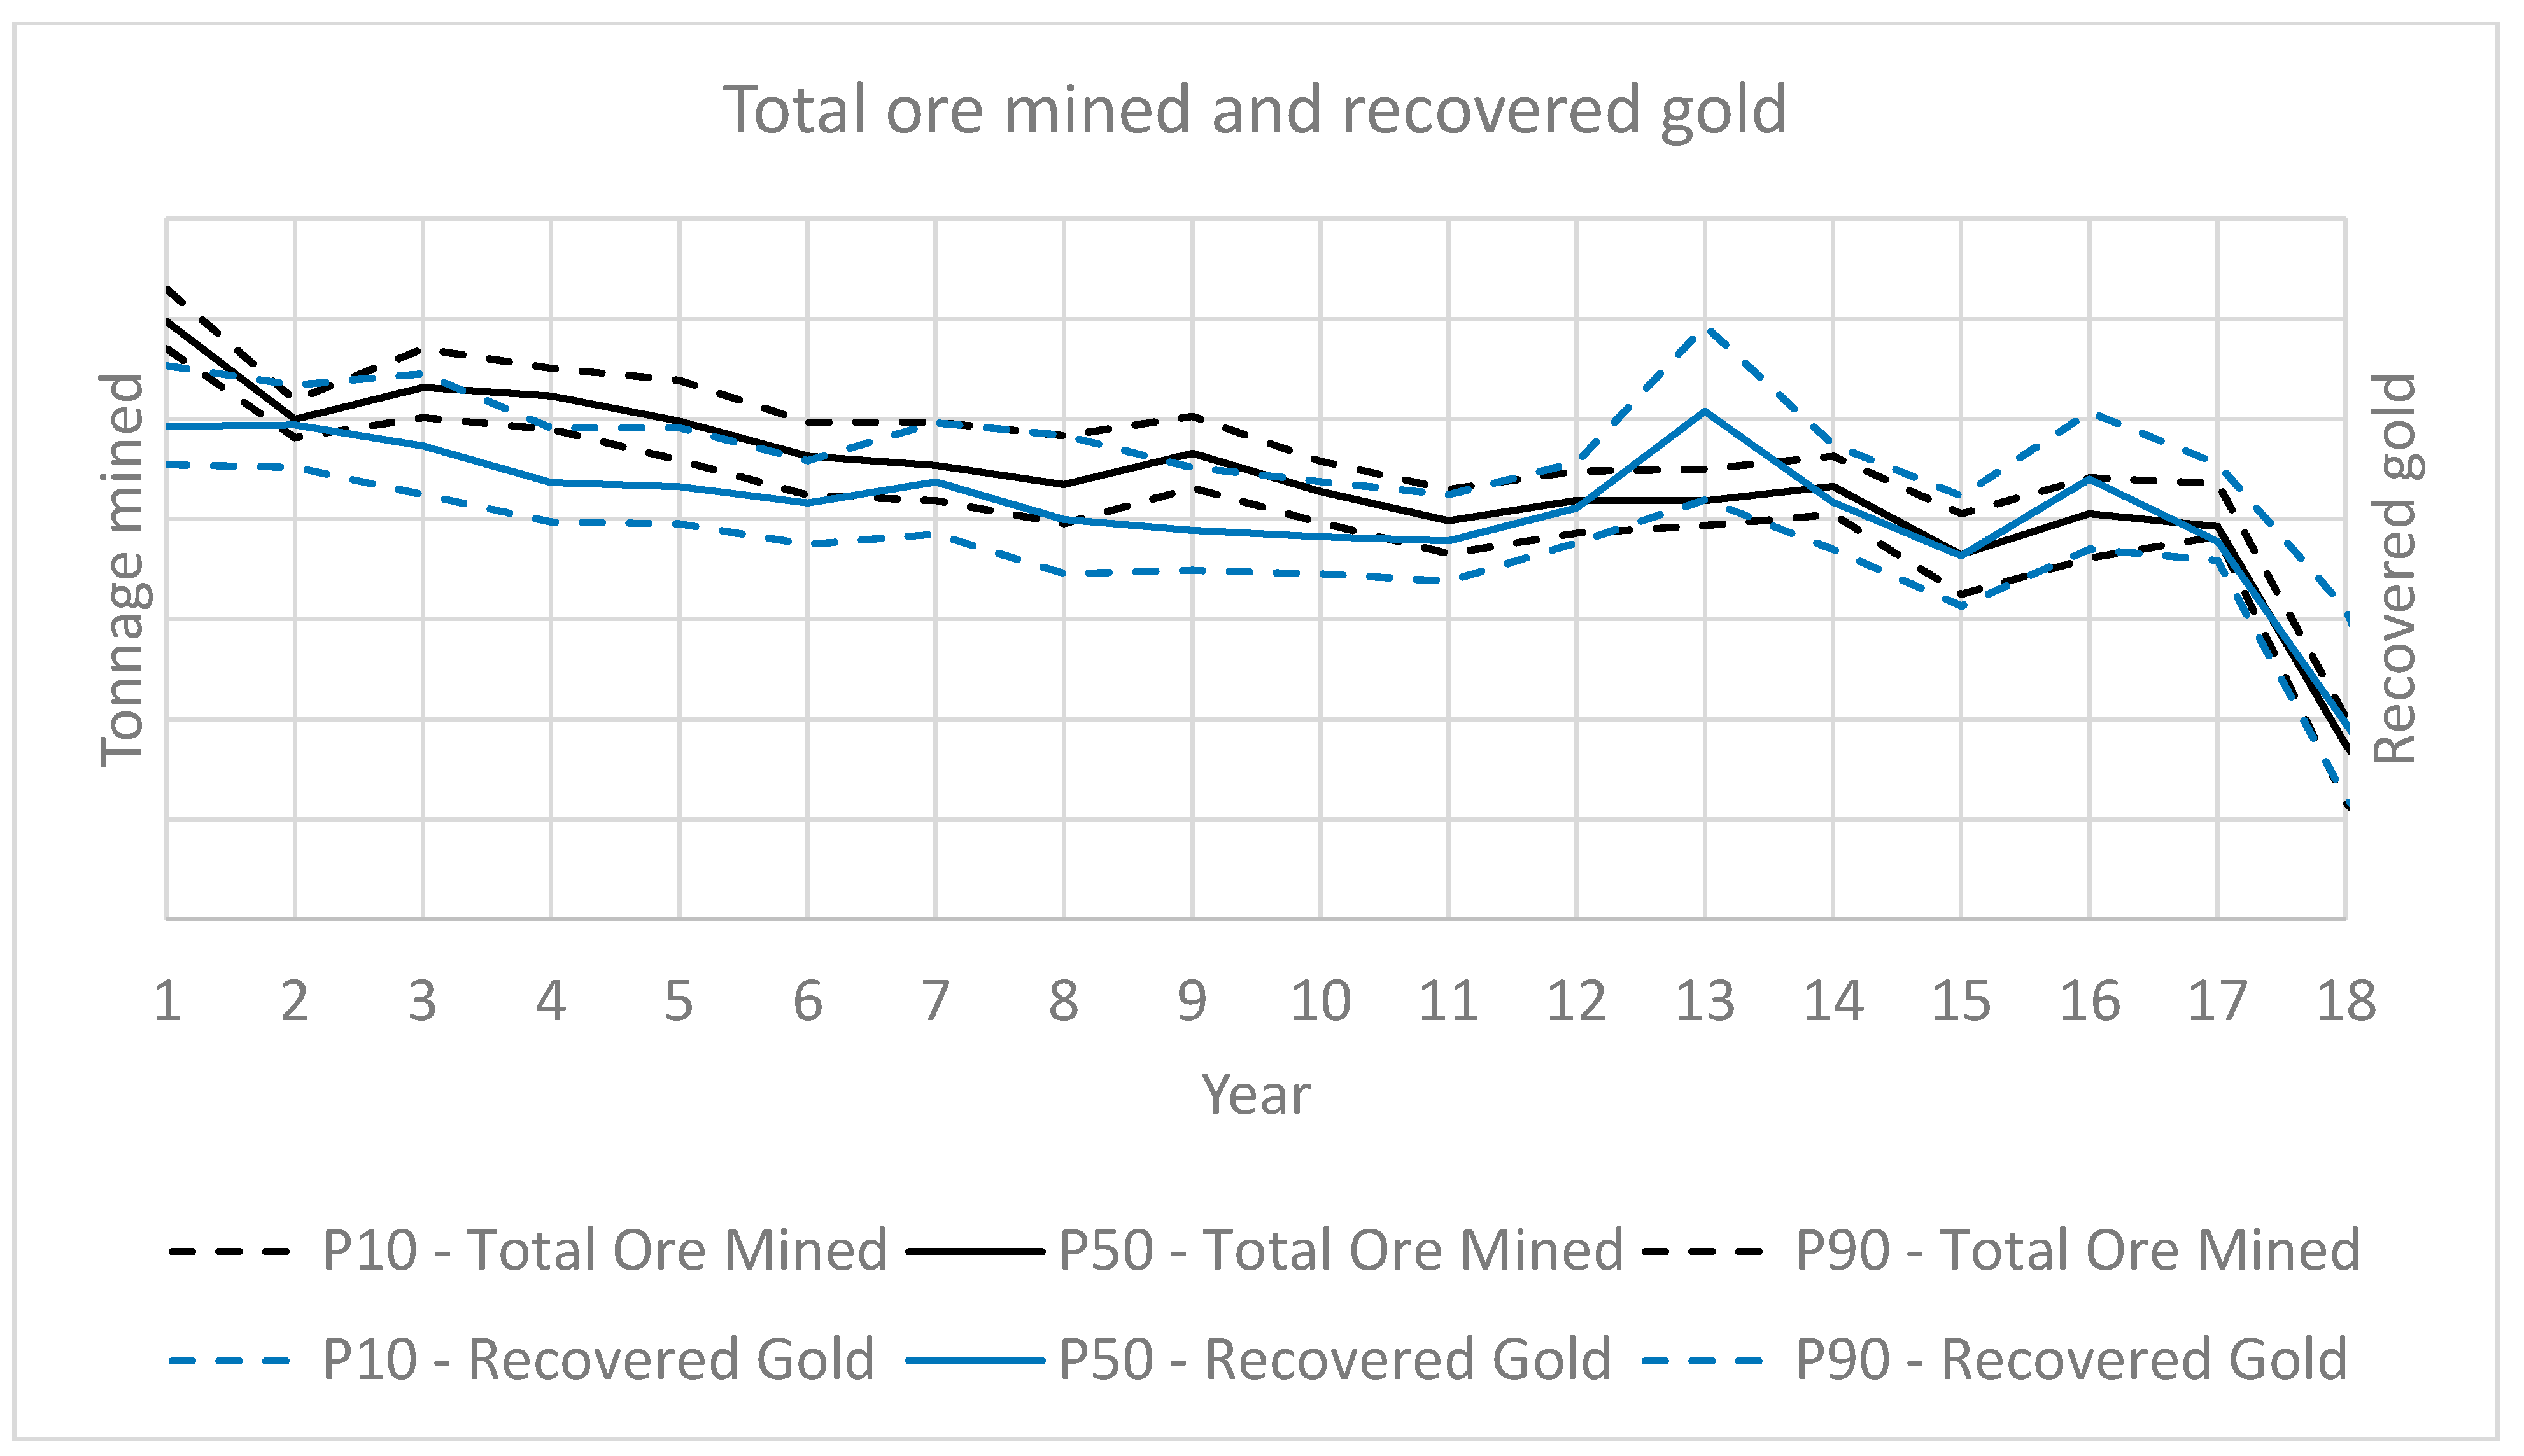
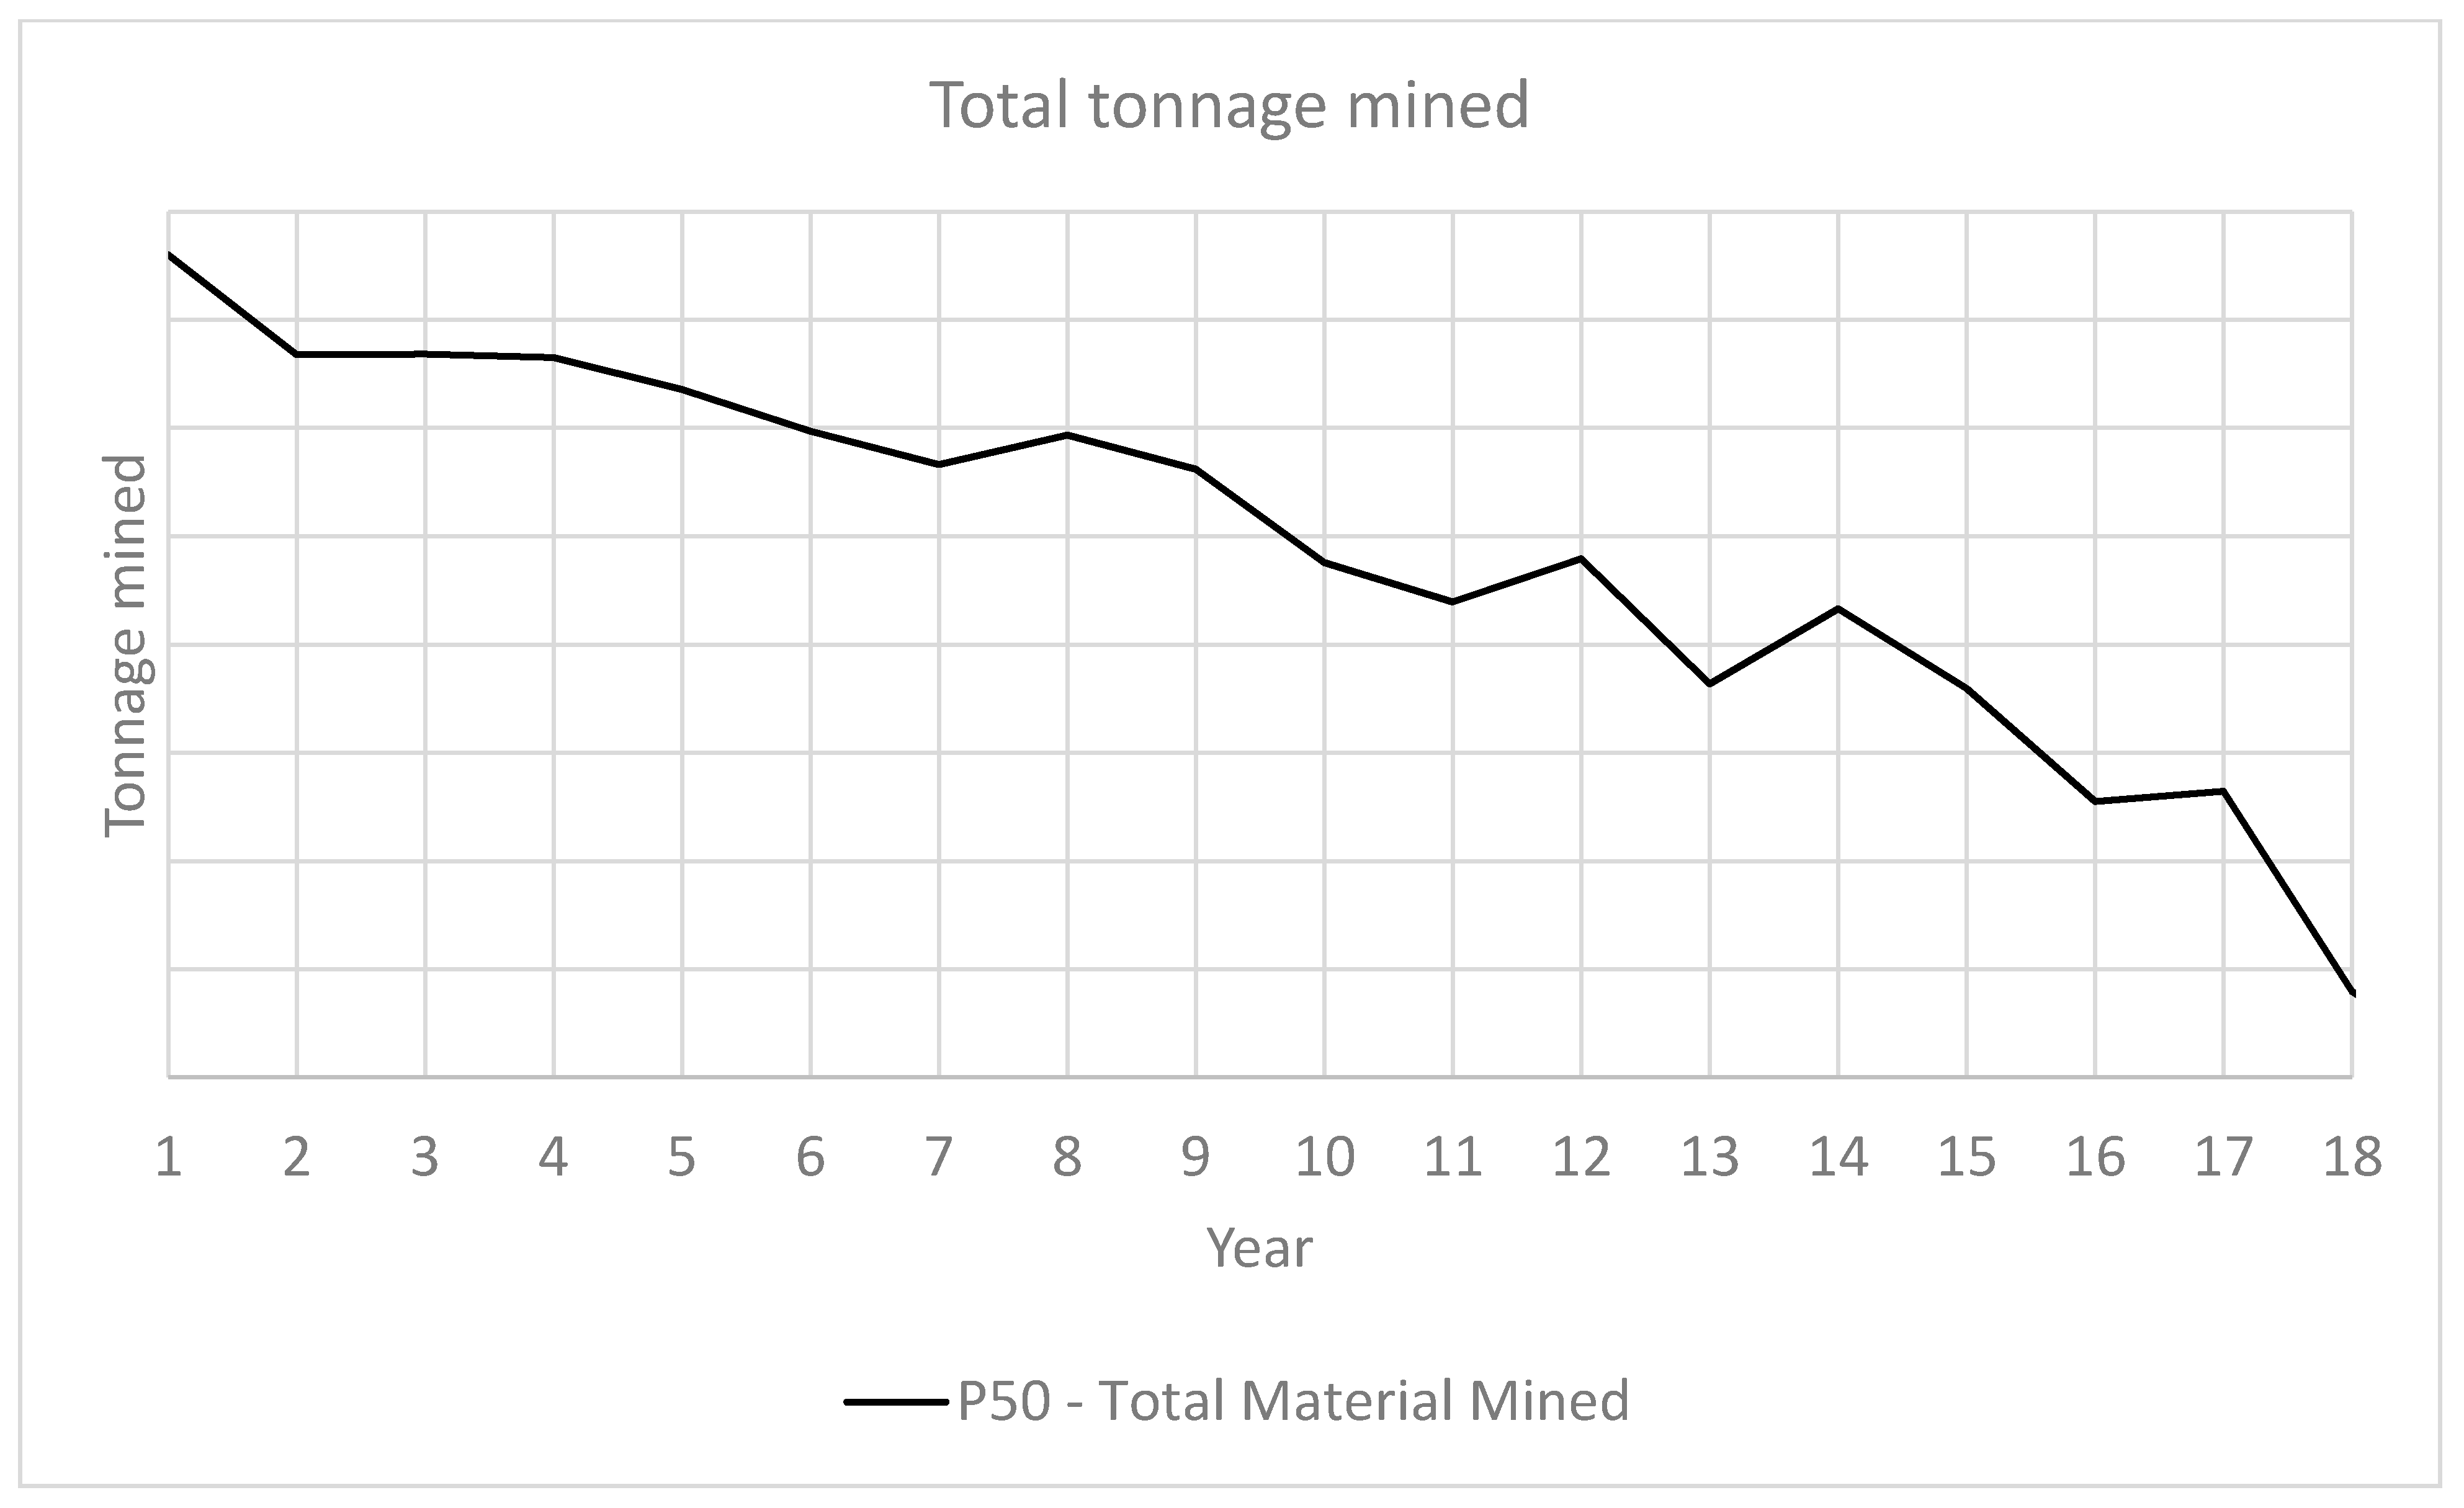
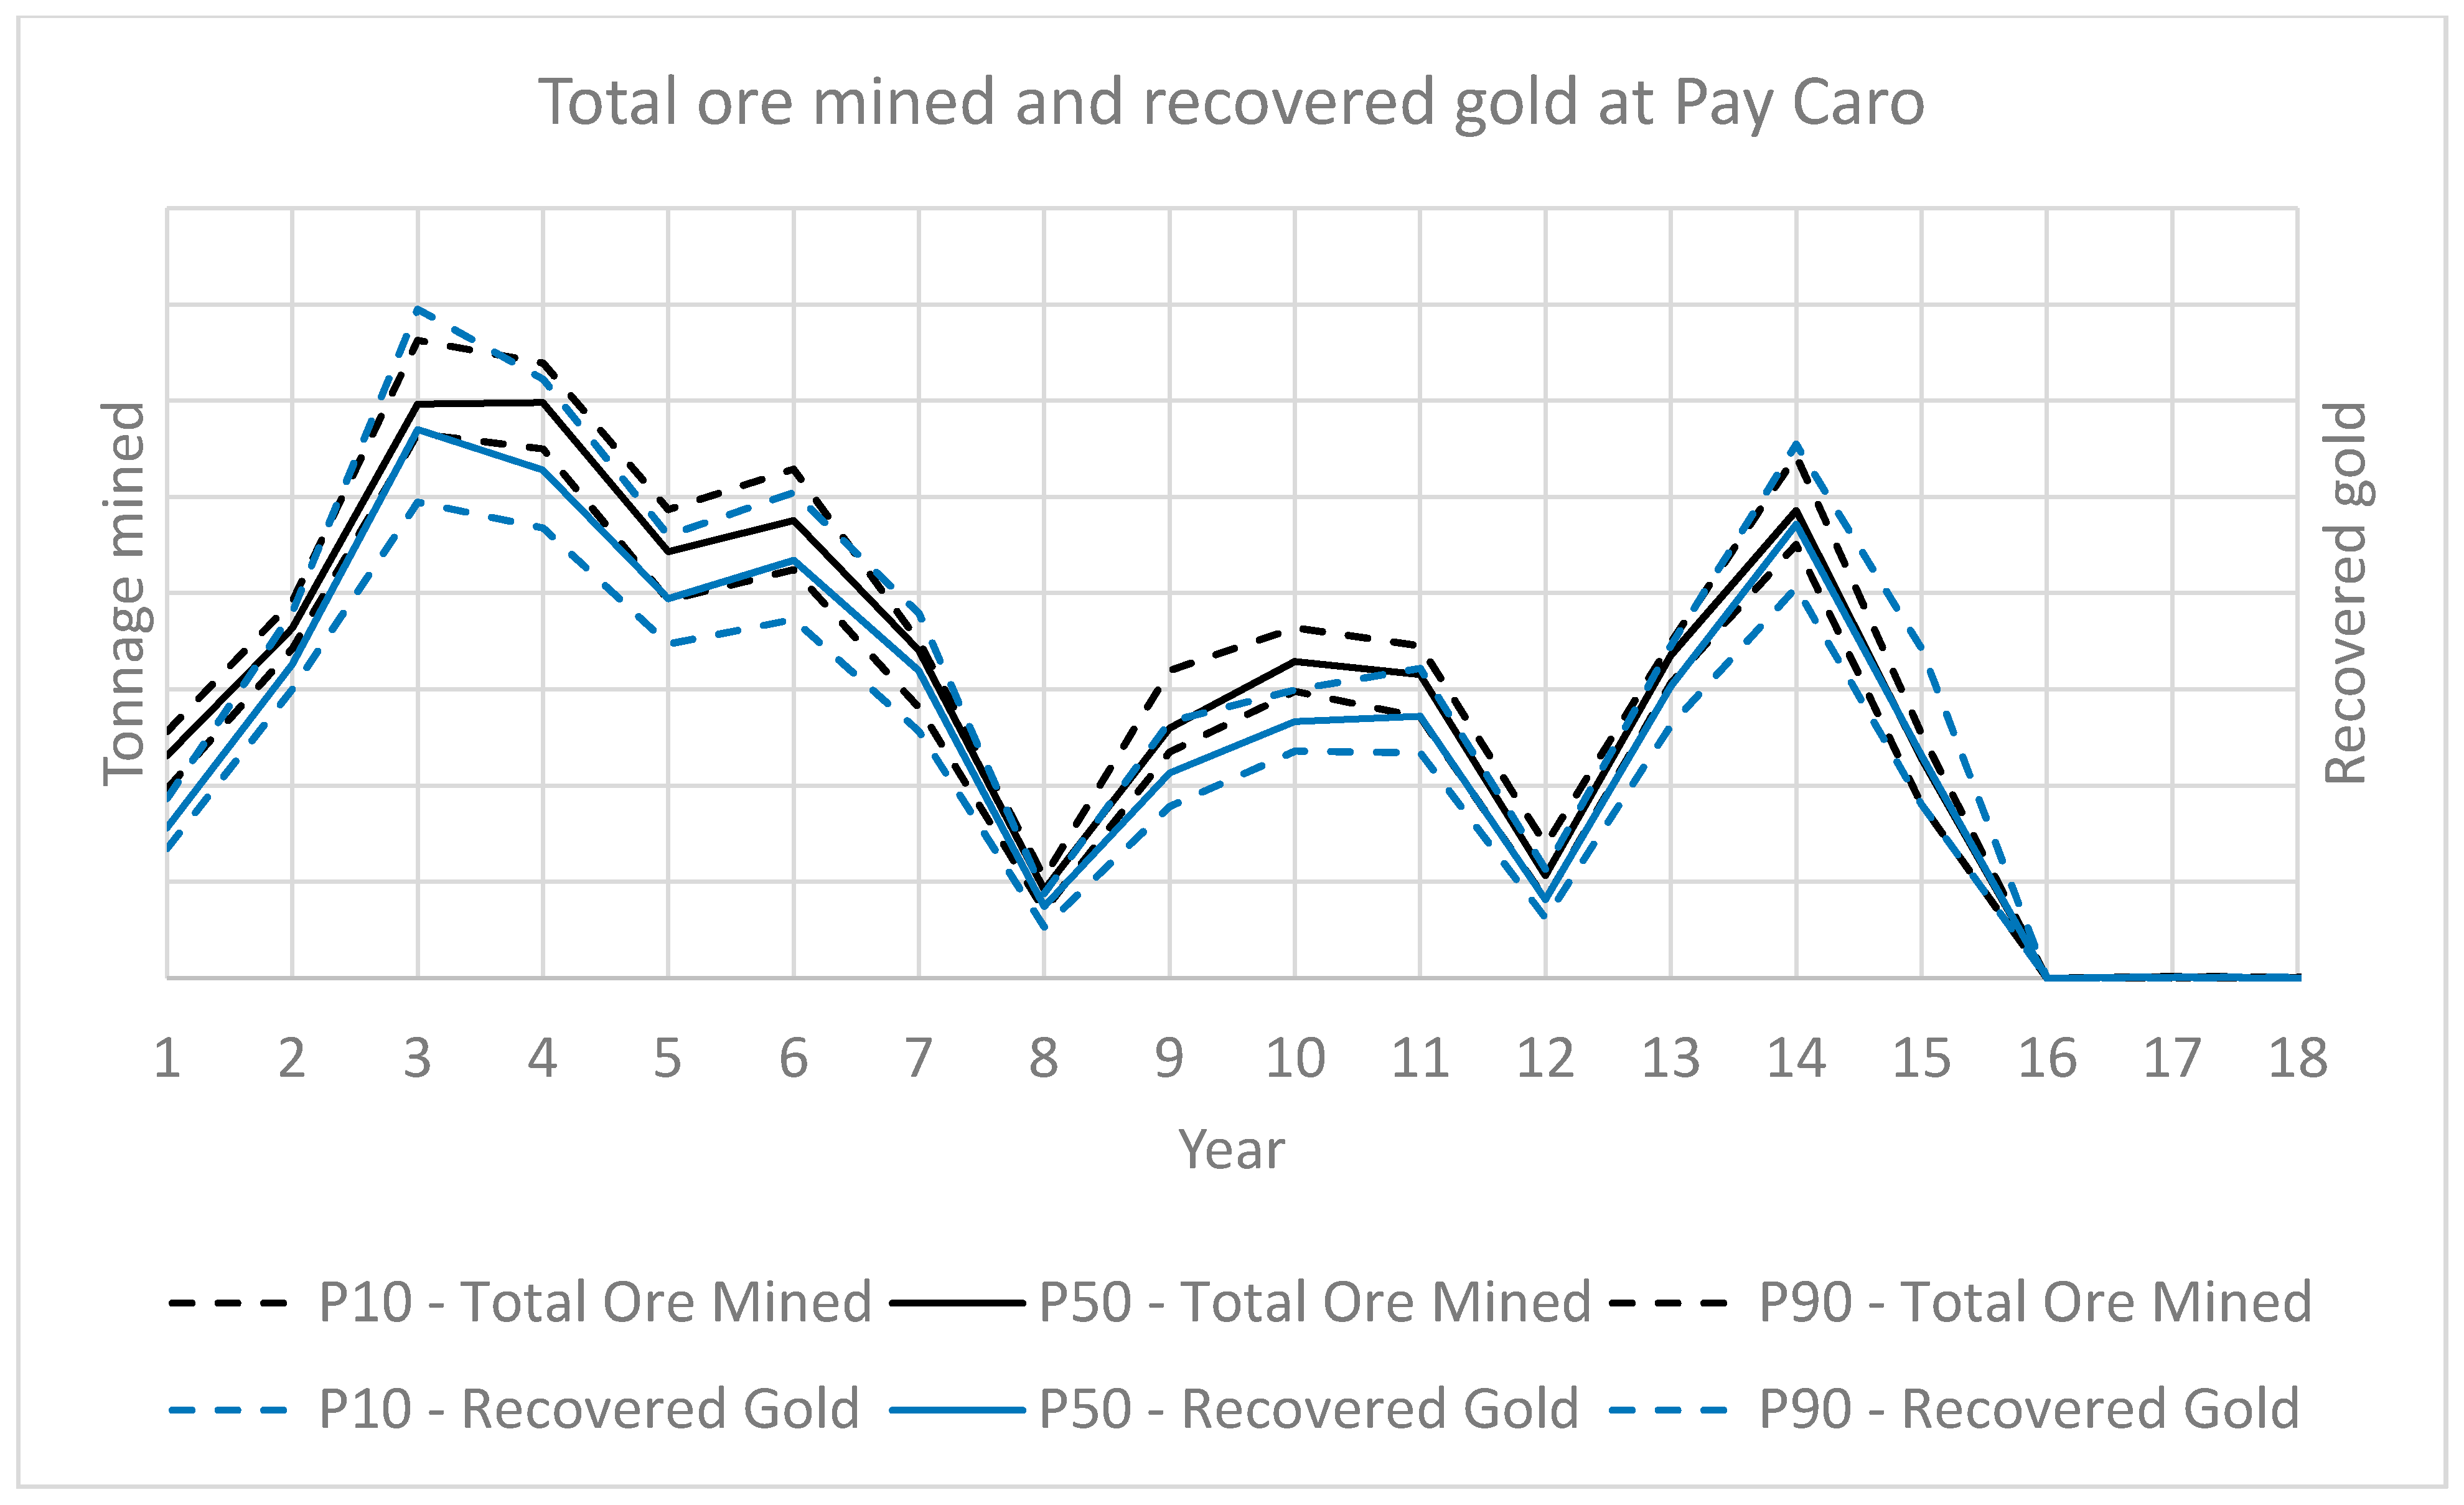
In the following figures, the results of the simultaneous stochastic optimization are represented, where applicable, by P10, P50, and P90. These represent the 10%, 50%, and 90% probabilities, respectively, of obtaining values below the corresponding forecast. The results of the case study are scaled for confidentiality reasons. The mining complex has an 18 year life, as shown in Figure 2 alongside the NPV results. Figure 3 presents the ore mined and the recovered gold over the life of the mining complex, and Figure 4 presents the tonnage mined throughout the long-term plan of the mining complex. Figure 5 shows the production schedules generated, which as noted in previous sections, comply with smoothing and sink rate constraints. Figure 6, Figure 7 and Figure 8 present the ore tonnage mined and the recovered gold over the life-of-mine for Rosebel Mine, Pay Caro Mine, and Royal Hill Mine, respectively.
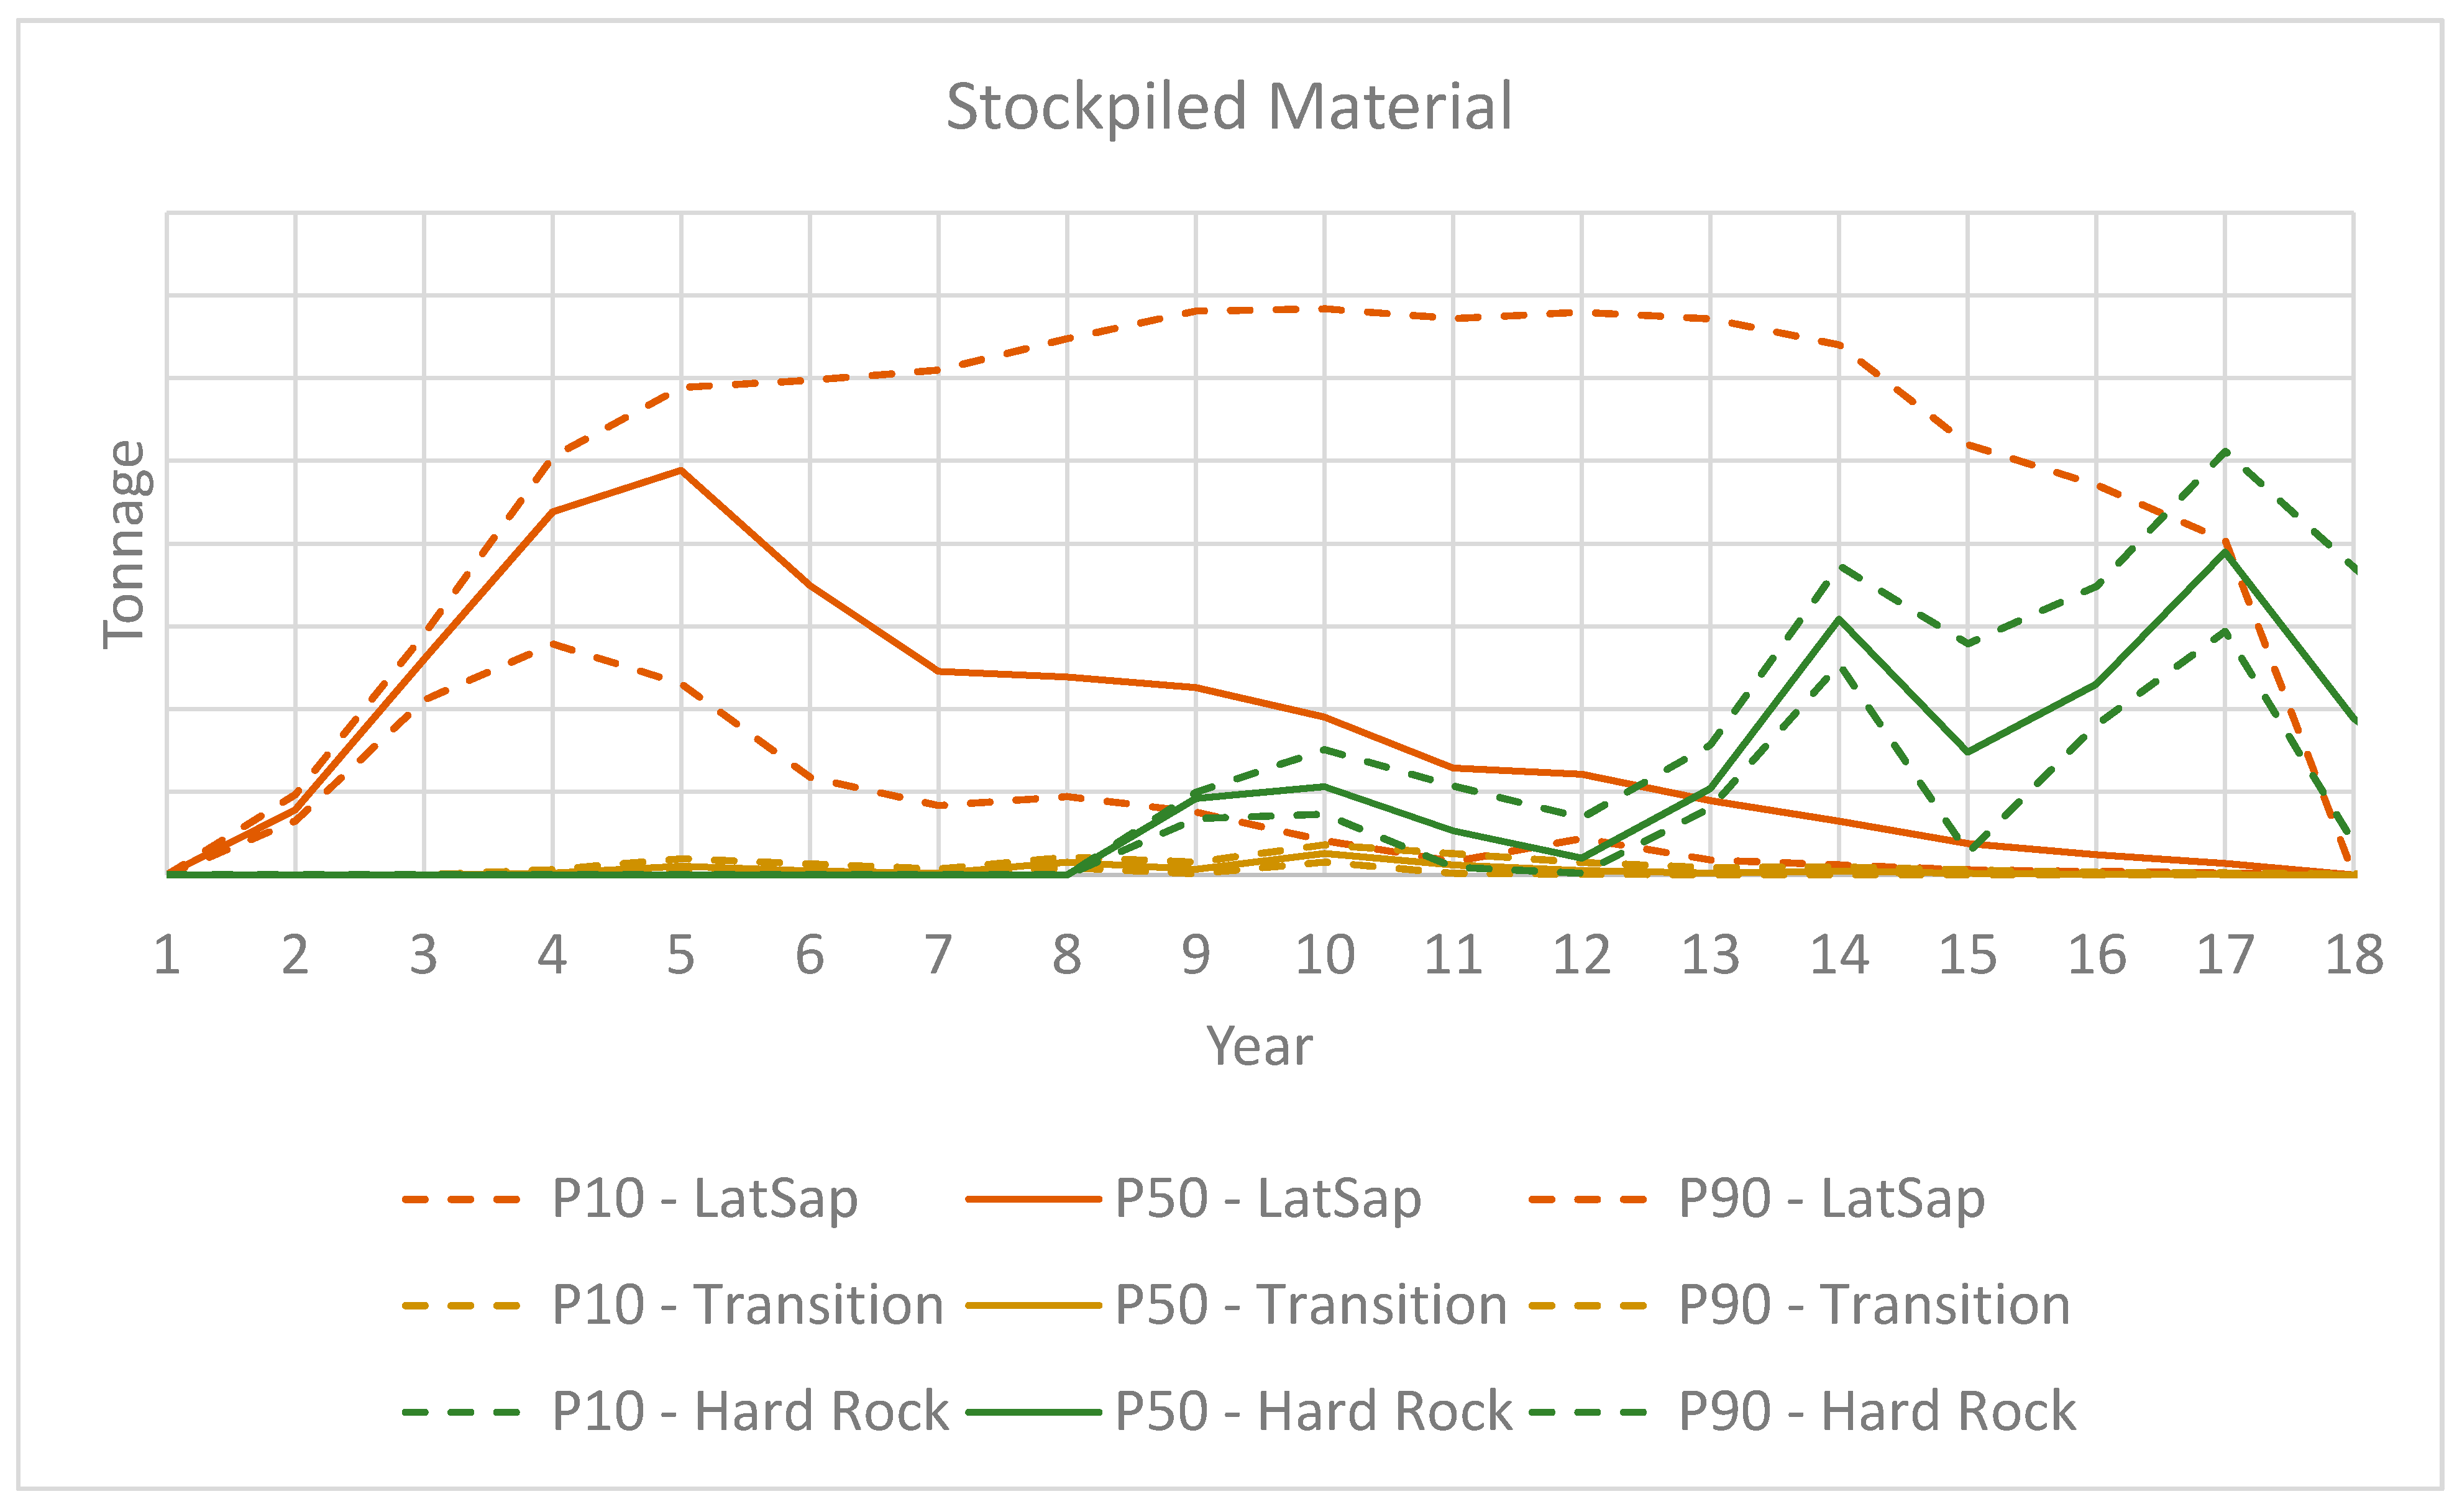
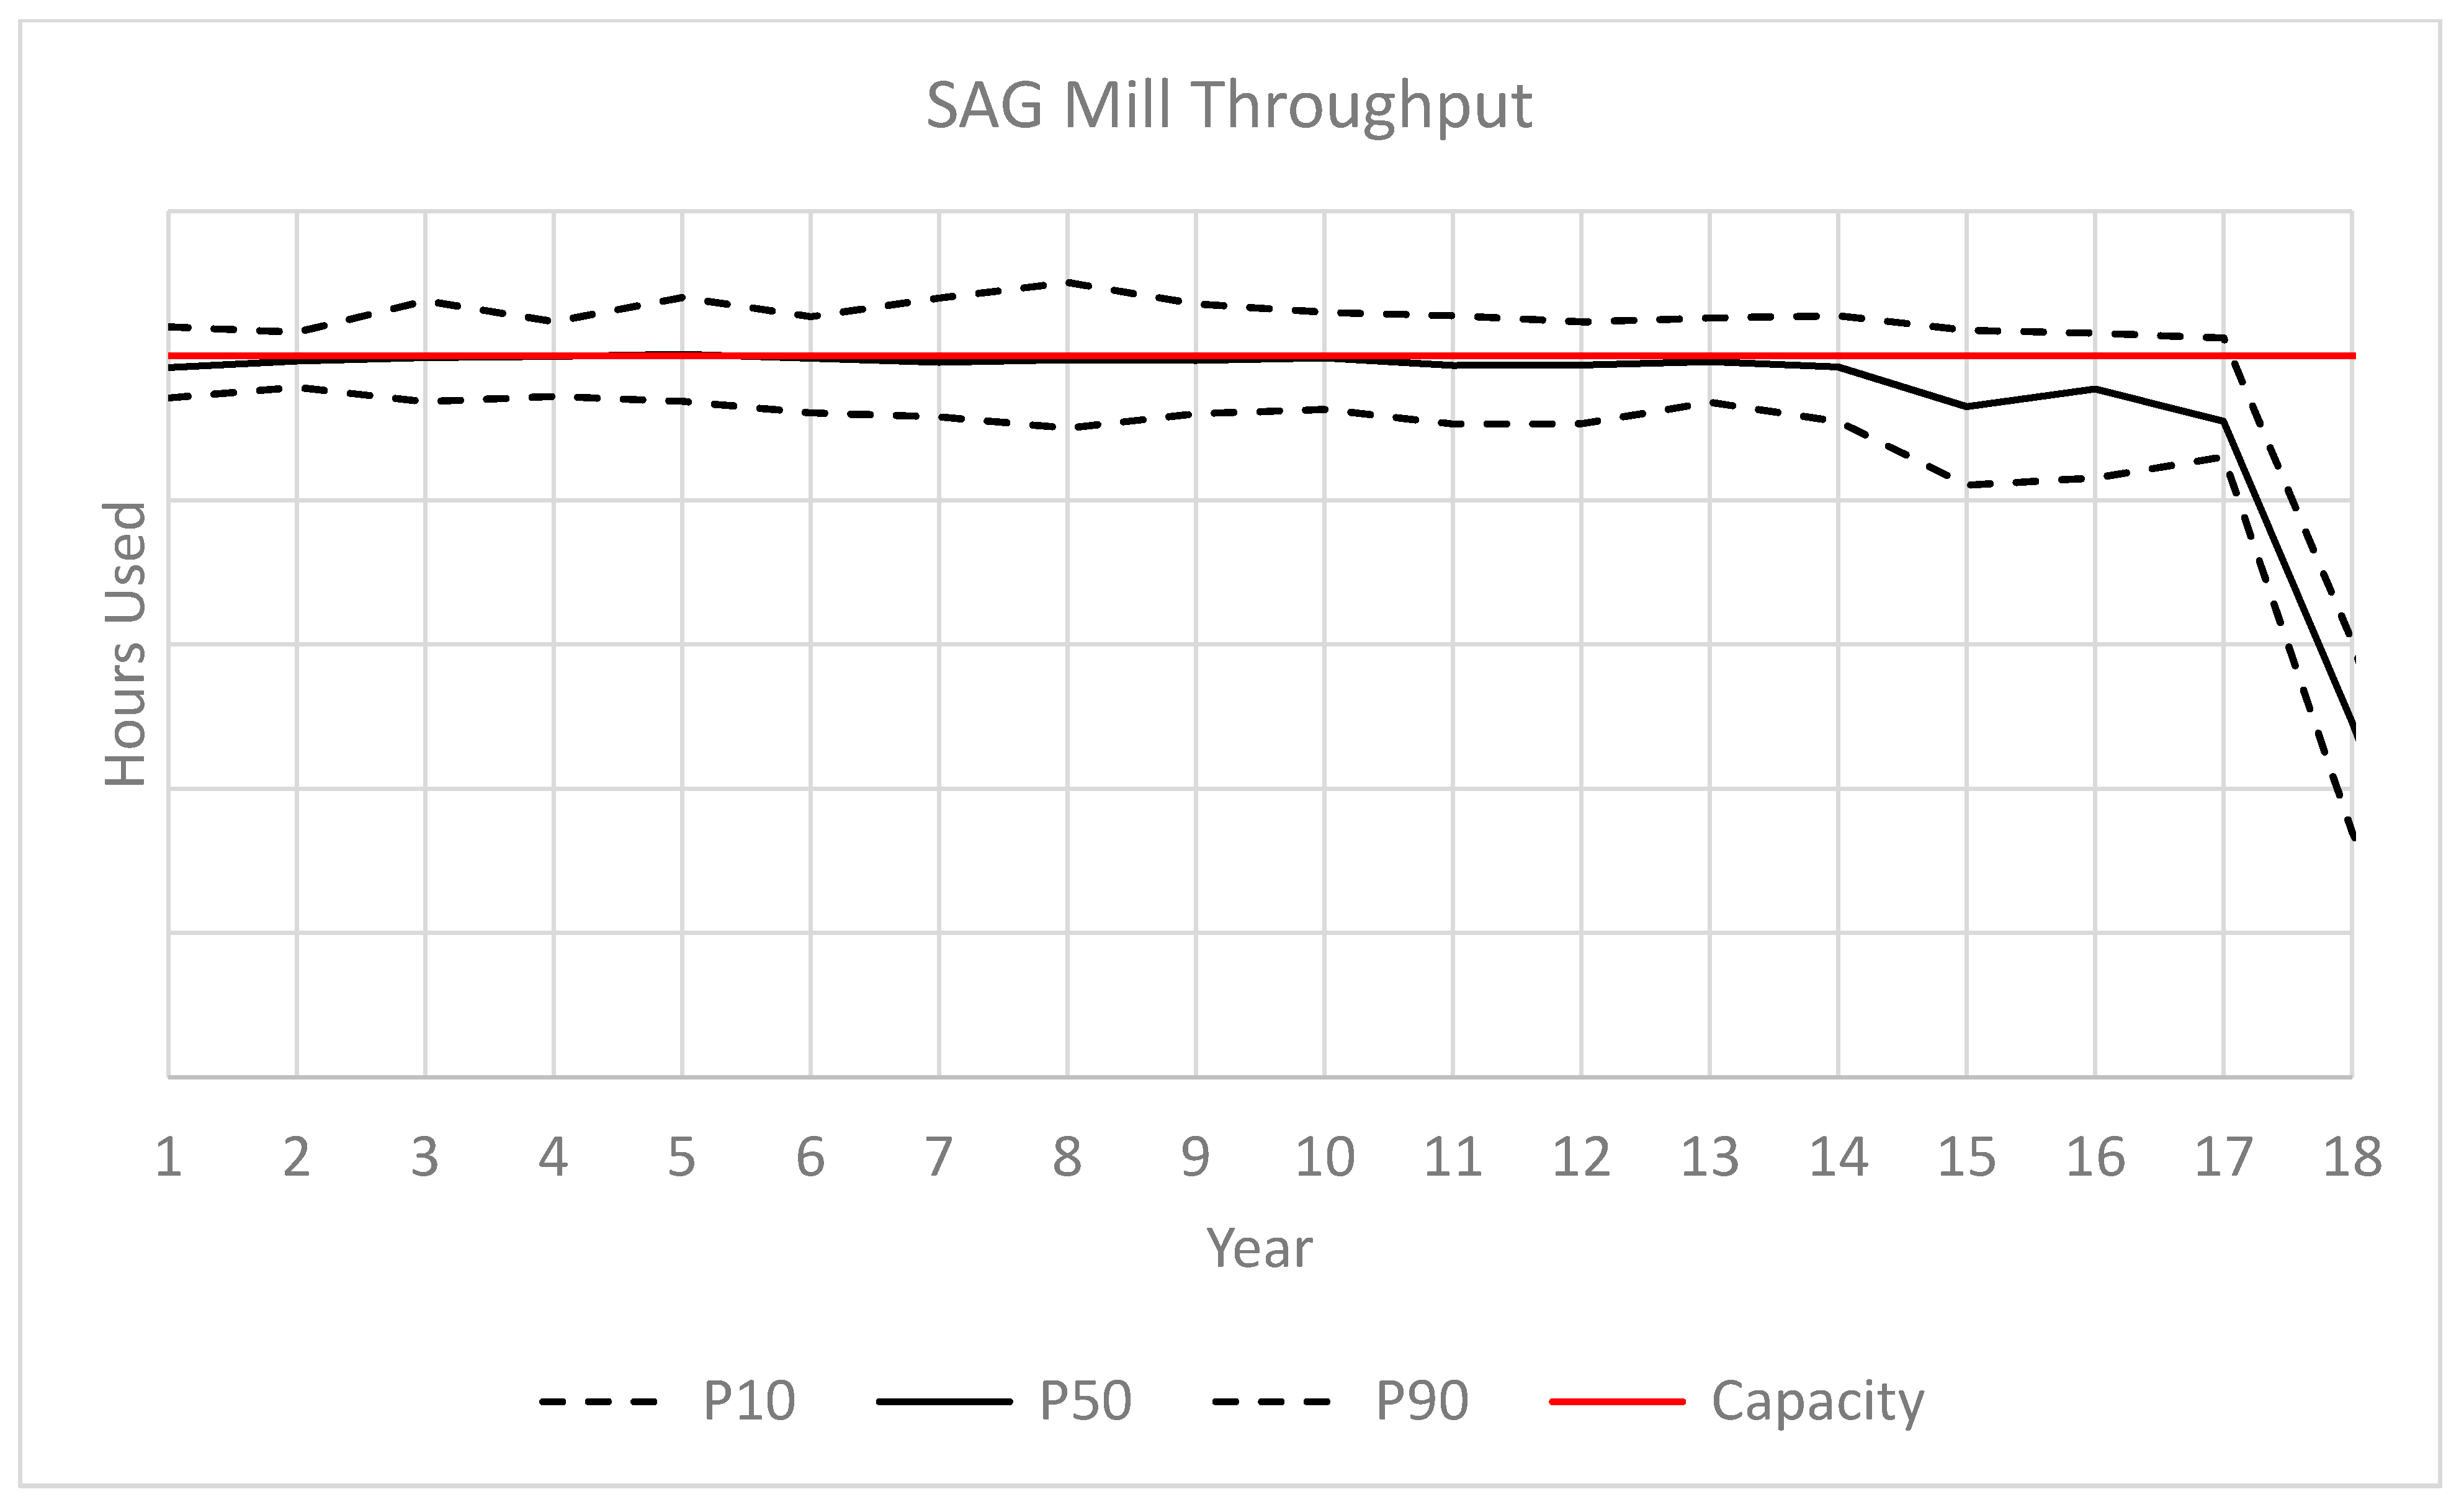
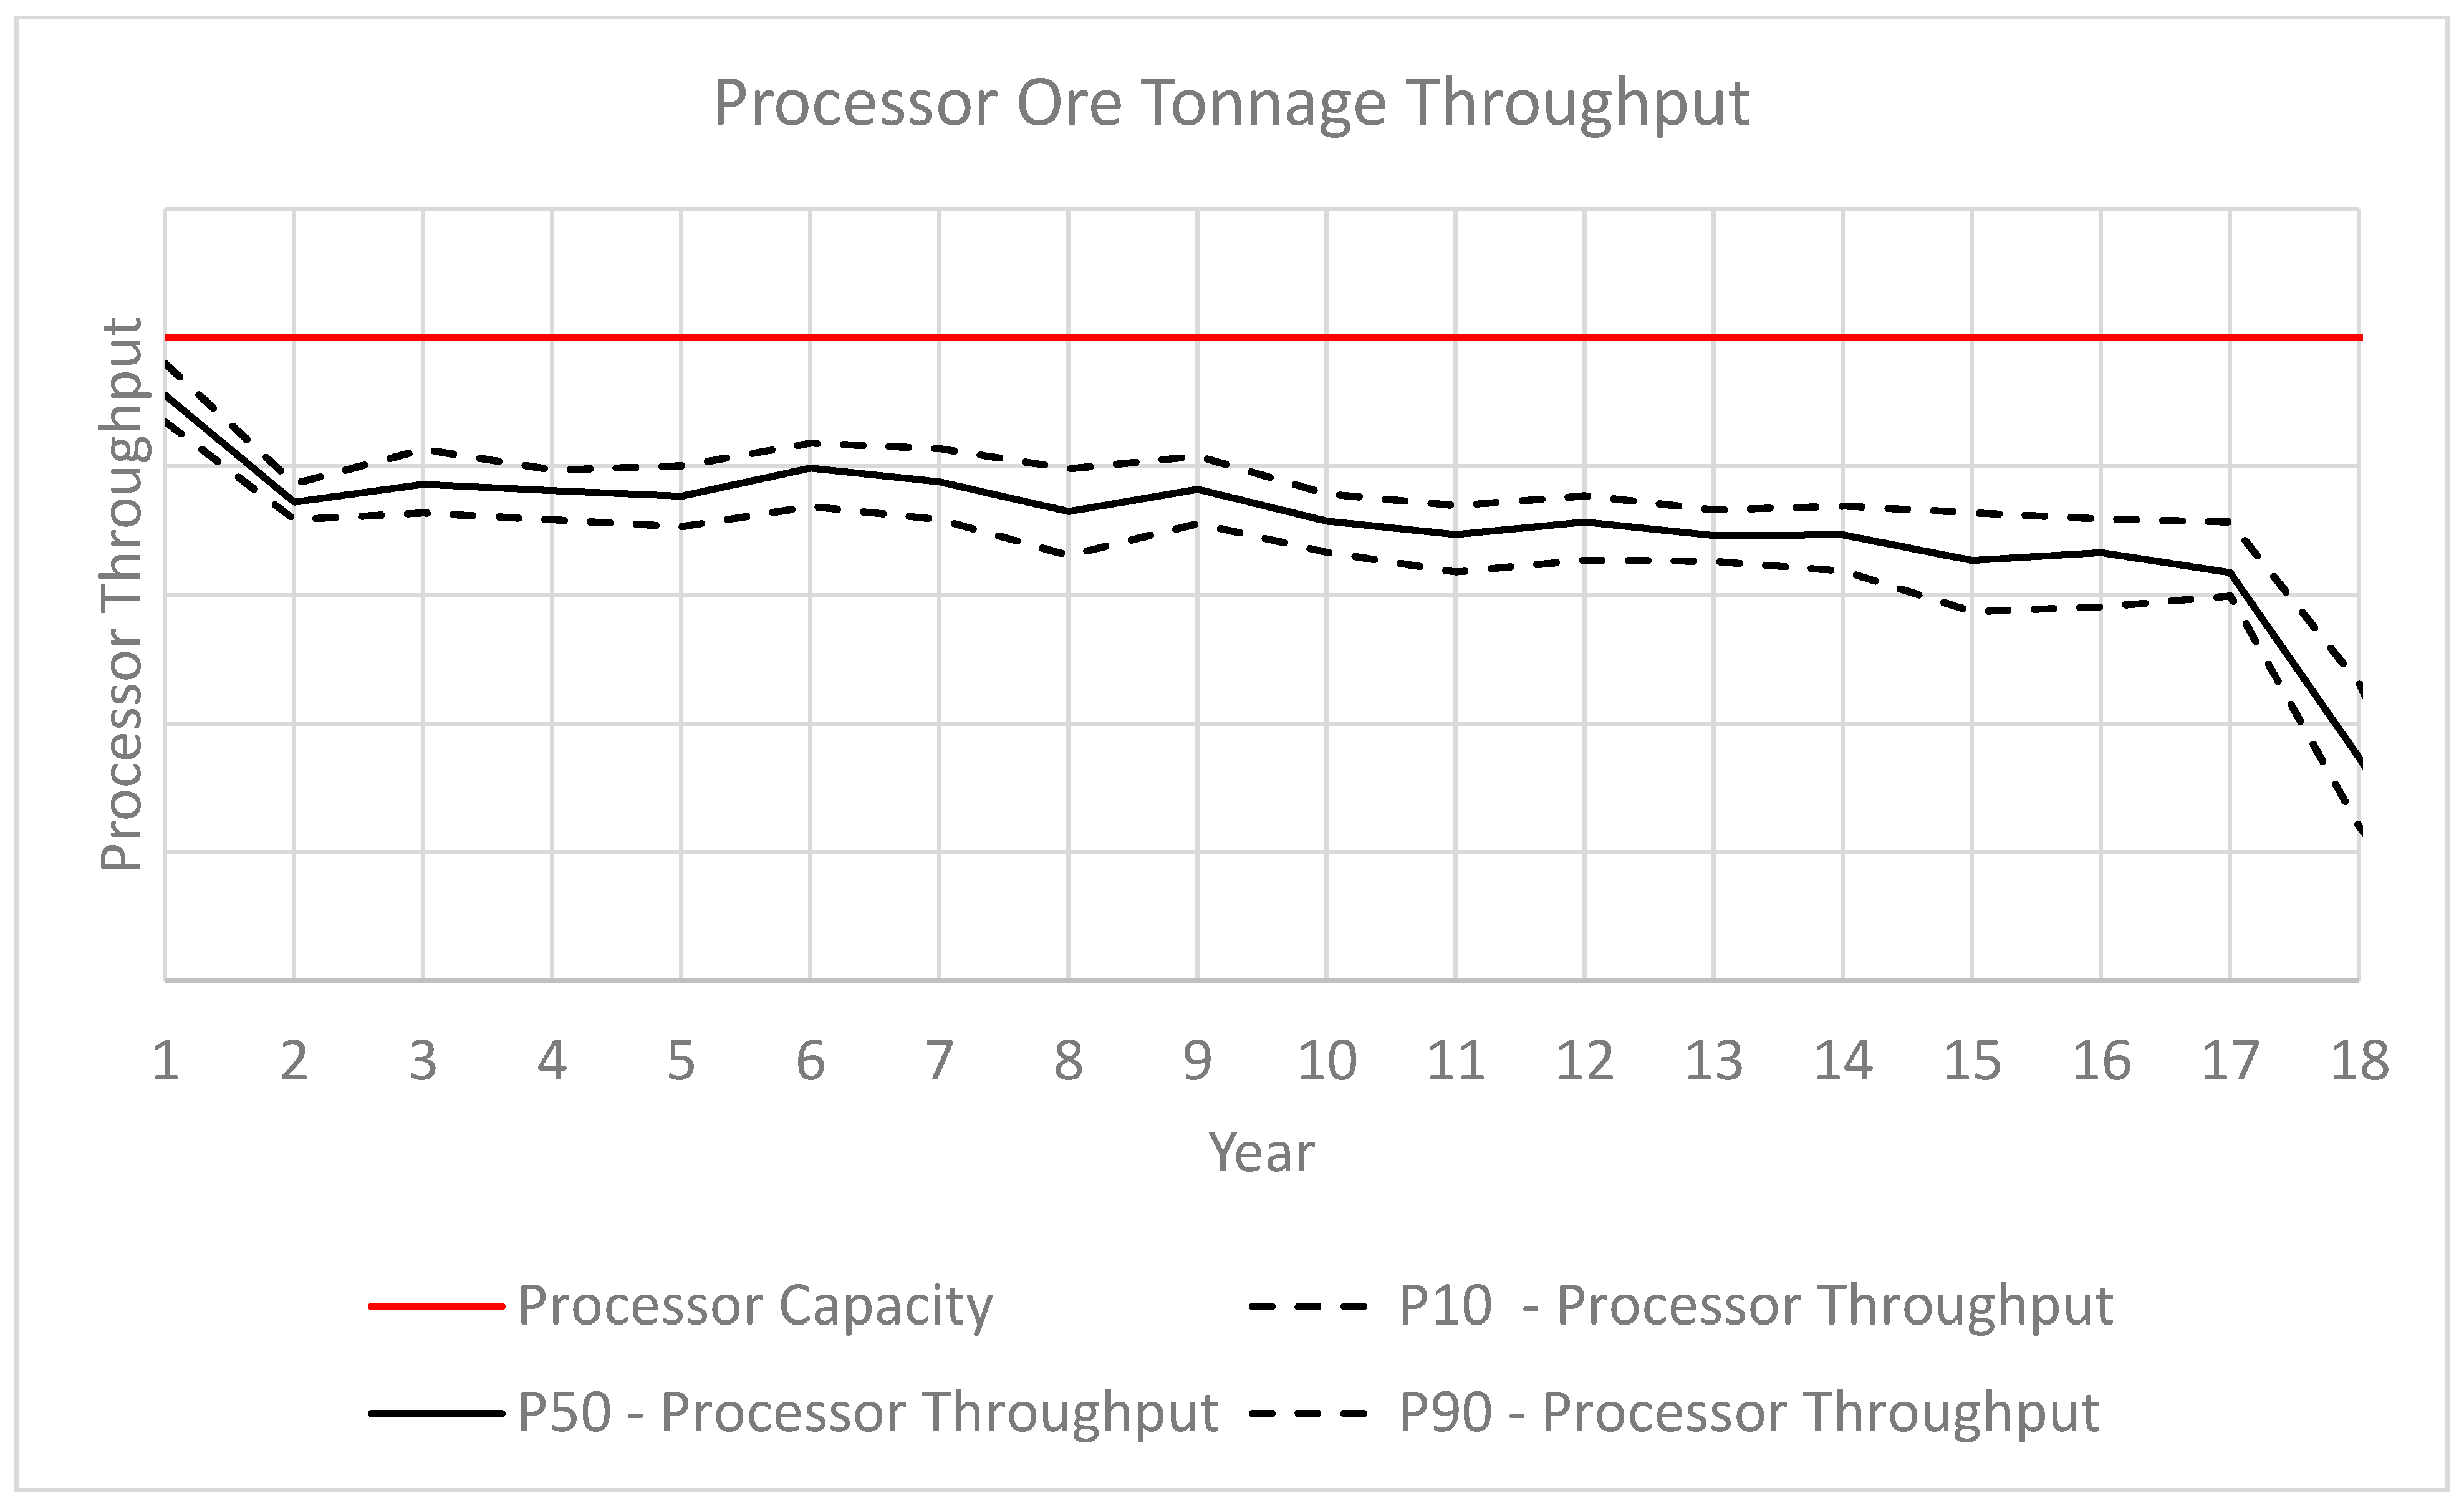
The extracted ore material can be sent to either the appropriate stockpile or directly to the processor. Figure 9 displays the amount of material stockpiled throughout the life-of-mine. The laterite-saprolite material is stockpiled to a greater degree in the earlier years and is reclaimed over time. Toward the end of the mining complex life, the hard rock material is stockpiled to a greater extent, while the transition material is rarely stockpiled. The ore that is reclaimed from the stockpiles or sent directly to the processor is crushed at the SAG mill. Each material type has a different throughput rate at the SAG mill, based on the material hardness. As such, a constraint is placed on the SAG mill availability, rather than on tonnage capacity (Figure 10). The SAG mill is used to capacity; however, the processor throughput capacity (Figure 11) and the mining capacity (Figure 4) are not reached throughout the long-term plan of the mining complex, documenting that the SAG mill is a bottleneck for the mining complex.
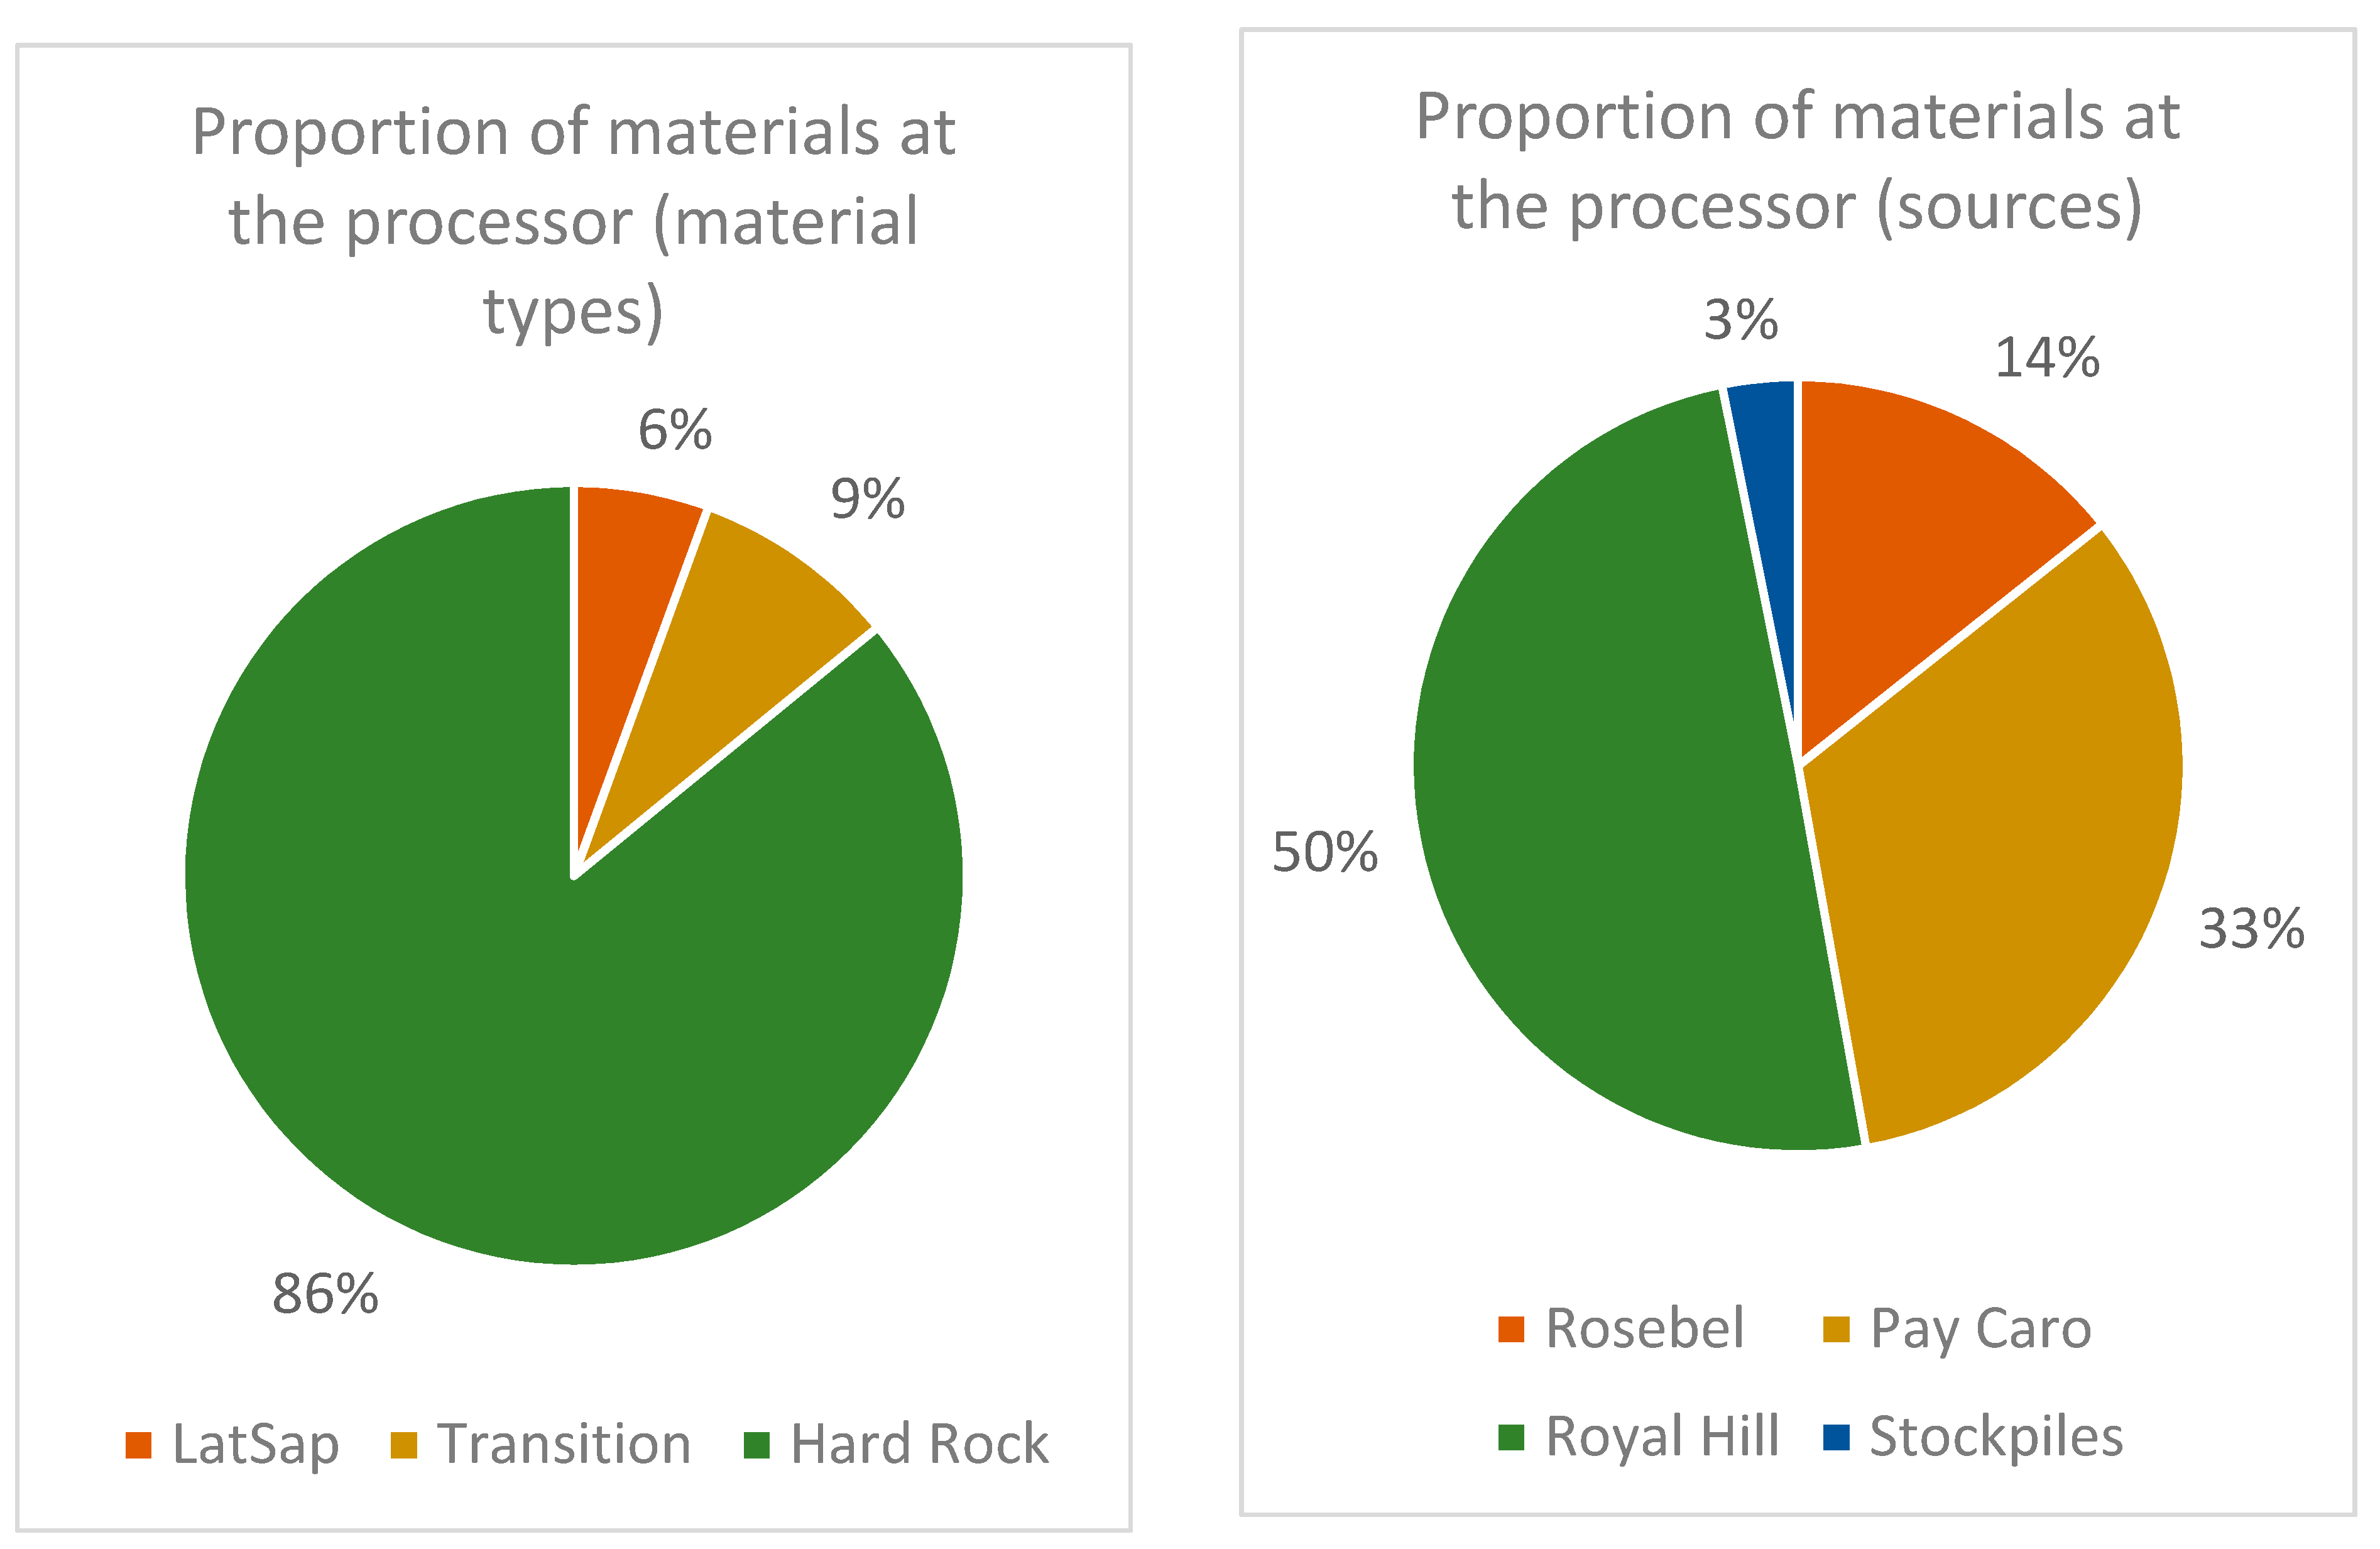
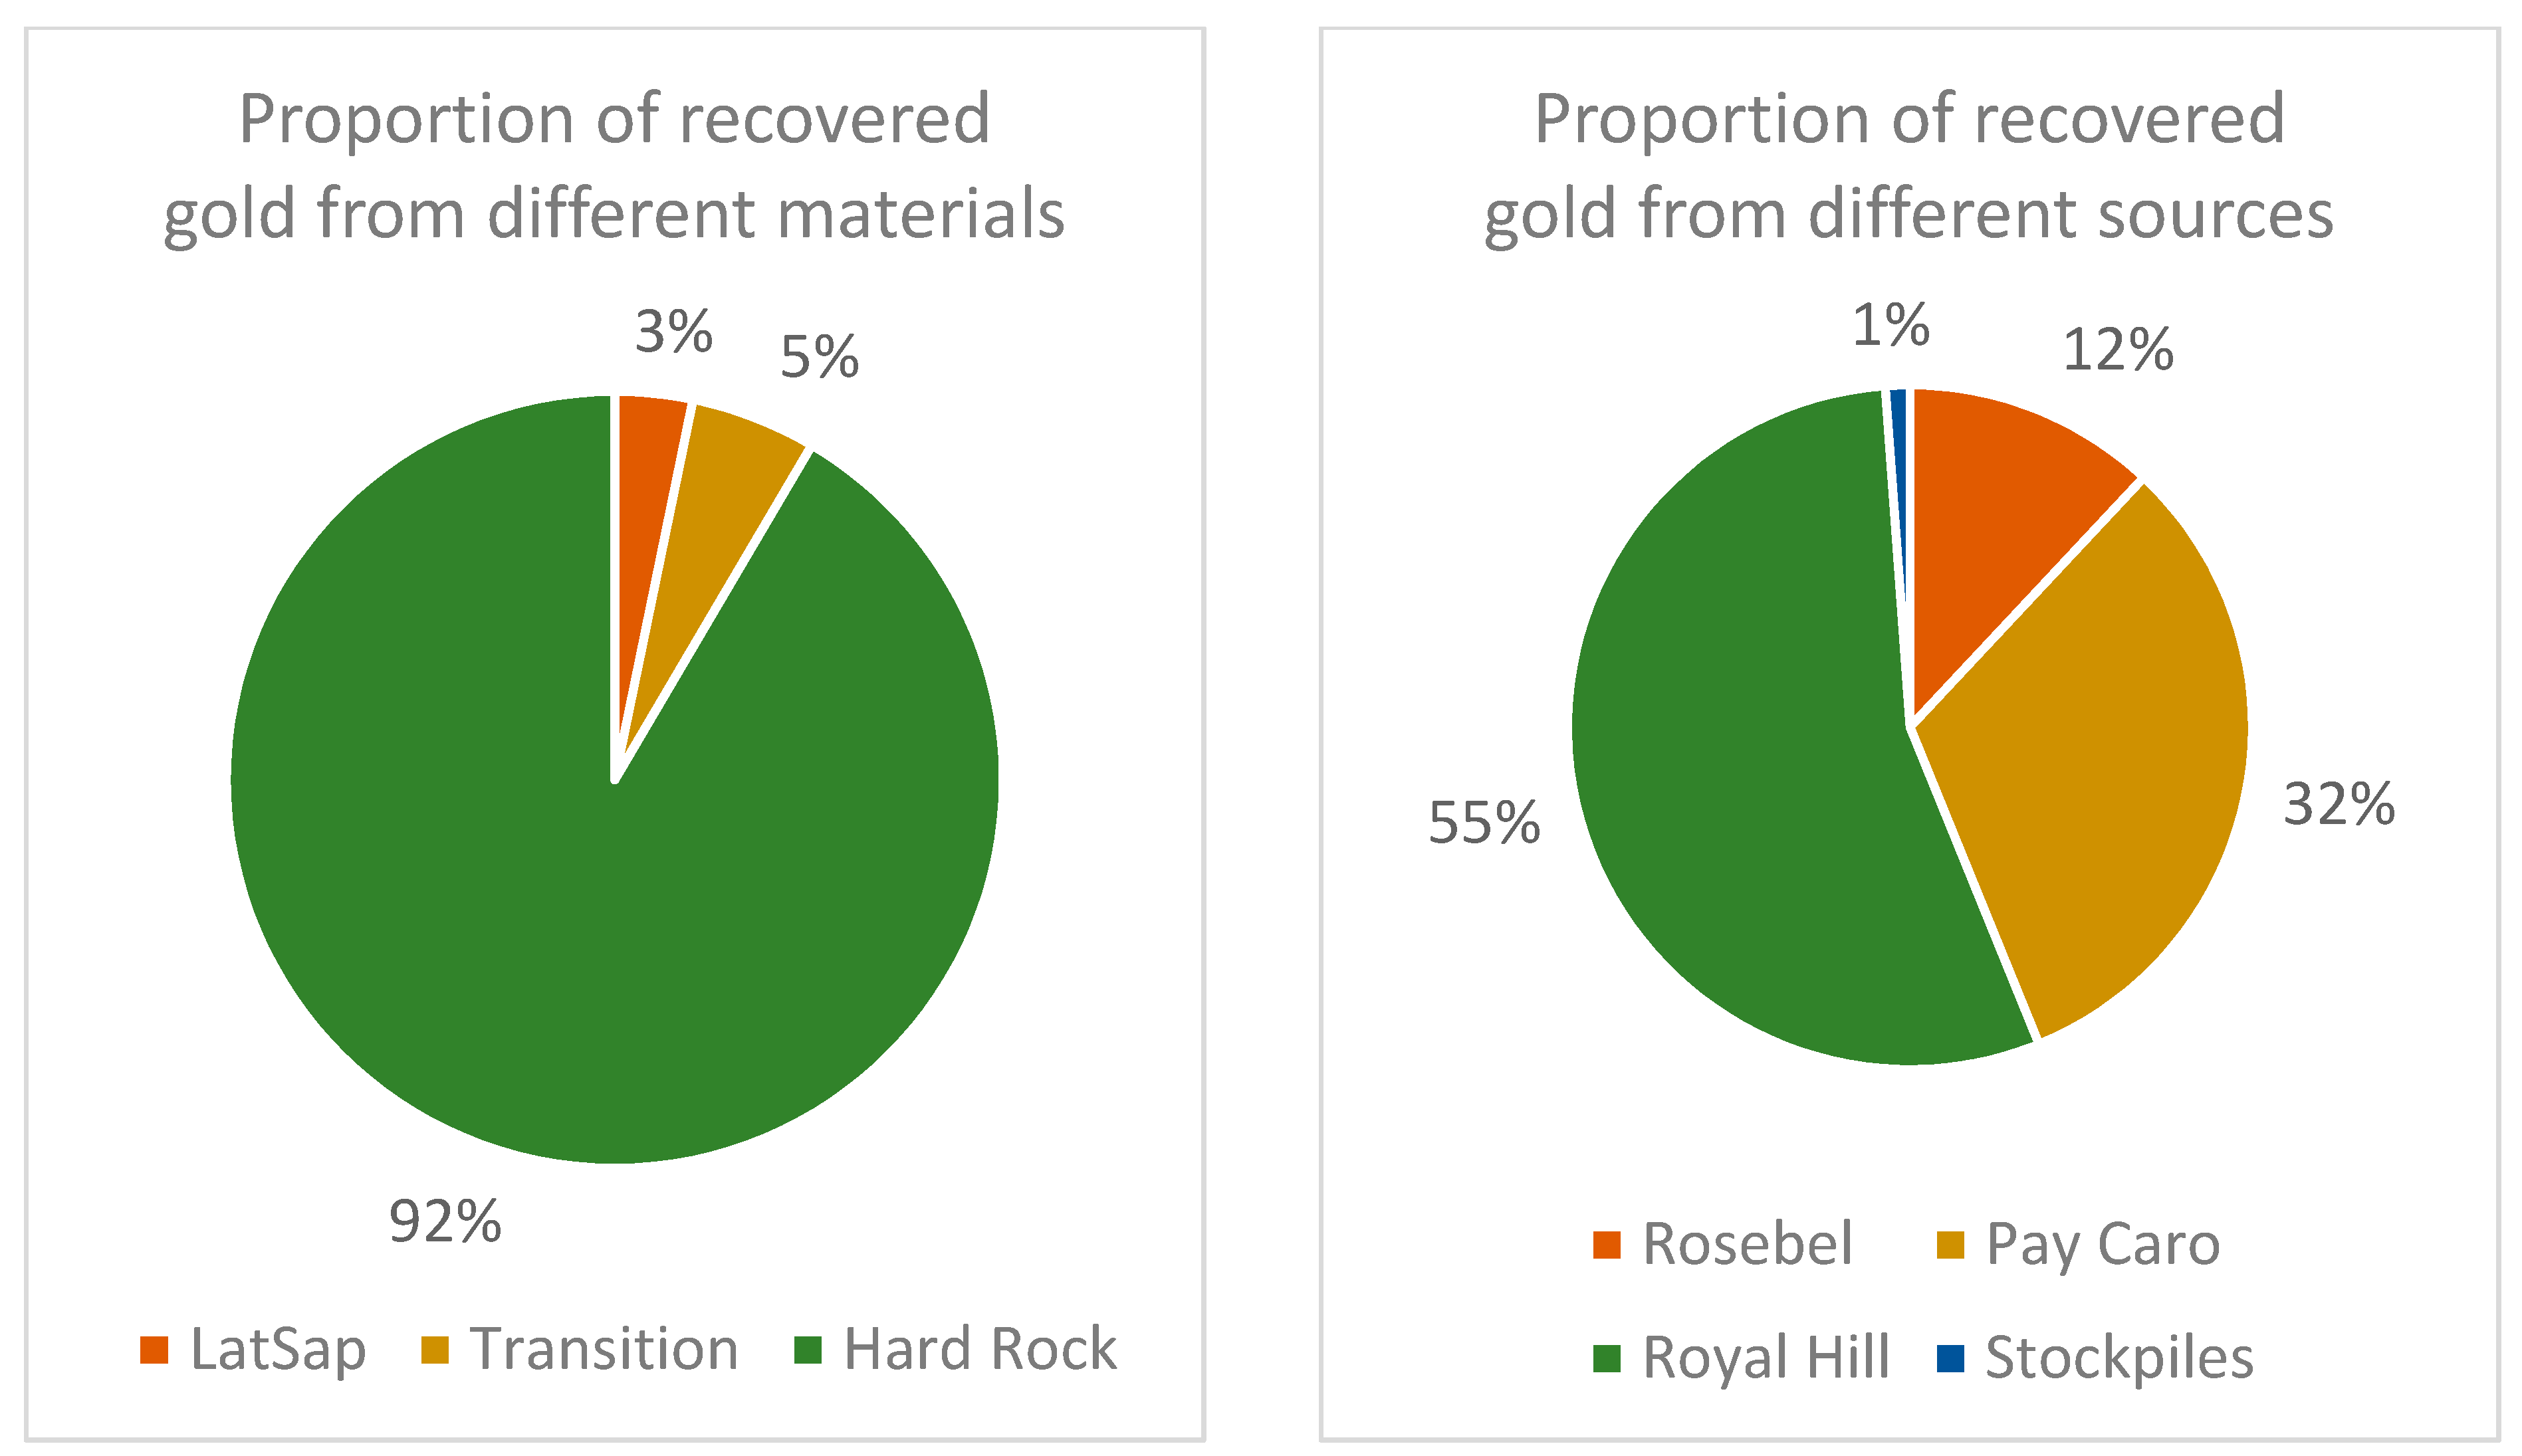
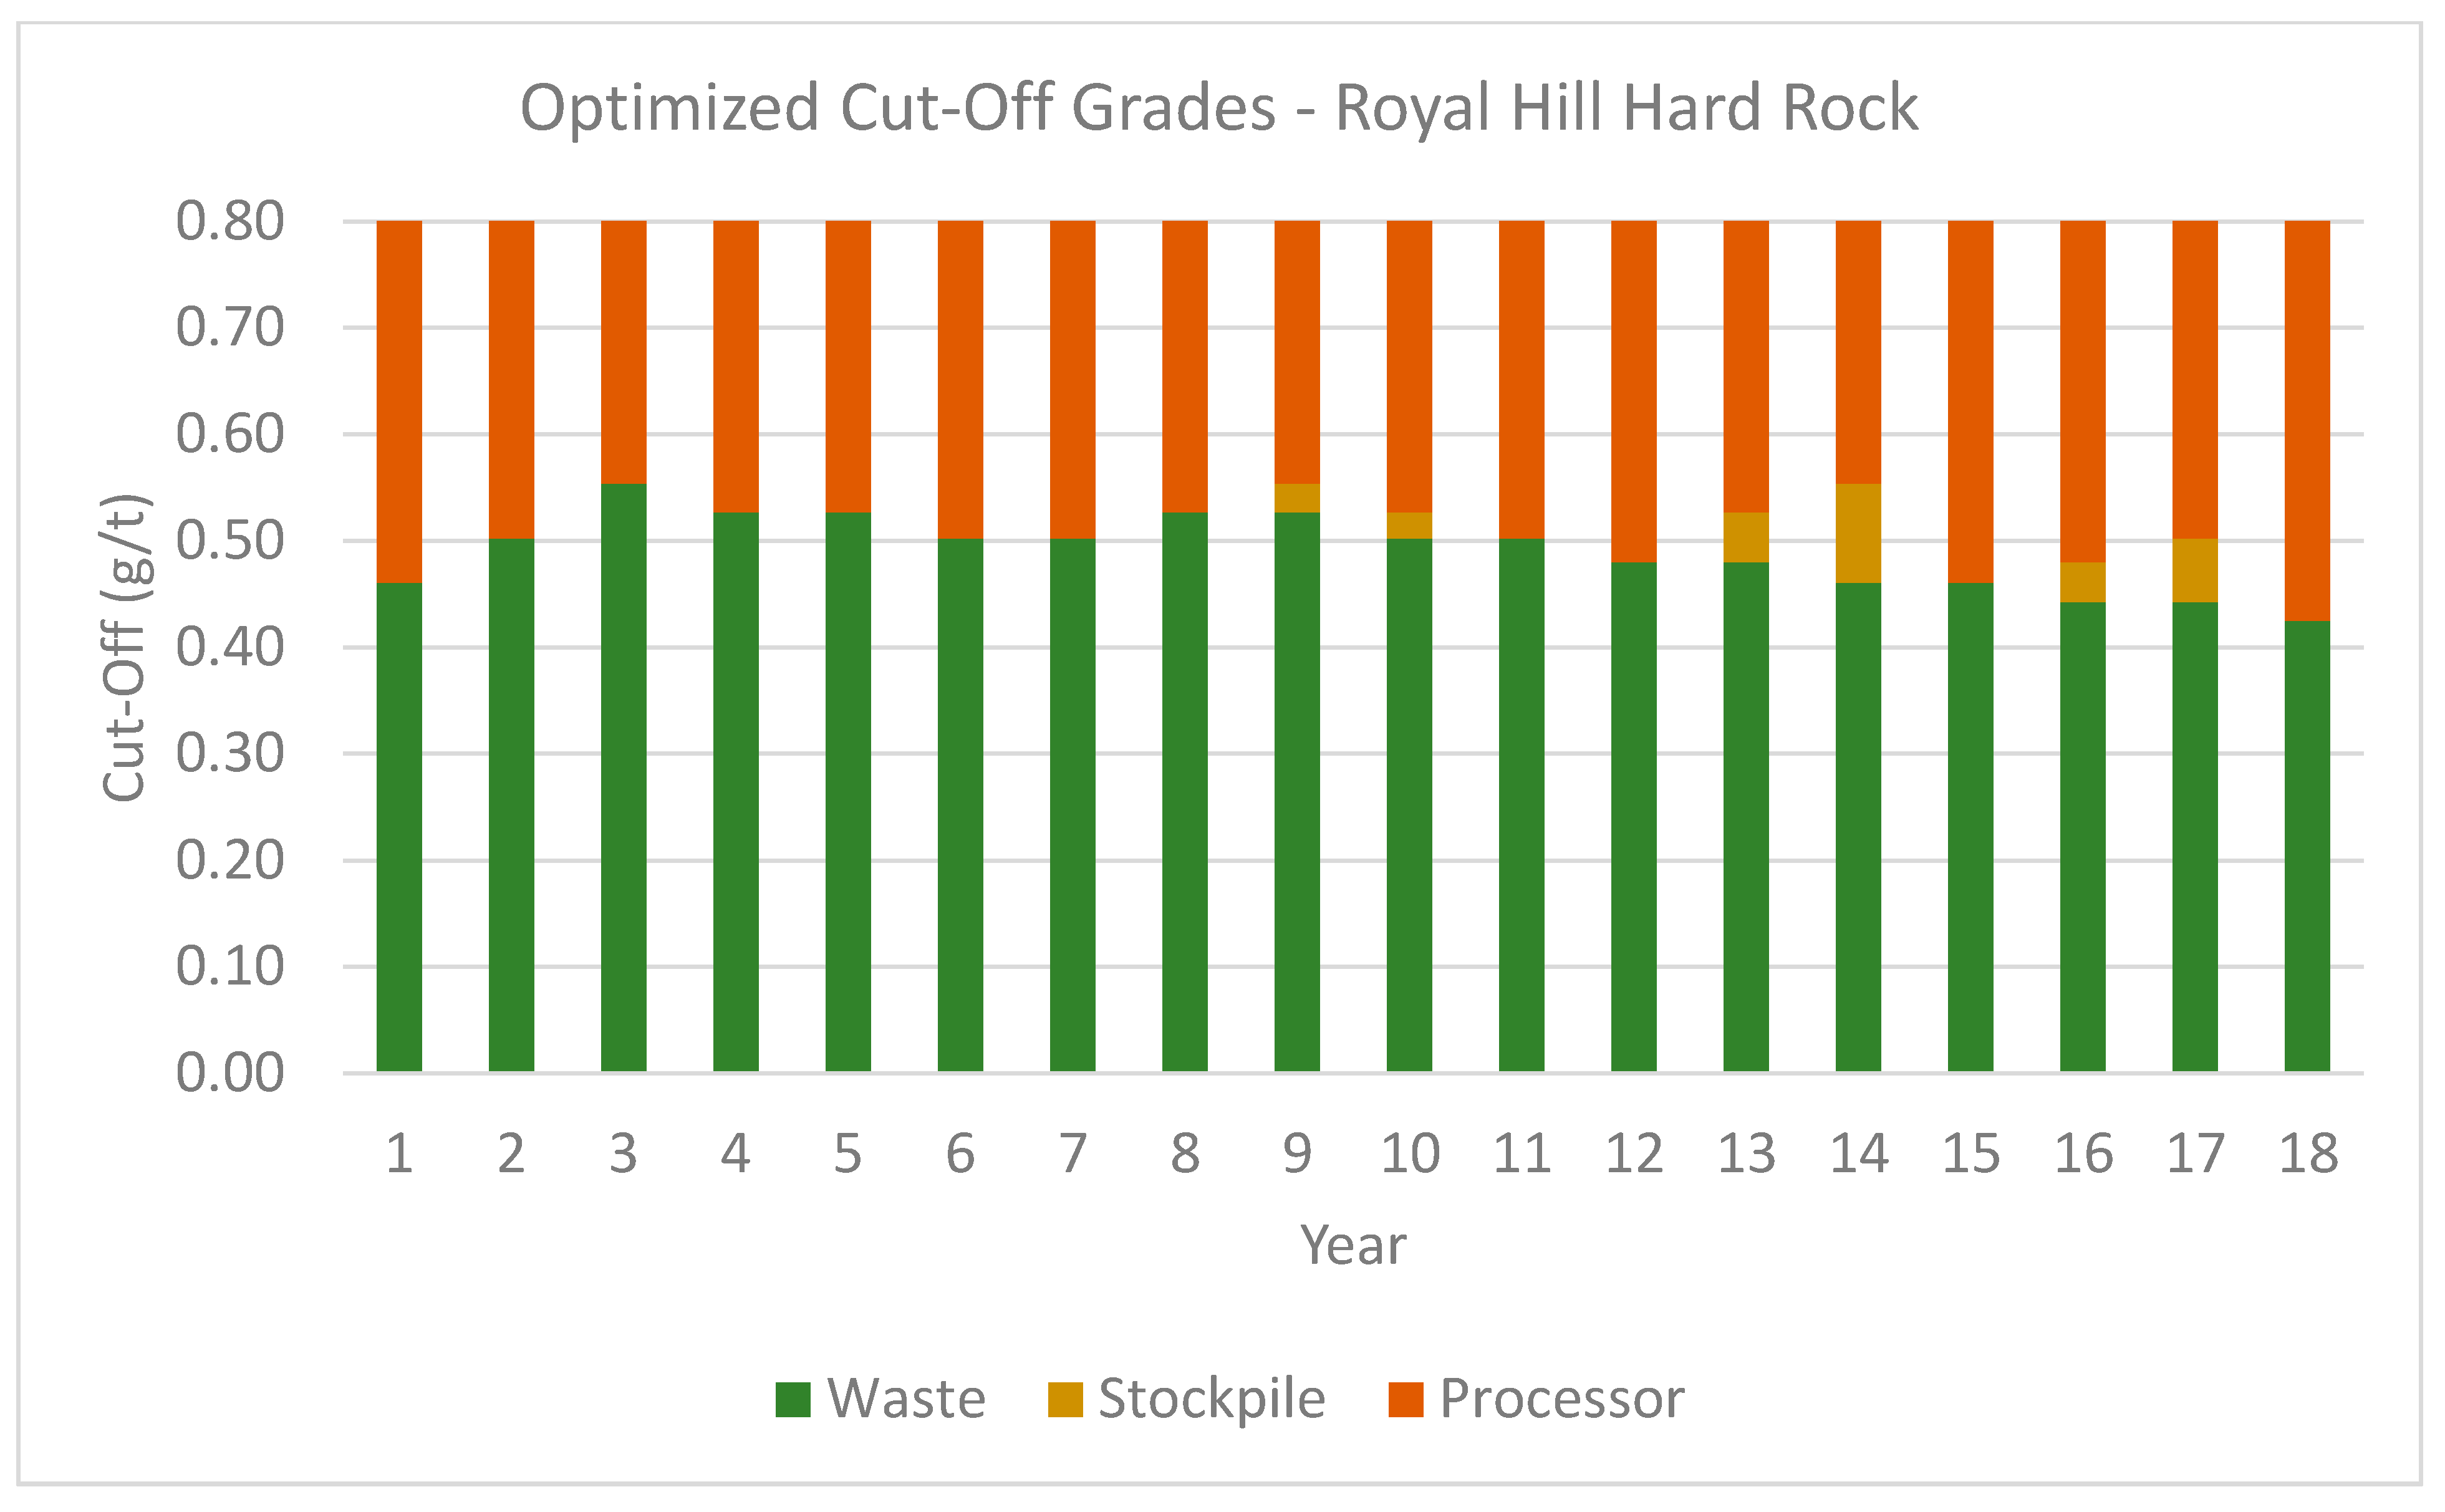
Figure 12 shows the proportion of material at the processor by material type and by source. Most of the ore sent to the processor is hard rock, which has a significantly lower SAG mill throughput than the laterite-saprolite and transition materials. Indeed, each RGM deposit has a mined-out portion that has depleted the softer material types, leaving only harder material and contributing to the SAG mill utilization. The early stockpiling and reclamation of the laterite-saprolite material (Figure 9) will assist the SAG mill utilization. Regarding the source of the ore sent to the processor, the Royal Hill Mine provides most of the material, followed by the Pay Caro Mine, Rosebel Mine, and stockpile reclamation. Figure 13 shows the proportion of recovered gold by material type and source. Though the trends are similar to those shown in Figure 12, it can be noted that 92% of the gold is recovered from the hard rock material, while that material only constitutes 86% of the processor feed. The hard rock material has the lowest recovery rate of the three material types, as well as the highest mining and processing costs. Similarly, 55% of the gold is recovered from Royal Hill ore, whereas Royal Hill ore makes up only 50% of the processor feed. This reflects the fact that Royal Hill’s material is richer in gold than the other deposits. Finally, Figure 14 presents the yearly cut-off grades obtained from the simultaneous stochastic optimization process, using Royal Hill’s hard rock material as an example. Note that the simultaneous stochastic optimization process determines the destination of the extracted material based on the material’s grade, aiming to maximize the operation’s NPV. Based on the assigned destinations, cut-off grades are then determined for each material type extracted per year, as opposed to conventional mine planning optimization where cut-off grades are an input to the optimization process.

4. Conclusions

An application of simultaneous stochastic optimization at the RGM mining complex is presented herein. The mining complex includes three deposits, three stockpiles, one processor, and one waste dump. The case study maximized NPV and gold production, resulting in an 18 year production life for the RGM mining complex. It generated mine production schedules for the three deposits, indicating that Royal Hill would be mined to a greater extent than Pay Caro and Rosebel, as well as stockpile management plans for the three stockpiles considered. The resulting schedules also indicate that the Royal Hill deposit was solely responsible for the last three years of production of the RGM mining complex. The SAG mill was determined to be the bottleneck of the operation, with a 100% utilization rate throughout the life-of-mine. This was due to the hardness of the different material types. The hardest material, and therefore, the material with the lowest SAG throughput rate, was that with the highest grades and greatest presence in the deposits, causing the bottleneck. Future work could consider the incorporation of more components of the RGM mining complex, such as additional deposits and mine-to-mill transportation scheduling, as well as the incorporation of capital investment options to reduce the effect of the identified bottleneck. Future work could also consider stochastic simulations of the ore zone boundaries, as well as densities and hardness, to better represent the deposits and the utilization of the SAG mill.

Author Contributions

Conceptualization, R.D.; Methodology, M.L.-B. and R.D.; Software, M.L.-B.; Validation M.L.-B. and R.D.; Formal analysis, M.L.-B. and R.D.; Investigation, M.L.-B.; Resources, R.D.; Data curation, M.L.-B.; Writing—original draft preparation M.L.-B. and R.D.; Writing—review and editing, M.L.-B.; Visualization, M.L.-B.; Supervision, R.D.; Project administration, R.D.; Funding acquisition, R.D. All authors have read and agreed to the published version of the manuscript.

Funding

This work is funded by the National Science and Engineering Research Council of Canada (NSERC) CRD Grant CRDPJ 500414-16, NSERC Discovery Grant 239019, and the COSMO mining industry consortium (AngloGold Ashanti, BHP, De Beers, AngloAmerican, IAMGOLD, Kinross, Newmont Mining and Vale).

Institutional Review Board Statement

Not applicable.

Informed Consent Statement

Not applicable.

Data Availability Statement

Not applicable.

Acknowledgments

Special thanks are in order to IAMGOLD Corporation and Stephen Eddy, Vice President of Business Development, as well as Nathaniel Chouinard, Senior Director Strategy, for providing the data used in this study and long-standing collaboration.

Conflicts of Interest

The authors declare no conflict of interest.

References

  1. Montiel, L.; Dimitrakopoulos, R. Optimizing mining complexes with multiple processing and transportation alternatives: An uncertainty-based approach. Eur. J. Oper. Res. 2015, 247, 166–178. [Google Scholar] [CrossRef] [Green Version]
  2. Montiel, L.; Dimitrakopoulos, R. A heuristic approach for the stochastic optimization of mine production schedules. J. Heuristics 2017, 23, 397–415. [Google Scholar] [CrossRef] [Green Version]
  3. Montiel, L.; Dimitrakopoulos, R. Simultaneous stochastic optimization of production scheduling at Twin Creeks Mining Complex, Nevada. Min. Eng. 2018, 70, 48–56. [Google Scholar] [CrossRef] [Green Version]
  4. Goodfellow, R.C.; Dimitrakopoulos, R. Global optimization of open pit mining complexes with uncertainty. Appl. Soft Comput. 2016, 40, 292–304. [Google Scholar] [CrossRef]
  5. Goodfellow, R.C.; Dimitrakopoulos, R. Simultaneous stochastic optimization of mining complexes and mineral value chains. Math. Geosci. 2017, 49, 341–360. [Google Scholar] [CrossRef] [Green Version]
  6. Goovaerts, P. Geostatistics for Natural Resources Evaluation; Oxford University Press: New York, NY, USA, 1997. [Google Scholar]
  7. Gomez Gómez-Hernández, J.J.; Srivastava, R.M. One step at a time: The origins of sequential simulation and beyond. Math. Geosci. 2021. [Google Scholar] [CrossRef]
  8. Hoerger, S.; Hoffman, L.; Seymour, F. Mine planning at Newmont’s Nevada operations. Min. Eng. 1999, 51, 26–30. [Google Scholar]
  9. Stone, P.; Froyland, G.; Menabde, M.; Law, B.; Pasyar, R.; Monkhouse, P.H.L. Blasor—Blended iron ore mine planning optimisation at Yandi, Western Australia. In Orebody Modelling and Strategic Mine Planning; Spectrum Series 14; Dimitrakopoulos, R., Ed.; AusIMM: Carlton, Australia, 2007; Volume 14, pp. 133–136. [Google Scholar]
  10. Whittle, G. Global asset optimisation. In Orebody Modelling and Strategic Mine Planning; Spectrum Series 14; Dimitrakopoulos, R., Ed.; AusIMM: Carlton, Australia, 2007; Volume 14, pp. 361–366. [Google Scholar]
  11. Whittle, J. The global optimiser works-What next? In Advances in Applied Strategic Mine Planning; Dimitrakopoulos, R., Ed.; Springer International Publishing: Cham, Switzerland, 2018; pp. 31–37. [Google Scholar] [CrossRef]
  12. Whittle, J. Not for the faint-hearted. In Proceedings of the Orebody Modelling and Strategic Mine Planning Symposium, Perth, Australia, 22–24 November 2010; AusIMM: Carlton, Australia, 2010; pp. 3–6. [Google Scholar]
  13. Pimentel, B.S.; Mateus, G.R.; Almeida, F.A. Mathematical models for optimizing the global mining supply chain. In Intelligent Systems in Operations: Methods, Models and Applications in the Supply Chain; IGI Global: Hershey, PA, USA, 2010; pp. 133–163. [Google Scholar]
  14. Ramazan, S.; Dimitrakopoulos, R. Stochastic optimisation of long-term production scheduling for open pit mines with a new integer programming formulation. In Orebody Modelling and Strategic Mine Planning; Spectrum Series 14; Dimitrakopoulos, R., Ed.; AusIMM: Carlton, Australia, 2007; Volume 14, pp. 385–394. [Google Scholar]
  15. Ramazan, S.; Dimitrakopoulos, R. Production scheduling with uncertain supply: A new solution to the open pit mining problem. Optim. Eng. 2013, 14, 361–380. [Google Scholar] [CrossRef]
  16. Paithankar, A.; Chatterjee, S. Open pit mine production schedule optimization using a hybrid of maximum-flow and genetic algorithms. Appl. Soft Comput. 2019, 81, 105507. [Google Scholar] [CrossRef]
  17. Menabde, M.; Froyland, G.; Stone, P.; Yeates, G.A. Mining schedule optimisation for conditionally simulated orebodies. In Orebody Modelling and Strategic Mine Planning; Spectrum Series 14; Dimitrakopoulos, R., Ed.; AusIMM: Carlton, Australia, 2007; Volume 14, pp. 379–384. [Google Scholar]
  18. Githiria, J.; Musingwini, C. A stochastic cut-off grade optimization model to incorporate uncertainty for improved project value. J. S. Afr. Inst. Min. Met. 2019, 119, 217–228. [Google Scholar] [CrossRef] [Green Version]
  19. Khan, A.; Asad, M.W.A. A method for optimal cut-off grade policy in open pit mining operations under uncertain supply. Resour. Policy 2019, 60, 178–184. [Google Scholar] [CrossRef]
  20. Mai, N.L.; Topal, E.; Erten, O.; Sommerville, B. A new risk-based optimisation method for the iron ore production scheduling using stochastic integer programming. Resour. Policy 2019, 62, 571–579. [Google Scholar] [CrossRef]
  21. Morales, N.; Seguel, S.; Cáceres, A.; Jélvez, E.; Alarcón, M. Incorporation of Geometallurgical Attributes and Geological Uncertainty into Long-Term Open-Pit Mine Planning. Minerals 2019, 9, 108. [Google Scholar] [CrossRef] [Green Version]
  22. Montiel, L.; Dimitrakopoulos, R.; Kawahata, K. Globally optimising open-pit and underground mining operations under geological uncertainty. Min. Technol. 2016, 125, 2–14. [Google Scholar] [CrossRef]
  23. Saliba, Z.; Dimitrakopoulos, R. Simultaneous stochastic optimization of an open pit gold mining complex with supply and market uncertainty. Min. Technol. 2019, 128, 216–229. [Google Scholar] [CrossRef] [Green Version]
  24. Levinson, Z.; Dimitrakopoulos, R. Simultaneous stochastic optimisation of an open-pit gold mining complex with waste management. Int. J. Min. Reclam. Environ. 2019, 34, 415–429. [Google Scholar] [CrossRef]
  25. Saliba, Z.; Dimitrakopoulos, R. An application of simultaneous stochastic optimisation of an open-pit mining complex with tailings management. Int. J. Min. Reclam. Environ. 2020, 34, 592–607. [Google Scholar] [CrossRef] [Green Version]
  26. Kumar, A.; Dimitrakopoulos, R. Application of simultaneous stochastic optimization with geometallurgical decisions at a copper–gold mining complex. Min. Technol. 2019, 128, 88–105. [Google Scholar] [CrossRef] [Green Version]
  27. Del Castillo, M.F.; Dimitrakopoulos, R. Dynamically optimizing the strategic plan of mining complexes under supply uncertainty. Resour. Policy 2019, 60, 83–93. [Google Scholar] [CrossRef]
  28. Levinson, Z.; Dimitrakopoulos, R. Adaptive simultaneous stochastic optimization of a gold mining complex: A case study. J. S. Afr. Inst. Min. Met. 2020, 120, 221–232. [Google Scholar] [CrossRef] [PubMed]
  29. Paithankar, A.; Chatterjee, S.; Goodfellow, R.; Asad, M.W.A. Simultaneous stochastic optimization of production sequence and dynamic cut-off grades in an open pit mining operation. Resour. Policy 2020, 66, 101634. [Google Scholar] [CrossRef]
  30. Godoy, M. The Effective Management of Geological Risk in Long-Term Production Scheduling of Open Pit Mines. Ph.D. Thesis, University of Queensland, Brisbane, QLD, Australia, 2003. [Google Scholar]
  31. Boucher, A.; Dimitrakopoulos, R. Block simulation of multiple correlated variables. Math. Geosci. 2009, 41, 215–237. [Google Scholar] [CrossRef]
  32. Dimitrakopoulos, R.; Ramazan, S. Uncertainty-based production scheduling in open pit mining. SME Trans. 2004, 316, 106–112. [Google Scholar]
  33. Kirkpatrick, S.; Gelatt, C.D.; Vecchi, M.P. Optimization by Simulated Annealing. Science 1983, 220, 671–680. [Google Scholar] [CrossRef] [PubMed]
  34. NI43-101 Technical Report. Rosebel Gold Mine, Suriname; IAMGOLD Corporation: Toronto, ON, Canada, 2018.
  35. Albor, F.; Dimitrakopoulos, R. Stochastic mine design optimisation based on simulated annealing: Pit limits, production schedules, multiple orebody scenarios and sensitivity analysis. Min. Technol. 2009, 118, 79–90. [Google Scholar] [CrossRef]
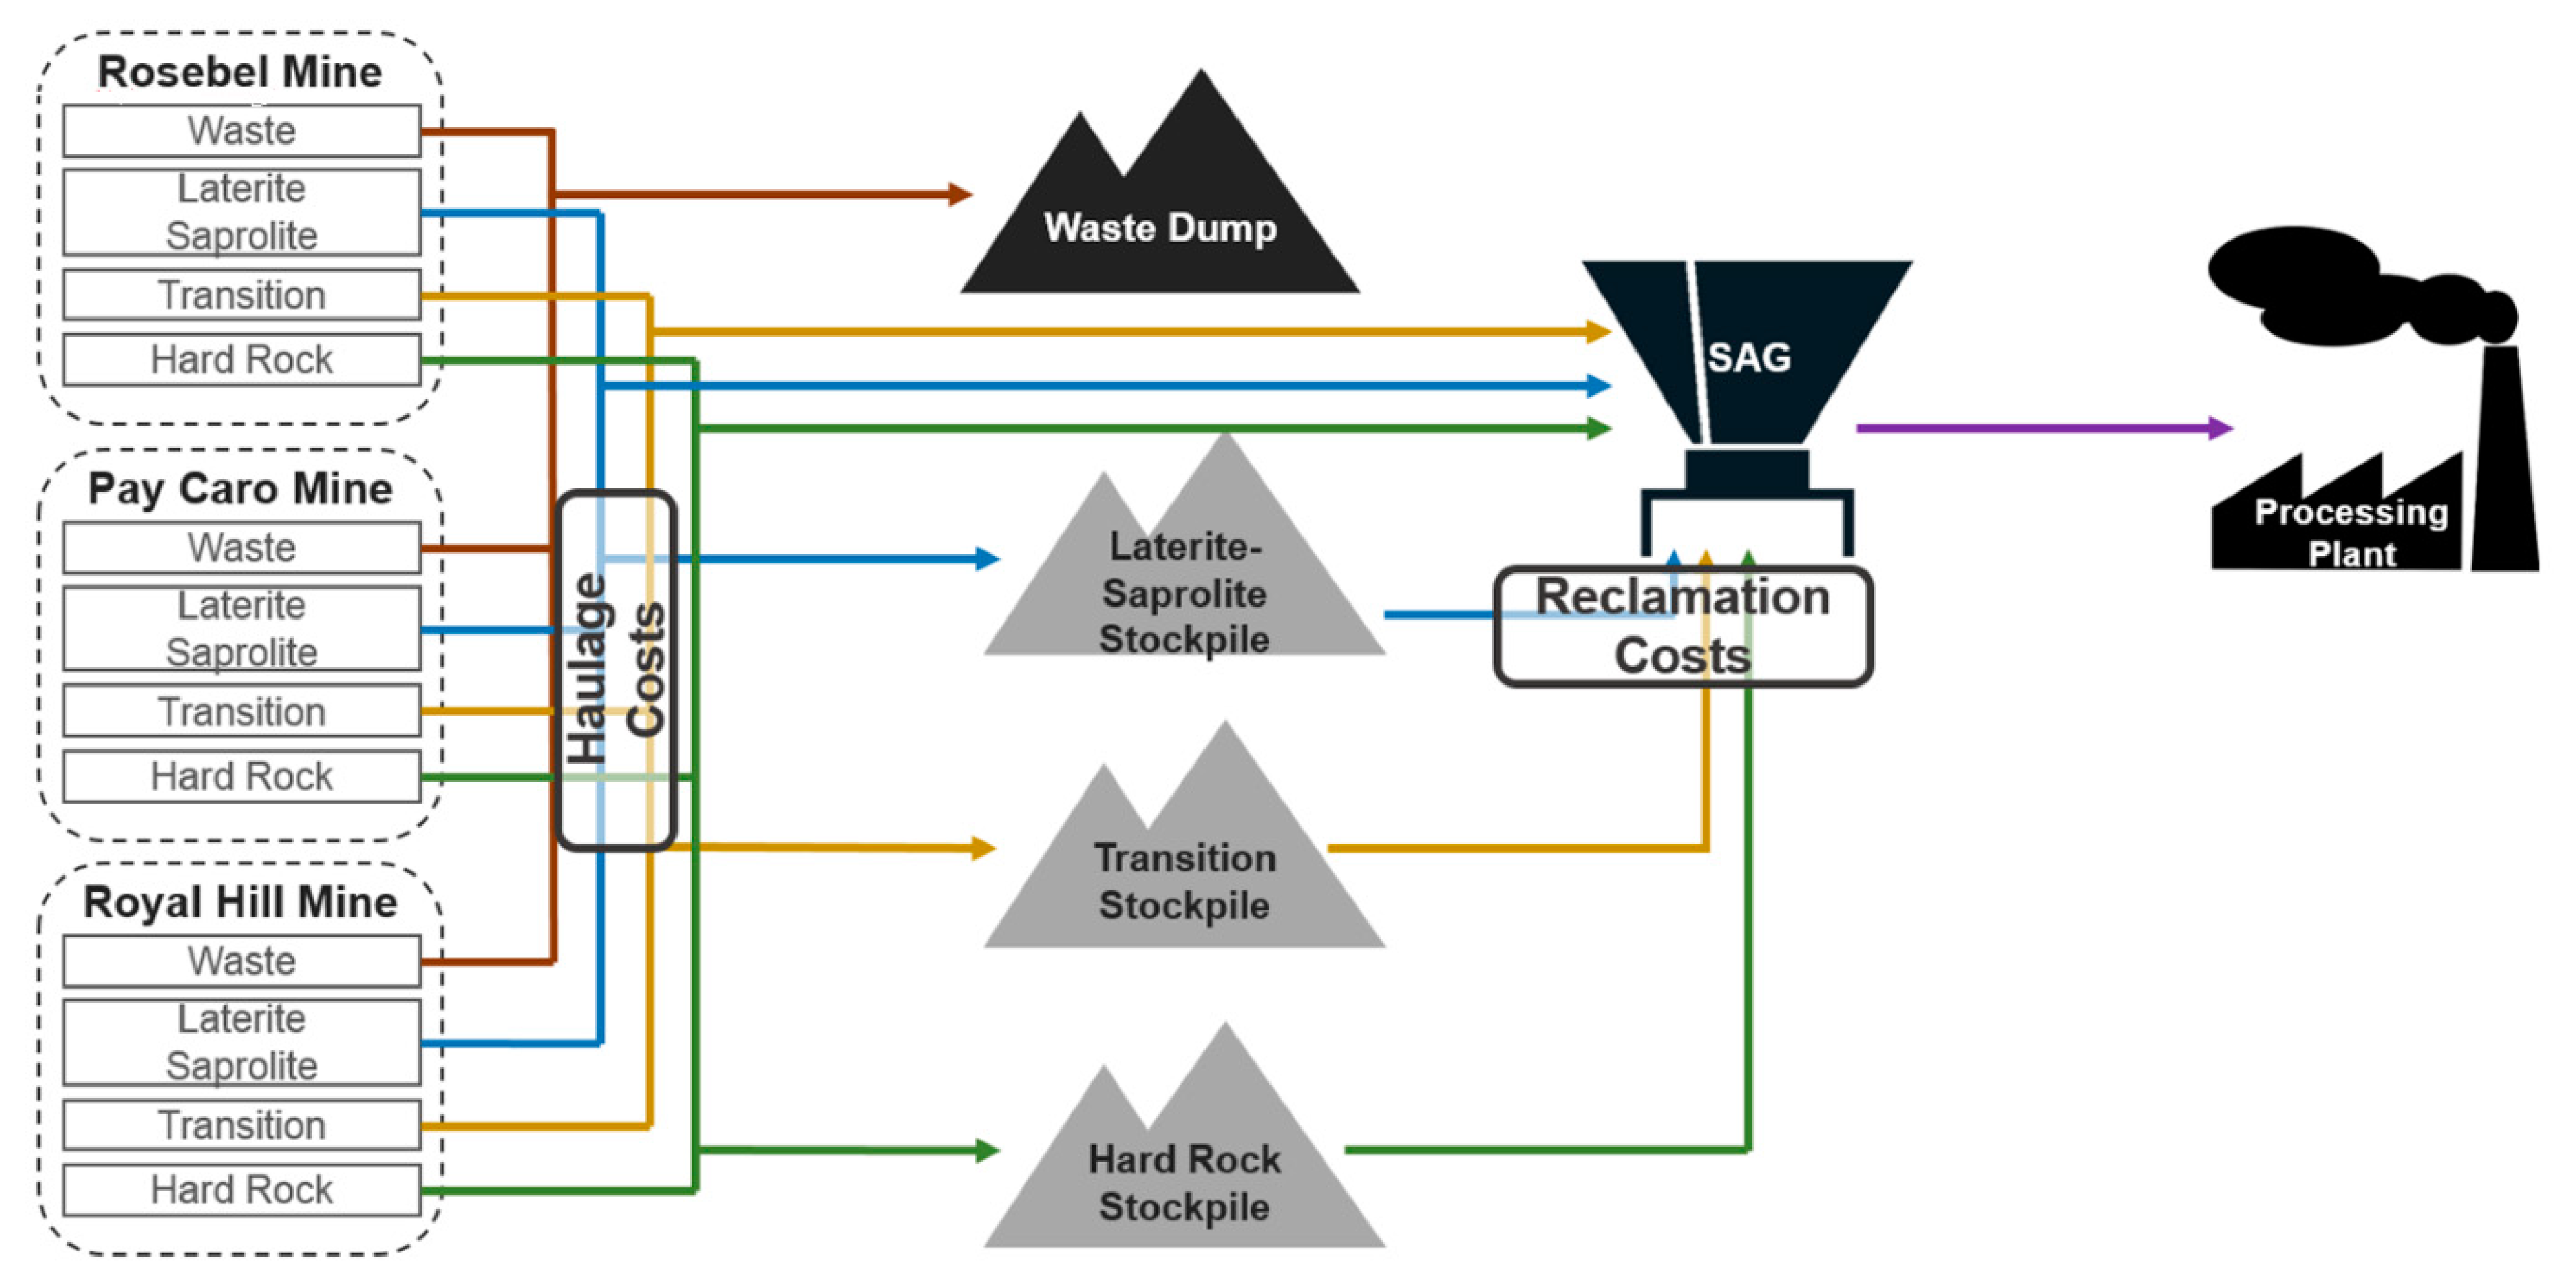
Figure 1. Material flow diagram at the gold mining complex considered in this case study.
Minerals 11 00172 g001
Figure 2. Net present value of the Rosebel Gold Mines (RGM) mining complex.
Minerals 11 00172 g002
Figure 3. Total ore tonnage mined and recovered gold from the three mines at the RGM mining complex.
Minerals 11 00172 g003
Figure 4. Total tonnage mined from the three mines at the RGM mining complex.
Minerals 11 00172 g004
Figure 5. Stochastic life-of-asset production schedules at the three mines at the RGM mining complex.
Minerals 11 00172 g005
Figure 6. Ore tonnage mined and recovered gold at the Rosebel Mine.
Minerals 11 00172 g006
Figure 7. Ore tonnage mined and recovered gold at the Pay Caro Mine.
Minerals 11 00172 g007
Figure 8. Ore tonnage mined and recovered gold at the Royal Hill Mine.
Minerals 11 00172 g008
Figure 9. Stockpiled material at the RGM mining complex.
Minerals 11 00172 g009
Figure 10. Semi-autogenous grinder (SAG) mill utilization.
Minerals 11 00172 g010
Figure 11. Processor ore tonnage throughput.
Minerals 11 00172 g011
Figure 12. Proportion of different material types (left) and material from different sources (right) at the processor.
Minerals 11 00172 g012
Figure 13. Proportion of recovered gold from different material types (left) and sources (right).
Minerals 11 00172 g013
Figure 14. Royal Hill Mine cut-off grade policy.
Minerals 11 00172 g014
Table 1. Economic parameters.
GeneralMaterial-DependentMine-Dependent
Economic Discount RateGold Recovery RateReclamation Cost
Geological Risk Discount RateDrill and Blast CostHaulage Costs
Gold PriceProcessing CostIncremental Mining Cost
Selling CostAdministration Cost
RoyaltiesSustaining Capital Cost
Loading Cost
Dump Maintenance Cost
Closure Cost
Table 2. Capacity constraints.
ConstraintsCapacity
Mining Capacity (years 1–5)67.3 Mt/y
Mining Capacity (years 6–18)74.0 Mt/y
SAG Mill Capacity876 h/y
Processing Capacity8.83 Mt/y
Table 3. Scheduling constraints.
ConstraintDistance
Smoothness48 m
Max sink rate63 m
Publisher’s Note: MDPI stays neutral with regard to jurisdictional claims in published maps and institutional affiliations.