Abstract
Fine particles misclassification in the underflow (UF) of grinding-classification hydrocyclones might result in ore over-grinding, leading to both reduced ball mill throughput and metal recovery. In the current research, a W-shaped hydrocyclone is proposed, to efficiently decrease the misclassification of fine particles in UF. The effects of the following parameters (including cross-effects) on W-shaped hydrocyclone classification performance were studied experimentally—inlet pressure, apex diameter, and vortex finder insertion depth and diameter. A mathematical model on the basis of the response surface method was established for the prediction of W-shaped hydrocyclone separation performance. The significance of the effects of the factors on the fine particle content in UF decreased in the following order—vortex finder diameter > inlet pressure > vortex finder insertion depth > apex diameter. The significance of influences of different factors on quality effectively decreased in the following order—inlet pressure > vortex finder insertion depth > vortex finder diameter > apex diameter. The significance of factor effects on the quantity efficiency decreased in the following order—inlet pressure > vortex finder insertion depth > apex diameter > vortex finder diameter. All influence factors were considered to obtain the optimal parameter configuration—an apex diameter of 0.14 D, a vortex finder diameter of 0.31 D, an insertion depth of 1.87 D, and an inlet pressure of 0.18 MPa. The corresponding optimal result was a −25 μm particle content (C−25) in UF of 11.92%, a quality efficiency of 42.48%, and a quantity efficiency of 98.99%.
1. Introduction
Hydrocyclones are extensively applied as separation and classification machines for grinding-classification. However, the hydrocyclone classification principle [1,2,3,4] can result in a “misclassification” phenomenon (misclassification of fine particles in underflow (UF) and coarse particles in overflow (OF)). When classifying high-concentration, coarse-grained materials, the settling velocity of multi-component particles in swirling flow fields, results in fine particle misclassification in UF, which in turn often causes ore over-grinding that reduces metal recovery and ball mill throughput. Therefore, preventing misclassification in hydrocyclones has become a challenging and active topic for research [5,6,7,8]. In a traditional hydrocyclone, the cylindrical-conical structure determines the main flow field boundary structure and the mechanisms that affect the separation sharpness and classification efficiency [9,10]. The cut size of a traditional cylindrical–conical hydrocyclone is directly proportional to the cone angle [11,12]. Using a traditional cylindrical–conical hydrocyclone for the classification of high-concentration coarse-grained materials results in a small cut size. In the grinding-classification, this small cut size often causes problems, such as an excessive circulating load, increased fine particle misclassification in UF, and easy clogging, which in turn give rise to low classification efficiency of the hydrocyclone, over-grinding of the mill, and a limited increase in the ball mill throughput [13,14,15].
Thus, numerous studies were conducted to optimize the hydrocyclone structure. Dueck [16] injected water into a certain conical section position at a predetermined speed. The outer vortex was broken up. The fine particles settled on wall were pushed to the hydrocyclone center and then re-entered the inner vortex, to be finally discharged from the vortex finder. This decreased the fine particle number reported to UF. Wang et al. [17,18] designed a membrane-shaped vortex finder, in which the overflow liquid could be collected separately through membrane infiltration, in the process of separation. Their studies showed that the membrane-shaped overflow tube could reduce the turbulence near the overflow tube and reduce the overflow. Yang et al. [19] developed a micro-cyclone with a pre-arrangement of particles by installing a flow passage around the cylinder, in front of the feed pipe. By comparing with the cylindrical cone cyclone, they found that the counter-rotating pre-arrangement device improved the particle separation efficiency. Yang [20] proposed replacing the traditional single-cone hydrocyclone with a double-cone model. Computational fluid dynamics studies showed that the double-cone hydrocyclone had a higher separation efficiency and sharpness than the traditional hydrocyclone. Fricker et al. [21] embedded the cyclone in the middle of the annular magnetic pole and designed a magnetic cyclone, which used the functions of gravity separation and magnetic separation for mineral separation, and had an obvious effect on the separation of fine-grained magnetic minerals. Ye et al. [22] addressed the difficulties in the classification of ultrafine particles by traditional hydrocyclones, by studying a conical section cross-section and designing a multi-section composite cone. Jokovica et al. [23,24] proposed a semi-inverted hydrocyclone and achieved encouraging results, significantly reducing the water split to coarse product and much coarser cut sizes. Tang et al. [25] used CFD technology to study the separation performance of hydrocyclone, under different inlet structure size and inlet velocity combinations. To reduce fine particle misclassification in UF, the author proposed a W-shaped hydrocyclone in the early study [26]. As shown in Figure 1, the main stage space of W-shaped structures was the upper column, while the lower W-shaped structures that make cyclone bottom had a high concentration circulating flow, in which the solid particles gathered into a circulating fluidized bed. In our previous research, the author obtained a flow field distribution inside the W-shaped hydrocyclone and compared it with the conventional one. The results showed that the W-shaped hydrocyclone had certain advantages in reducing the fine particle content in UF.
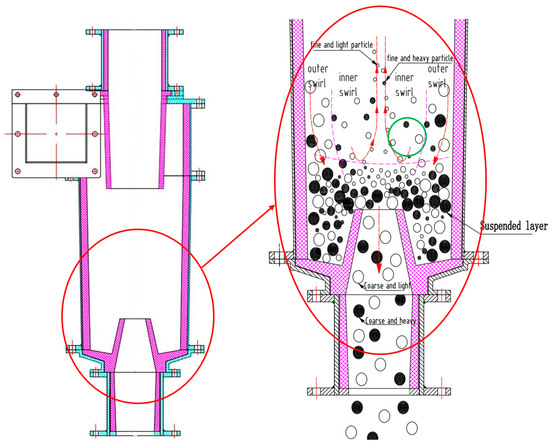
Figure 1.
W-shaped full cylindrical hydrocyclone.
Various structural parameters, operating parameters, and physical property parameters influence W-shaped hydrocyclone separation performance. Cross-effects were observed among these factors [27,28,29]. Martínez et al. [30] investigated the effect of the insertion depth of a vortex finder on hydrocyclone separation performance. The results showed that an appropriate insertion depth reduced coarse particle misclassification in the OF from the flow of short-circuit. The highest efficiency of separation was obtained for an insertion depth of 10% of hydrocyclone total length. Tang et al. [31] investigated the effect of the structural parameters of vortex finder on the separation sharpness of the hydrocyclone and established a multiple regression model. The diameter of the vortex finder had the strongest influence on separation sharpness, followed by the depth of insertion, whereas the thickness of the vortex finder wall had the least significant influence on the separation sharpness. As the outlet for coarse-grained products, the apex has a critical effect on the multiphase flow in the hydrocyclone. Kilavuz [32] quantified the relationship between diameters of apex and vortex finder. An exponential relationship between fine particle content and cone ratio in UF was reported. Thus, the classification sharpness could be improved by controlling the cone ratio. Zhang et al. [33] studied how cross-effects between feed particle size and apex diameter influence the performance of separation. It was found that an appropriate increase in the diameter of apex mitigated the feed particle size fluctuation impact. Yu et al. [34] applied mini-hydrocyclones to separate rare earth particles. The comprehensive effects of different factors, such as feed concentration, split ratio, and flow rate on the efficiency of separation was studied using the response surface method. Bicalho [35] showed that appropriately increasing the feed flow rate improved the hydrocyclone separation efficiency, whereas an excessively high rate of flow decreased the particle’s effective residence times and thereby the efficiency of separation.
In this study, based on previous research, the factors affecting hydrocyclone separation performance were explored for specific engineering problems, and the mathematical model for predicting the separation performance of the W-shaped hydrocyclone was established, based on the response surface method, which has important guiding significance for optimizing the design of the hydrocyclone.
2. Materials and Methods
2.1. Apparatus
A hydrocyclone separation test system was developed for the determination of the performance of separation in a W-shaped hydrocyclone with Φ75 mm [36]; the structure parameters are shown in Figure 2. The main components of the system, as presented in Figure 3, included a hydrocyclone, a slurry pump, a mixing tank, valves, pipelines, flow meters, pressure gauges, and a frequency converter. In this research, quartz powder (98% purity with a main component of SiO2) was applied for the elimination of the errors generated by the separation effect.
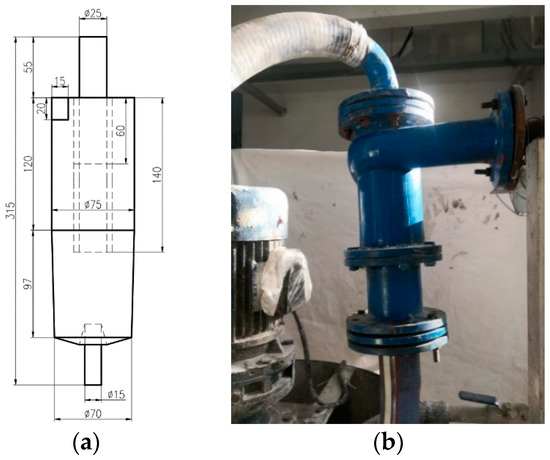
Figure 2.
W-shaped hydrocyclone—(a) Schematic diagram and (b) real product.
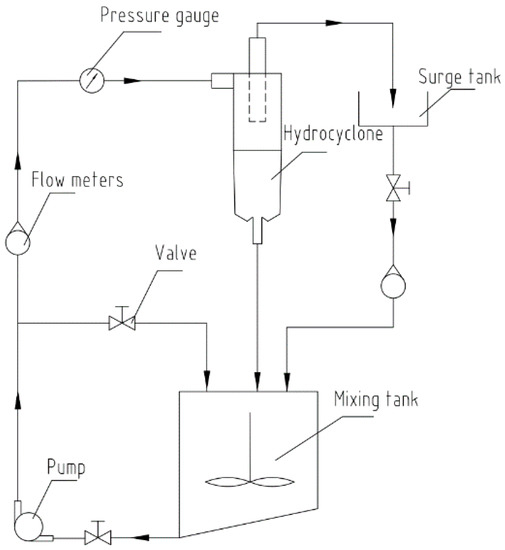
Figure 3.
Test arrangement of the separation performance of hydrocyclone.
2.2. Materials
The size distribution of particles was obtained by a BT-9300S laser particle size analyzer (Bettersize Instruments Ltd., Danton, China), as shown in Table 1. Negative accumulation refers to the content of all solid phases less than the particle size. Particles with diameters less than 23 μm comprised 28.27% of the total amount of particles, those with diameters of below 45 μm made up 50.21%, and those greater than 100 μm in size comprised 13.92% of the total particle amount. Since 75 mm hydrocyclone cut size was 25–75 μm, this material was considered to be appropriate to test the W-shaped hydrocyclone separation performance. Particles with diameters of less than 23 μm were considered as fine particles, and those with sizes above 100 μm were assumed to be coarse particles.

Table 1.
Distribution of particle size in the test material.
2.3. Experimental Design
First, the other parameters were kept fixed and only one factor was changed to conduct a multi-level test, for the determination of the effect rule of each factor on separation performance. Table 2 summarizes the level table of factors applied in single-factor tests. Then, the results were used to establish a central composite design, based on the response surface method [37]. Each test point of the design was uniformly sampled within the variation range of the factors. A test table was formed by the uniform distribution, permutation, and combination of factors. The central composite design based on the response surface method was highly representative and reflected some of the characteristics of the comprehensive experiment. Multiple linear regression equations were established by considering a certain performance indicator to be a function of one or more factors. The optimal configuration was thus obtained more intuitively. The structure parameters such as the vortex finder and the apex were dimensionless, based on the hydrocyclone main diameter (D). The diameter of dimensionless apex (X1), the diameter of vortex finder (X2), vortex finder insertion depth (X3), and the inlet pressure (X4) were subjected to a four-factor, three-level central composite design. The Expert Design 11 software (V11.1.2.0, Stat-Ease Inc., Minneapolis, MN, USA) was employed for the data analysis. Table 3 summarizes the variation range of each factor—X1: 0.12 D to 0.28 D; X2: 0.2 D to 0.4 D; X3: 0.8 D to 1.87 D; and X4: 0.10 MPa to 0.18 MPa. Additionally, separation performance was analyzed by considering the cut size, particle content, quality efficiency, and quantity efficiency as evaluation indices [38].
Table 2.
Table of factor-level for single factor tests.
Table 3.
Scheme of center composite design based on the response surface method (the dimensionless factor).
3. Results and Discussion
3.1. Effect of the Diameter of Vortex Finder on Separation Performance
Vortex finder diameter effects on separation performance indicators, such as classification efficiency and product particle size, were studied for the vortex finder diameter range of 15–30 mm.
Figure 4 reveals that the diameter of vortex finder strongly affected the classification efficiency curve, which represented the recovery of the specific particle size to UF. As the diameter of the vortex finder enhanced, the classification efficiency curve was significantly shifted to right, and recoveries of all particle size ranges to UF were considerably decreased [39]. For a diameter of vortex finder of 15 mm, fine particle recovery to the UF was more than 25%, indicating the misclassification of fine particles in UF. For a diameter of vortex finder of 30 mm, the hydrocyclone did not recover all coarse particles, indicating significant misclassification of coarse particles in OF. An analysis of the results revealed that at too large vortex finder diameters, the air core created by hydrocyclone occupied the majority of the apex space, significantly affecting the UF discharge. Both resulting UF split ratio and yield were low.
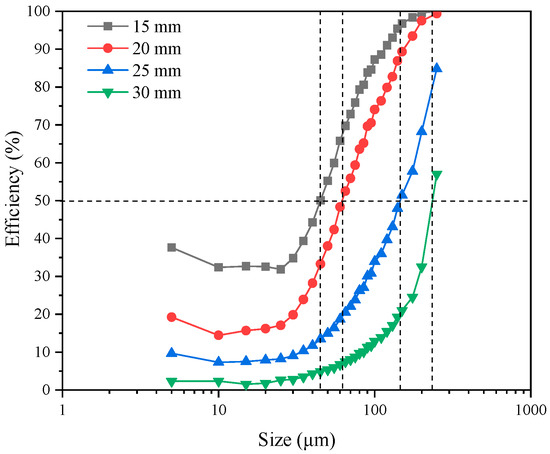
Figure 4.
Vortex finder diameter effect on the classification efficiency curve.
Classification efficiency curve rightward shift revealed the cut size increase. As the vortex finder diameter was increased from 15 mm to 30 mm, a sharp increase from 45 μm to 236 μm was observed in the cut size. Table 4 shows that as the diameter of the vortex finder enhanced, both OF and UF became coarser. A −25 μm particle content (C−25) in OF decreased from 47.09% to 31.94%, whereas that in UF decreased from 15.03% to 7.39%. At the same time, the quality efficiency was gradually reduced, while quantity efficiency was enhanced. For 30 mm vortex finder diameter, despite high quantity efficiency of 98.57%, 6.44% quality efficiency was achieved. Hence, enhancing the vortex finder diameter could decrease the fine particle misclassification in UF to a certain amount, but is not recommended. Beyond a certain vortex finder diameter, coarse particle misclassification in OF becomes significant and severely reduces the quality efficiency.
Table 4.
Vortex finder diameter effect on classification performance.
3.2. Vortex Finder Insertion Depth Effect on Separation Performance
Vortex finder insertion depth effects on separation performance indicators, such as classification efficiency and product particle size, were investigated at insertion depths of 60–140 mm.
Figure 5 shows the unique effect of vortex finder insertion depth on the classification efficiency curve. The smallest cut size and the highest number of fine particles entering the UF were obtained for a 60 mm insertion depth. The largest cut size was obtained at 140 mm insertion depth, and the recoveries of all particle sizes were very small. Other insertion depths (80 mm, 100 mm, and 120 mm) had little effect on the classification efficiency curve. In general, increasing the insertion depth tended to shift the classification efficiency curve to the right [40].
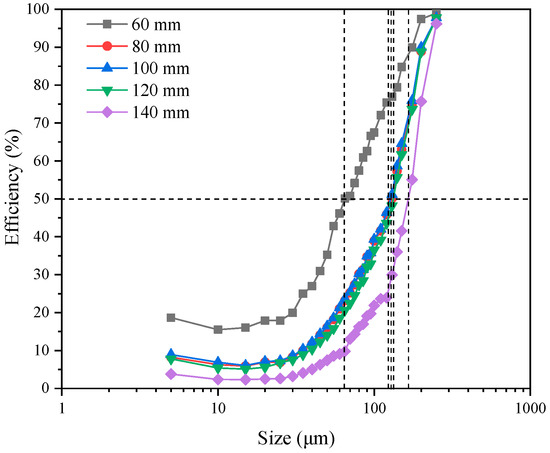
Figure 5.
Vortex finder insertion depth effect on the classification efficiency curve.
It can be seen from Table 5 that with the increase of vortex finder insertion depth, both OF and UF particle size gradually decreased. The C−25 in OF decreased from 40.73% to 34.51%, whereas the content of fine particles in UF decreased from 10.51% to 6.68%. Particle size distribution analysis in hydrocyclones showed that particle size was gradually enhanced from top to bottom and from center to sidewall. Therefore, the increasing vortex finder insertion depth moved the inlet end of the vortex finder closer to the hydrocyclone bottom, increasing the possibility of the entrance of coarse particles to OF. With the increase in vortex finder insertion depth from 60 mm to 140 mm, quantity efficiency was enhanced from 88.32% to 96.84%, and quality efficiency was reduced by 49.19%, from 31.94% to 16.23%. Although increasing the insertion depth could decrease the fine particle content in UF and increase the quantity efficiency, an insertion depth that was too large would significantly reduce the quality efficiency, and coarse particles would be entrained in OF. However, an excessively short vortex finder could result in a short-circuit flow. Therefore, an appropriate vortex finder insertion depth that is neither too long nor too short should be used.
Table 5.
Vortex finder insertion depth effect on classification performance.
3.3. Apex Diameter Effect on Separation Performance
Hydrocyclone apex is coarse material outlet in the process of classification. Its diameter is an important factor affecting the hydrocyclone separation performance. Apex diameter effect on the separation performance indicators, such as classification efficiency and product particle size, were studied for an apex diameter range of 9–21 mm.
Figure 6 shows the apex diameter effect on the classification efficiency curve. Both the UF split ratio and the yield increased with the apex diameter, resulting in a great number of fine particles mixed into UF [41]. Consequently, recoveries of both fine and coarse particles to UF increased, the cut size decreased, and the efficiency curve shifted leftward.
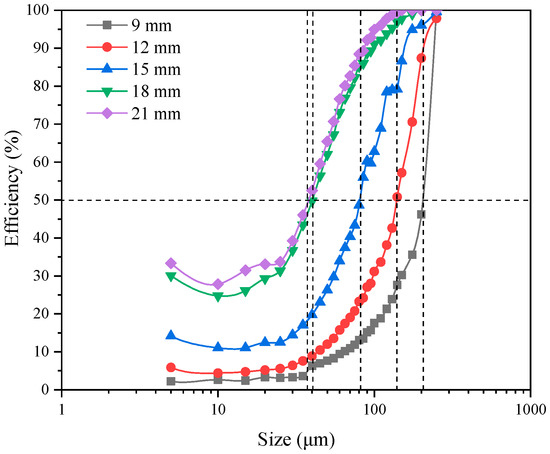
Figure 6.
Apex diameter effect on the classification efficiency curve.
Table 6 shows that the apex diameter significantly affected the product particle size. Both the OF and UF product became finer when the apex diameter was increased. The C−25 in UF increased by seven percentage points from 7.21% to 14.40%, and the content of fine particles in OF enhanced from 34.65% to 57.02%. This result could be explained by the increased UF flow causing a solid phase portion originally entering the OF discharged from UF. In this solid phase portion, particles were finer than those in original UF but coarser than those in original OF. Hence, transfer of this solid particle portions from OF to UF made both new OF and UF finer.
Table 6.
Apex diameter effect on the performance of classification.
The cut size was reduced from 204 μm to 38 μm as the diameter of apex was enhanced from 9 to 21 mm. This result indicated that apex diameter had a significant effect on the performance of hydrocyclone separation. Quality efficiency was enhanced from 16.65% to 47.26% and quantity efficiency was decreased from 96.42% to 70.60% (accounting for 26.78%). Too small an apex diameter would hinder the discharge of UF, and the majority of particles would discharge from OF. Additionally, a great amount of coarse particles report to OF, decreasing the quality efficiency. Too large apex diameters would result in an UF concentration that is too small and a solid yield that is too large, producing additional circulating loads. The resulting density of ball milling would be too low and affect the grinding. Hence, classification efficiency and the content of fine particles in UF need to be completely taken into account in determining appropriate apex diameters.
3.4. Inlet Pressure Effect on Separation Performance
Inlet pressure effect on the indicators of separation performance, such as classification efficiency and product particle size, were evaluated at inlet pressures of 0.10, 0.12, 0.14, 0.16, and 0.18 MPa.
Figure 7 shows that the recovery of each particle size to the UF increased with the inlet pressure. Higher number of particles reported to UF, which shifted the curve of classification efficiency toward left and decreased the cut size. An analysis of the data in Table 7 shows that with the increase of inlet pressure, tangential velocity within hydrocyclone was enhanced, centrifugal force field was strengthened, and centrifugal inertial force on particles increased [42]. The particle portion originally entering OF gradually overcame the resistance of fluid and entered UF. Consequently, OF and UF both became finer. The C−25 increased from 32.94% to 38.3% in OF and from 6.52% to 9.31% in OF. Quantity efficiency was reduced from 98.02% to 91.77%, while quality efficiency was enhanced gradually from 10.49% to 26.92%. Previously performed analyses revealed that the main factor influencing quality efficiency was the contents of coarse particles in OF or fine particles in UF. Therefore, inlet pressure effect on the quality efficiency was mainly reflected in the reduced misclassification of coarse particles in OF.
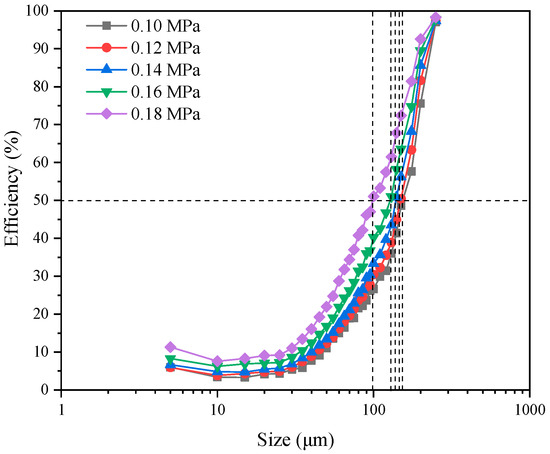
Figure 7.
Inlet pressure effect on the classification efficiency curve.
Table 7.
Inlet pressure effect on classification performance.
3.5. Mathematical Modeling
In this study, the results of the central composite experiment were analyzed by using the fine particle content in UF, quality efficiency, and quantity efficiency, as evaluation indicators. The results are shown in Table 8. A multiple linear regression analysis was performed on the test data to obtain regression equations to approximate the true response functions. Equations (1)–(3) show the functional relationships between the responses (C−25 in UF (Y1), the quality efficiency (Y2), and the quantity efficiency (Y3)), and the dimensionless variables (the apex diameter (X1), the vortex finder diameter (X2), the vortex finder insertion depth (X3), and the inlet pressure (X4)).
Table 8.
Central composite experimental results based on the response surface method.
A residual analysis was first performed on the response function models. The results are shown in Figure 8. The distribution of test points was even on both sides of the line and were relatively scattered. The correlation coefficients were R2 = 0.995 (C−25 in UF), R2 = 0.929 (quality efficiency), and R2 = 0.988 (quantity efficiency). These results showed that the model had a high prediction accuracy. Figure 9 revealed a good agreement between the values predicted by the models and the actual experimental results.
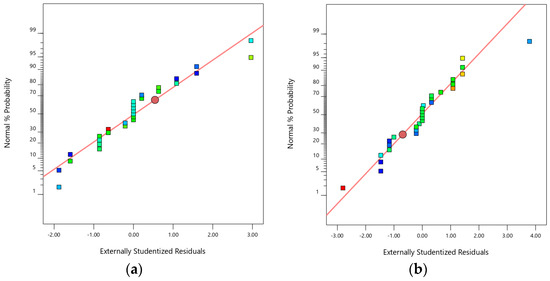
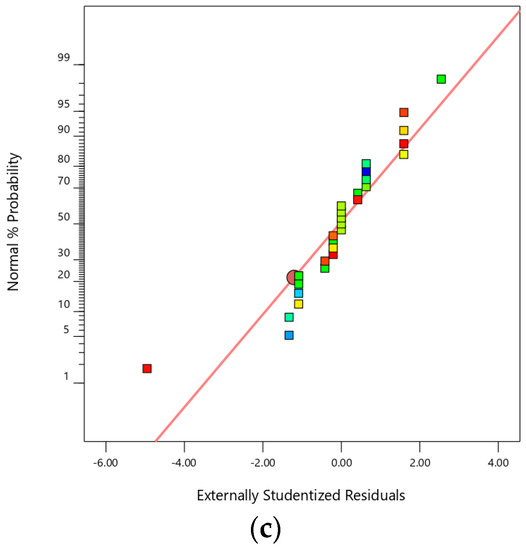
Figure 8.
Residual analysis of the proposed model—(a) fine particle content; (b) quality efficiency; and (c) quantity efficiency.
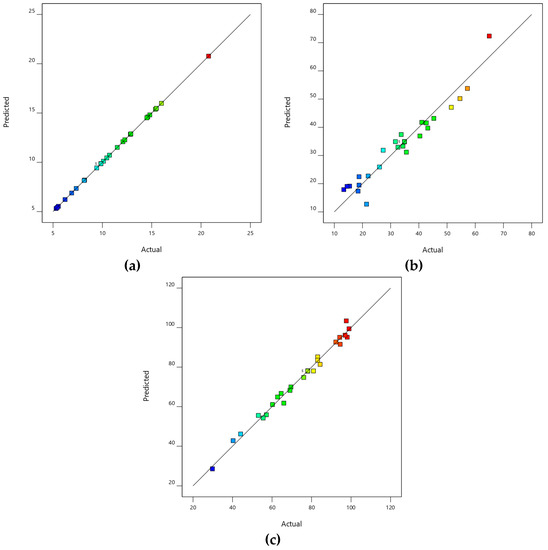
Figure 9.
Comparison of model predictions with experimental results—(a) fine particle content; (b) quality efficiency; and (c) quantity efficiency.
The analysis of variance of the abovementioned test results is shown in Table 9, Table 10 and Table 11. The P values of the regression models Y1, Y2, and Y3 were all below 0.001, proving statistical significance of the model at 0.95 confidence interval. An analysis of the F- and P-values of each model showed that in the prediction model for Y1, all linear, quadratic, and interaction terms were significant, with the exception of the interaction terms X2X3 and X3X4. The significance of the effects of the factors on the fine particle content in the UF decreased in the following order—vortex finder diameter (X2) > inlet pressure (X4) > vortex finder insertion depth (X3) > apex diameter (X1). In the prediction model for Y2, all terms were significant, with the exception of the terms X1X4, X2X3, X2X4, X3X4, X32, and X42. The significance of the influences of factors on quality efficiency decreased in the following order—inlet pressure (X4) > vortex finder insertion depth (X3) > vortex finder diameter (X2) > apex diameter (X1). In the prediction model for Y3, all terms were significant, with the exception of the terms X2X3, X2X4, X3X4, and X42. The significance of influences of factors on quantity efficiency decreased in the following order—inlet pressure (X4) > vortex finder insertion depth (X3) > apex diameter (X1) > vortex finder diameter (X2).
Table 9.
Analysis of variance of Y1 regression model.
Table 10.
Analysis of variance of Y2 regression model.
Table 11.
Analysis of variance of Y3 regression model.
The ultimate objective in using the W-shaped hydrocyclone was to improve the quantity efficiency by decreasing the fine particle misclassification in UF. Optimal parameter combination was obtained by considering the influence factors in conjunction with the interaction among the content of fine particles in UF, quantity efficiency, and quality efficiency. The optimal parameter configuration was as follows—an apex diameter of 0.14 D, a vortex finder diameter of 0.31 D, an insertion depth of 1.87 D, and an inlet pressure of 0.18 MPa. The corresponding optimal result was a C−25 in the UF of 11.92%, a quality efficiency of 42.48%, and a quantity efficiency of 98.99%.
4. Conclusions
In the current work, the influences of inlet pressure, vortex finder insertion depth, vortex finder diameter, and apex diameter on W-shaped hydrocyclone classification performance were studied experimentally. A mathematical model was established on the basis of the response surface method for the prediction of W-shaped hydrocyclone separation performance.
(1) With the increase of the diameter of vortex finder, the cut size increased, and the OF product and UF became coarser. At the same time, the quality efficiency gradually decreased, and the quantity efficiency gradually increased. Although increasing vortex finder insertion depth might decrease the fine particle content in UF and increase the quantity efficiency, excessively large insertion depths significantly reduced the quality efficiency, and the coarse particles were entrained in the OF. As the apex diameter increased, the content of fine particles in UF was enhanced and the cut size was reduced. With the increase of inlet pressure, the cut size decreased, quality efficiency was enhanced, and the quantity efficiency decreased.
(2) The significance of the effects of the factors on the content of fine particles in UF decreased in the following order—vortex finder diameter > inlet pressure > insertion depth of vortex finder > apex diameter. The significance of the influences of factors on the quality efficiency decreased in the following order—inlet pressure > vortex finder insertion depth > vortex finder diameter > apex diameter. The significance of the influences of factors on quantity efficiency decreased in the following order—inlet pressure > vortex finder insertion depth > apex diameter > vortex finder diameter.
(3) By considering all of these influence factors, the following optimal parameter configuration was obtained—an apex diameter of 0.14 D, a vortex finder diameter of 0.31 D, an insertion depth of 1.87 D, and an inlet pressure of 0.18 MPa. The corresponding optimal result was a C−25 in the UF of 11.92%, a quality efficiency of 42.48%, and a quantity efficiency of 98.99%.
It needs to be specially stated that this model was applicable to the W-shaped hydrocyclone studied in this study, but might not be applicable to other structural forms or very special working conditions.
Author Contributions
Conceptualization, P.L. and L.J.; methodology, L.J.; software, X.Y. and X.L.; validation, Y.Z. (Yuekan Zhang), X.L. and Y.Z. (Yulong Zhang); formal analysis, Y.Z. (Yulong Zhang); investigation, L.J.; resources, P.L.; data curation, X.Y.; writing—original draft preparation, L.J.; writing—review and editing, L.J. and Y.Z. (Yuekan Zhang); visualization, H.W.; supervision, P.L.; project administration, L.J.; funding acquisition, P.L. All authors have read and agreed to the published version of the manuscript.
Funding
This work was supported by the National Key R&D Program of China (grant number: 2018YFC0604702), Shandong Provincial Key Research and Development Program, China (grant number: 2019GSF109030), and Shandong Provincial Natural Science Foundation, China (grant number: ZR2020ME105).
Institutional Review Board Statement
Not applicable.
Informed Consent Statement
Not applicable.
Conflicts of Interest
The authors declare no conflict of interest.
References
- Cilliers, J.J.; Harrison, S.T. Yeast flocculation aids the performance of yeast dewatering using mini-hydrocyclones. Sep. Purif. Technol. 2019, 209, 159–163. [Google Scholar] [CrossRef]
- Lv, W.-J.; Huang, C.; Chen, J.-Q.; Liu, H.-L.; Wang, H.-L. An experimental study of flow distribution and separation performance in a UU-type mini-hydrocyclone group. Sep. Purif. Technol. 2015, 150, 37–43. [Google Scholar] [CrossRef]
- Song, T.; Tian, J.; Ni, L.; Shen, C.; Yao, Y. Experimental study on performance of a de-foulant hydrocyclone with different reflux devices for sewage source heat pump. Appl. Therm. Eng. 2019, 149, 354–365. [Google Scholar] [CrossRef]
- Wu, S.-E.; Hwang, K.-J.; Cheng, T.-W.; Hung, T.-C.; Tung, K.-L. Effectiveness of a hydrocyclone in separating particles suspended in power law fluids. Powder Technol. 2017, 320, 546–554. [Google Scholar] [CrossRef]
- Tavares, L.; Souza, L.; Lima, J.; Possa, M. Modeling classification in small-diameter hydrocyclones under variable rheological conditions. Miner. Eng. 2002, 15, 613–622. [Google Scholar] [CrossRef]
- Botha, S.; Le Roux, J.; Craig, I. Hybrid non-linear model predictive control of a run-of-mine ore grinding mill circuit. Miner. Eng. 2018, 123, 49–62. [Google Scholar] [CrossRef]
- Zhu, G.; Liow, J.-L. Experimental study of particle separation and the fishhook effect in a mini-hydrocyclone. Chem. Eng. Sci. 2014, 111, 94–105. [Google Scholar] [CrossRef]
- Xu, Y.; Wang, H.-L.; Wang, Z.; Fang, Y.; Liu, Y.; Zeng, T.; Liu, Z.; Liu, M. Hydrocyclone breakage of activated sludge to exploit internal carbon sources and simultaneously enhance microbial activity. Process. Saf. Environ. Prot. 2018, 117, 651–659. [Google Scholar] [CrossRef]
- Golmaei, M.; Kinnarinen, T.; Jernström, E.; Häkkinen, A. Efficient separation of hazardous trace metals and improvement of the filtration properties of green liquor dregs by a hydrocyclone. J. Clean. Prod. 2018, 183, 162–171. [Google Scholar] [CrossRef]
- Wang, H.; Fu, P.; Li, J.; Huang, Y.; Zhao, Y.; Jiang, L.; Fang, X.; Yang, T.; Huang, Z.; Huang, C. Separation-and-Recovery Technology for Organic Waste Liquid with a High Concentration of Inorganic Particles. Engineering 2018, 4, 406–415. [Google Scholar] [CrossRef]
- Vieira, L.G.M.; Silvério, B.C.; Damasceno, J.J.R.; Barrozo, M.A.S. Performance of hydrocyclones with different geometries. Can. J. Chem. Eng. 2011, 89, 655–662. [Google Scholar] [CrossRef]
- Schwarz, M.P.; Song, T.; Yang, T.; Zhou, J.; Wang, Q. Reconciliation of empirical correlations and CFD results for hydrocyclone performance for application in process modelling. Miner. Eng. 2019, 144, 106028. [Google Scholar] [CrossRef]
- Zhang, Y.; Liu, P.; Zhang, Y.; Yang, X.; Jiang, L. The Classification Performance of a Three-Product Cyclone. Wirel. Pers. Commun. 2018, 103, 55–68. [Google Scholar] [CrossRef]
- Brennan, M.; Narasimha, M.; Holtham, P. Multiphase modelling of hydrocyclones—prediction of cut-size. Miner. Eng. 2007, 20, 395–406. [Google Scholar] [CrossRef]
- Patra, G.; Velpuri, B.; Chakraborty, S.; Meikap, B. Performance evaluation of a hydrocyclone with a spiral rib for separation of particles. Adv. Powder Technol. 2017, 28, 3222–3232. [Google Scholar] [CrossRef]
- Dueck, J.; Pikushchak, E.; Minkov, L.L.; Farghaly, M.; Neesse, T. Mechanism of hydrocyclone separation with water injection. Miner. Eng. 2010, 23, 289–294. [Google Scholar] [CrossRef]
- Wang, C.-C.; Wu, R.-M. Experimental and simulation of a novel hydrocyclone-tubular membrane as overflow pipe. Sep. Purif. Technol. 2018, 198, 60–67. [Google Scholar] [CrossRef]
- Silva, N.K.; Silva, D.O.; Vieira, L.G.; Barrozo, M.A.S. Effects of underflow diameter and vortex finder length on the performance of a newly designed filtering hydrocyclone. Powder Technol. 2015, 286, 305–310. [Google Scholar] [CrossRef]
- Yang, Q.; Lv, W.-J.; Ma, L.; Wang, H.-L. CFD study on separation enhancement of mini-hydrocyclone by particulate arrangement. Sep. Purif. Technol. 2013, 102, 15–25. [Google Scholar] [CrossRef]
- Yang, Q.; Wang, H.-L.; Liu, Y.; Li, Z.-M. Solid/liquid separation performance of hydrocyclones with different cone combinations. Sep. Purif. Technol. 2010, 74, 271–279. [Google Scholar] [CrossRef]
- Liu, L.; Zhao, L.-X.; Yang, X.; Wang, Y.-H.; Xu, B.-R.; Liang, B. Innovative design and study of an oil-water coupling separation magnetic hydrocyclone. Sep. Purif. Technol. 2019, 213, 389–400. [Google Scholar] [CrossRef]
- Ye, J.; Xu, Y.; Song, X.; Yu, J. Novel conical section design for ultra-fine particles classification by a hydrocyclone. Chem. Eng. Res. Des. 2019, 144, 135–149. [Google Scholar] [CrossRef]
- Rasyid, M.A.; Jokovic, V.; Morrison, R. Classification performance of semi-inverted hydrocyclones. Miner. Eng. 2019, 142, 105889. [Google Scholar] [CrossRef]
- Jokovic, V.; Morrison, R.; Alexander, D. Can the performance of semi-inverted hydrocyclones be similar to fine screening? Miner. Eng. 2020, 146, 106147. [Google Scholar] [CrossRef]
- Tang, B.; Xu, Y.X.; Song, X.F.; Ze, S.; Yu, J. Effect of inlet configuration on hydrocyclone performance. Trans. Nonferrous Met. Soc. China 2017, 27, 1645–1655. [Google Scholar] [CrossRef]
- Jiang, L.; Liu, P.; Yang, X.; Zhang, Y.; Wang, H. Designing W-shaped apex for improving the separation efficiency of a full-column hydrocyclone. Sep. Sci. Technol. 2019, 1–17. [Google Scholar] [CrossRef]
- Zou, J.; Wang, C.; Ji, C. Experimental study on the air core in a hydrocyclone. Dry. Technol. 2015, 34, 854–860. [Google Scholar] [CrossRef]
- Pérez, D.; Cornejo, P.; Rodríguez, C.; Concha, F. Transition from spray to roping in hydrocyclones. Miner. Eng. 2018, 123, 71–84. [Google Scholar] [CrossRef]
- Chang, Y.-L.; Wang, H.; Jin, J.-H.; Liu, Z.-M.; Lv, W.-J. Flow distribution and pressure drop in UZ-type mini-hydrocyclone group arranged in compact parallel manifolds. Exp. Therm. Fluid Sci. 2019, 100, 114–123. [Google Scholar] [CrossRef]
- Martínez, L.F.; Lavín, A.G.; Mahamud, M.M.; Bueno, J.L. Vortex finder optimum length in hydrocyclone separation. Chem. Eng. Process. Process. Intensif. 2008, 47, 192–199. [Google Scholar] [CrossRef]
- Tang, B.; Xu, Y.; Song, X.; Sun, Z.; Yu, J. Numerical study on the relationship between high sharpness and configurations of the vortex finder of a hydrocyclone by central composite design. Chem. Eng. J. 2015, 278, 504–516. [Google Scholar] [CrossRef]
- Kılavuz, F.Ş.; Gülsoy, Ö.Y. The effect of cone ratio on the separation efficiency of small diameter hydrocyclones. Int. J. Miner. Process. 2011, 98, 163–167. [Google Scholar] [CrossRef]
- Zhang, C.; Cui, B.; Wei, D.; Lu, S. Effects of underflow orifice diameter on the hydrocyclone separation performance with different feed size distributions. Powder Technol. 2019, 355, 481–494. [Google Scholar] [CrossRef]
- Yu, J.; Fu, J.; Cheng, H.; Cui, Z. Recycling of rare earth particle by mini-hydrocyclones. Waste Manag. 2017, 61, 362–371. [Google Scholar] [CrossRef]
- Bicalho, I.C.; Mognon, J.L.; Shimoyama, J.; Ataíde, C.H.; Duarte, C.R. Effects of Operating Variables on the Yeast Separation Process in a Hydrocyclone. Sep. Sci. Technol. 2013, 48, 915–922. [Google Scholar] [CrossRef]
- Jiang, L.; Liu, P.; Zhang, Y.; Yang, X.; Wang, H.; Gui, X. Design boundary layer structure for improving the particle separation performance of a hydrocyclone. Powder Technol. 2019, 350, 1–14. [Google Scholar] [CrossRef]
- Song, T.; Yao, Y.; Ni, L. Response surface method to study the effect of conical surface and vortex-finder lengths on de-foulant hydrocyclone with reflux ejector. Sep. Purif. Technol. 2020, 253, 117511. [Google Scholar] [CrossRef]
- Jiang, L.; Liu, P.; Yang, X.; Zhang, Y.; Li, X.; Zhang, Y.; Wang, H. Effect of Overflow Pipe on the Internal Flow Fields and Separation Performance of W-Shaped Hydrocyclones. Minerals 2020, 10, 329. [Google Scholar] [CrossRef]
- Cui, B.; Zhang, C.; Wei, D.; Lu, S.; Feng, Y. Effects of feed size distribution on separation performance of hydrocyclones with different vortex finder diameters. Powder Technol. 2017, 322, 114–123. [Google Scholar] [CrossRef]
- Tian, J.; Ni, L.; Song, T.; Zhao, J. CFD simulation of hydrocyclone-separation performance influenced by reflux device and different vortex-finder lengths. Sep. Purif. Technol. 2020, 233, 116013. [Google Scholar] [CrossRef]
- Jiang, L.; Liu, P.; Yang, X.; Zhang, Y.; Li, X.; Zhang, Y.; Wang, H. Experimental research on the separation performance of W-shaped hydrocyclone. Powder Technol. 2020, 372, 532–541. [Google Scholar] [CrossRef]
- Neesse, T.; Dueck, J.; Schwemmer, H.; Farghaly, M. Using a high pressure hydrocyclone for solids classification in the submicron range. Miner. Eng. 2015, 71, 85–88. [Google Scholar] [CrossRef]


Publisher’s Note: MDPI stays neutral with regard to jurisdictional claims in published maps and institutional affiliations. |
© 2021 by the authors. Licensee MDPI, Basel, Switzerland. This article is an open access article distributed under the terms and conditions of the Creative Commons Attribution (CC BY) license (http://creativecommons.org/licenses/by/4.0/).