Article

Phase Transitions in Natural Vanadinite at High Pressures

1
School of Gemmology, China University of Geosciences, Beijing 100083, China
2
Hawaii Institute of Geophysics and Planetology, University of Hawaii at Manoa, Honolulu, HI 96822, USA
3
Gemmological Institute, School of Earth Sciences, China University of Geosciences, Wuhan 430074, China
4
Argonne National Laboratory, Center for Advanced Radiation Sources, University of Chicago, Lemont, IL 60439, USA
*
Authors to whom correspondence should be addressed.
Minerals 2021, 11(11), 1217; https://doi.org/10.3390/min11111217
Submission received: 23 August 2021 / Revised: 25 October 2021 / Accepted: 28 October 2021 / Published: 31 October 2021
(This article belongs to the Special Issue Minerals under Extreme Conditions)

Abstract

:
The structural stability of vanadinite, Pb5[VO4]3Cl, is reported by high-pressure experiments using synchrotron radiation X-ray diffraction (XRD) and Raman spectroscopy. XRD experiments were performed up to 44.6 GPa and 700 K using an externally-heated diamond anvil cell (EHDAC), and Raman spectroscopy measurements were performed up to 26.8 GPa at room temperature. XRD experiments revealed a reversible phase transition of vanadinite at 23 GPa and 600 K, which is accompanied by a discontinuous volume reduction and color change of the mineral from transparent to reddish during compression. The high-pressure Raman spectra of vanadinite show apparent changes between 18.0 and 22.8 GPa and finally become amorphous at 26.8 GPa, suggesting structural transitions of this mineral upon compression. The structural changes can be distinguished by the emergence of a new vibrational mode that can be attributed to the distortion of [VO4] and the larger distortion of the V–O bonds, respectively. The [VO4] internal modes in vanadinite give isothermal mode Grüneisen parameters varying from 0.149 to 0.286, yielding an average VO4 internal mode Grüneisen parameters of 0.202.

1. Introduction

Apatite group minerals with the general formula A5(BO4)3X allow numerous substitutions of cations or anions in their crystal structures and have widespread industrial applications, i.e., as metal sequestration agents for water treatment and contaminated soil remediation [1,2,3], photo-catalytic materials [4,5], and nuclear waste storage materials [6,7,8]. Moreover, apatite group minerals play important roles in many geological settings and serve as potential phosphorus-bearing phase in the Earth’s deep mantle through subduction and sensitive tracers for magma derivation/evolution [9,10,11,12]. It is crucial to understand the stability and properties of apatite-group minerals at high pressures, especially during the slab subduction. Thus, their high-pressure and high-temperature behaviors have been widely investigated [13,14,15,16,17,18,19].
Vanadinite Pb5[VO4]3Cl is a vanadate apatite group mineral, with a structure related to that of hexagonal apatite Ca5[PO4]3(F,Cl,OH) (space group P63/m). It is often associated with other accessory minerals such as mimetite and pyromorphite. One of the most important countries of origin for vanadinite is Morocco [20] and Mibladén is one of the main vanadinite localities where there are carbonate-hosted stratabound lead deposits. Vanadinite occurs as an alteration product of galena in close association with barite, cerussite and anglesite [21]. As an apatite-group mineral with the general formula of A4IA6II[BO4]6X2 (AI and AII = Ca2+, Pb2+, Cd2+…, B = P5+, V5+, As5+…, X = F, Cl, Br, OH), vanadinite adopts a “hexagonal network” [22], composed of AOn polyhedra and isolated BO4 tetrahedra and forming large [1]-channels, where the X anions locate [13]. The refined bond-distances in vanadinite suggest that the real coordination number (CN) of Pb1 site is 9 (i.e., Pb1O9, with three Pb-O1, Pb-O2 and Pb-O3 bond-lengths around 2.49 Å, 2.75 Å and 2.94 Å, respectively) and the CN of Pb2 site is 8 (i.e., Pb2O6Cl2, with five Pb2-O bond-lengths ranging between 2.33 and 2.68 Å, two Pb2-Cl lengths of 3.16 Å and a further remote Pb2-O1 distance of 3.22 Å) [23,24].
Previous studies have demonstrated that vanadinite remains crystalline up to 7.7 GPa [13] and 8.7 GPa [16] at room temperature condition. Compressibility of other apatite-group minerals, such as natural fluorapatite [15,25,26], pyromorphite [27,28], and mimetite [27,28], were also studied and no phase transitions were found under their investigated conditions. Furthermore, other analogs of vanadinite were also studied. Zhai et al. [17] observed two new splittings of stronadelphite Sr5(PO4)3F, which are due to ν4b(Ag) and ν3b(Ag) vibrations, at 10.0 and 11.8 GPa by high-pressure Raman experiments up to 21.1 GPa. Upon compression to pressures higher than 20 GPa, new Raman peaks were observed in high pressure experiments of alforsite Ba5(PO4)3Cl [18]. Another analog of vanadinite, Pb5(VO4)3I, was observed to breakdown to Pb3(VO4)2 when the temperature was above 540 K, and completely lost iodine above 680 K [14]. The Pb-containing apatites (Pb5(PO4)3F, Pb5(PO4)3Cl, and Pb5(VO4)3Cl) are shown to undergo phase transitions in a narrow temperature range, 1031–1081 K, which involves a reduction in unit-cell symmetry from hexagonal to monoclinic [29]. However, no phase transition of Sr5(PO4)3F was observed though some vibration modes merged or disappeared during the Raman experiments at increasing temperatures (80–1023 K) [30]. It is noted that most of the experiments on apatite-structure minerals are focused on their compressibilities. Only a few studies reported the characteristics of the high-pressure vibration properties from Raman spectroscopy measurements. Therefore, further studies need to be performed to characterize the structure of apatite-group minerals at higher pressures or high temperatures.
In this study, the stability, phase transition, and vibrational properties of vanadinite at high-pressure and high-temperature (HPHT) conditions were investigated by XRD and Raman spectroscopy. HPHT XRD experiments were performed during multiple heating-compression cycles and HP Raman measurements were performed at room temperature and over the frequency range from 250 to 900 cm−1. The effect of pressure on the characteristic Raman active modes of vanadinite was analyzed. Combined with previous results of isothermal bulk moduli for vanadinite, the isothermal mode Grüneisen parameters of vanadinite are calculated and compared with other phosphate minerals including fluorapatite [31], stronadelphite [17], and alforsite [18].

2. Materials and Methods

Natural gem-quality, transparent and red-orange single crystals of vanadinite from Mibladén in Morocco were used in this study. The microanalysis of its chemical composition was carried out at Beijing Research Institute of Uranium Geology (Beijing, China) by JXA-8100 Electron Probe Micro-analyzer (EPMA), with 20 kV accelerating voltage, 1 × 10⁻⁸ A beam current, and 40° exit angle.
In situ HPHT single-crystal XRD experiments were carried out at beamline 13-BMC with the wavelength of 0.43409 Å at Advanced Photon Source (APS), Argonne National Laboratory (ANL) [32]. A BX90-type diamond anvil cell with a resistive micro-heater [33] was employed to achieve high pressure and high temperature conditions. A rhenium (Re) foil with an initial thickness of 260 µm was used as the gasket. The gasket was pre-indented to a thickness of about 30 µm, and a hole of 120 µm in diameter was drilled at the center to serve as sample chamber. Single crystal vanadinite sample, ruby spheres, and gold were loaded into the sample chamber. Neon was loaded using the COMPRES/GSECARS gas-loading system [34] and serves as the pressure transmitting medium [35]. Gold was used as the primary pressure scale [36], with which pressures were determined before and after each XRD measurement. In order to find evidence of phase transition in vanadinite, several rounds of temperature/pressure changing were carried out. The corresponding PT path of HPHT experiments were illustrated in Figure 1. Each condition was lasted about 30 min. At first temperature was increased from 300 K to 700 K at constant 40 PSI condition. Then, pressure was increased from 50 PSI to 110 PSI at the same temperature 700 K. Subsequently, temperature was decreased from 700 K to 300 K at constant 110 PSI condition. After that the cell was compressed from 110 PSI to 190 PSI at 300 K. These steps were repeated in turn and the experiments was ended at 44.6 GPa and 400 K because of an abrupt gas leaking. The XRD experiments were only performed during compression controlled by a membrane system in 13-BMC, and no XRD data were collected during decompression. DIOPTAS software was used to integrate the XRD patterns [37].
By using a symmetry-type DAC with a pair of 300 µm culet size diamond anvils, which was prepared in a similar manner as XRD experiments, Raman spectra of vanadinite were collected at room temperature using a Dilor micro-Raman system at University of Hawaii at Manoa with a 532 nm wavelength laser and a spectrometer with a liquid nitrogen cooled CCD detector. The experimental pressures were determined by the ruby fluorescence method [38]. The typical data collection time was 120 s for each spectrum after waiting for at least 10 min after each compression.

3. Results and Discussion

3.1. EPMA Data of the Vanadinite Sample

The chemical composition of the vanadinite sample was determined from the average of three analyses of the sample by EPMA. The V2O5, PbO, P2O5, and Cl contents vary from 18.99% to 19.59%, 79.35% to 79.70%, 0.19% to 0.64%, and 0.15% to 0.24%, with the average 19.29%, 79.55%, 0.35%, and 0.19% content respectively. Only one analysis detected 0.05% Na2O content. Therefore, the calculated standard deviations of these contents are 0.24, 0.15, 0.20, 0.04 and 0.02 (for Na2O). The chemical formula of vanadinite was calculated by assuming the number of O atoms being 12, which is determined as Pb5.14Na0.01(V2.83P0.07O12)Cl0.07(F,OH)0.72. As fluorine (F) and hydroxyl (OH) cannot be detected, their contents were calculated by valence balance methods. It is also noted that there is little isomorphic substitution between P and V, Na and Pb elements, the similar phenomena were also be detected by Frost et al. [39].

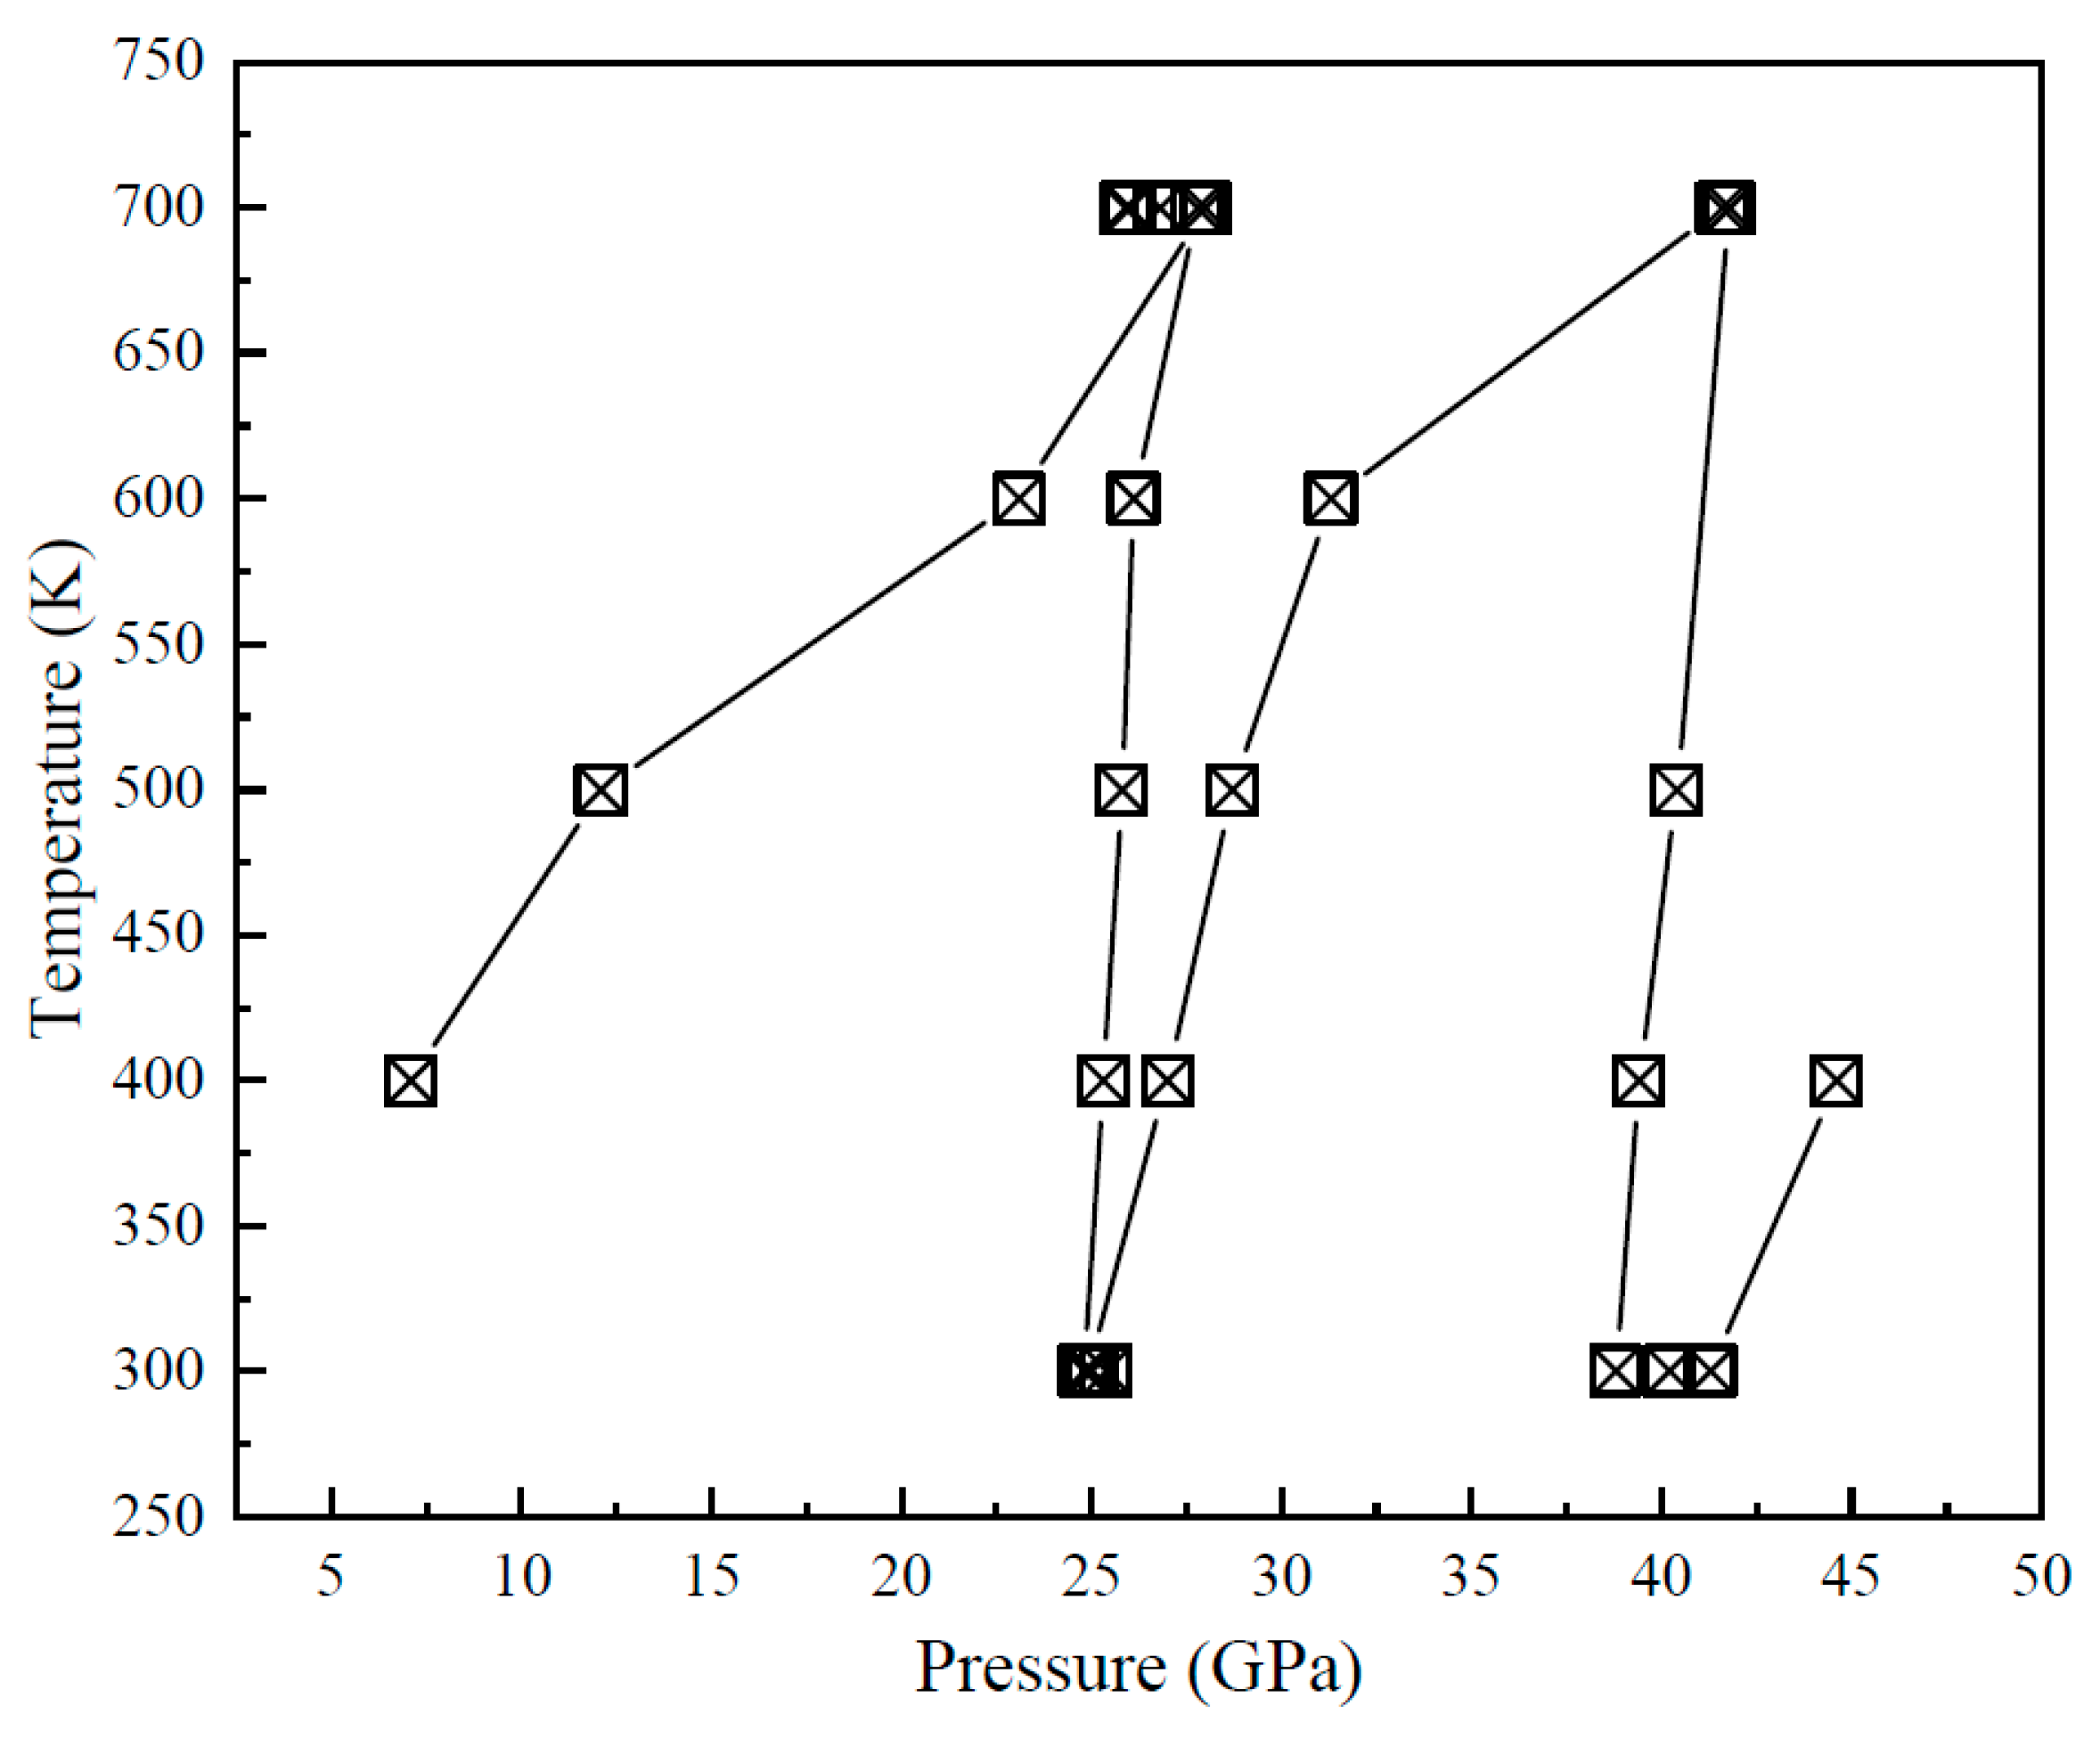
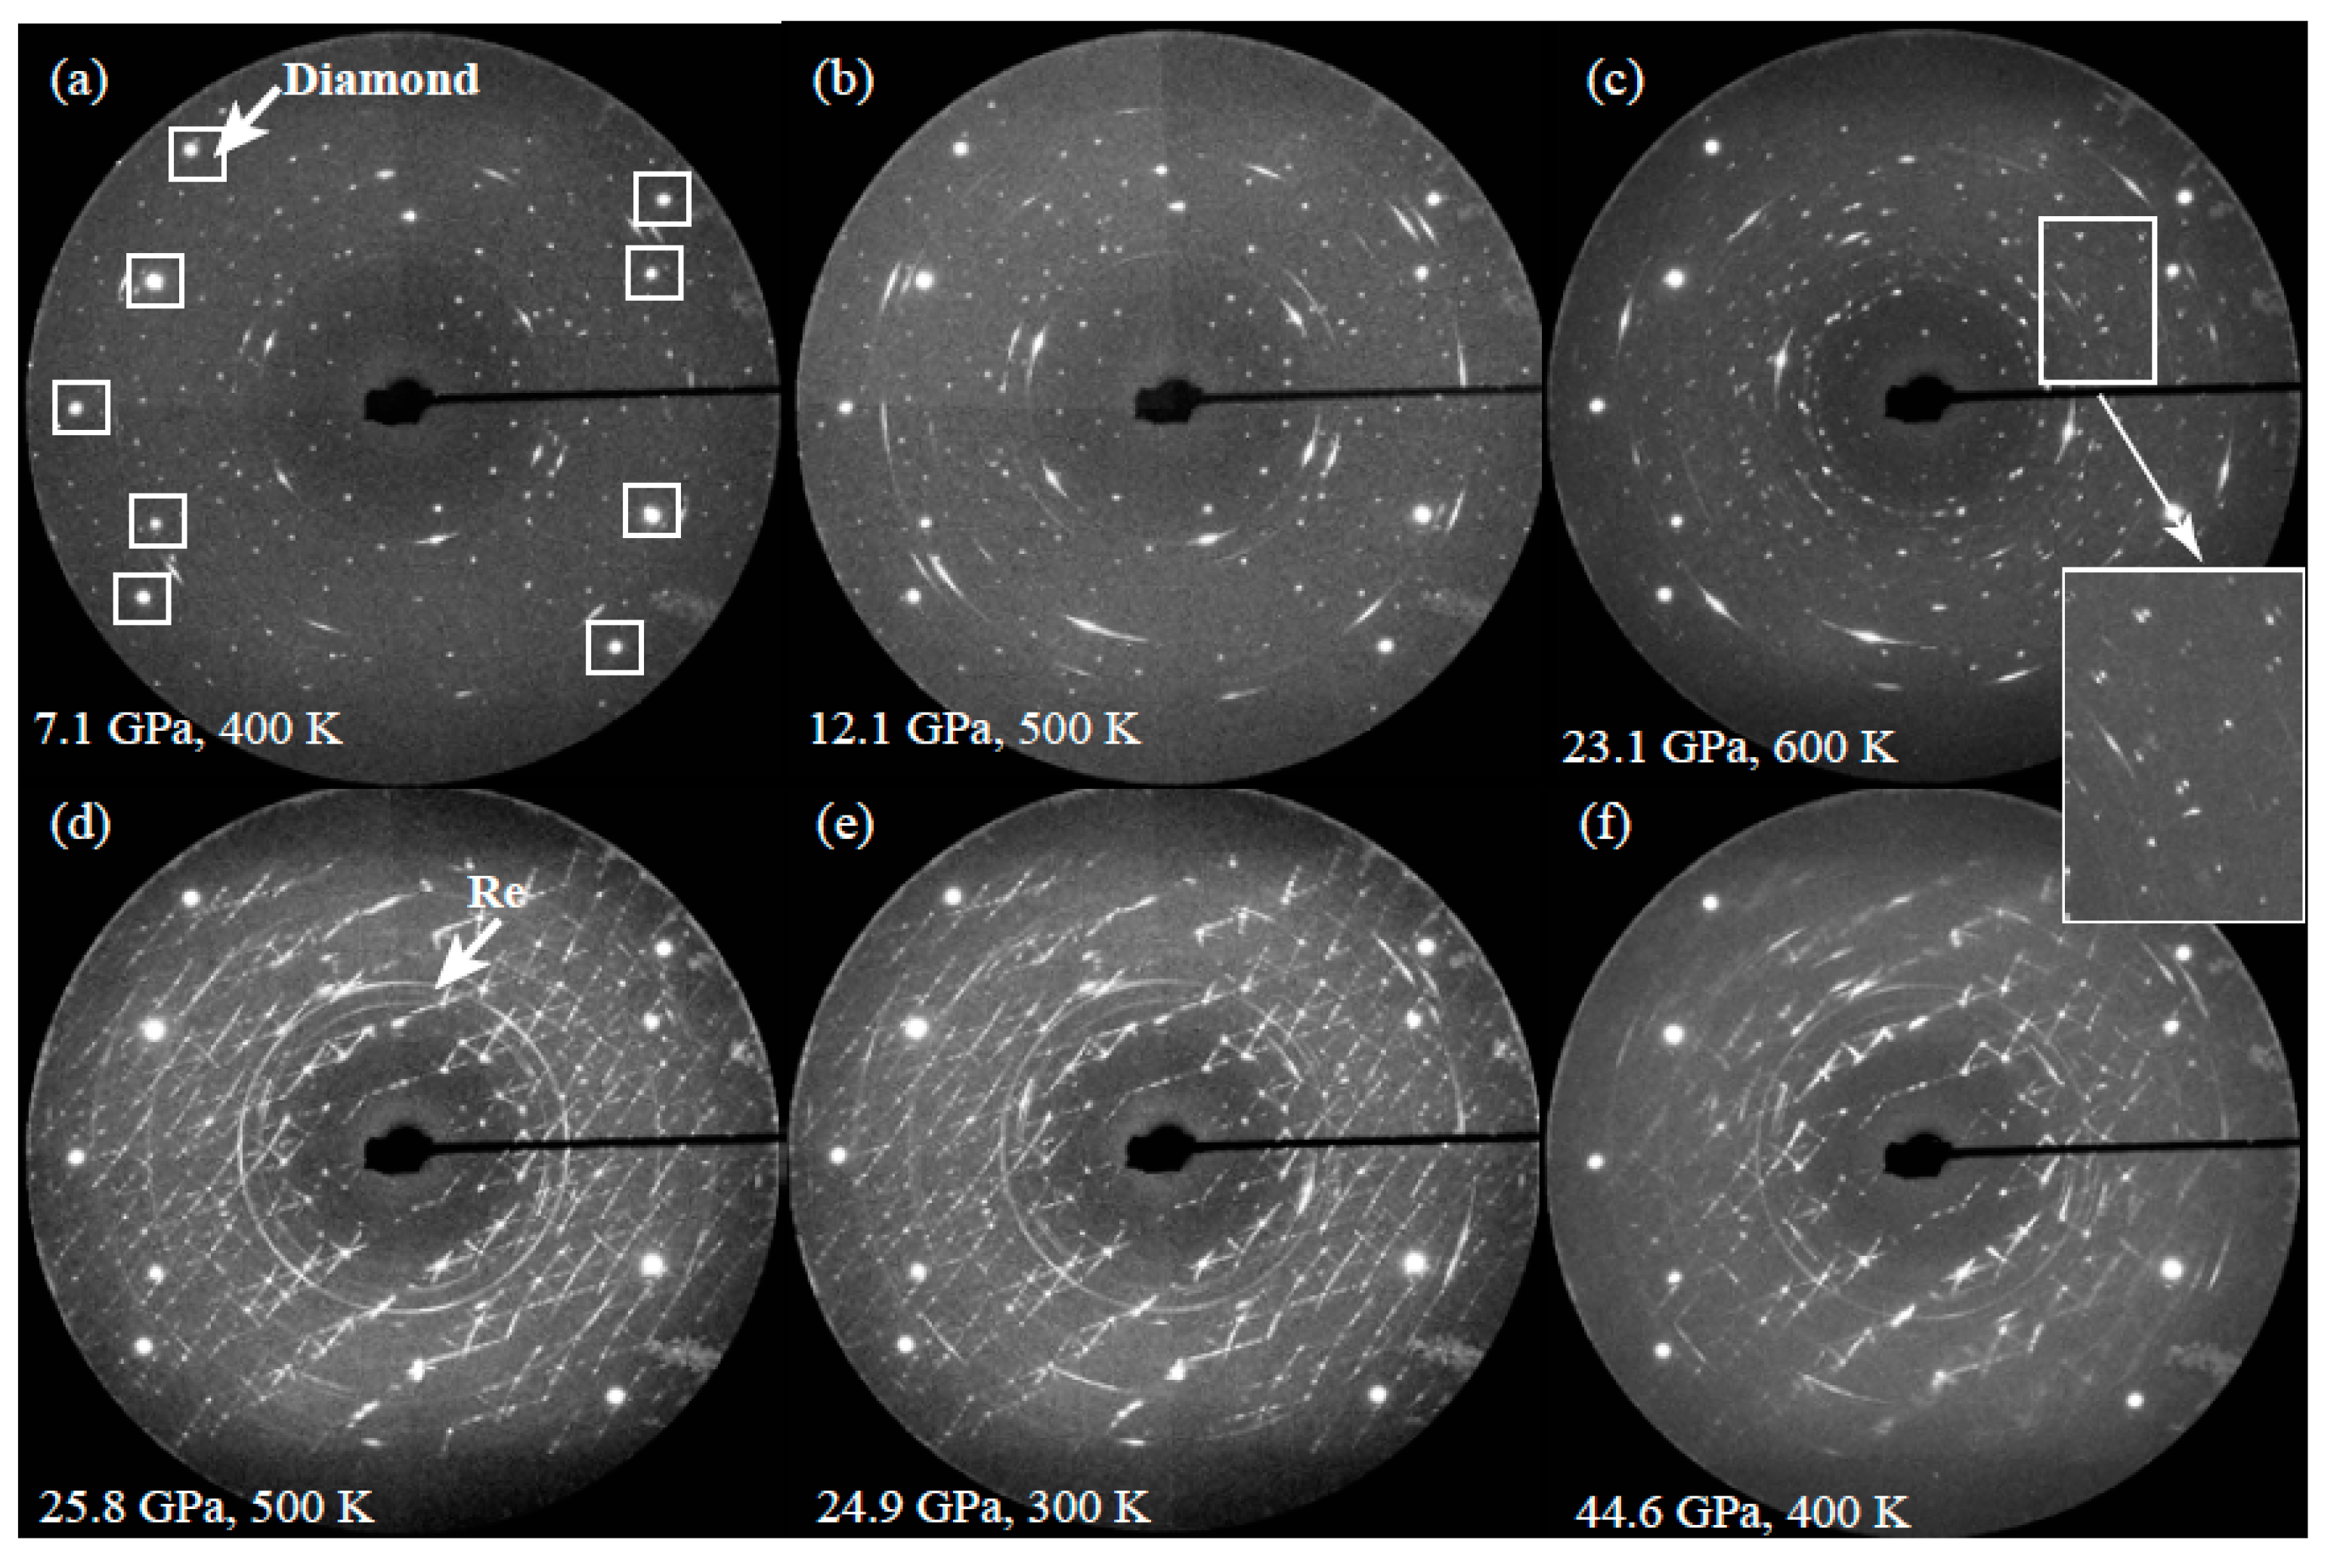
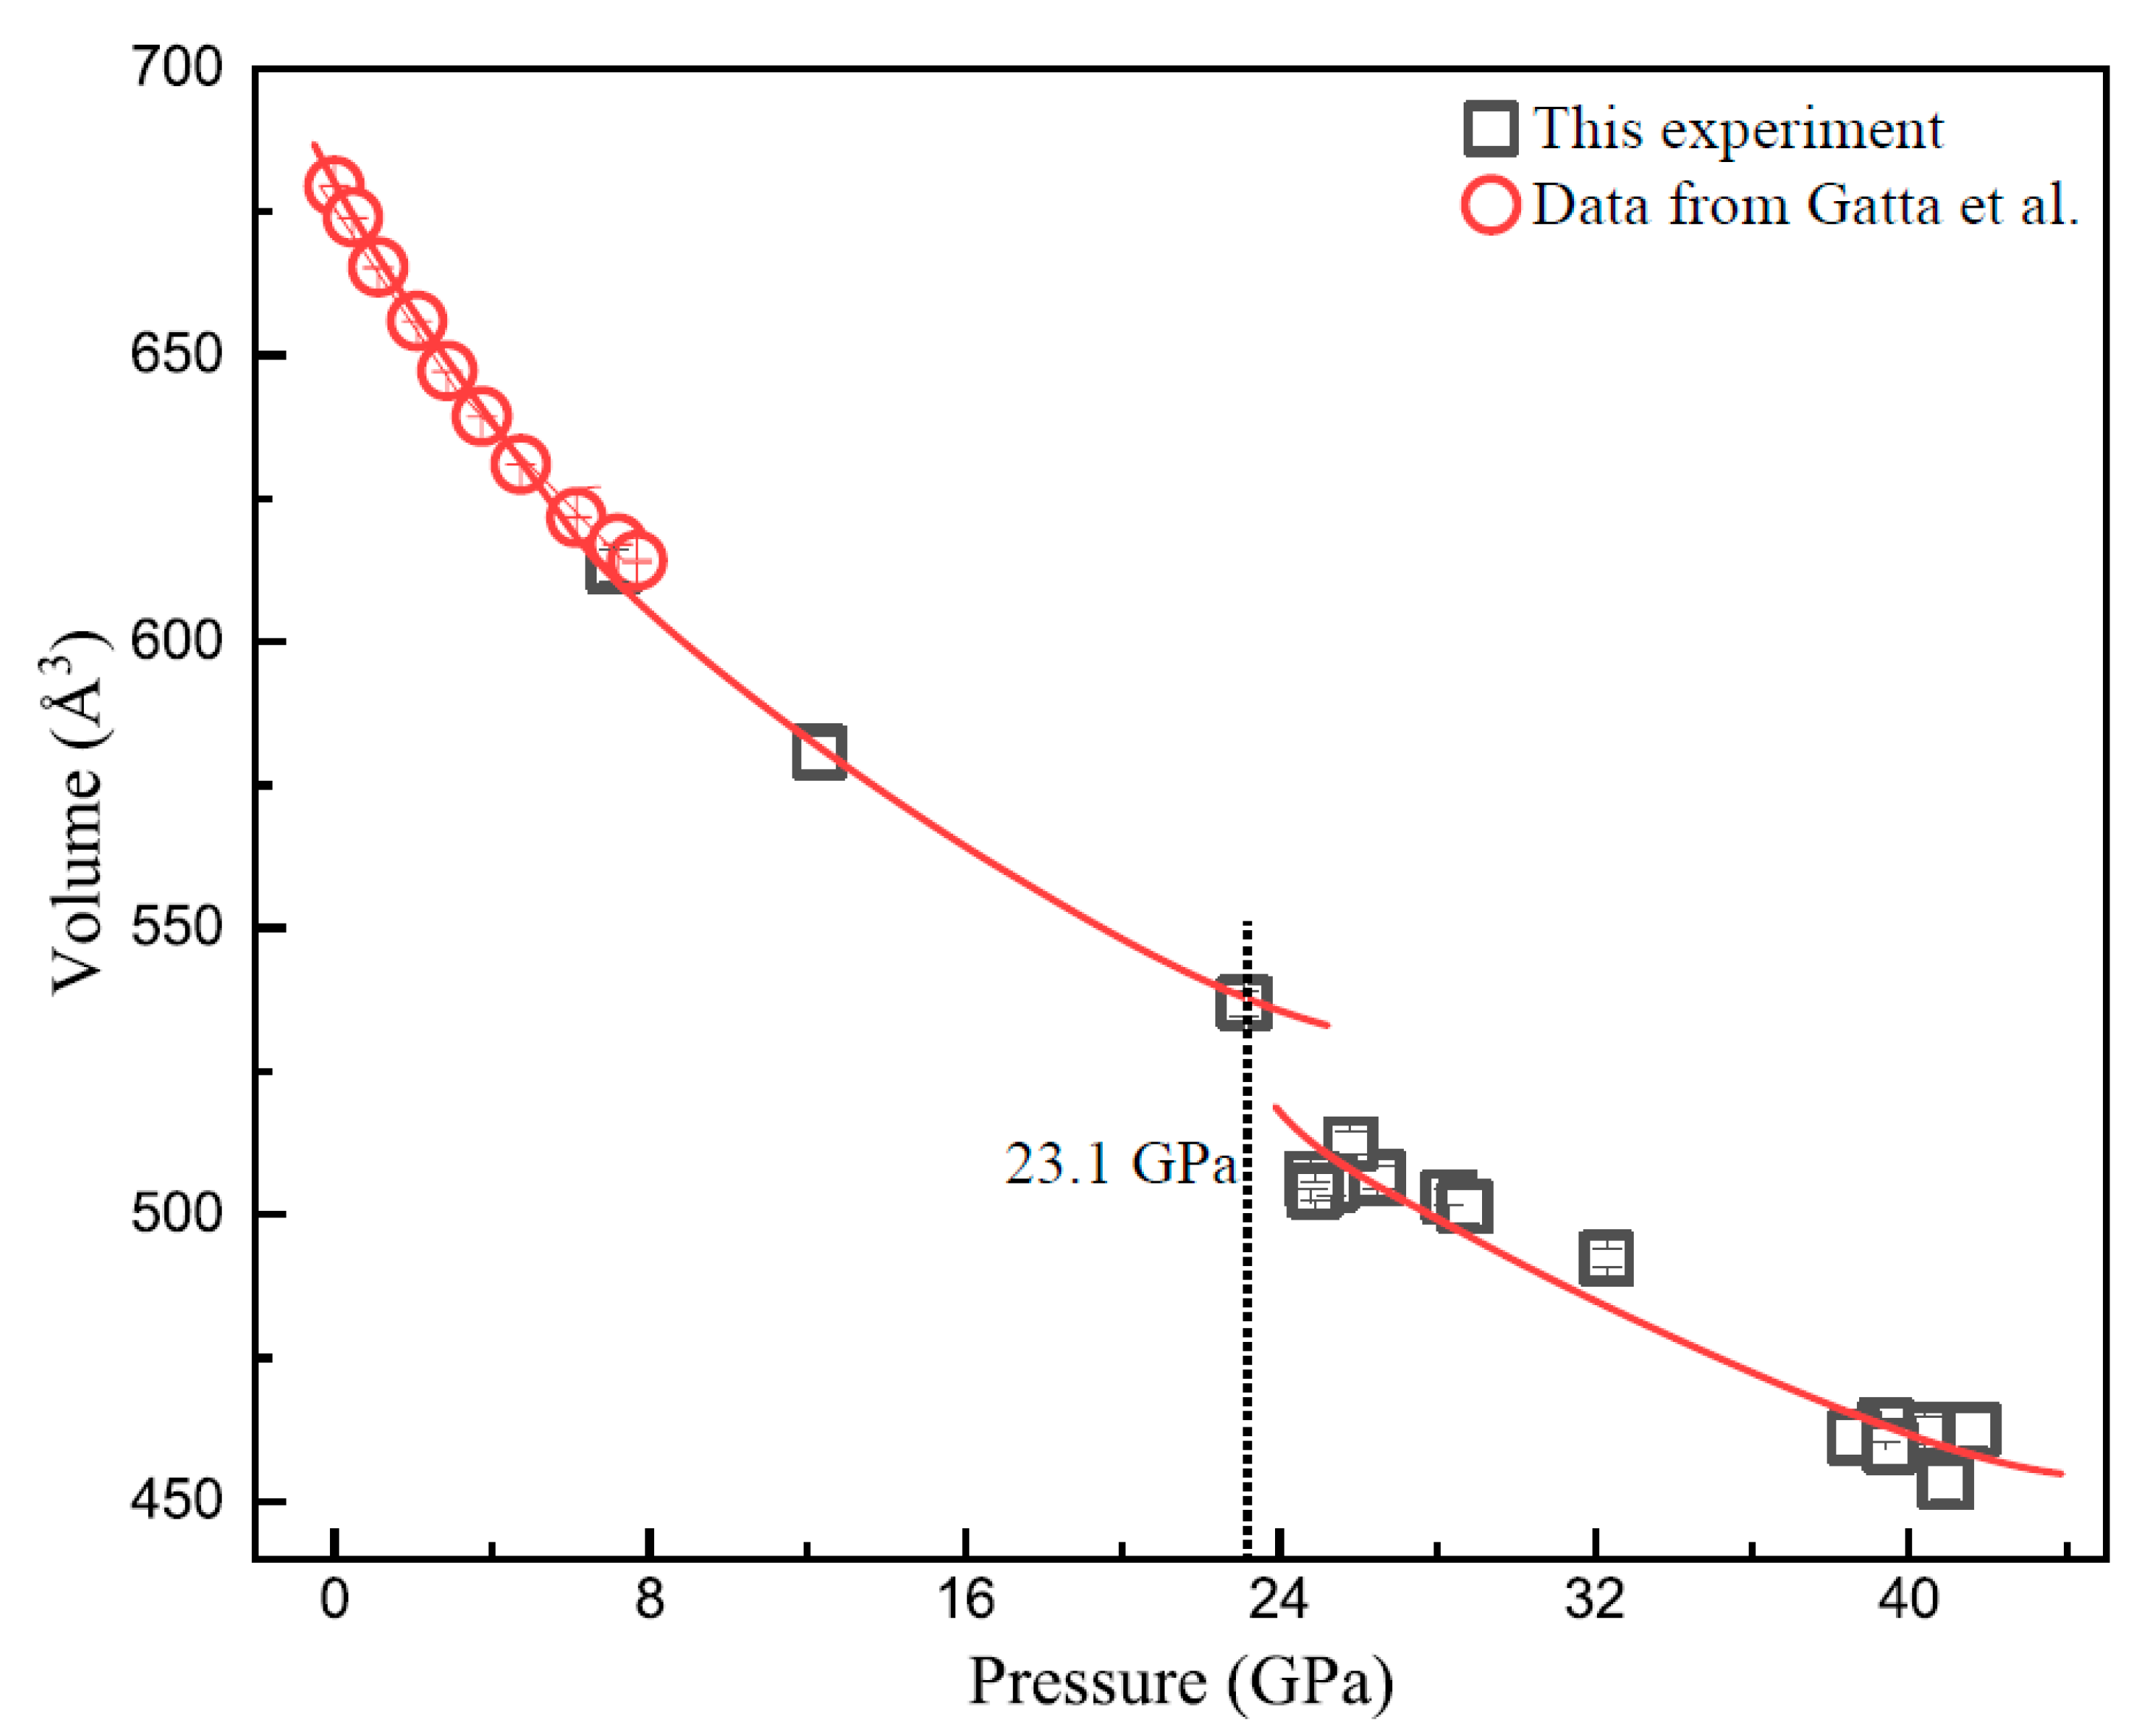
3.2. XRD Results of Vanadinite at HPHT Conditions

Previous experiments suggested that phosphate minerals, such as vanadinite [13], memitite [28,29], pyromorphite [28,29], Pb10[(PO4)6-x(VO4)x]F2 [40], fluorapatite [26], alforsite [18], and tuite [11], remain stable at least up to about 7 GPa, which is consistent with our HPHT XRD data for natural vanadinite collected from 7.1 to 44.6 GPa and at temperatures from 300 to 700 K. Representative XRD patterns collected at HPHT are shown in Figure 2, in which the splittings of Bragg’s peaks emerge at 23.1 GPa and 600 K (the inset in Figure 2). Furthermore, the diffraction patterns became more complex at 25.8 GPa and upon heating to 500 K (Figure 2d), indicative of a displacive phase transition [41].
The opening angle of the DAC, 39°, is not large enough to allow us to process the single crystal XRD data to obtain the detailed structural information. However, the integrated diffraction patterns could be indexed using the PDindexer software with the embedded AMCSD database [42,43]. New peak appears (2θ = 4.72°, d = 5.27 Å) at 23.1 GPa and 600 K (Figure 3a). At 25.8 GPa and 500 K, the indistinct (101) peak appeared (2θ = 4.82°, d = 5.16 Å) (Figure 3a), and the 102 and 210 peaks merge into one at the same condition. All these phenomena are in accordance with the presumed displacive phase transition. Although the experiments of Zhai et al. [44] showed that apatite decomposed to tuite after 24 h heating at 15 GPa and 1800 K in a 1000-tons Kawai-type multi-anvil apparatus, the three strongest (110, 015 and 205) peaks of rhombohedral tuite [43] are not consistent with what were observed in our HPHT XRD patterns (Figure 3a). Therefore, the more complex diffraction patterns here indicate an unknown lower symmetry structure. Figure 4 illustrates the relationship between pressure and volume of the vanadinite sample. An obvious volume reduction is observed at ~23 GPa, signaling a possible phase transition.
Under the optical microscope, an obvious change from transparent to opaque was observed at around 26.2 GPa and 600 K, and the sample remained opaque to the highest pressures. This was verified by a drastic color change from reddish (reddish for naked eye but orange in the photo taken by Leica microscope with Sony camera due to the white-balance setting) to transparent during decompression after the experiments (Figure 3b), indicative a reversible phase transition at ~26.2 GPa. Similar phenomena were observed in many compounds upon compression, i.e., KTb(MoO4)2 [45], siderite [46], and manganotantalite [47]. Jayaraman et al. [45] attributed the color change of KTb(MoO4)2 to 4f-5d transition in Tb initiated by the structural transition, and consequent intervalence charge transfer between Tb and Mo. Müeller et al. [46] associated the transparent-green color change of siderite to the spin transition. Liu et al. [47] explained the phenomenon by the alteration of electronic structure properties and a narrowing of band gap in Mn(Ta,Nb)2O6. It is anticipated that the transparent-reddish color change of vanadinite observed in this study likely results from the energy level splitting of transition element V. Future experiments and theoretical calculations are necessary to fully understand the character of reversible pressure-induced color changes in vanadinite.

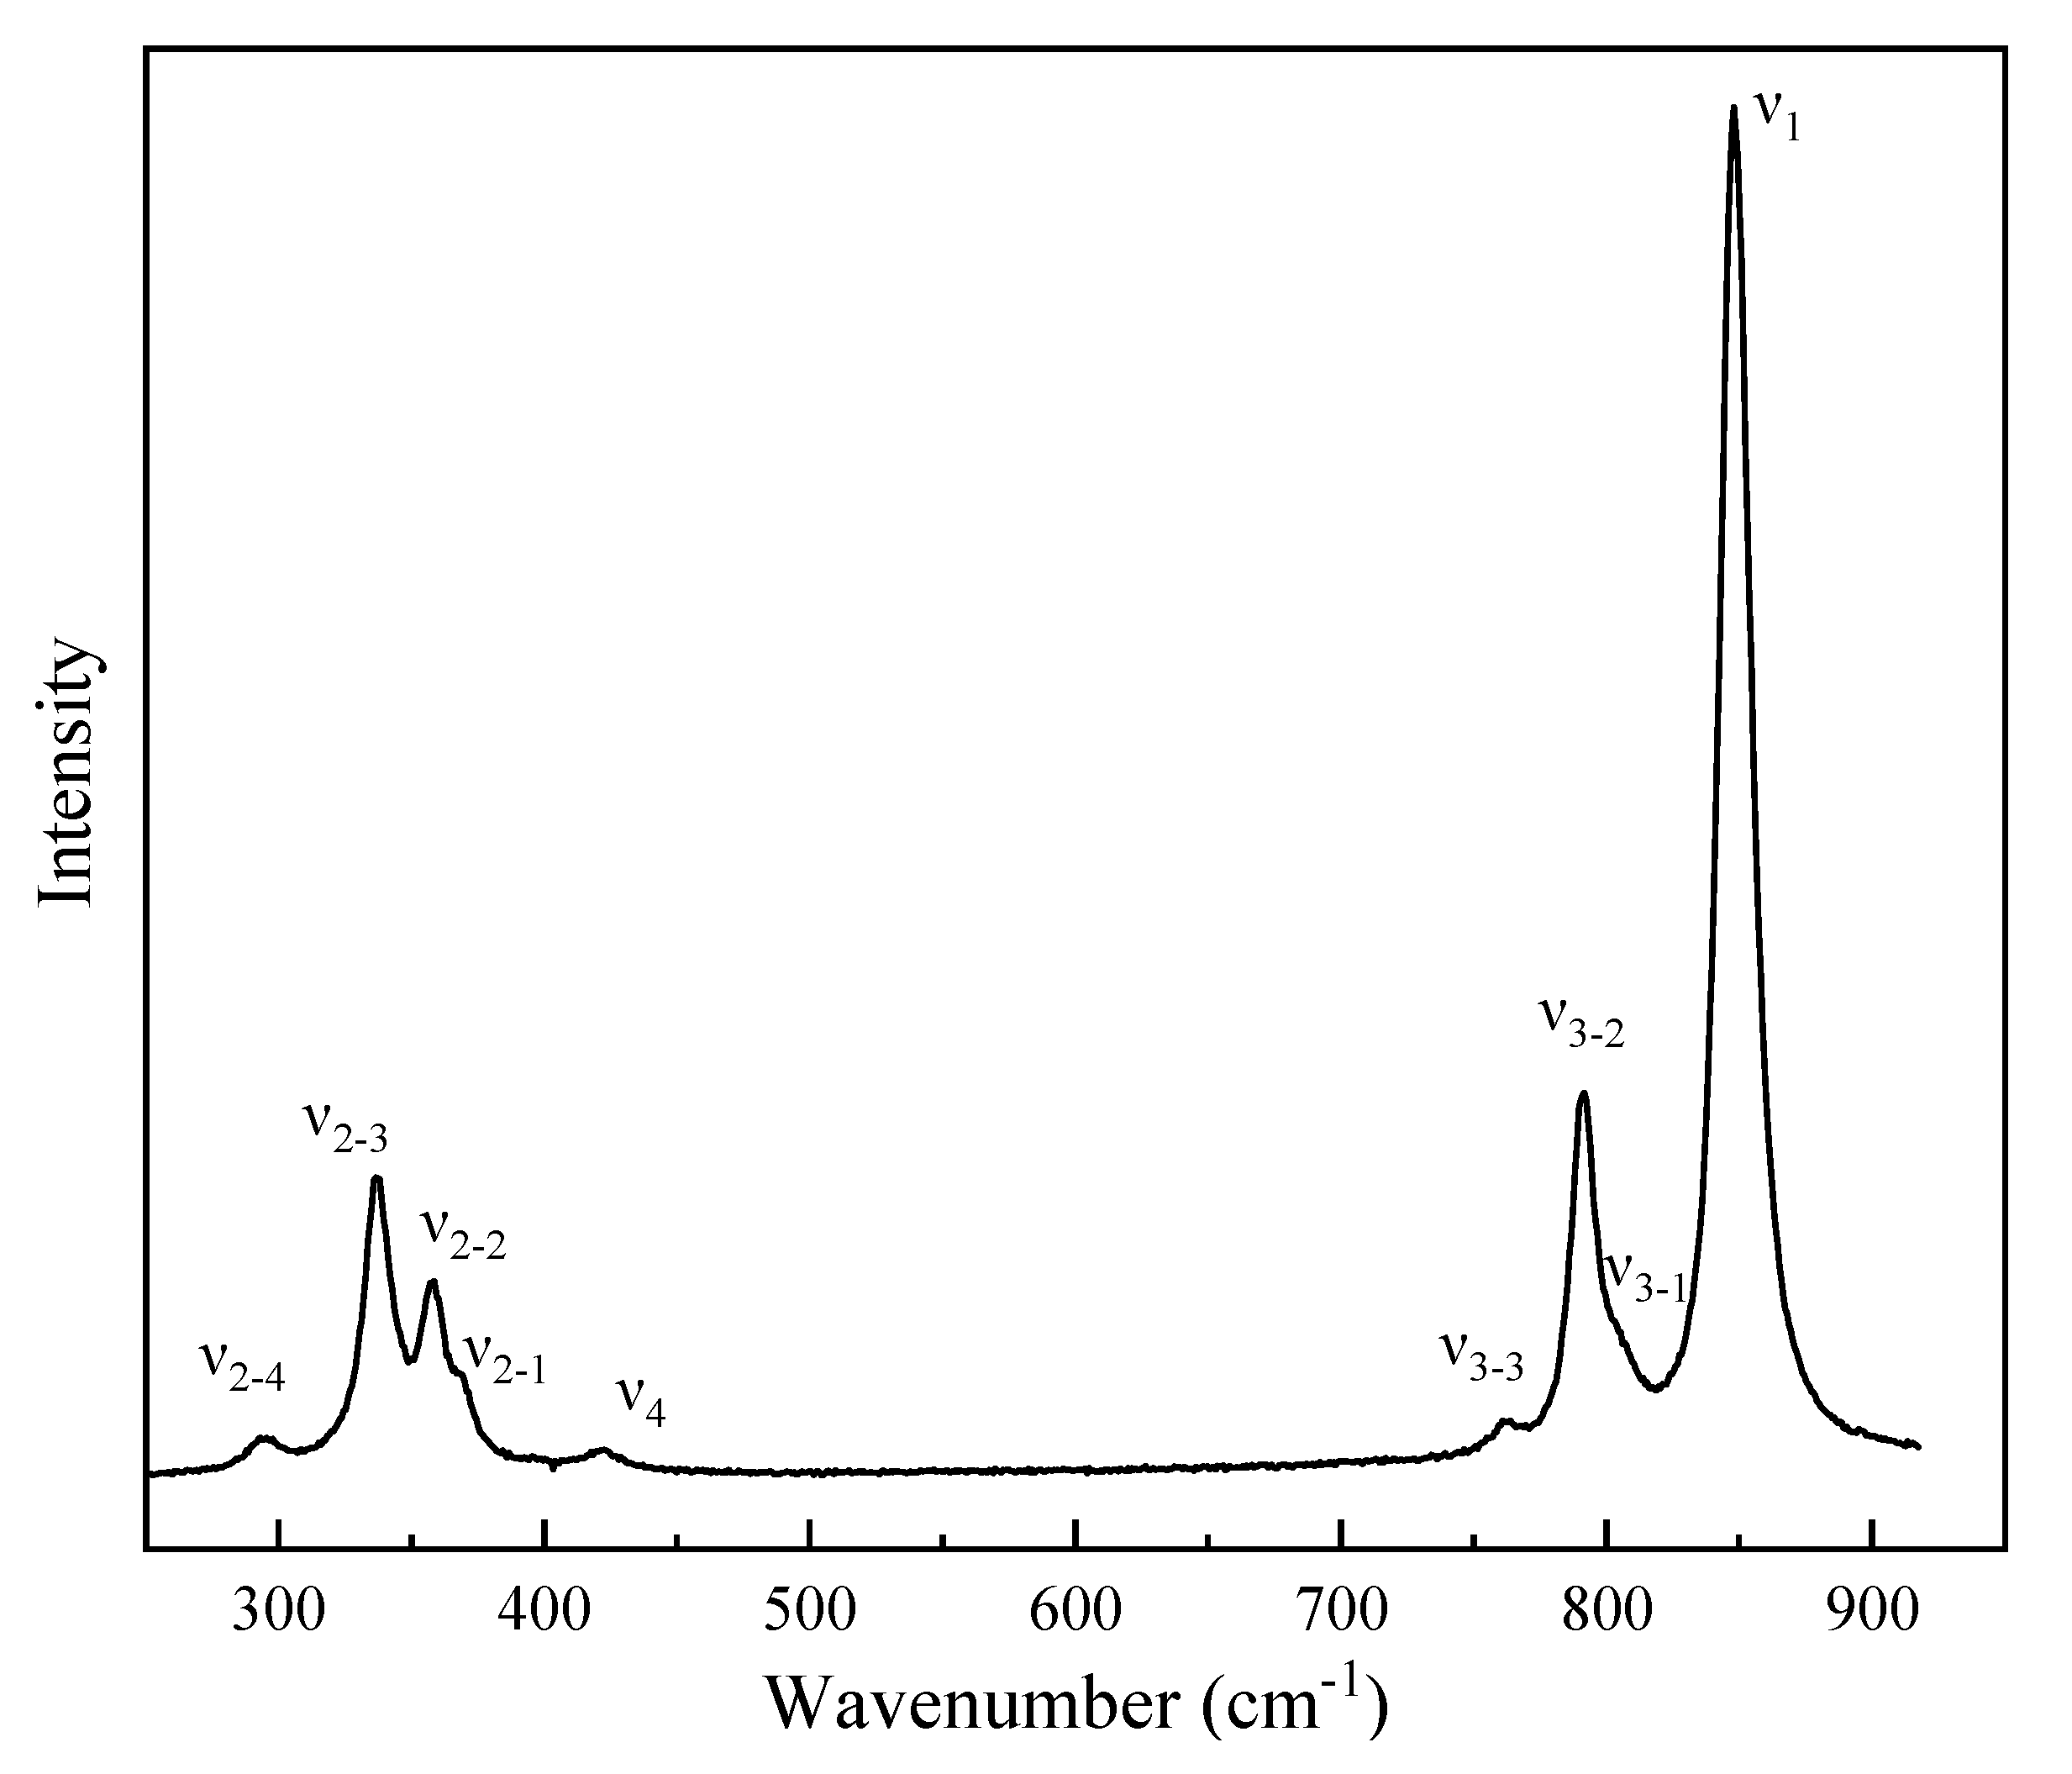
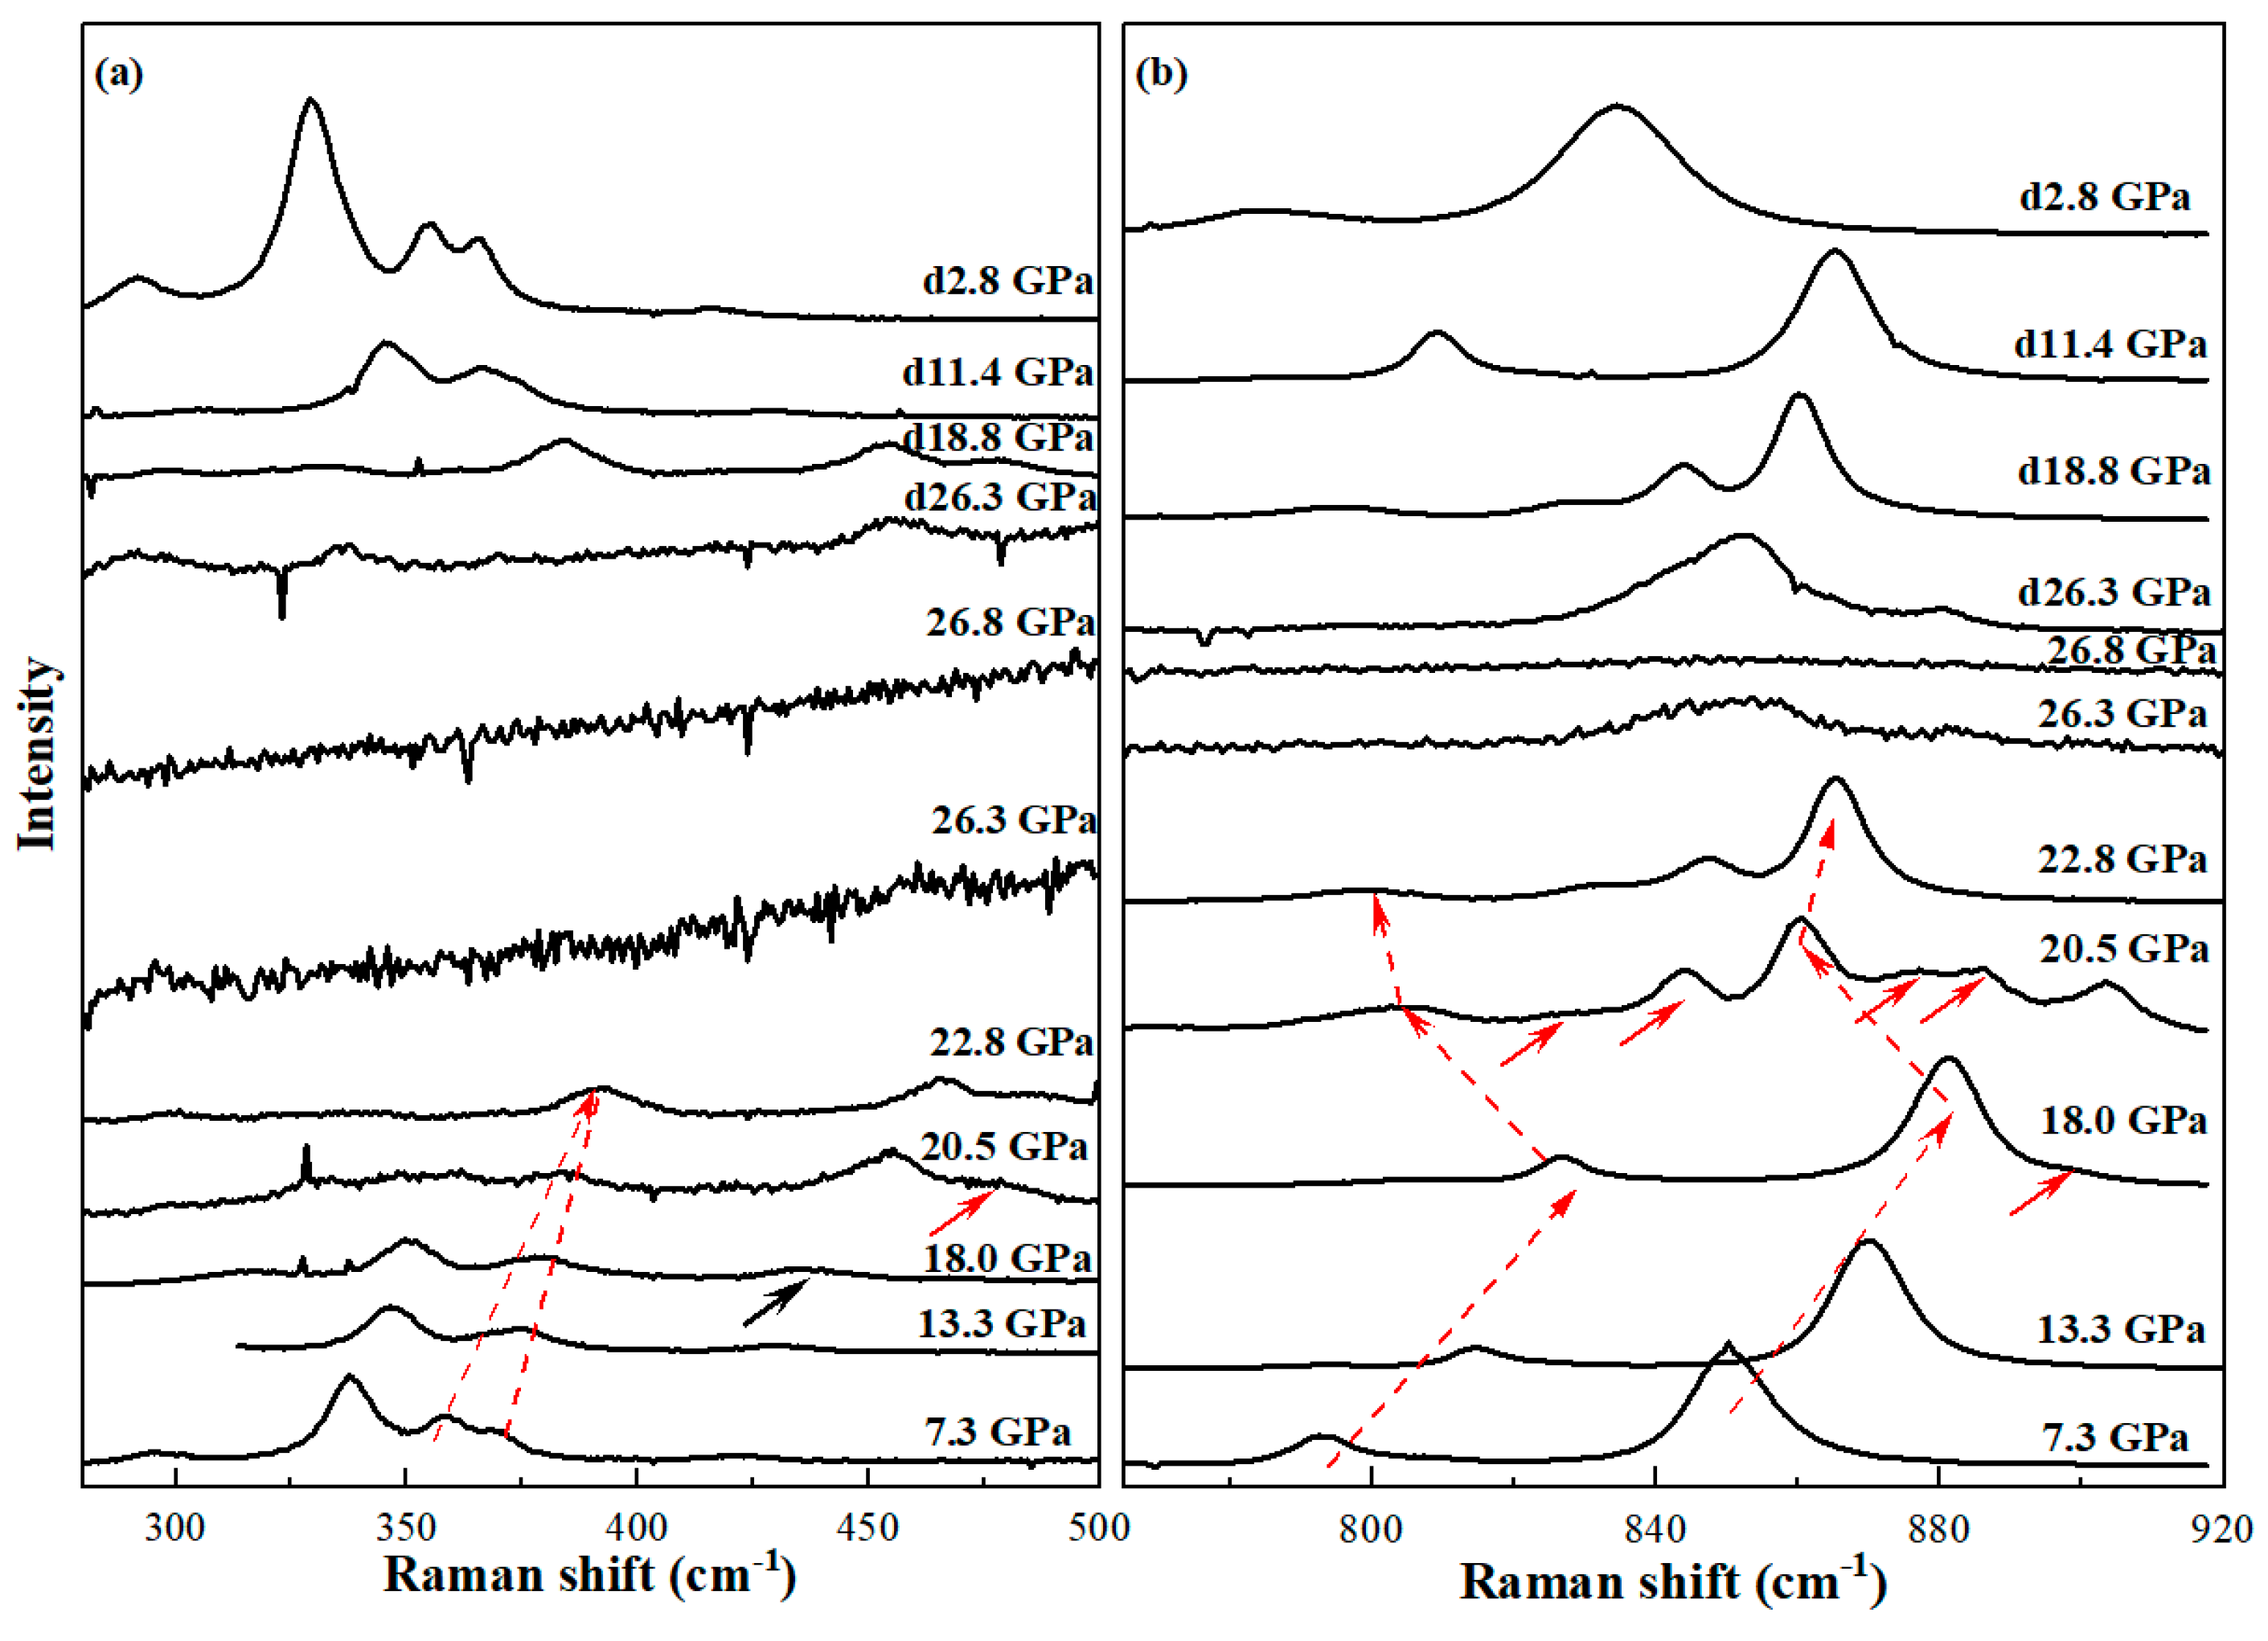
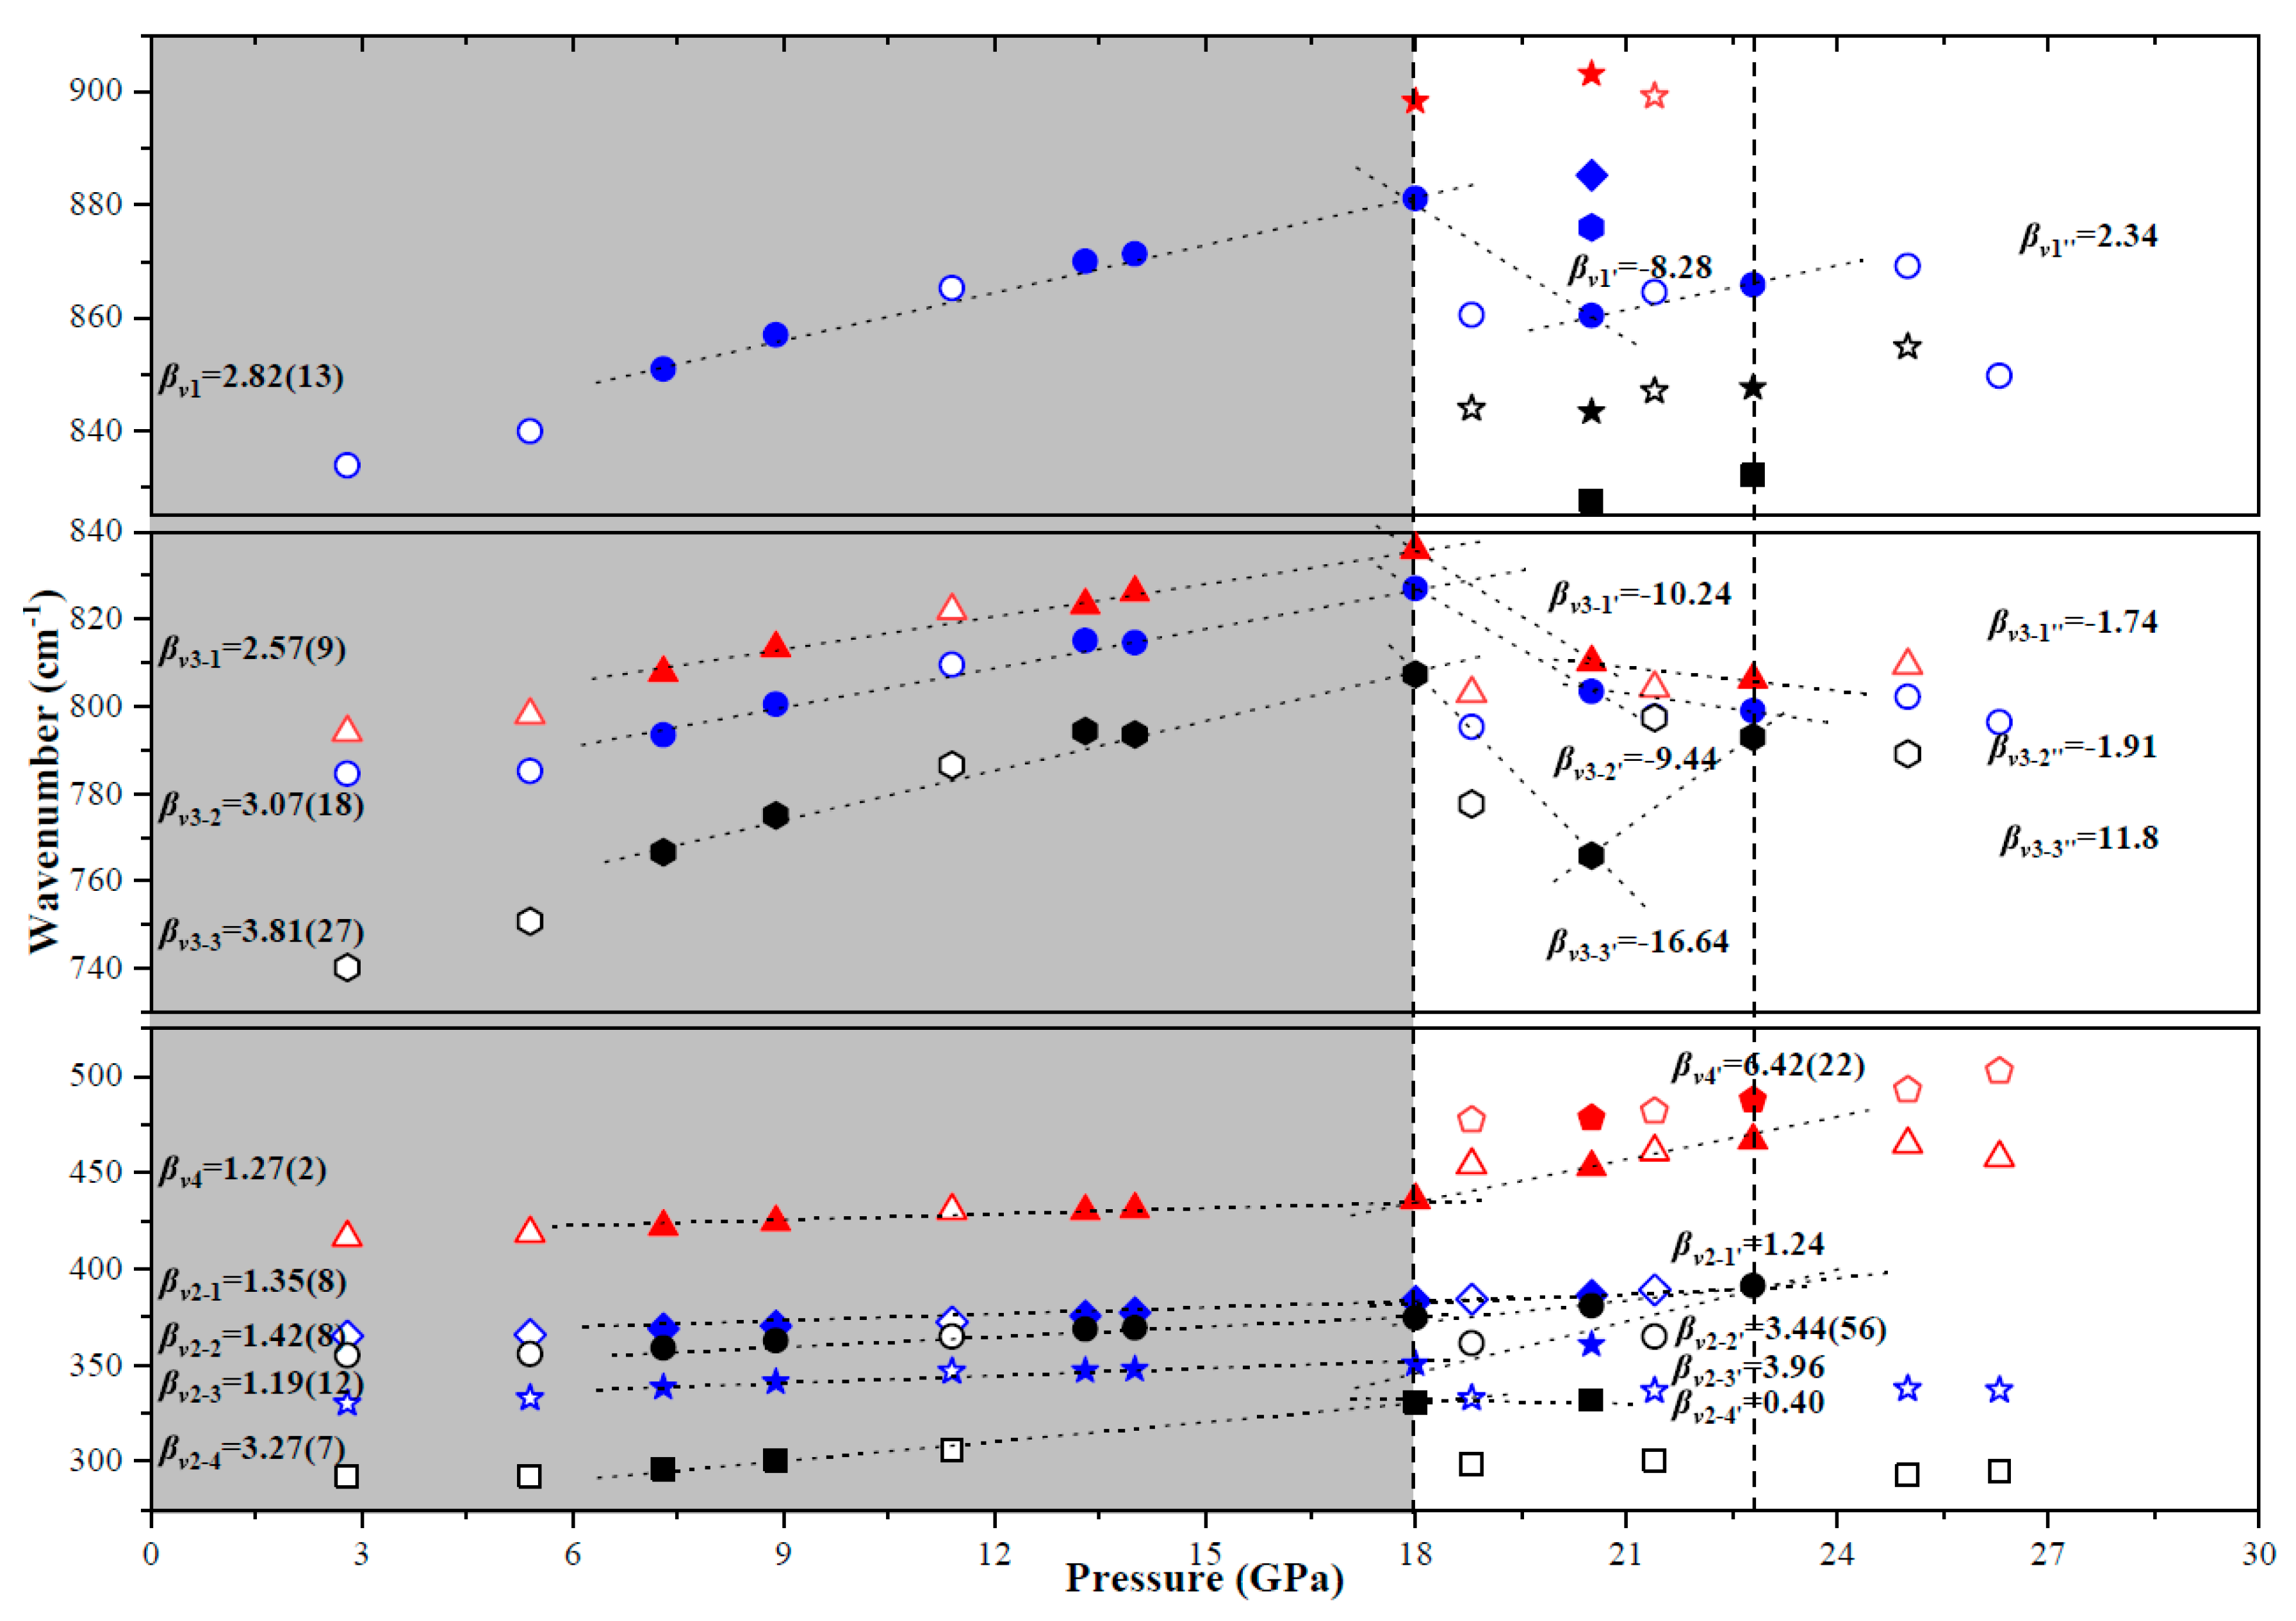
3.3. Raman Spectroscopy Studies of Vanadinite at Ambient Conditions and High Pressures

Raman spectra of free VO43− and PO43− ions, as well as of pure vanadinite and pyromorphite have been investigated by many authors [18,39,48,49,50]. In general, four bands resulting from vibration of the undistorted free VO43− molecule can be observed [39,48]. Only three bands are observed in synthetic pyromorphite-vanadinite solid solutions due to the distorted VO43− ions [50]. Bartholomai et al. [48] observed the υ1 band at 825 cm1, υ3 at 792 and 718 cm1, υ2 at 322 and 291 cm1 and υ4 at 414, 354 and 322 cm1. Frost et al. [39] have studied the Raman spectra of [Pb5(VO4)3Cl] specimens from three localities, and they assigned the intense band at 827 cm1 to the υ1 symmetric stretching vibration, the two splitting bands 815 and 790 cm−1 to be the υ3 antisymmetric stretching modes, the 414 and 395 cm1 bands to be υ4 modes, the complex bands at 366, 355, 323 and 290 cm1 to be the υ2 vibration.
The Raman spectrum of our vanadinite sample was collected at ambient conditions (Figure 5). A total of nine bands are observed, which is less than the predicted internal and external modes in some apatite-structured phosphate [18,50,51,52], but agrees with other vanadinite specimens [39,50]. The strongest single band observed at 848 cm−1 is assigned to the ν1 symmetric stretching mode [50] and three bands at 802, 791 and 760 cm−1 are attributed to ν3 antisymmetric stretching modes, respectively. The relatively broad 420 cm−1 band is attributed to the ν4 OVO bending vibration [50]. The other four overlapping ν2 symmetric bending modes are located narrowly at 367, 357, 336 and 295 cm−1, which are caused by the lowering of the VO43− symmetry within the vanadinite structure [50]. The Raman active modes of vanadinite are in good agreement with previous studies, in which it was found that the ν1 symmetric stretching band in mimetite-arsenian pyromorphite [39] and pyromorphite-vanadinite solid solutions [50] shifts toward lower wavenumber with the increase of the atomic mass in [BO4] tetrahedra (B = P, V, As). This can be anticipated, because the frequency of a Raman band is dependent on lattice vibrations, the masses of the atoms/ions, and the strength between the atoms/ions [17,53].
Ten HP Raman spectra were collected from 7.3 GPa and up to 26.8 GPa. Seven Raman spectra of decompression were also measured. Figure 6 presents the selected Raman spectra, which have typical changes at different pressures. Peak shifts at HP are summarized and illustrated in Table 1 and Figure 7. Due to the presence of a fluorescent background in the spectra recorded from the diamond anvil, the quality of Raman spectra obtained during compression is not so good as that collected in open air at ambient conditions, such as the intensities of ν3-2 band around 791 cm1 and ν2-4 band around 295 cm1. Their intensities become lower and even unresolvable at higher pressures. It is shown in Figure 6 that all peaks display significant blue-shift upon compression to higher pressures. This is likely caused by the shorter Pb–O and V–O bond lengths which is response to the increasing pressure and stronger bonds, larger force constant and consequently higher vibrational frequency according to Hooke’s law.
The relatively smooth evolution of the Raman modes pressures up to 18.0 GPa may be attributed by relative displacements of cations, and perhaps coupled with slight distortions of the VO4 tetrahedra [54]. At 18.0 GPa, a new vibrational band observed in 903 cm−1 emerges (red arrows in Figure 6b). Similarly, a new ν1 Raman mode of alforsite Ba5(PO4)3Cl was observed to occur at 24.1 GPa and was attributed to the new splitting of the PO4 tetrahedra internal modes under high pressure and indicating the intensification of the PO4 unit distortion [18]. It is contrary to the lessening of the PO4 tetrahedra distortion in other fluorapatite high-pressure Raman studies [27,31]. Meanwhile, the ν4 band becomes substantial at 18.0 GPa (black arrows in Figure 6a), which indicates the stronger bending vibration between OVO atoms.
When pressure reaches 20.5 GPa, substantial changes are observed in the Raman spectra. The new bands around 903 cm−1 become stronger (Figure 6b). Other five new bands (red arrows in Figure 6) appeared on both sides of ν1 mode (around 860 cm−1) and lower frequency around 478 cm−1, accompanying the obvious red-shift of ν1 and ν3 bands (detailed shifts shown in Table 1). The similar new bands with higher energy and opposite shift in Raman peaks with applied pressure were also observed for other apatite group minerals, such as Sr5(PO4)3F [17], Ba5(PO4)3Cl [18], Ba3(VO4)2 [54], and Ca9R(VO4)7 (R = La, Nd, Gd) [55]. Zhai et al. [17,18] attributed these new bands to the new splitting of PO4 internal Raman modes under high pressures. Grzechnik and McMillan [54] proposed that adjacent distorted VO4 group in Ba3(VO4)2 may be forced together via edge- or corner-sharing, which attributed to the condensations under compression and caused the significant changes of Raman modes. Kosyl et al. [55] observed opposite shift in Ca9R(VO4)7 Raman peaks at pressure of ~9–11 GPa and attributed them to phase transitions. Although the structure of vanadate and vanadinite are different from each other, their Raman spectra have two same main groups of bands corresponding to the V–O stretching modes (750–850 cm1) and O–V–O bending modes (300–400 cm1), respectively. Therefore, the corresponding new bands and red-shifts observed in vanadinite may be attributed to an intensified distortion of the V–O bonds and phase transition [54,55].
Upon further compression to 22.8 GPa, the 903 cm1 and the new 885, 876 cm1 double bands disappeared (Figure 6b). Meanwhile, the ν3-2 803 cm1 band continued shifting to lower wavenumbers 799 cm1 with distinct pressure dependence in comparison to low-pressure data (Figure 7). The different pressure dependence of Raman modes may be explained by that certain P–O bond length decreases and then increases upon compression, or vice versa in the case of the tetrahedral angle variance [27] even though the average P–O bond length of fluorapatite decreases with increasing pressure. This is also in agreement with the displacive phase transition as indicated in the HPHT XRD experiments. The ν2-1, ν2-2, and ν2-3 bands were observed to merged into one because of their differing pressure shifts (Figure 6), which was also observed in Ca5(PO4)3F stronadelphite [31]. The lower frequency ν2-4 band cannot be resolved at 22.8 GPa.
The Raman spectrum collected at 26.3 GPa is dominated by a visible broadening peak near 850 cm1, with other peaks almost disappeared (Figure 6b). This is likely due to the transition to an amorphous phase [55]. At 26.8 GPa, the vanadinite totally transfers to amorphous phase (Figure 6). The proposed condensation occurs continuously along a structural coordinate, in which adjacent distorted [VO4] tetrahedra may be forced together via edge-or corner-sharing, because it is not associated with any significant hysteresis during decompression (Figure 6 and Figure 7) [54]. The spectrum of the room pressure phase is recovered below approximately 18.8 GPa, which means the observed distortions are reversible.
The detailed wavenumbers of the Raman bands varying with pressure below 18.0 GPa are listed in Table 1 and displayed in Figure 7. It is apparent that the modes with the same origin exhibit similar dependences; for example, the bands arisen from the symmetric and antisymmetric stretching vibration of the V–O bond blue-shift at slopes of 2.57–3.81 cm−1·GPa−1, which is more than twice times the rate of the others (1.19–1.27 cm−1·GPa−1) for OVO bonding vibrations except the ν2-4. The largest pressure dependence value of ν2-4 may be due to the limited data and the difficulty to locate peak positions precisely above 8.9 GPa. The high frequency modes exhibit a steeper pressure dependence for wavenumber as pressure increases. Figure 6 and Figure 7 indicate that vanadinite may undergo phase transitions between 18.0 and 22.8 GPa.
Mode Grüneisen parameters (γ) are calculated using γi = (B0/νi)(dνi/dp)T, where νi is the wavenumber of the ith mode and B0 is the bulk modulus at room temperature. We used the isothermal bulk modulus Kv0 of 57(1) GPa [13] for the calculation. The mode Grüneisen parameters for each of the measured bands are given in Table 2. The γ value of the modes vary from 0.149 to 0.286, which yields an average VO4 internal mode Grüneisen parameters of 0.202. The biggest mode Grüneisen parameters of ν2-4 is not taken into account. This average mode Grüneisen parameter is smaller than 0.314 of [PO4] in alforsite [18], 0.332 in stronadelphite [17], 0.361 in tuite [11], 0.446 in fluorapatite [27], and 1.084 of [SiO4] in kyanite [56]. Compared with the tetrahedral modes in other phosphate or silicate minerals, [VO4] internal modes in vanadinite show lower average isothermal Grüneisen parameters, which is reasonable, as [VO4] tetrahedra in phosphates are more compressible than [PO4] in other phosphates and [SiO4] in silicates. Furthermore, the behavior of Pb–O(Cl) polyhedra is much less rigid than that of Sr–O or Ca–O polyhedral in phosphate, which results in the different local crystal field surrounding the VO4 tetrahedra in vanadinite.

4. Conclusions

We have performed in situ XRD and Raman experiments for vanadinite up to 44.6 GPa, 700 K and 26.8 GPa at room temperature, respectively. The HPHT XRD results demonstrate that vanadinite undergoes a phase transition at 23.1 GPa and 600 K, and the new phase may be stable up to 44.6 GPa and 400 K, which proposed vanadinite is one of the hosts for REEs and ions during the subduction of lithosphere to the transition zone.
HP Raman experiment suggests that vanadinite experiences phase transitions between 18.0 and 22.8 GPa, which are distinguished by the pressure dependences of the vibrational modes, the emergence of new modes, and opposite shift in Raman peaks. The results from compression at 18.0 GPa may be attributed to the increasing distortions of the VO4 tetrahedra. Upon compression to 20.5 GPa, the corresponding new bands and red-shifts may be attributed to a large distortion of the V–O bonds. At higher pressure, vanadinite was observed to transform to an amorphous phase. The spectrum of the room pressure phase is recovered below 18.8 GPa, which means the observed distortion are reversible. The mode Grüneisen parameters verified that the [VO4] tetrahedra in vanadinite is more compressible than those in other apatite-group minerals.

Author Contributions

Y.L. and B.C. conceived and designed the research; Y.L., X.L., F.Z., D.Z., Y.H., and B.C. performed the HPHT XRD experiments; Y.L. and B.C. carried out the HP Raman experiments; Y.L. and L.D. analyzed the data; Y.L., L.D., and B.C. wrote the manuscript; S.T. loaded the neon gas pressure medium. All authors have read and agreed to the published version of the manuscript.

Funding

This research was supported by the National Science Foundation (grant numbers EAR-1555388 and EAR-1829273) to B.C., the National Science Foundation of China (grant number 41202027) and the Fundamental Research Funds for the Central Universities (grant number 35832017033) to Y.L.

Data Availability Statement

Raman Data is available in a publicly accessible repository that does not issue DOIs. [https://pan.baidu.com/s/18IZlPrf5Sx4P8sqTpHCvcQ, accession number: 5rf7].

Acknowledgments

The X-ray diffraction experiments were performed at GeoSoilEnviroCARS (Sector 13-BM-C), Advanced Photon Source (APS), Argonne National Laboratory (ANL). We thank Jingjing Niu, Lin Li and Fei Qin for constructive discussion.

Conflicts of Interest

The authors declare no conflict of interest.

References

  1. Chen, X.; Wright, J.V.; Conca, J.L.; Peurrung, L.M. Evaluation of heavy metal remediation using mineral apatite. Water Air Soil Pollut. 1997, 98, 57–78. [Google Scholar] [CrossRef]
  2. Ma, Q.Y.; Traina, S.J.; Logan, T.J.; Ryan, J.A. In situ lead immobilization by apatite. Environ. Sci. Technol. 1993, 27, 1803–1810. [Google Scholar] [CrossRef]
  3. Shi, Q.T.; Zhang, S.J.; Ge, J.; Wei, J.S.; Christodoulatos, C.; Korfiatis, G.P.; Meng, X.G. Lead immobilization by phosphate in the presence of iron oxides: Adsorption versus precipitation. Water Res. 2020, 179, 115853. [Google Scholar] [CrossRef]
  4. Reisfeld, R.; Gaft, M.; Boulon, G.; Panczer, G.; Jorgensen, C.K. Laser-induced luminescence of rare-earth elements in natural fluor-apatites. J. Lumin. 1996, 69, 343–353. [Google Scholar] [CrossRef]
  5. Kang, J.; Yang, Y.; Pan, S.; Yu, H.; Zhou, Z. Synthesis, crystal structure and optical properties of Ba5V3O12F. J. Mol. Struct. 2014, 1056, 79–83. [Google Scholar] [CrossRef]
  6. Raicevic, S.; Wright, J.V.; Veljkovic, V.; Conca, J.L. Theoretical stability assessment of uranyl phosphate and apatites: Selection of amendments for in situ remediation of uranium. Sci. Total Environ. 2006, 355, 13–24. [Google Scholar] [CrossRef]
  7. Oelkers, E.H.; Montel, J.M. Phosphate and nuclear waste storage. Elements 2008, 4, 113–116. [Google Scholar] [CrossRef]
  8. Johnstone, E.V.; Bailey, D.J.; Lawson, S.; Stennett, M.C.; Corkhill, C.L.; Kim, M.; Heo, J.; Matsumura, D.; Hyatt, N.C. Synthesis and characterization of iodovanadinite using PdI2, an iodine source for the immobilisation of radioiodine. RSC Adv. 2020, 10, 25116–25124. [Google Scholar] [CrossRef]
  9. Stoppa, F.; Liu, Y. Chemical composition and petrogenetic implications of apatites from some ultra-alkaline Italians rocks. Eur. J. Miner. 1995, 7, 391–402. [Google Scholar] [CrossRef] [Green Version]
  10. Peng, G.; Luhr, J.F.; McGee, J.J. Factors controlling sulfur concentrations in volcanic apatite. Am. Mineral. 1997, 82, 1210–1224. [Google Scholar] [CrossRef]
  11. Zhai, S.; Liu, X.; Shieh, S.R.; Zhang, L.; Ito, E. Equation of state of γ-tricalcium phosphate, γ-Ca3(PO4)2, to lower mantle pressures. Am. Mineral. 2009, 94, 1388–1391. [Google Scholar] [CrossRef]
  12. Zhai, S.; Wu, X.; Xue, W. Pressure-dependent raman spectra of β-Ca3(PO4)2 whitlockite. Phys. Chem. Miner. 2015, 42, 303–308. [Google Scholar] [CrossRef]
  13. Gatta, G.D.; Lee, Y.; Kao, C.C. Elastic behavior of vanadinite, Pb10(VO4)6Cl2, a microporous non-zeolitic mineral. Phys. Chem. Miner. 2009, 36, 311–317. [Google Scholar] [CrossRef]
  14. Redfern, S.A.T.; Smith, S.E.; Maddrell, E.R. High-temperature breakdown of the synthetic iondine analogue of vanadinite, Pb5(VO4)3I: An apatite-related compound for iodine radioisotope immobilization? Miner. Mag. 2012, 76, 997–1003. [Google Scholar] [CrossRef] [Green Version]
  15. Fan, D.W.; Wei, S.Y.; Liu, J.; Li, Y.C.; Xie, H.S. X-ray diffraction study of calcium-lead fluorapatite solid solution at high pressure: The composition dependence of the bulk modulus and its pressure derivative. High Temp. High Press. 2013, 42, 69–80. [Google Scholar]
  16. Fan, D.W.; Ma, M.N.; Wei, S.Y.; Chen, Z.Q.; Xie, H.S. In-situ synchrotron powder X-ray diffraction study of vanadinite at room temperature and high pressure. High Temp. High Press. 2013, 42, 441–449. [Google Scholar]
  17. Zhai, S.; Shieh, S.R.; Xue, W.; Xie, T. Raman spectra of stronadelphite Sr5(PO4)3F at high pressures. Phys. Chem. Miner. 2015, 42, 579–585. [Google Scholar] [CrossRef]
  18. Zhai, S.; Li, Z.; Shieh, S.R.; Wang, C.; Xue, W. Pressure-dependent Raman spectra of Ba5(PO4)3Cl alforsite. Phys. Chem. Miner. 2018, 45, 353–359. [Google Scholar] [CrossRef]
  19. Kong, X.; Yuan, Z.; Yu, Y.; Gao, T.; Ma, S. Elastic, vibrational, and thermodynamic properties of Sr10(PO4)6F2 and Ca10(PO4)6F2 from first principles. Chin. Phys. B 2017, 26, 086301. [Google Scholar] [CrossRef]
  20. White, J.S. Vanadinite from Toussit, Morocco, and comments on endlichite. Miner. Rec. 1984, 15, 347–350. [Google Scholar]
  21. Laufek, F.; Skala, R.; Haloda, J.; Cisarova, I. Crystal structure of vanadinte: Refinement of anisotropic displacement parameters. J. Czech Geol. Soc. 2006, 51, 271–275. [Google Scholar]
  22. Beevers, C.A.; McIntyre, D.B. The atomic structure of fluor-apatite and its relation to that of tooth and bond materials. Mineral. Mag. J. Mineral. Soc. 1946, 27, 254–257. [Google Scholar] [CrossRef]
  23. Dai, Y.; Huges, J.M. Crystal-structure refinements of vanadinite and pyromorphite. Can. Miner. 1989, 27, 189–192. [Google Scholar]
  24. Okudera, H. Relationships among channel typology and atomic displacements in the structures of Pb5(BO4)3Cl with B = P (pyromorphite), V (vanadinite), and as (mimetite). Am. Mineral. 2013, 98, 1573–1579. [Google Scholar] [CrossRef]
  25. Comodi, P.; Liu, Y.; Zanazzi, P.F.; Montagnoli, M. Structural and vibrational behaviour of fluorapatite with pressure. Part I: In situ single-crystal X-ray diffraction investigation. Phys. Chem. Miner. 2001, 28, 219–224. [Google Scholar] [CrossRef]
  26. Comodi, P.; Liu, Y.; Frezzotti, M.L. Structural and vibrational behaviour of fluorapatite with pressure. Part II: In situ micro-raman spectroscopic investigation. Phys. Chem. Miner. 2001, 28, 225–231. [Google Scholar] [CrossRef]
  27. Wei, S.; Ma, M.; Fan, D.; Yang, J.; Zhou, W.; Li, B.; Chen, Z.; Xie, H. Compressibility of mimetite and pyromorphite at high pressure. High Press. Res. 2013, 33, 27–34. [Google Scholar] [CrossRef]
  28. Chen, X.; Xu, X.; Qin, F.; Liu, Y.X. In-situ high-pressure single crystal X-ray diffraction of natural pyromorphite and mimetite. Nucl. Tech. 2019, 49, 020101. [Google Scholar]
  29. Chernorukov, N.G.; Knyazev, A.V.; Bulanov, E.N. Phase transitions and thermal expansion of apatite-structured compounds. Inorg. Mater. 2011, 47, 172–177. [Google Scholar] [CrossRef]
  30. Xue, W.; Zhai, K.; Lin, C.C.; Zhai, S. Raman spectroscopic study of stronadelphite Sr5(PO4)3F at various temperatures. Vib. Spectrosc. 2018, 98, 123–127. [Google Scholar] [CrossRef]
  31. Williams, Q.; Knittle, E. Infrared and Raman spectra of Ca5(PO4)3F2-fluorapatite at high pressures: Compression-induced changes in phosphate site and Davydov splittings. J. Phys. Chem. Solids 1996, 57, 417–422. [Google Scholar] [CrossRef]
  32. Zhang, D.; Dera, P.K.; Eng, P.J.; Stubbs, J.E.; Zhang, J.S.; Prakapenka, V.B.; Rivers, M.L. High pressure single crystal diffraction at PX^2. J. Vis. Exp. 2017, 119, e54660. [Google Scholar] [CrossRef] [Green Version]
  33. Lai, X.J.; Zhu, F.; Zhang, J.S.; Zhang, D.Z.; Tkachev, S.; Prakapenka Vitali, B.; Chen, B. An externally-heated diamond anvil cell for synthesis and single-crystal elasticity determination of Ice-VII at high pressure-temperature conditions. J. Vis. Exp. 2020, 160, e61389. [Google Scholar] [CrossRef]
  34. Rivers, M.; Prakapenka, V.B.; Kubo, A.; Pullins, C.; Holl, C.M.; Jacobsen, S.D. The COMPRES/GSECARS gas-loading system for diamond anvil cells at the Advanced Photon Source. High Press. Res. 2008, 28, 273–292. [Google Scholar] [CrossRef]
  35. Dewaele, A.; Datchi, F.; Loubeyre, P.; Mezouar, M. High pressure—High temperature equations of state of neon and diamond. Phys. Rev. B 2008, 77, 094106. [Google Scholar] [CrossRef]
  36. Fei, Y.; Ricolleau, A.; Frank, M.; Mibe, K.; Shen, G.; Prakapenka, V. Toward an internally consistent pressure scale. Proc. Natl. Acad. Sci. USA 2007, 104, 9182–9186. [Google Scholar] [CrossRef] [PubMed] [Green Version]
  37. Prescher, C.; Prakapenka Vitali, B. DIOPTAS: A program for reduction of two-dimensional X-ray diffraction data and data exploration. High Press. Res. 2015, 35, 223–230. [Google Scholar] [CrossRef]
  38. Mao, H.K.; Bell, P.M. High-pressure physics: The 1-Megabar mark on the ruby R1 static pressure scale. Science 1976, 191, 851–852. [Google Scholar] [CrossRef] [Green Version]
  39. Frost, R.L.; Crane, M.; Williams, P.A.; Kloprogge, J.T. Isomorphic substitution in vanadinite [Pb5(VO4)3Cl]-a Raman spectroscopic study. J.Raman. Spectrosc. 2003, 34, 214–220. [Google Scholar] [CrossRef] [Green Version]
  40. He, Q.; Liu, X.; Hu, X.; Li, S.; Wang, H. Solid solution between lead fluorapatite and lead fluorvanadate apatite: Mixing behavior, RAMAN feature and thermal expansivity. Phys. Chem. Miner. 2011, 38, 741–752. [Google Scholar] [CrossRef]
  41. Dove, M.T. Theory of displacive phase transitions in minerals. Am. Mineral. 1997, 82, 213–244. [Google Scholar] [CrossRef]
  42. Seto, Y.; Hamane, D.; Nagai, T.; Sata, N. Development of a software suite on X-ray diffraction experiments. Rev. High Press. Sci. Technol. 2010, 20, 269–276. (In Japanese) [Google Scholar] [CrossRef] [Green Version]
  43. Downs, R.T.; Hall-Wallace, M. The American mineralogist crystal structure database. Am. Mineral. 2003, 88, 247–250. [Google Scholar]
  44. Zhai, S.M.; Xue, W.H.; Yamazaki, D.; Ma, F. Trace element composition in tuite decomposed from natural apatite in high-pressure and high-temperature experiments. Sci. China Earth Sci. 2014, 57, 2922–2927. [Google Scholar] [CrossRef]
  45. Jayaraman, A.; Wang, S.Y.; Sharma, S.K.; Cheong, S.W. A spectacular pressure-induced electronic transition in KTb(MoO4)2. Curr. Sci. 1996, 70, 232–234. [Google Scholar]
  46. Müller, J.; Speziale, S.; Efthimiopoulos, I.; Jahn, S.; Koch-Müller, M. Raman spectroscopy of siderite at high pressure: Evidence for a sharp spin transition. Am. Mineral. 2016, 101, 2638–2644. [Google Scholar] [CrossRef]
  47. Liu, Y.; Huang, S.; Li, X.; Song, H.; Xu, J.; Zhang, D.; Wu, X. Pressure-induced phase transition in Mn(Ta,Nb)2O6: An experimental investigation and first-principle study. Inorg. Chem. 2020, 59, 18122–18130. [Google Scholar] [CrossRef]
  48. Bartholomai, G.; Klee, W.E. The vibrational spectra of pyromorphite, vanadinite and mimetite. Spectrochim. Acta A Mol. Biomol. Spectrosc. 1978, 34, 831–843. [Google Scholar] [CrossRef]
  49. Łodziński, M.; Sitarz, M. Chemical and spectroscopic characterization of some phosphate accessory minerals from pegmatites of the Sowie Góry Mts, SW Poland. J. Mol. Struct. 2009, 924, 442–447. [Google Scholar] [CrossRef]
  50. Solecka, U.; Bajda, T.; Topolska, J.; Zelek-Pogudz, S.; Manecki, M. Raman and Fourier transform infrared spectroscopic study of pyromorphirte-vanadinite solid solutions. Spectro. Acta A 2018, 190, 96–103. [Google Scholar] [CrossRef]
  51. Toumi, M.; Smiri-Dogguy, L.; Bulou, A. Crystal structure and polarized Raman spectra of Ca6Sm2Na2(PO4)6F2. J. Solid State Chem. 2000, 149, 308–313. [Google Scholar] [CrossRef]
  52. Bajda, T.; Mozgawab, W.; Maneckia, M.; Flis, J. Vibrational spectroscopic study of mimetite—Pyromorphite solid solutions. Polyhedron 2011, 30, 2479–2485. [Google Scholar] [CrossRef]
  53. Giera, A.; Manecki, M.; Bajda, T.; Rakovan, J.; Kwaśniak-Kominek, M.; Marchlewski, T. Arsenate substitution in lead hydroxyl apatites: A raman spectroscopic study. Spectrochim. Acta A 2016, 152, 370–377. [Google Scholar] [CrossRef] [PubMed] [Green Version]
  54. Grzechnik, A.; McMillan, P.F. High pressure behavior of Sr3(VO4)2 and Ba3(VO4)2. J. Solid State Chem. 1997, 132, 156–162. [Google Scholar] [CrossRef]
  55. Kosyl, K.M.; Paszkowicz, W.; Ermakova, O.; Wlodarczyk, D.; Suchocki, A.; Minikayev, R.; Domagala, J.Z.; Shekhovtsov, A.N.; Kosmyna, M.; Popescu, C.; et al. Equation of state and amorphization of Ca9R(VO4)7 (R = La, Nd, Gd): A combined high-pressure X-ray diffraction and Raman spectroscopy study. Inorg. Chem. 2018, 57, 13115–13127. [Google Scholar] [CrossRef]
  56. Gao, J.; Wu, W.; Jia, L.; Wang, C.P.; Liu, Y.; Xu, C.; Chen, F.; Fei, C.; Su, W. Raman and infrared spectra to monitor the phase transition of natural kyanite under static compression. J. Raman Spectrosc. 2020, 51, 2102–2111. [Google Scholar] [CrossRef]
Figure 1. Pressure-temperature path of the HPHT XRD experiments. The square signals represent the corresponding pressure and temperature where the HPHT data sets were obtained. The black line is just a guild for eyes.
Minerals 11 01217 g001
Figure 2. Representative two-dimensional XRD patterns of vanadinite collected at high pressures and temperatures. (a) XRD pattern at 7.1 GPa and 400 K. (b) XRD pattern at 12.1 GPa and 500 K. (c) XRD pattern at 23.1 GPa and 600 K. (d) More complex XRD pattern at 25.8 GPa and 500 K. (e) Complex XRD pattern at 24.9 GPa and 300 K. (f) XRD pattern at 44.6 GPa and 400 K. Large white spots in the white squares are due to diamond reflections. The diffraction rings are due to gasket (Re) reflections. The inset illustrates the splittings of Bragg’s peaks.
Minerals 11 01217 g002
Figure 3. Selected XRD patterns and color change of vanadinite. (a) Representative integrated XRD patterns at different pressures and temperatures. The black short lines are peaks of vanadinite. The Red short lines are indexed peaks of pressure calibration Au. The blue short lines are due to gasket (Re) reflections. The red arrows indicate the new peaks who appear at different conditions. The wavelength of the X-ray is 0.43409 Å. (b) Color changes of vanadinite, which was transparent at 7.1 GPa before the XRD experiment (left image), reddish during the decompression after experiment (center image), and then back to transparent at ambient conditions after decompression (right image).
Minerals 11 01217 g003
Figure 4. Compression curve of vanadinite with data from reference [13] and this experiment. The red lines are guides for eyes to show the discontinuous volume reduction around 23 GPa.
Minerals 11 01217 g004
Figure 5. Representative Raman spectrum of vanadinite at ambient conditions.
Minerals 11 01217 g005
Figure 6. Representative Raman spectra of vanadinite at different high pressures. (a) Raman shifts between 250 and 500 cm−1. (b) Raman shifts between 700 and 900 cm−1. The highest pressure is 26.8 GPa and the data between d26.3 GPa and d2.8 GPa were collected during decompression. Dash lines with arrows serve as guide for eyes showing the direction of variation in these maxima. The red and black arrows point to the new bands and the high ν4 bands of vanadinite at 300 K in a diamond anvil cell, respectively.
Minerals 11 01217 g006
Figure 7. Evolution of Raman modes with pressure in vanadinite. The peaks upon compression and decompression are represented by solid-filled symbols and open ones, respectively. The dashed lines indicate the phase transition zone. The dot lines are guides for eyes.
Minerals 11 01217 g007
Table 1. Raman mode νi wavenumbers (cm−1) of vanadinite at various pressures.
P/GPa ν1 ν3-1ν3-2ν3-3 ν4ν2-1ν2-2ν2-3ν2-4
Compression10−4 848.0 802.0791.0760.0 420.0367.0357.0336.1295.2
7.3 850.9 807.7793.5766.6 422.1368.9358.9338.2296.0
8.9 857.0 813.3800.5775.0 424.4370.3362.7341.1300.4
13.3 870.0 823.1815.1794.3 430.1375.5368.6347.1*
14.0 871.3 826.1814.5793.6 430.9377.5369.3347.8*
18.0898.3 881.1 835.8827.0807.4 435.7383.3374.6350.7330.7
20.5903.1885.2876.0860.4843.4827.6810.2803.4765.8478.5452.8386.4380.9360.6331.7
22.8 865.8847.6832.1806.2799.0792.9487.9466.8 391.2
26.3 Almost amorphous phase
Decompression26.3 849.7 796.4 502.8457.9 337.1294.4
25.0 869.1854.8844.0809.4802.2789.2492.9464.8 337.8292.6
21.4899.2 864.5847.0833.1804.1797.6797.4481.9460.8389.2364.9336.7300.5
18.8 860.5843.9829.5802.9795.3777.6477.3453.8384.2361.5332.8298.5
11.4 865.3 821.9809.5786.6 430.2372.4365.0346.7305.6
5.4 839.9 798.0785.1750.8 418.4366.0355.8332.8292.5
2.8 833.9 794.0784.6740.2 416.5365.3355.1330.1292.1
Note: * means the mode did not be gathered because out of ranges. The decompression Raman data were displayed with grey background.
Table 2. Pressure dependences and mode Grüneisen parameters of the measured Raman modes below 18.0 GPa in vanadinite.
νi a(dvi/dp)T bɤi cAssignment
8482.82(13)0.189ν1 symmetric stretching vibration
8022.57(9)0.183ν3 antisymmetric stretching vibration
7913.07(18)0.221
7603.81(27)0.286
4201.27(2)0.172ν4 OVO bending vibration
3671.35(8)0.149ν2 OVO s bending vibration
3571.42(8)0.210
3361.19(12)0.202
2953.27(7)0.631
Note: a initial wavenumbers (cm−1) of a vibrational mode at atmospheric pressure; b pressure dependence of a mode at room temperature in cm−1·GPa−1; c Grüneisen parameters calculated using ɤi = (B0/νi)(dvi/dp)T.
Publisher’s Note: MDPI stays neutral with regard to jurisdictional claims in published maps and institutional affiliations.

