Article

Geochemistry and Holocene Sedimentary Environment Evolution of Subaqueous Clinoform off Shandong Peninsula (Yellow Sea)

1
National Engineering Laboratory for Port Hydraulic Construction Technology, Tianjin Research Institute for Water Transport Engineering, Ministry of Transport, Tianjin 300456, China
2
College of Marine Geoscience, Ocean University of China, Qingdao 266100, China
3
Xiamen CWS Survey and Design Co., Ltd., Xiamen 361021, China
4
Key Lab of Submarine Geosciences and Prospecting Techniques, Ministry of Education, Ocean University of China, Qingdao 266100, China
*
Authors to whom correspondence should be addressed.
Minerals 2021, 11(11), 1209; https://doi.org/10.3390/min11111209
Submission received: 6 September 2021 / Revised: 22 October 2021 / Accepted: 27 October 2021 / Published: 29 October 2021

Abstract

:
As a key sedimentary body connecting the north and South Yellow Sea, the subaqueous clinoform off Shandong Peninsula plays an important role in the sedimentary system of China seas, and it is also a studied example in the study among the major “source to sink” systems. Based on AMS 14C dating, sediment grain size, major and trace element contents from core WH-05 located at the edge of the clinoform, we discuss changes in the deposition rate, analyze sediment provenance and controlling factors, and reveal the environmental evolution of the source area since the Holocene. Results from core WH-05 show that marine sedimentation began at about 8.5 ka B.P. The deposition rate decreased from the initial 28.37 m/ka to 0.52 m/ka. Sediment provenance suggests that the Huanghe river sediments have been the main source for the study area since the Holocene. The As/Al, V/Sc indicators show that the environmental oxidation environment was gradually weakened and then increased slightly starting from 7.0 ka B.P. The change in redox is consistent with the change in sea level, the deposition rate, and depositional depth.

1. Introduction

Owing to a large number of preserved sedimentary records from the continent to the ocean contained in the marine sediments, the Quaternary paleoceanography of marginal seas [1] once became a research hotspot. The Yellow Sea, where a large number of terrigenous materials of the Eurasian plate were deposited, became a research hotspot in the recent decades [2,3,4,5,6,7,8]. In the early Holocene, the global sea level was about 58 m lower [9], and the whole Bohai Sea, located to the west of the study area (Figure 1), was exposed to the land surface [10]. Between 11.6 and 11.3 ka B.P., the sea level rose from −58 m to −43 m at the speed of 40 mm/a [8,11], and the sea water began to enter the Bohai Sea (Figure 2). Later, the sea level rose slowly and reached −30 m at about 9.6 ka B.P. From 9.5 to 7.0 ka B.P., a large number of progradational deltas began to develop in the Yellow and Bohai seas [12], which indicates that the sea level rising rate slowed down until the sea level reached the maximum at about 7.0 ka B.P. After that, the sea level decreased to its current position [13]. As a result, the ancient coastline as well as the location of major rivers’ estuaries changed much [10].
The subaqueous clinoform, located in the junction of the North and South Yellow Sea, is not only the source of offshore materials but also the sink of terrigenous materials. The studied clinoform was first identified by Milliman et al. [14]. Later, Liu et al. [15] believed that the mud wedge of the Shandong Peninsula was formed in the continental shelf environment since 11.6 ka B.P., and its sediments are not directly input by the Huanghe River, but carried by the coastal current of the Yellow Sea. On this basis, Yang and Liu [16] proposed that the subaqueous clinoform off the Shandong Peninsula mainly represents the distal underwater delta of the Huanghe River formed in the high sea level period since 7 ka B.P. This viewpoint was later supported by other researchers [17,18]. Therefore, the subaqueous clinoform off the Shandong Peninsula completely records the paleoenvironmental changes since its formation, which is of great significance in the study of sedimentary records and paleoenvironmental evolution in the Yellow and Bohai Seas.
However, there are still some disputes on the sediment provenance of the clinoform off the Shandong Peninsula. Most researchers [19,20,21] believed that the sediments of the clinoform off the Shandong Peninsula mainly came from the Huanghe River. However, these studies were based on the geochemical characteristics or clay mineral characteristics of surface sediments, which could not explain the source of ancient sediments. At the same time, Liu et al. (2009) [15] considered that although the Huanghe River sediment was the main source of the clinoform, the Changjiang River sediments also had a great impact on the sediments of the clinoform after the formation of the Yellow Sea Warm Current. Therefore, the evolution of sediment provenance of the clinoform needs further research to confirm the relevant viewpoints.
In order to explore the sediment provenance and sedimentary environment evolution of the subaqueous clinoform off the Shandong Peninsula, core sampling was carried out in the northeast sea area of Shandong Peninsula (Figure 1). Based on the characteristics of sediment grain size, major and trace element contents, we reveal the changes in the sedimentation rate, sediment provenance, and sedimentary environment evolution since the Holocene. Our work can supplement the relevant achievements [15,19,20,21] about the formation and evolution of the subaqueous clinoform off the Shandong Peninsula.

2. Materials and Methods

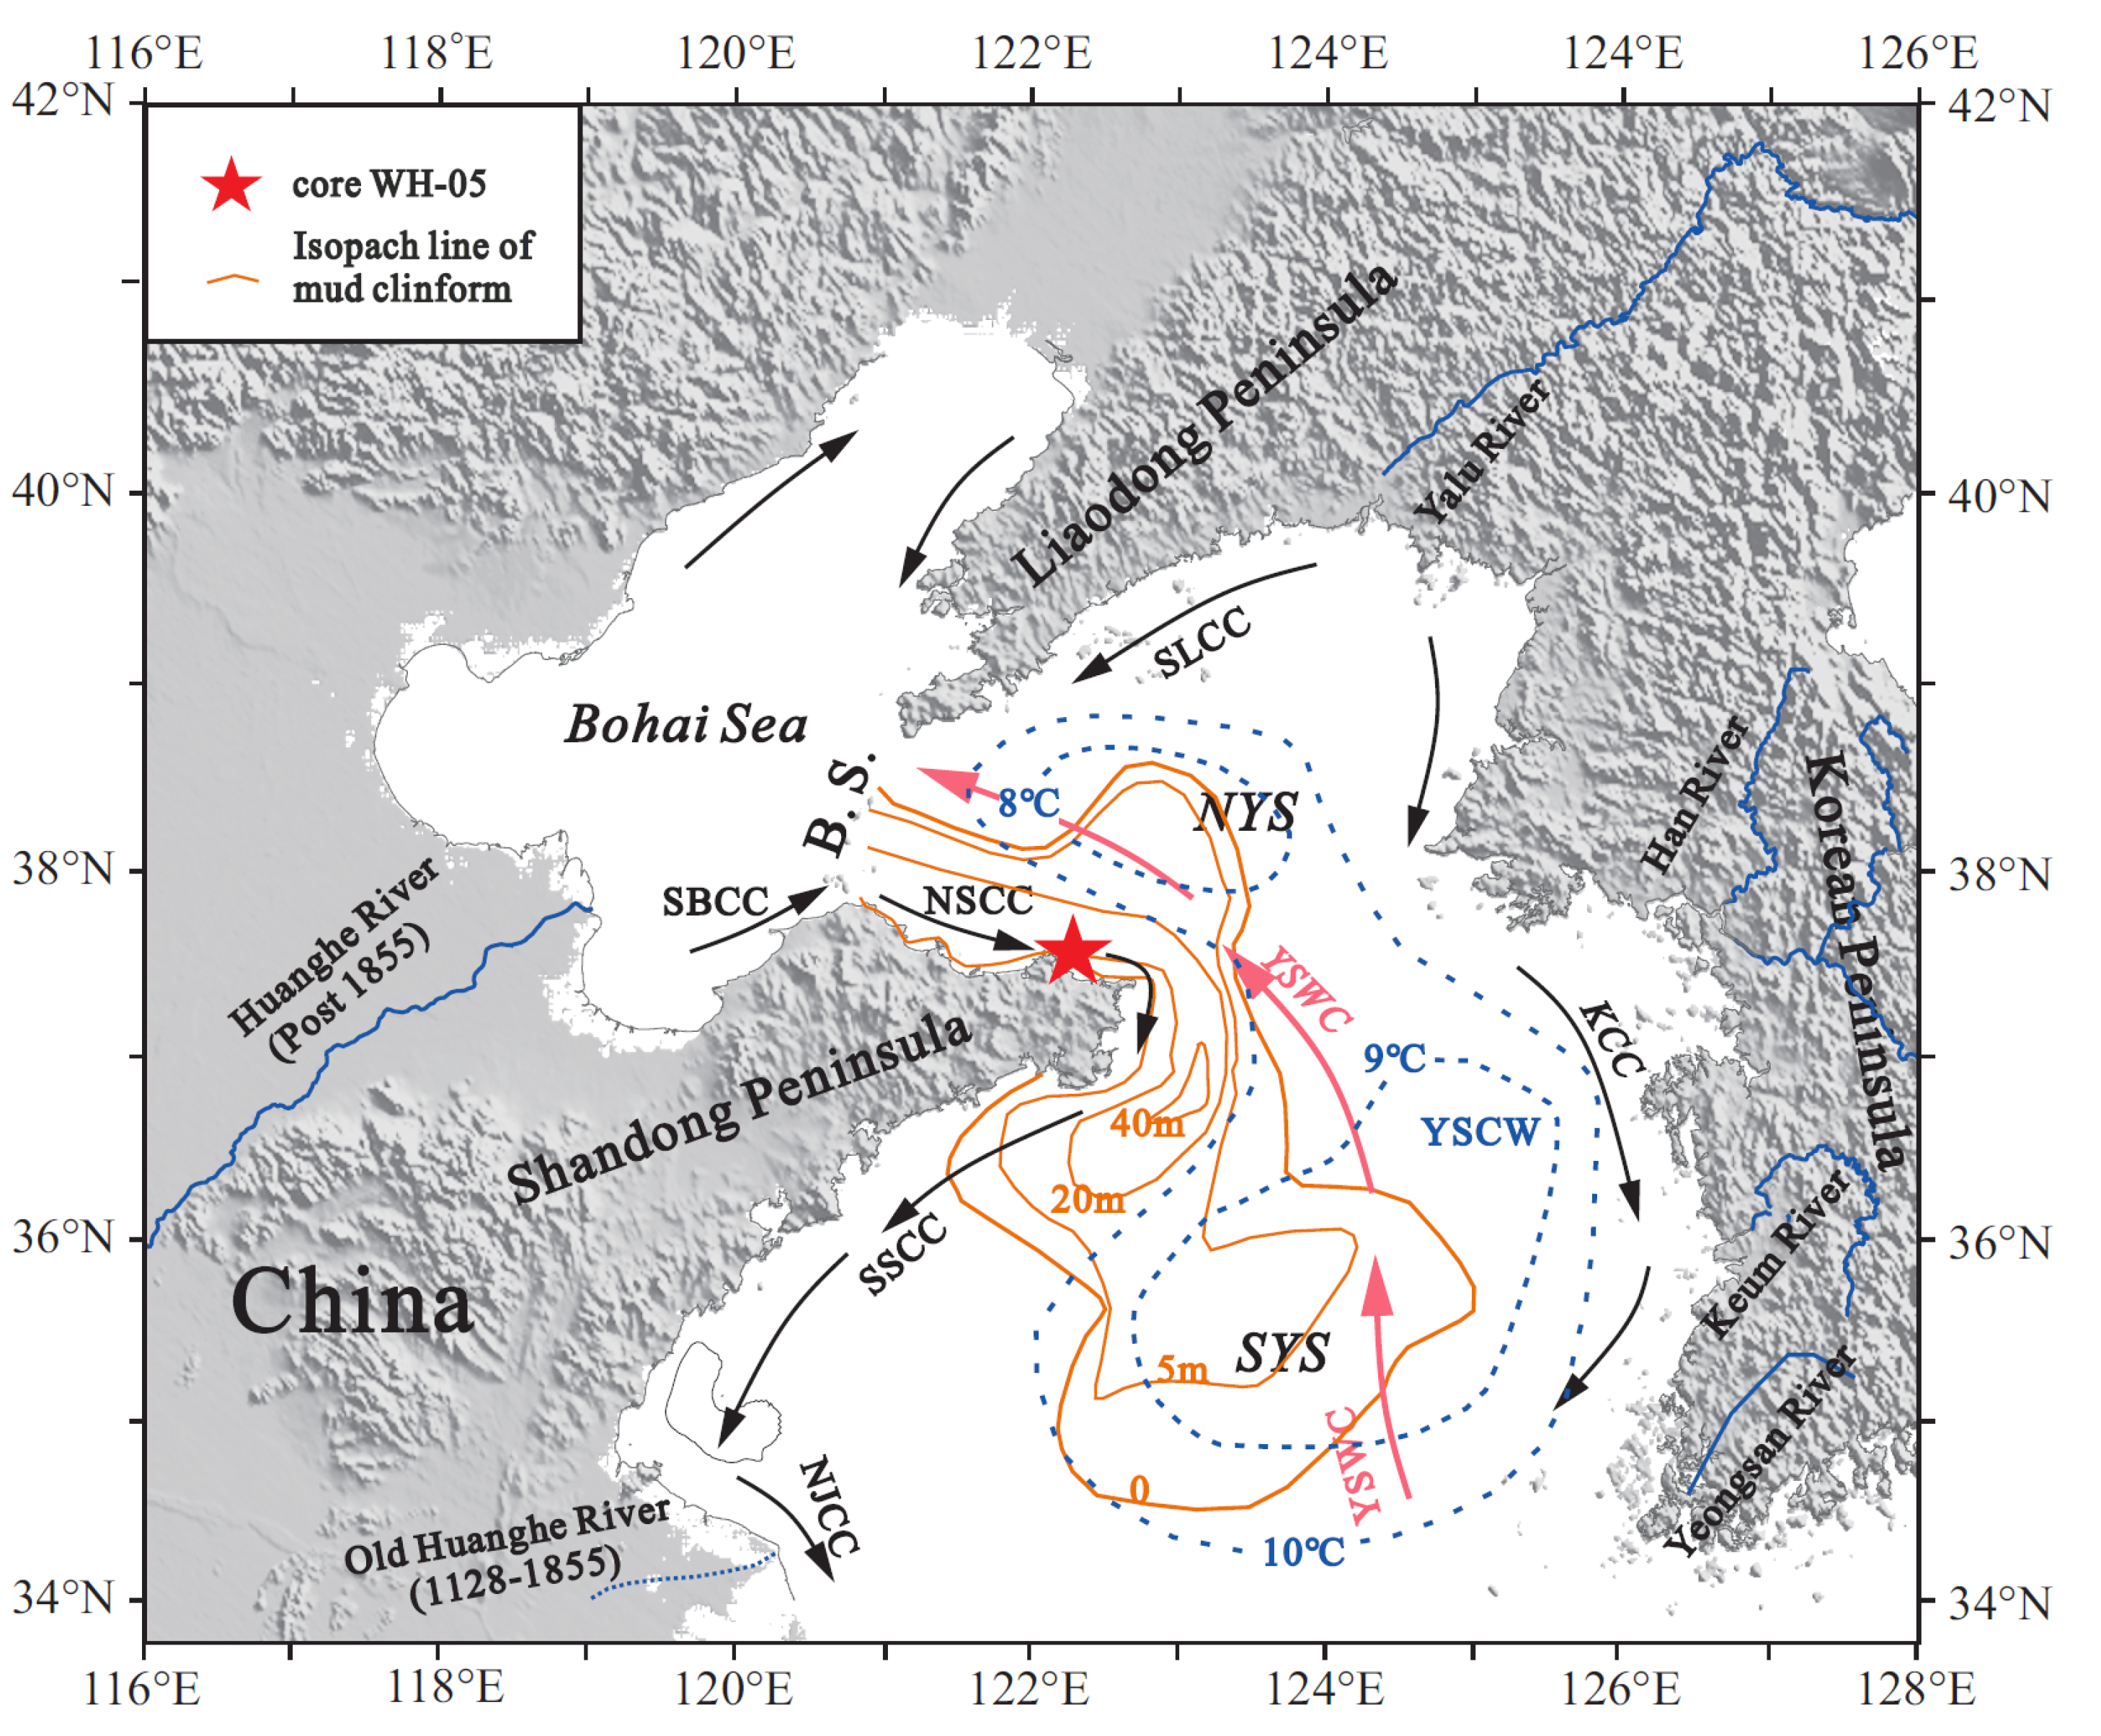
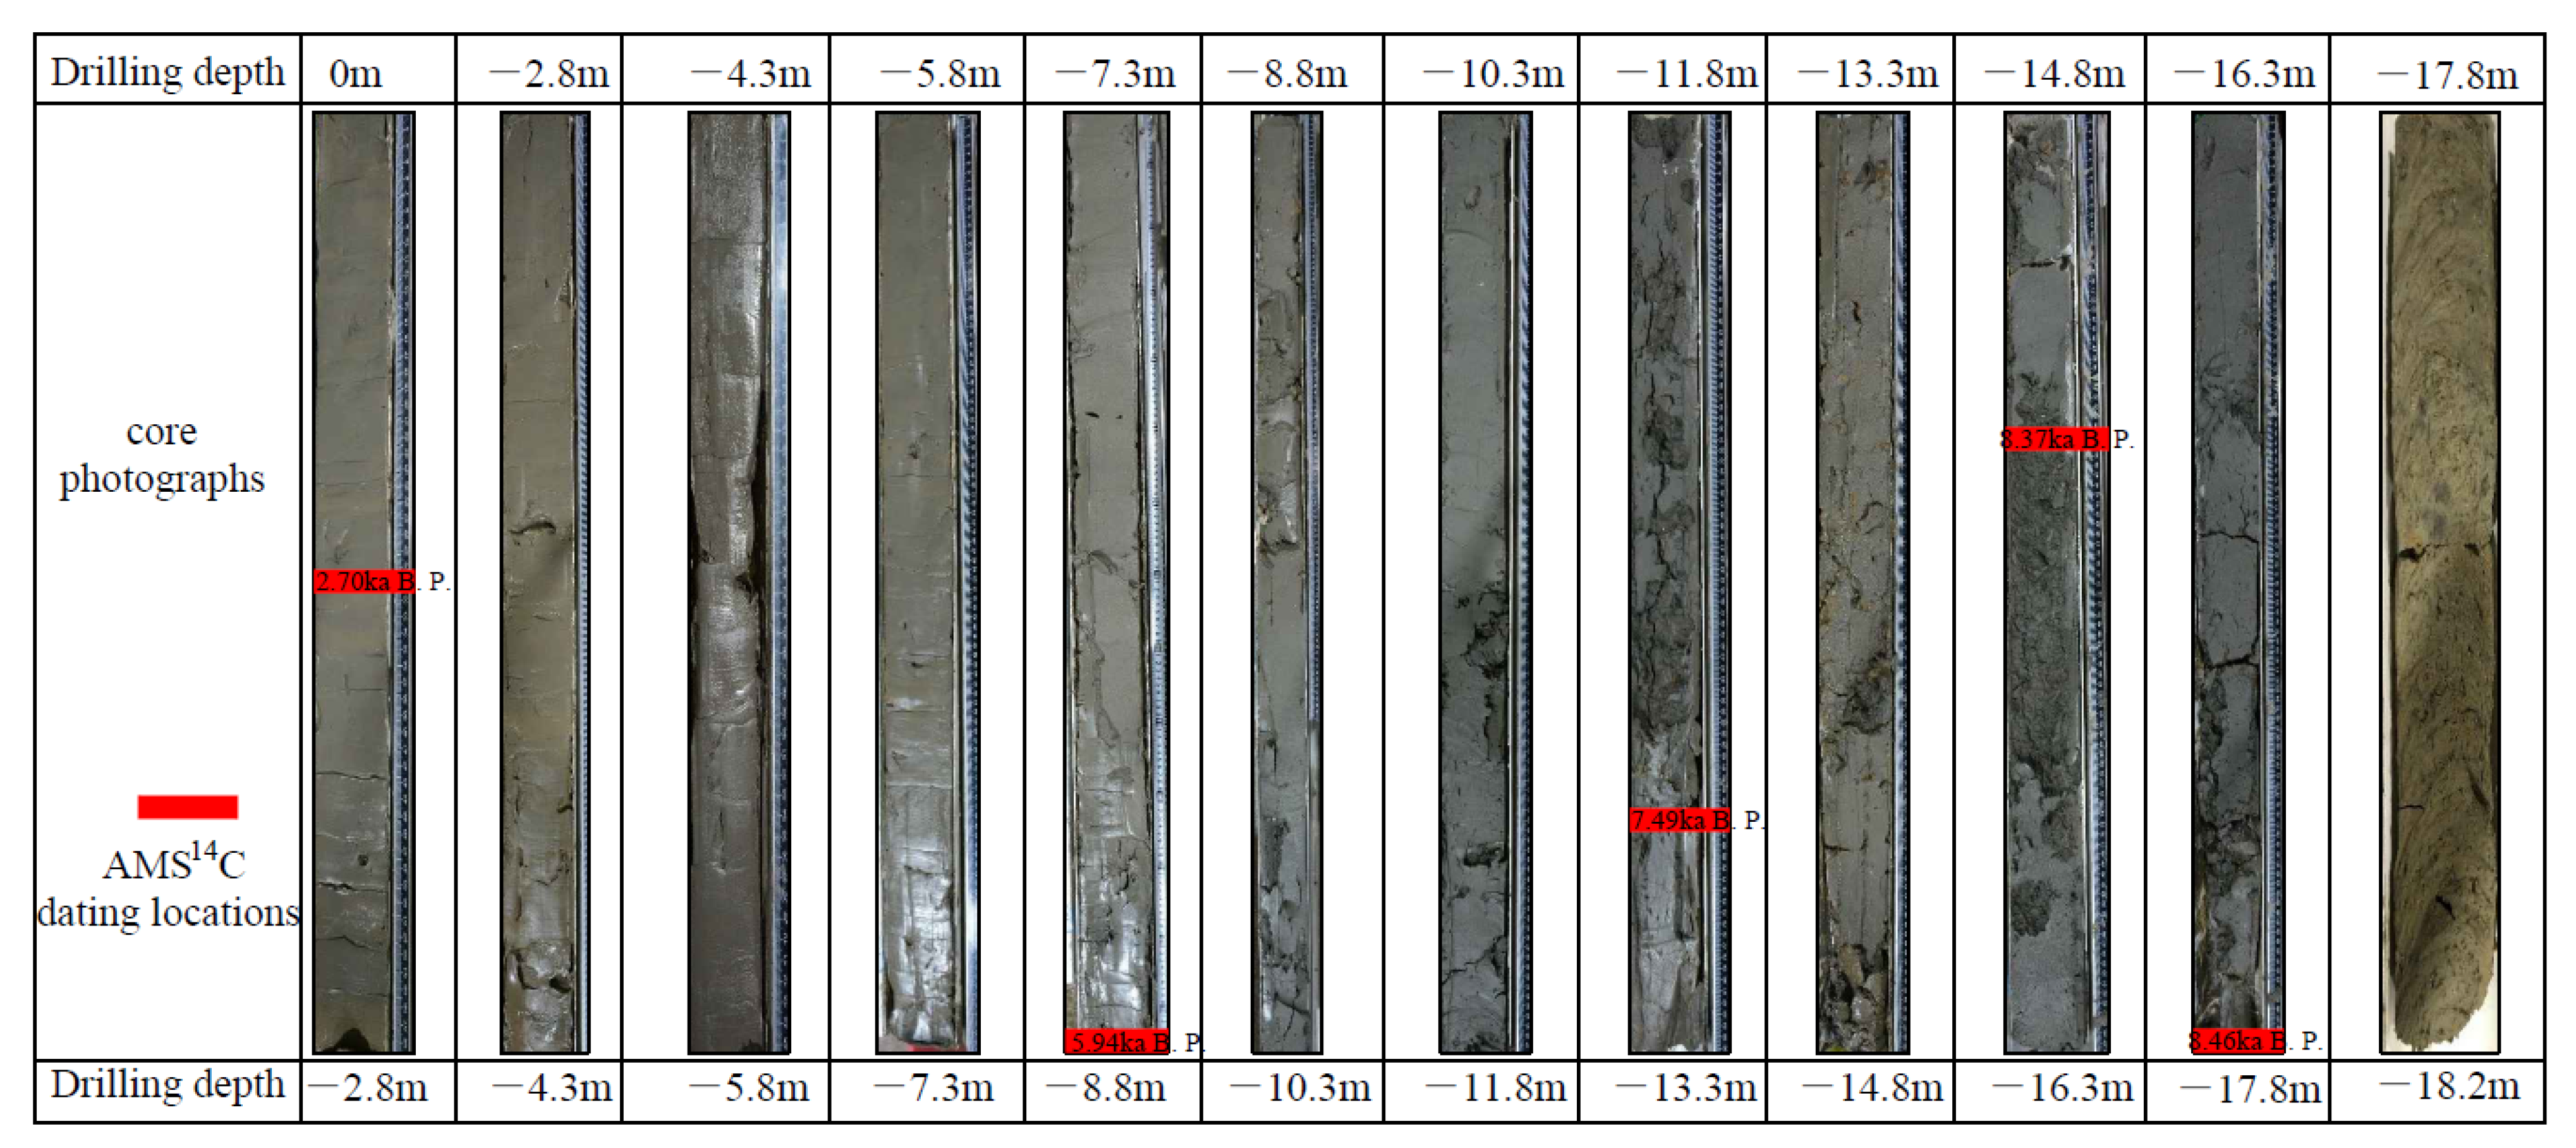
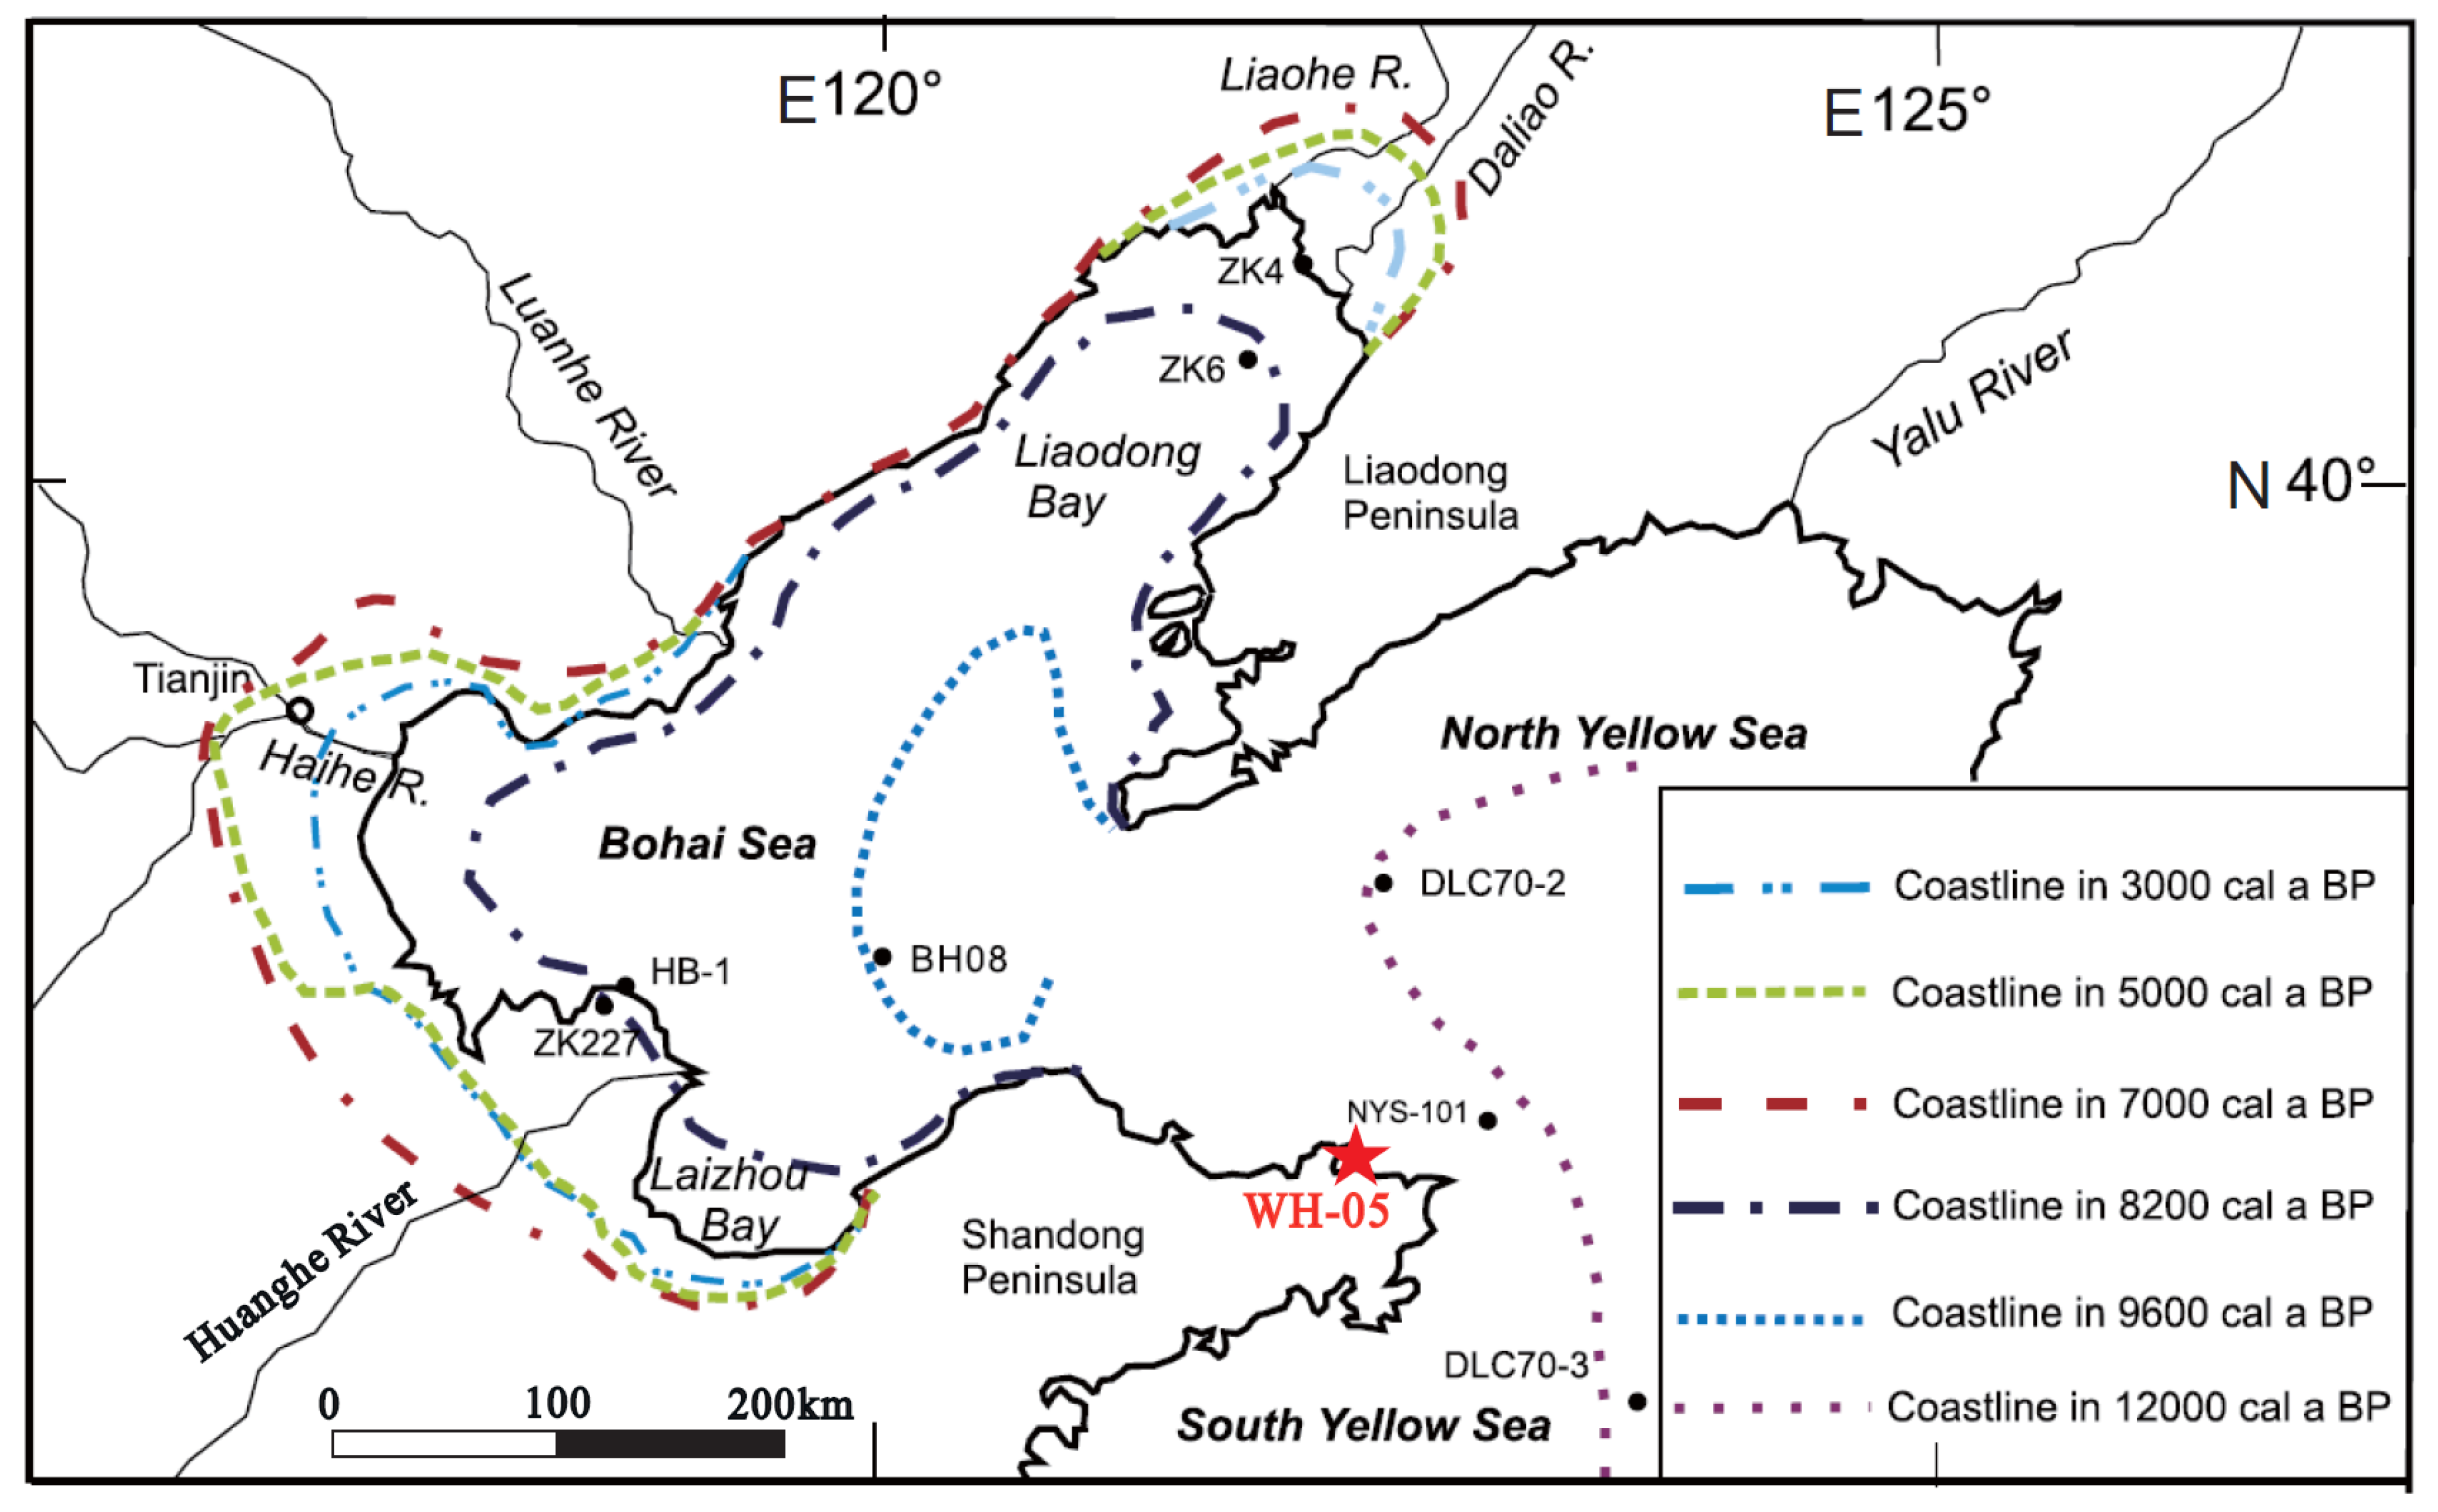
2.1. Sample Collection and Segmentation

The core WH-05 (location: Weihai Bay, Water depth: 12 m, coordinate: 37°28′23″ N, 122°10′37″ E, sample length: 10.8 m, drilling depth: 18.2 m) was obtained by a gravity sampler (VC-D, SDI, Dallas, TX, USA) in the northeast sea area of the Shandong Peninsula on 9 December 2019. A total of 540 samples were collected every 2 cm along the core and placed in clean sample bags, respectively. A total of 89 out of 540 samples were chosen at 10~15 cm intervals for experimental tests. Related works were completed at the Key Laboratory of Submarine Geosciences and Prospecting Technology, Ocean University of China from 26 to 28 December 2019.

2.2. Description of the Sedimentary Facies

The core photos are presented in Figure 3. From 0 to −2.8 m, the sediments are dark gray, with a high organic matter content, liquid soft state, and obvious mud smell. From −2.8 to −17.8 m, the sediments are dark gray with a uniform color, high organic matter content, soft plastic state, and no interlayer. In addition, there are different contents of shell debris in the sediments. From −17.8 to −18.2 m, the sediments are yellowish brown with a uniform color, obvious stratification, and high content of sand. The 90 core photos are present in Figure 3.

2.3. Grain Size Analyses

Grain size measurements were based on a laser diffraction particle size analyzer (LS 13 320) over a range of 0.017–2000 μm and a resolution of 0.1Φ. Firstly, about 0.5 g sediments of each sample were put in beakers. Then, 5 mL of 30% H2O2 and 3 mL of 10% HCl were added to remove the organic matter and carbonate fractions, respectively. The mixture was subsequently rinsed several times with deionized water and then extracted via centrifugation. After ultrasonic oscillation, the samples were measured. The relative error of repeated measurements was <1%. The moment method [22] was used to calculate grain size parameters. The sample preparation and measurements were completed at the Key Laboratory of Submarine Geosciences and Prospecting Technology, Ocean University of China.

2.4. Major and Trace Element Analyses

The concentrations of major elements (Al, Ca, Fe, K, Mg, Mn, Na, P, Ti) were measured by inductively coupled plasma optical emission spectrometry (ICP-OES). The concentrations of trace elements (Ba, Li, V, Cr, Co, Ni, Cu, Zn, Sr, Nb, Pb, Sc, Rb, Th) were measured by inductively coupled plasma mass spectrometry (ICP-MS). The samples were freeze-dried and ground to 200 mesh. Each sample (~0.05 g) was accurately weighed out, dissolved twice by HF-HNO3 (1:1, v:v), and then redried at 190 °C for 48 h. A total of 3 mL of 50% HNO3 were added to each sample, and the samples dissolved at 150 °C for another 8 h before constant volume. In order to monitor the test accuracy, a repeated analysis of several samples and a standard sample (GSD-9) analysis were carried out, respectively. The relative error of the element analysis was less than 2%. These analyses were undertaken at the Qingdao Institute of Marine Geology, China Geological Survey.

2.5. AMS14C Analyses

A proper amount of wet samples were placed in the clean beaker, dried at 50 °C, and then soaked. The samples, completely dispersed, were transferred into a stainless steel sieve (63 μm) for washing. The washed samples were transferred to beakers and dried at 50 °C. Under the microscope, we collected about 8 mg of clean benthic foraminifera with a uniform size into a small centrifugal tube for testing. We chose 5 samples for AMS14C dating, and the results are presented in Table 1. In addition, then the age framework of core WH-05 was established by linear interpolation. The analyses were completed at Beta Lab in the USA.

3. Results

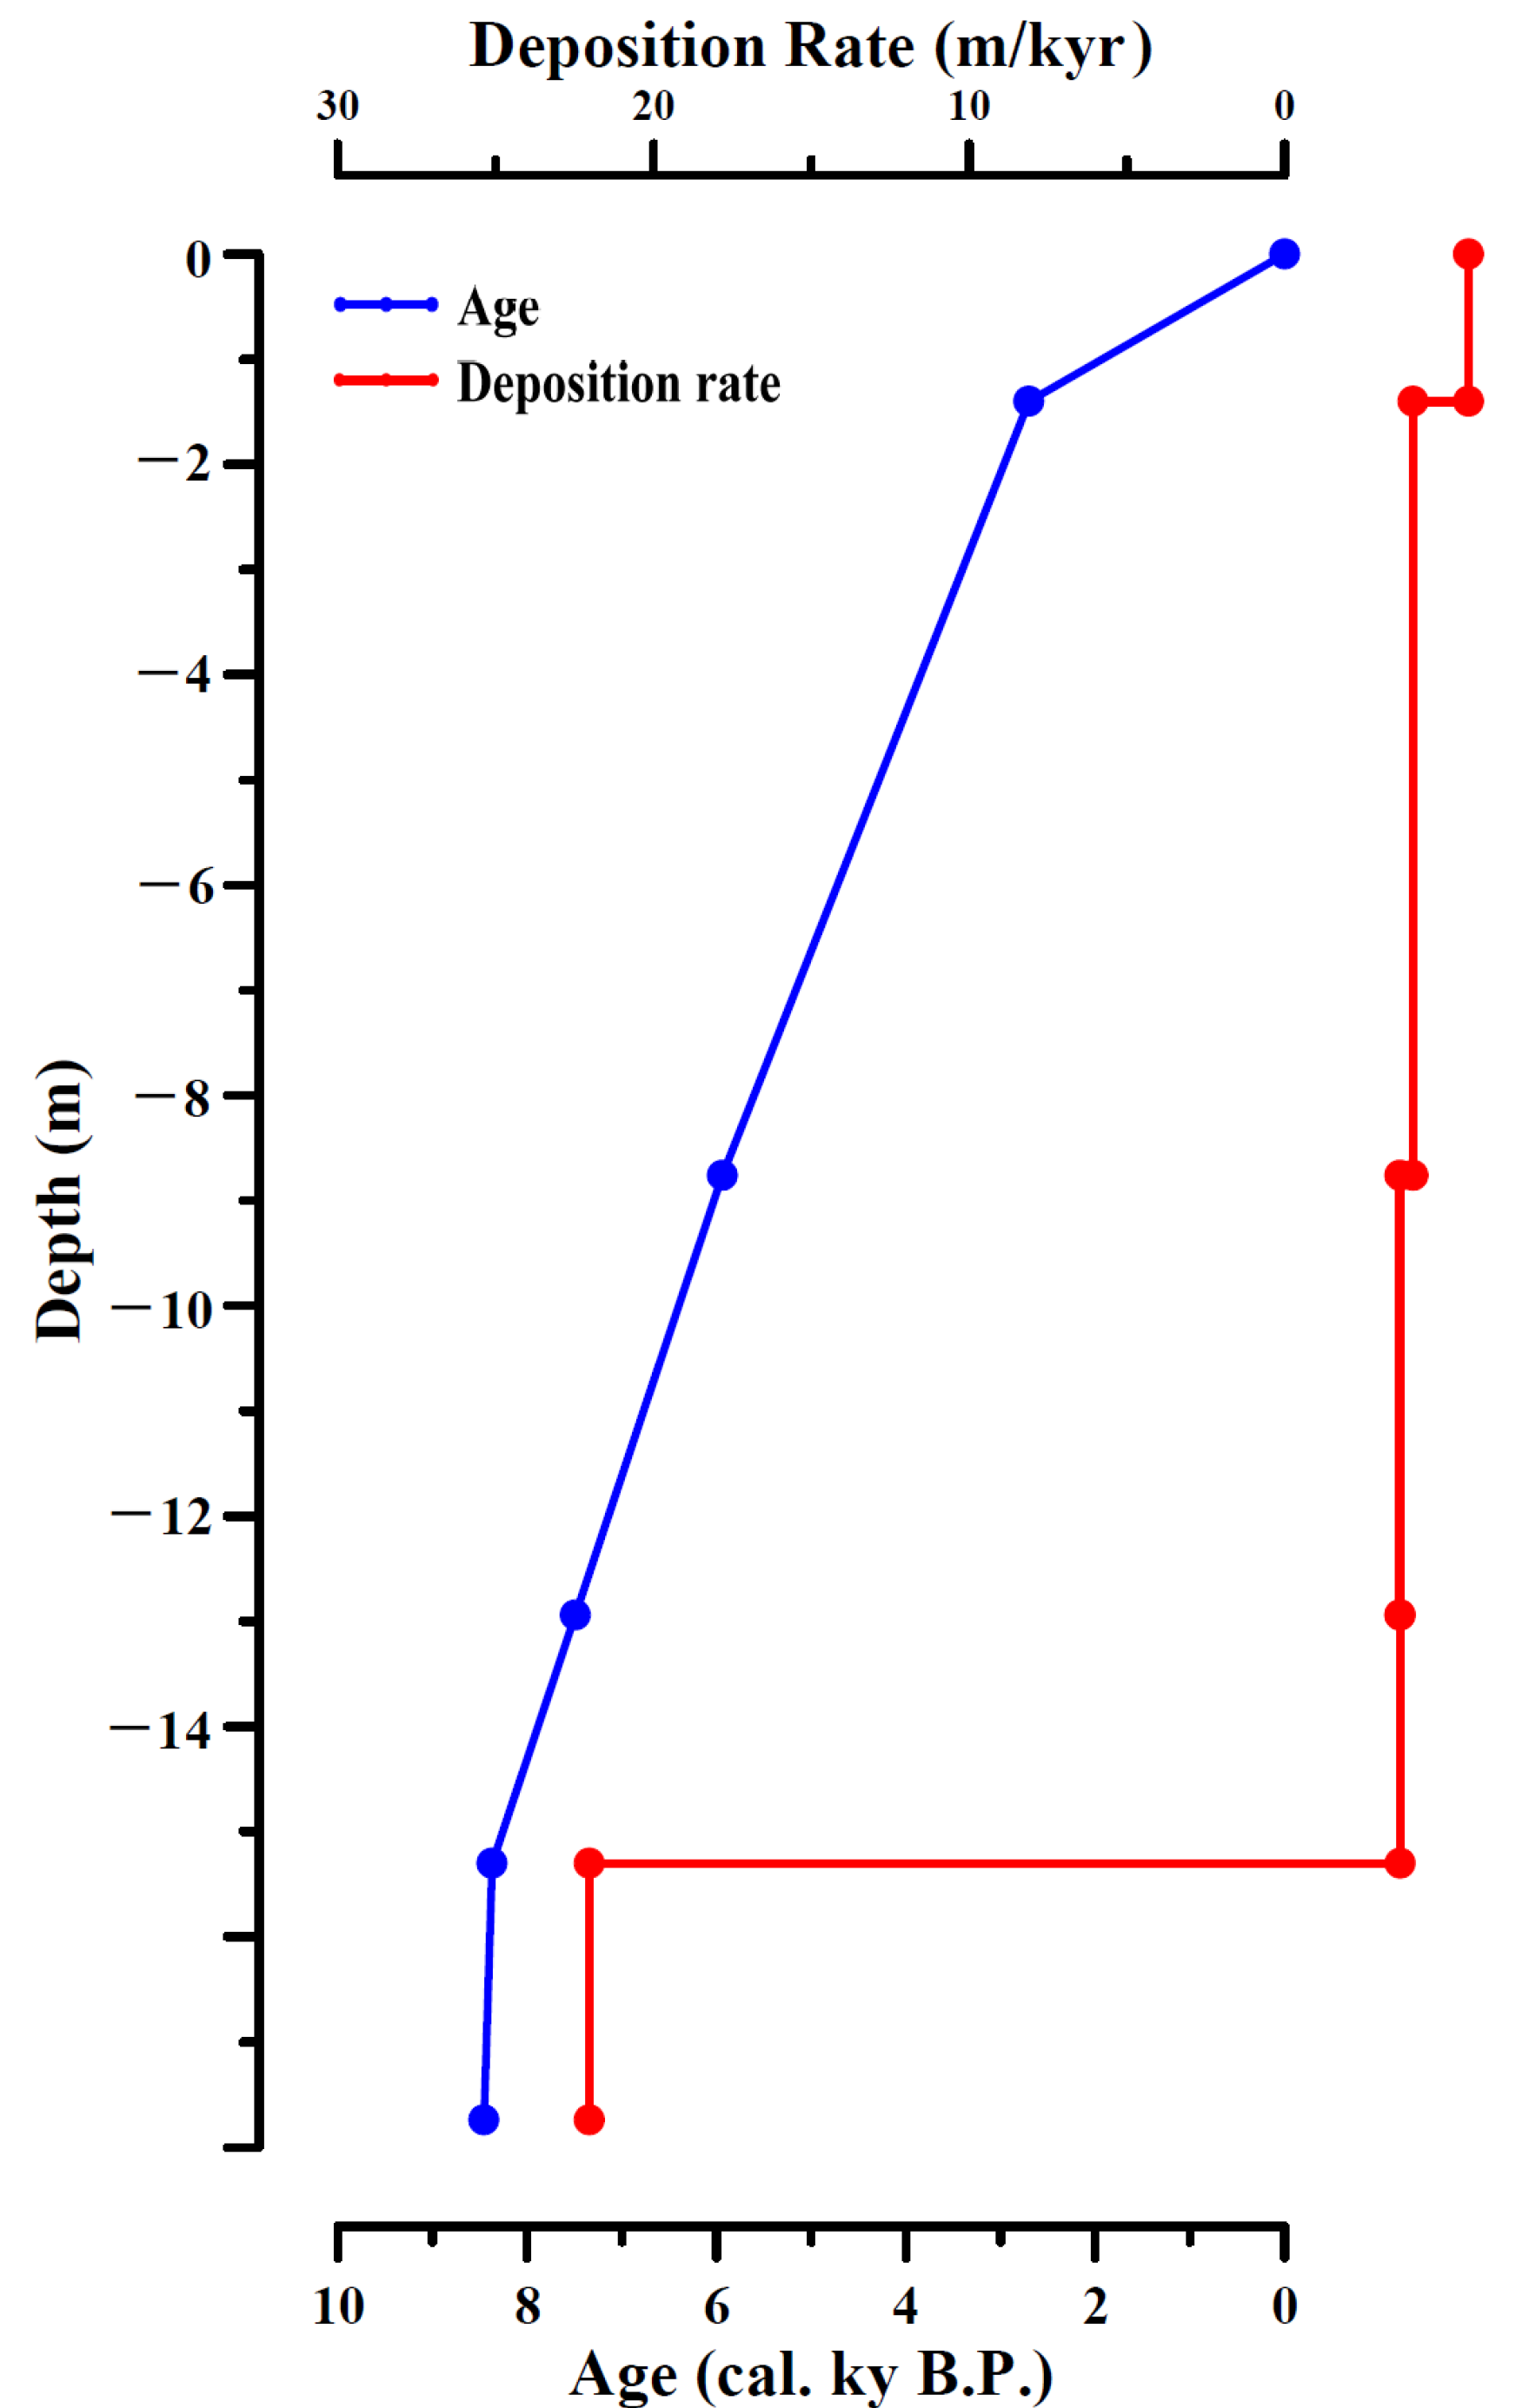
3.1. Age framework and Deposition Rate

AMS14C ages show that core WH-05 records the sedimentation history since 8.5 ka B.P. The sedimentary succession has strong continuity and no age reversal, indicating that the sedimentary environment of the clinoform has been relatively stable. Since the Holocene, the average sedimentation rate of core WH-05 is about 2.1 m/ka. From 8.5 to 8.37 ka B.P., the deposition rate (~28.37 m/ka) was very high. From 8.37 to 2.70 ka B.P., the deposition rate was relatively stable, ranging from 2.27 to 2.69 m/ka. In contrast, the deposition rate decreased sharply since 2.7 ka B.P. (~0.52/ka) (see details in Table 1 and Figure 4).

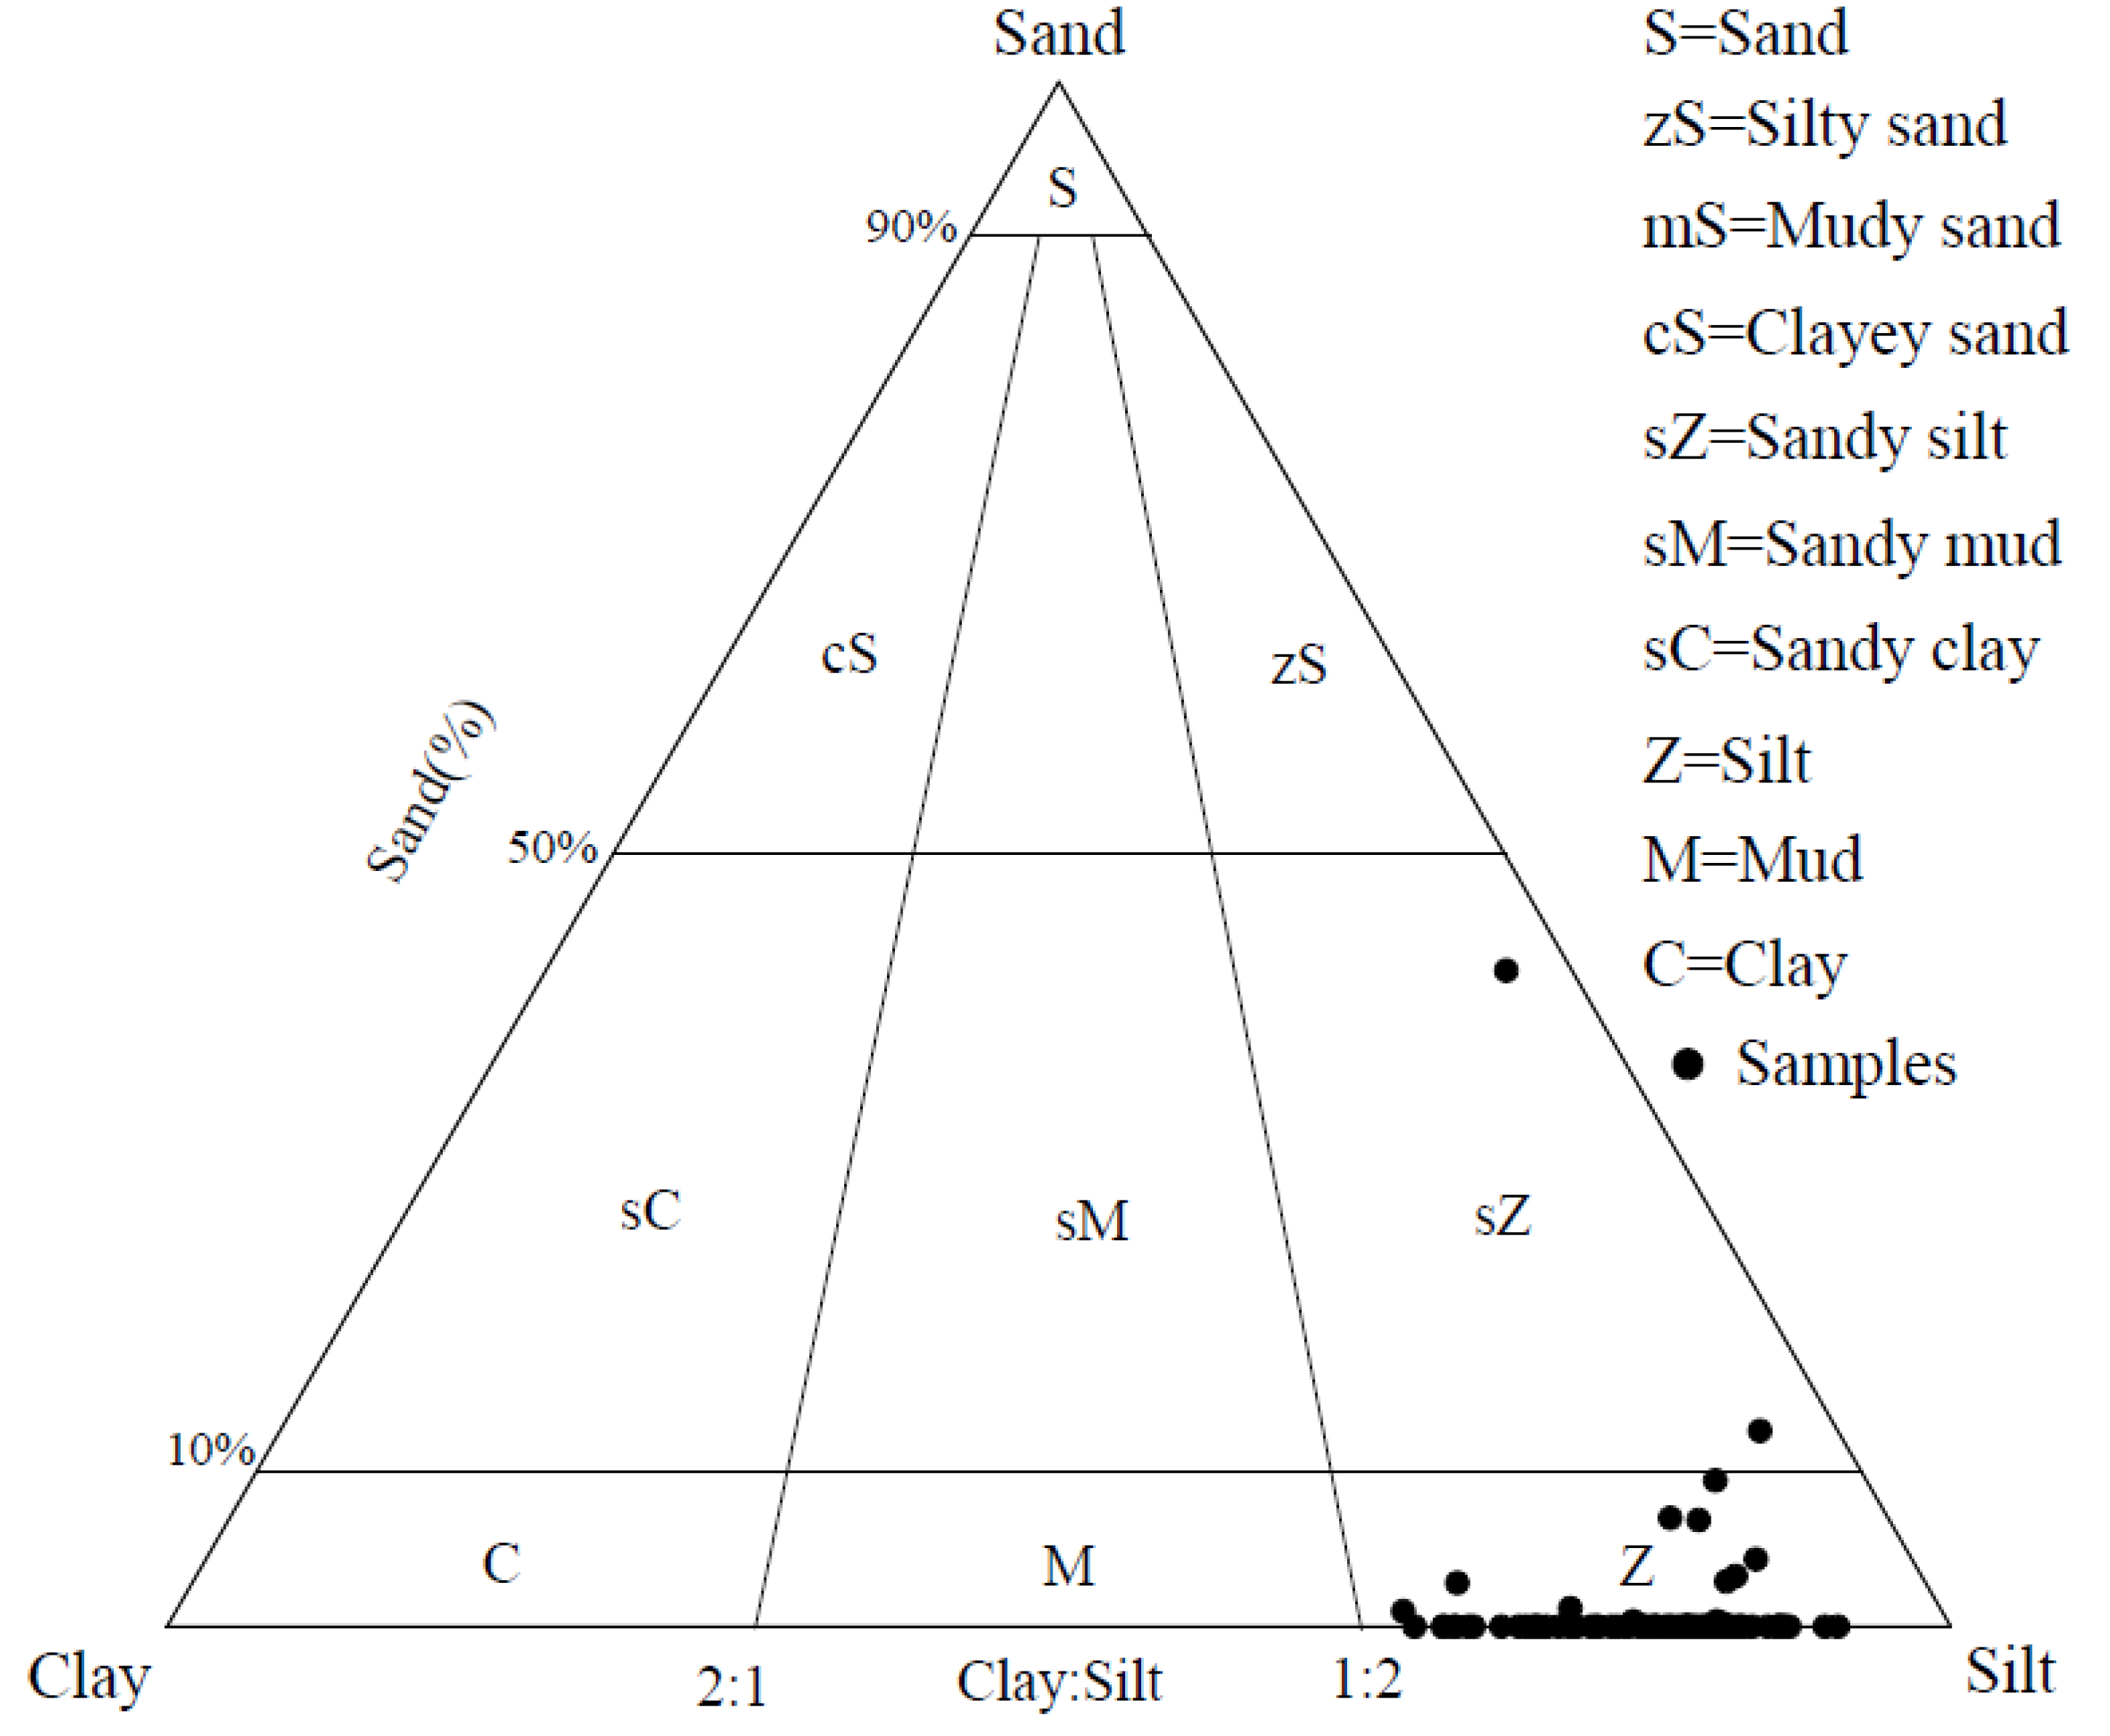
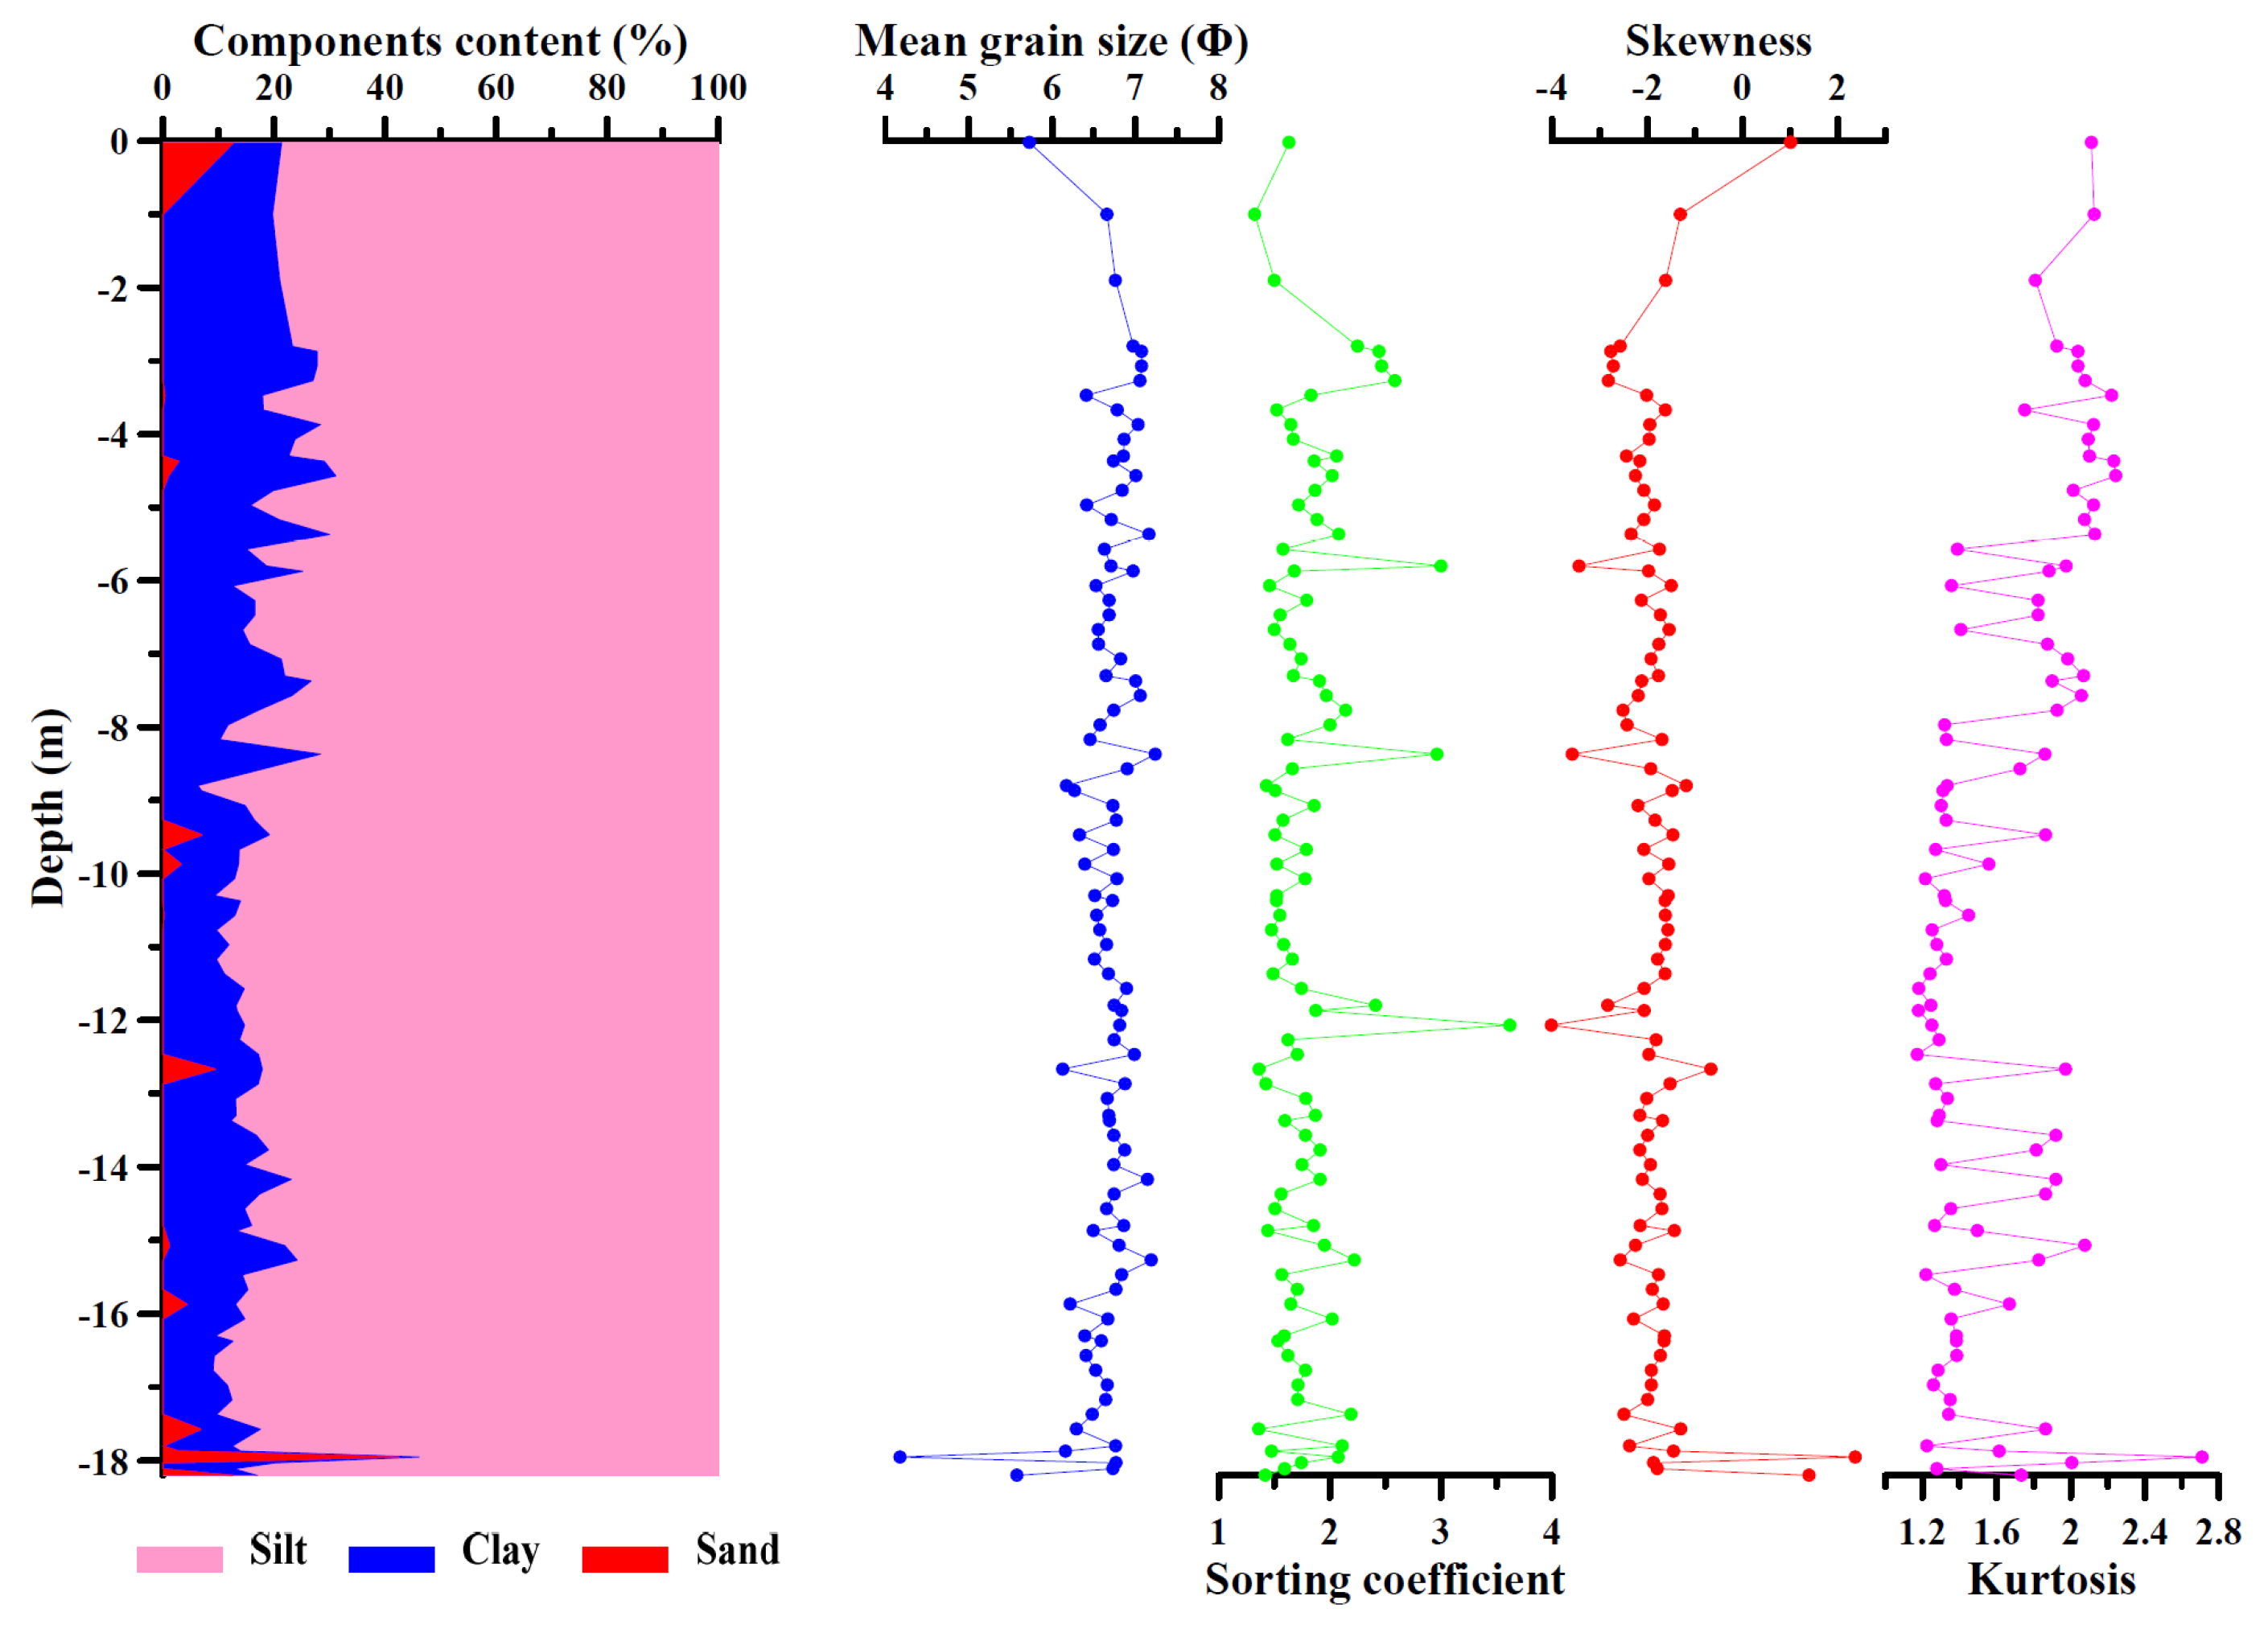
3.2. Sediments Type and Grain Size Characteristics

According to Folk and Ward [23], the sediments of core WH-05 can be divided into two types: sandy silt and silt (Figure 5). Silt is the main sediment type, and only the bottom layer of the core is sandy silt sediment. The sediment is mainly composed of silt fraction (ranging from 53.9% to 93.7%, with an average content of 82.7%). Except for very few layers, the sand fraction content is the lowest (ranging from 0 to 42.5%, with an average content of 1.2%). The clay fraction content shows intermediate values (ranging from 3.7% to 30.2%, with an average content of 16.1%).
The mean grain size (Mz) of samples varies from 4.2 to 7.2Φ, with an average value of 6.7Φ. Among them, the Mz of sediments at the depth of 0 m~−17.8 m change little (ranging from 6.1Φ~7.2Φ). The sediment sorting coefficient varies from 1.3 to 3.6 with an average value of 1.8. The sorting coefficient (δ) of sediments at the depth of −3.5 m to −17.2 m varies slightly. The skewness (Sk) varies from −4.0 to 2.4 with an average value of −1.9. The kurtosis (Ku) varies from 1.2 to 2.7, with an average value of 1.6 (see details in Table 2 and Figure 6).

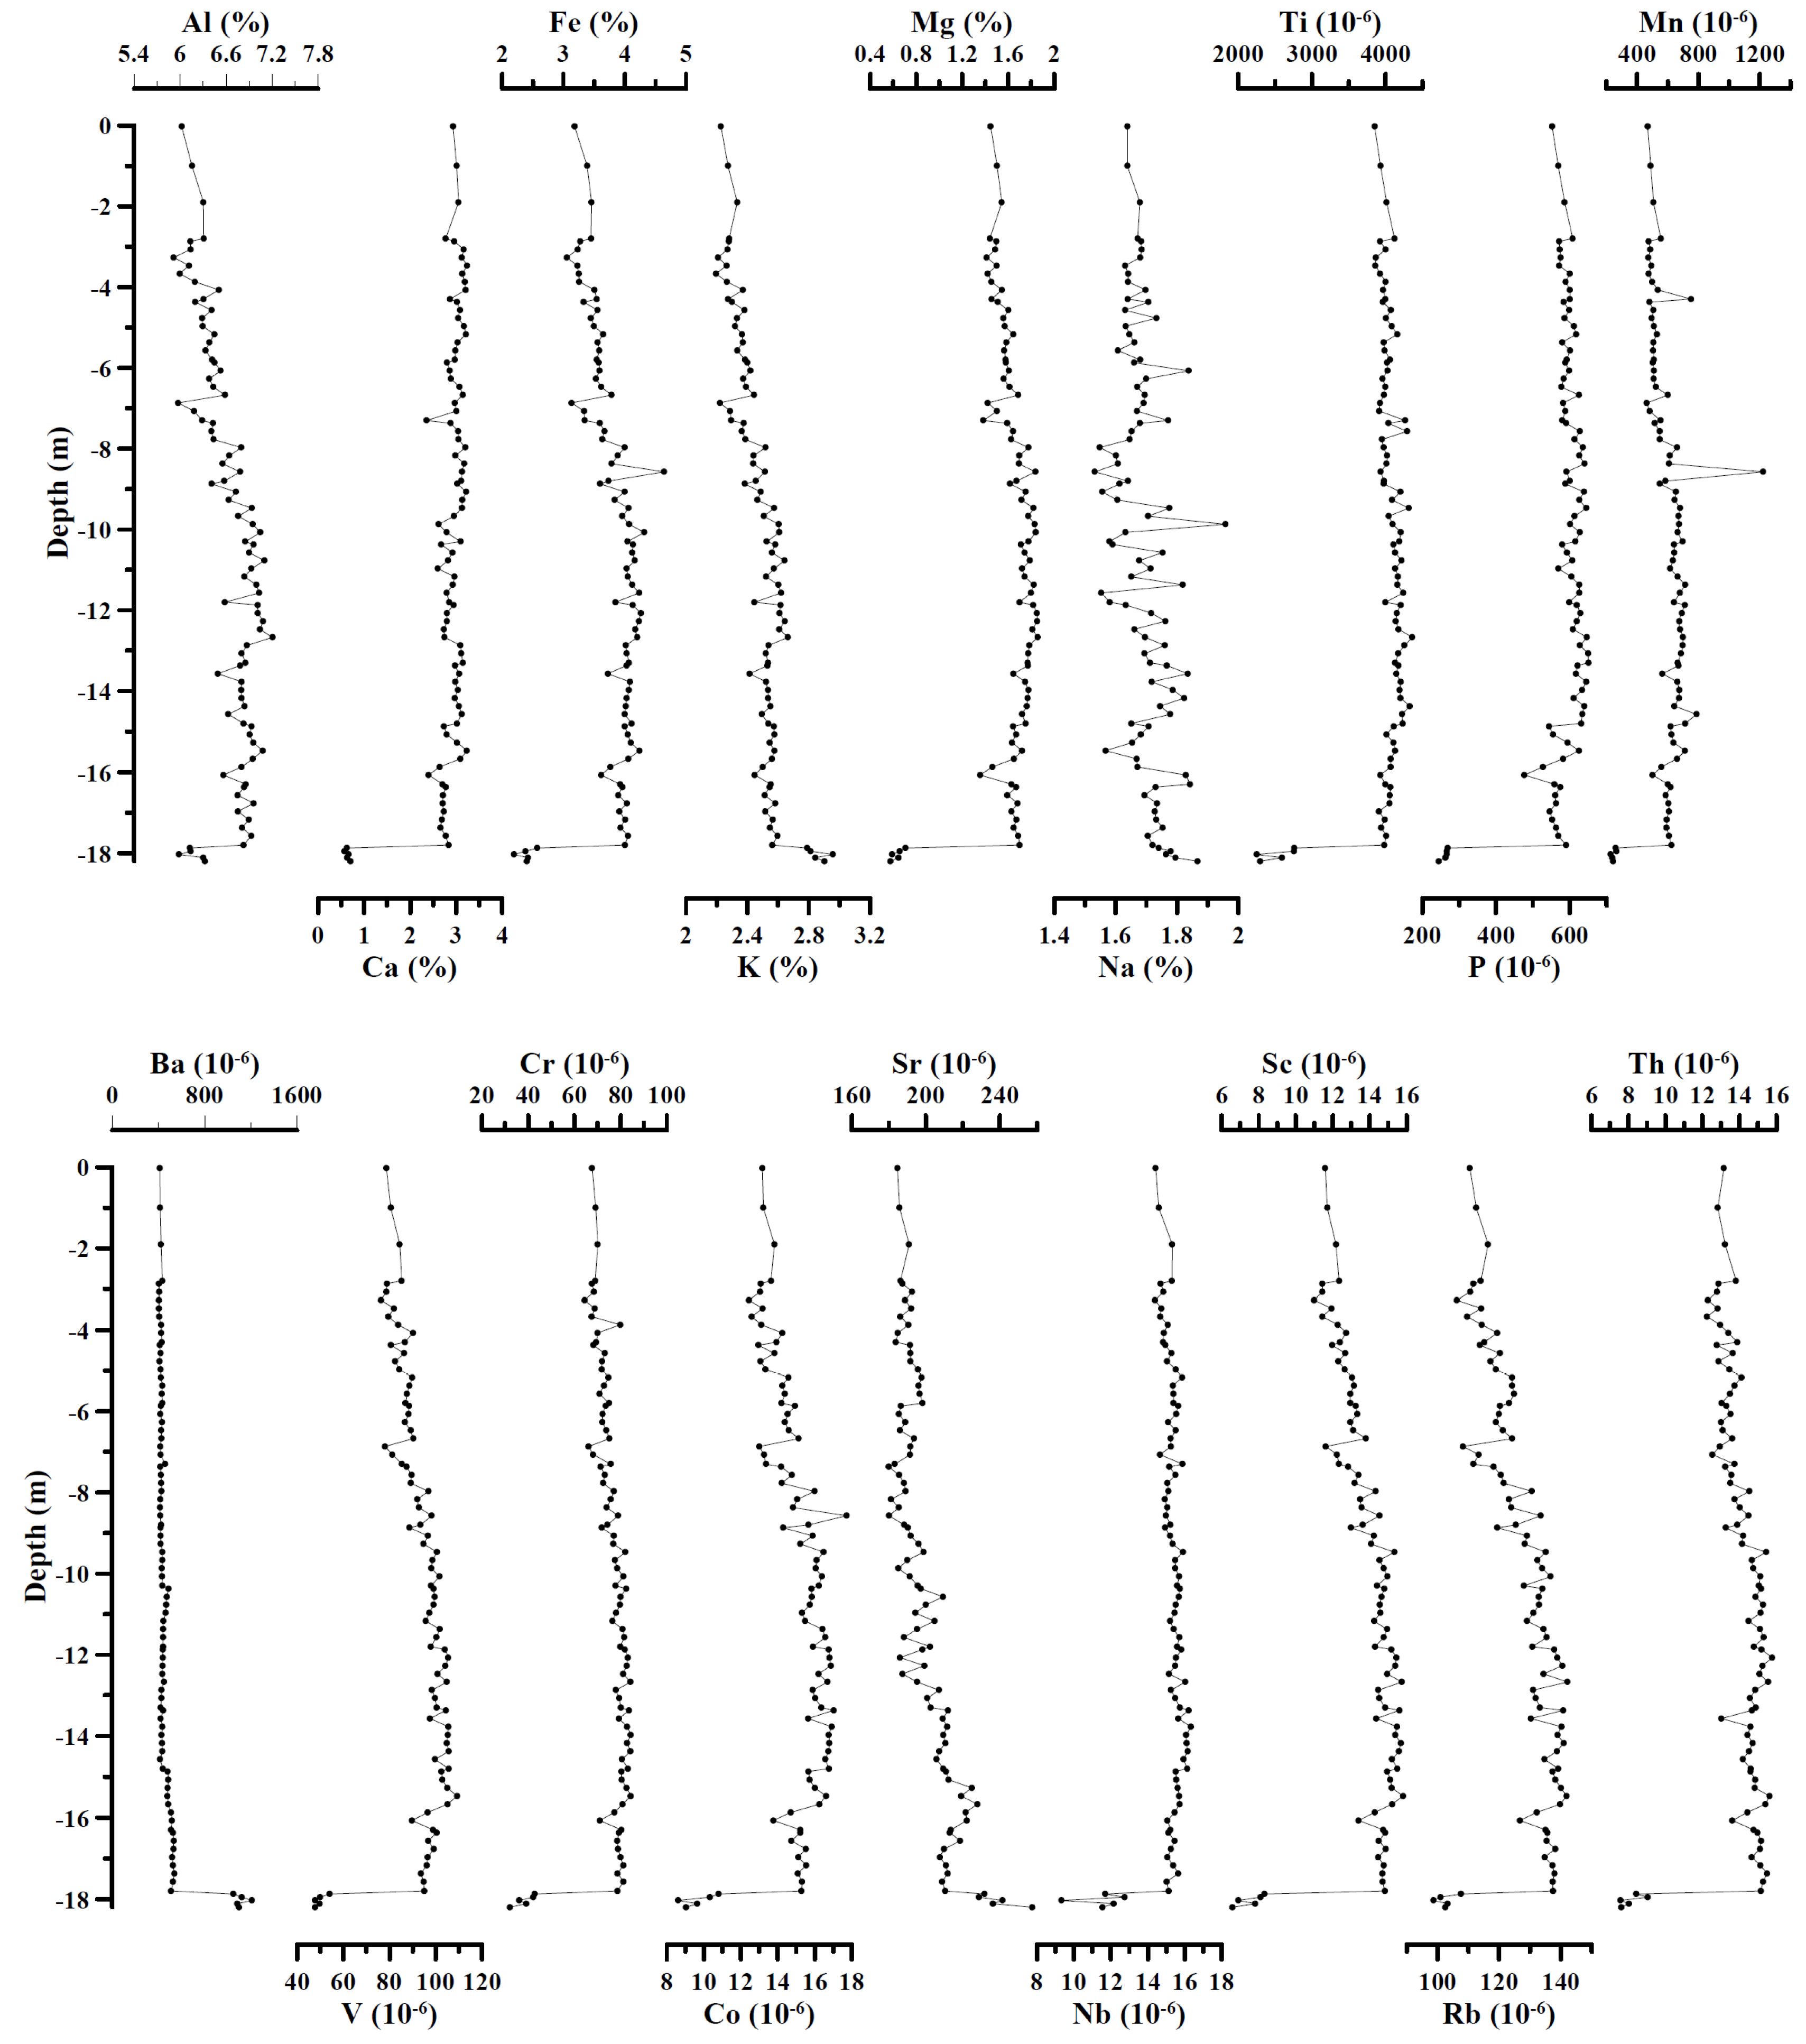
3.3. Major and Trace Element Contents

Major and trace element contents of sediments from core WH-05 are shown in Table 3. Except for Si, the Al content is the highest among major elements, ranging from 5.9% to 7.2% with an average value of 6.6%. The Fe content is the second highest, ranging from 2.2% to 4.6% with an average value of 3.7%. Among the trace elements, the content of Ba in sediments is the highest, ranging from 405.3 μg/g to 1210.0 μg/g with an average value of 481.7 μg/g. The Sr content is the second highest, ranging from 180.0 μg/g to 257.6 μg/g with an average value of 200.2 µg/g. On the whole, the coefficient of variation of trace elements is slightly larger than that of major elements. The contents of each element from the core sediments are similar to those of surrounding rivers (such as the Changjiang, Huanghe, Yalu, Keum, and Yeongsan rivers) sediments [2,24,25,26,27].
The vertical distribution of major and trace elements of core sediments is shown in Figure 7. Based on element contents, the core WH-05 can be divided into two intervals (T1: 0~−17.8 m, T2: −17.8 m~−18.2 m). In the T1 interval, most element contents decrease gradually from deep to shallow except for Ca, Na, Ba, and Nb. The contents of Ca and Ba are relatively stable, with little fluctuations. Although the Nb content varies, there is no obvious trend. The Na content changes more abruptly and does not show any visible pattern. There is a large gap between the element contents of the T1 and T2 interval except for the Na content. Among them, the contents of K, Ba, and Sr are higher in T2 with respect to T1, whereas other elements show the opposite trend.

4. Discussion

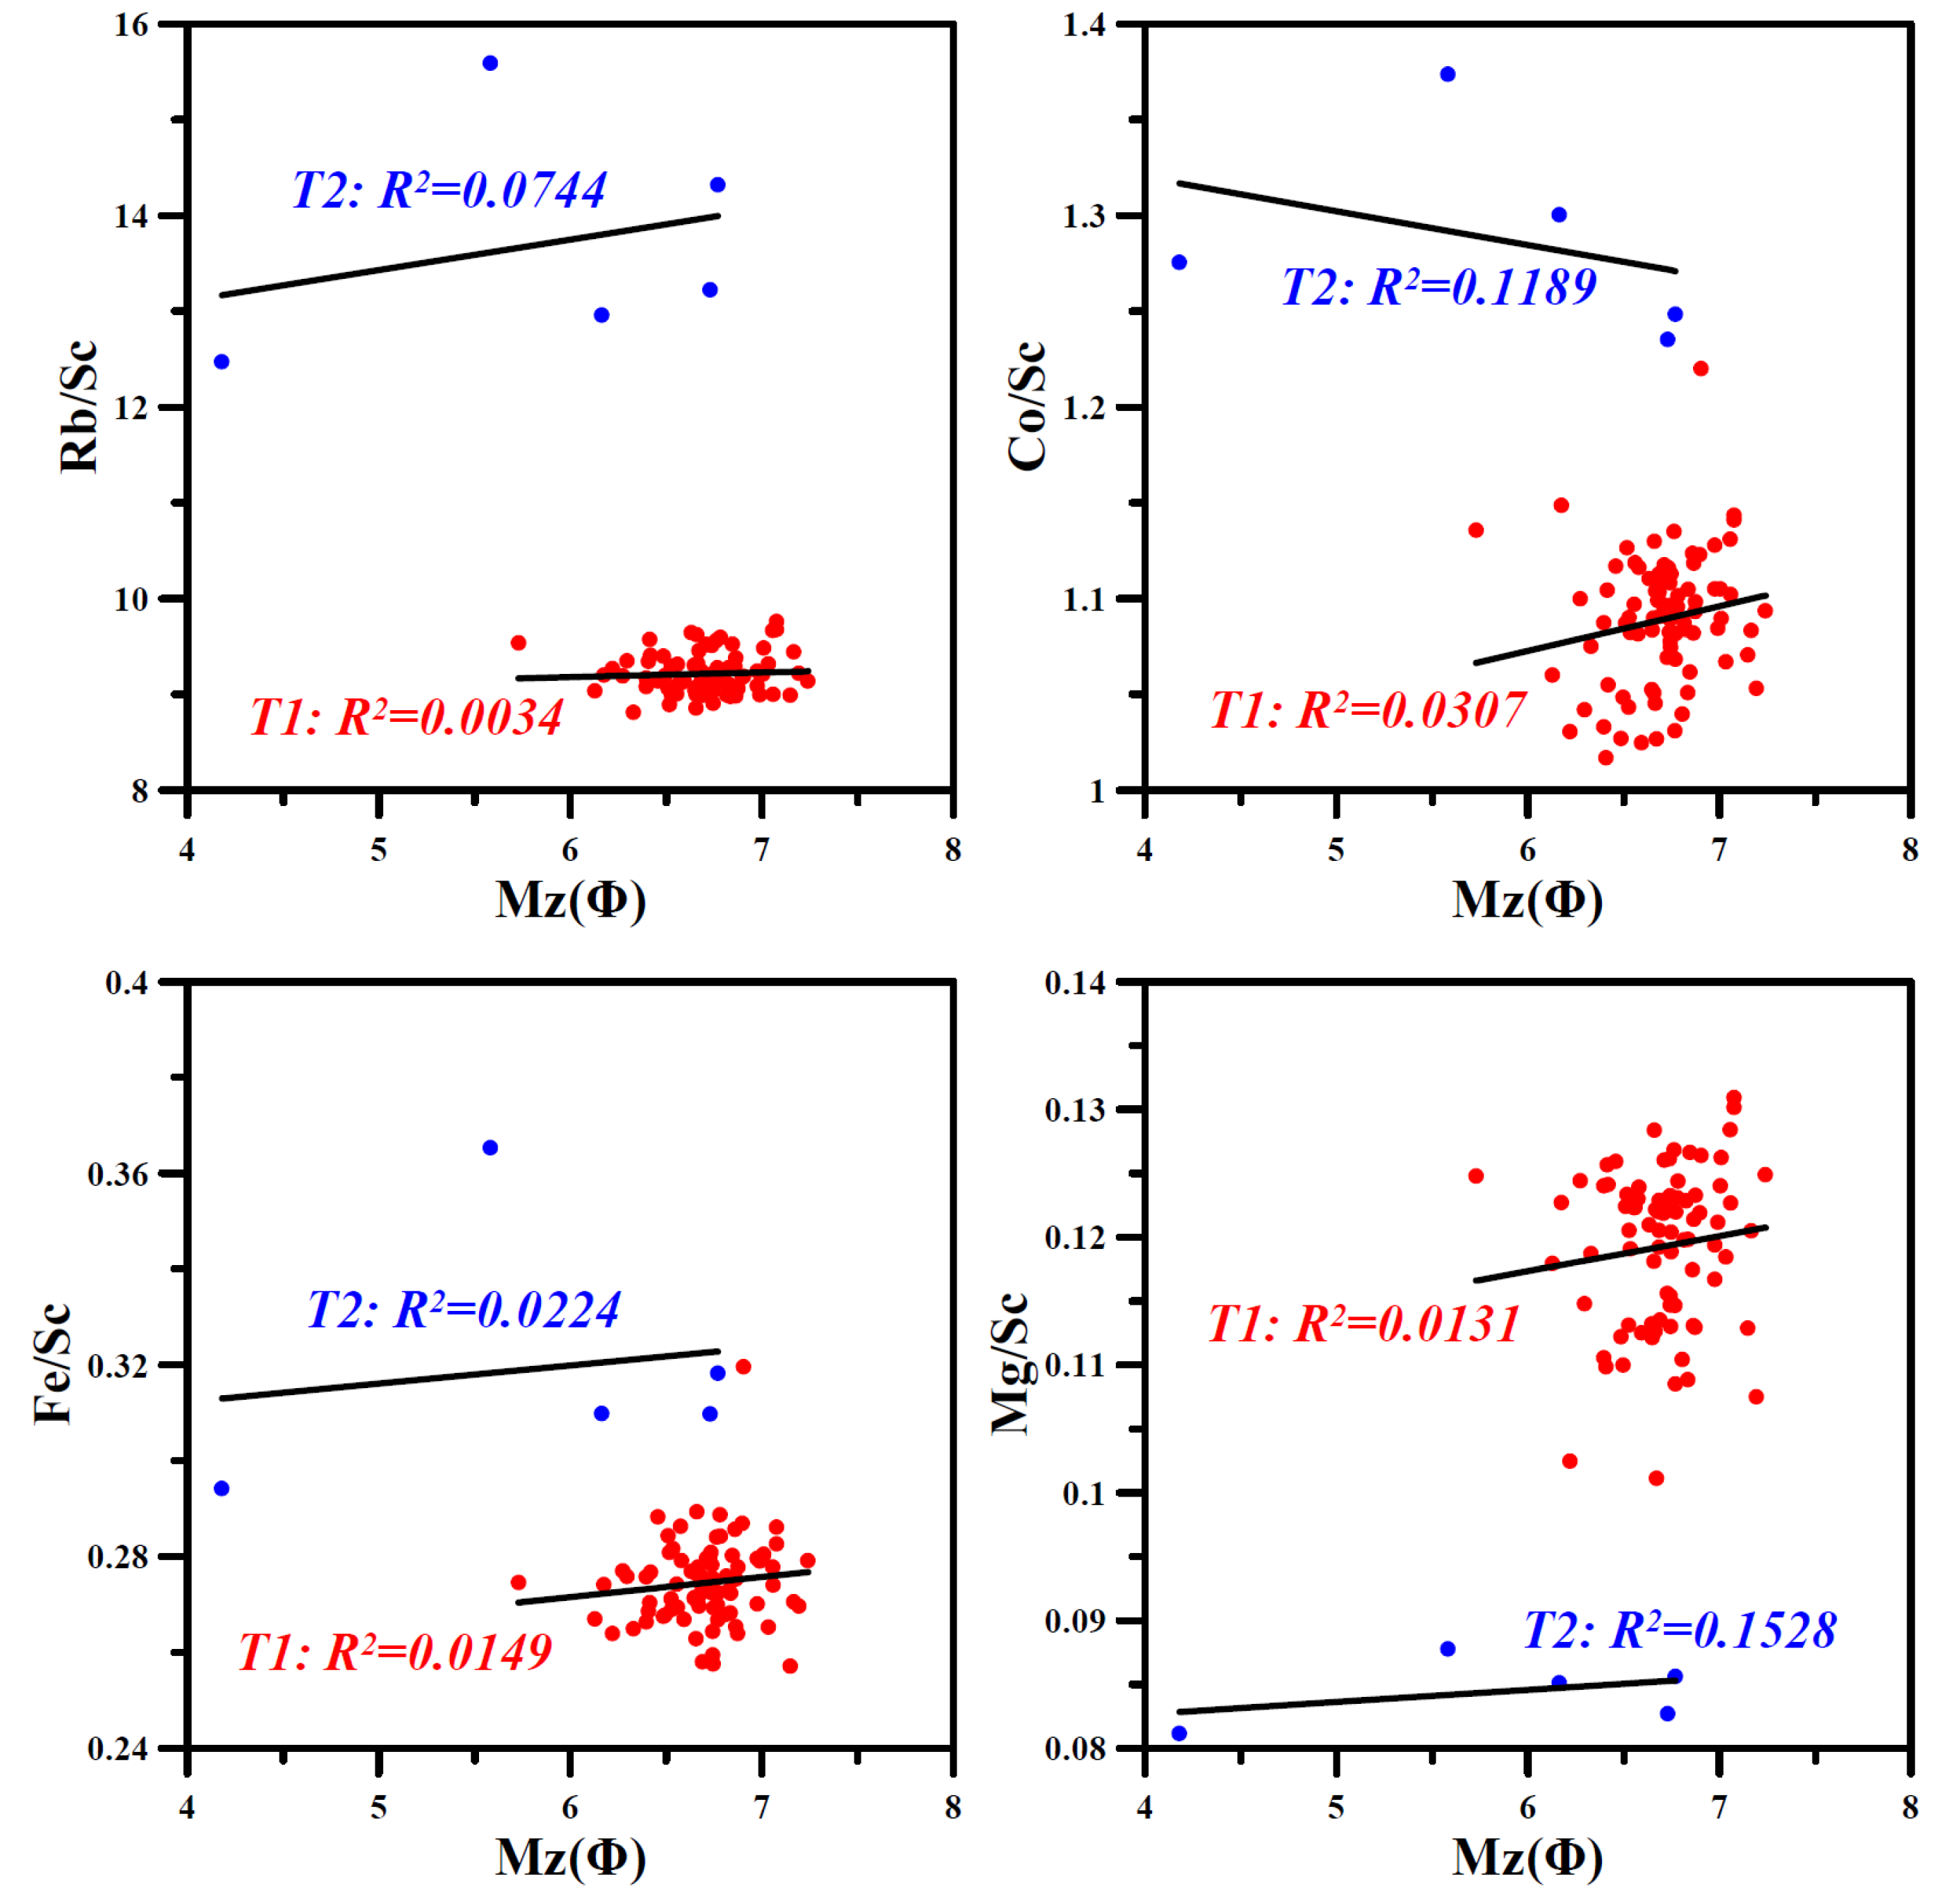
4.1. Correlation Analysis

We use SPSS19.0 software (IBM, New York, NY, USA) to analyze the correlation between the element contents and grain size indices of sediments from core WH-05. The correlation coefficient between each index is shown in Table 4. The correlations between mean grain size (Mz) and the element contents are weak (R2 ≤ 0.2601), which may be related to the variation of Mz in the sediment core (mainly between 6.1Φ~7.2Φ). The contents of most elements (except for K, Na, Ba, Sr, and Pb) are positively correlated with Mz, indicating that most elements tend to be enriched in fine-grained sediments. However, the contents of most elements (such as Al, Fe, K, Na, Mn, Ba, Li, V, Co, Ni, Cu, Zn, Sr, Pb, Rb, Sc, Th) are negatively correlated with clay (>8Φ) and sand fractions (−1Φ~4Φ), and weak positively correlated with silt fraction (4Φ~8Φ). This characteristic shows that most elements tend to be enriched in silt fraction, which is consistent with the fact that the core sediments are mainly composed of silt fraction.
The correlations between typically terrigenous elements (Al, Rb, Sc, Th, etc.) are significant (r > 0.8), indicating the terrigenous characteristics of sediments. The Ca content is significantly positive correlated with Mg and P, but not with typical terrigenous elements (Al, Fe, and Sc), indicating that the Ca content may be also affected by other sources other than the terrigenous sediments. In addition, the Ca content is significantly negatively correlated with Ba and Sr contents, which may be caused by an isomorphic substitution between them. The Mn content is significantly positively correlated with Fe, indicating that the sources of Fe and Mn are consistent. At the same time, Fe and Mn contents show an obvious positive correlation with contents of typically terrigenous elements such as Al and Sc, indicating that Mn of the sediments mainly comes from the input of terrigenous sediments. The contents of K and Na, easily migrated elements, are both weakly correlated with other elements, indicating that the sediment of core WH-05 may be the product of long-distance transportation or a strong weathering effect. In addition, the difference in the K and Na migration capacity leads to the weak correlation between their contents in sediments. Therefore, the sediments of core WH-05 mainly come from terrigenous materials, and are also affected by other sources (e.g., sea water and marine organisms).

4.2. Factor Analysis

Using the statistical software SPSS 19.0, we conducted an R-type factor analysis on the element contents in the sediments from core WH-05 to discuss the controlling factors. Common factors (eigenvalues > 1) were extracted using the principal component method and covariance matrix. The results show that the Kaiser–Meyer–Olkin value and P-value of Bartlett’s spherical test are 0.90 and 0, respectively, which indicates that the analysis method is suitable and exhibited a high level of confidence. Based on this method, two common factors are extracted, accounting for 87.14% of the total variance (Table 5). Therefore, the content of major and trace elements in core WH-05 sediments is mainly controlled by two factors.
Factor 1, explaining 62.89% of the total variance, is the decisive factor of element contents in the sediments. Most elements in sediments have a high load in factor 1, and are significantly positively correlated with typical diagenetic elements such as Al and Fe. The high loads of stable diagenetic elements (Al, Fe, Mg, Ti, etc.) and typical terrigenous elements (V, Sc, Th, etc.) in factor 1 show that the terrigenous material input is the mainly controlling factor for the element contents in the sediments of core WH-05.
Factor 2 explains 24.25% of the total variance, with high loads of K, Ca, Ba, P, Na, Sr, Ca, Ba, and Sr being typical biogenic carbonate elements, and P exists widely in animal and plant tissues. The low correlations between these elements and most diagenetic elements such as Al and Fe show that the contents of Ca, Ba, Sr, and P in core sediments of core WH-05 are affected by marine organisms. K and Na are usually transferred from water to sediment in a free state. K and Al are weakly correlated with terrigenous elements (Al, Ti, etc.), indicating that the contents of Na and K are greatly affected by adsorption and leaching during the weathering of source rock and the long-distance transportation of sediments. Therefore, factor 2 may represent the effect of marine chemistry and organisms. In conclusion, the factor analysis results record together the influence of terrigenous sediments, marine chemistry, and organisms on the element contents in the sediments from core WH-05.

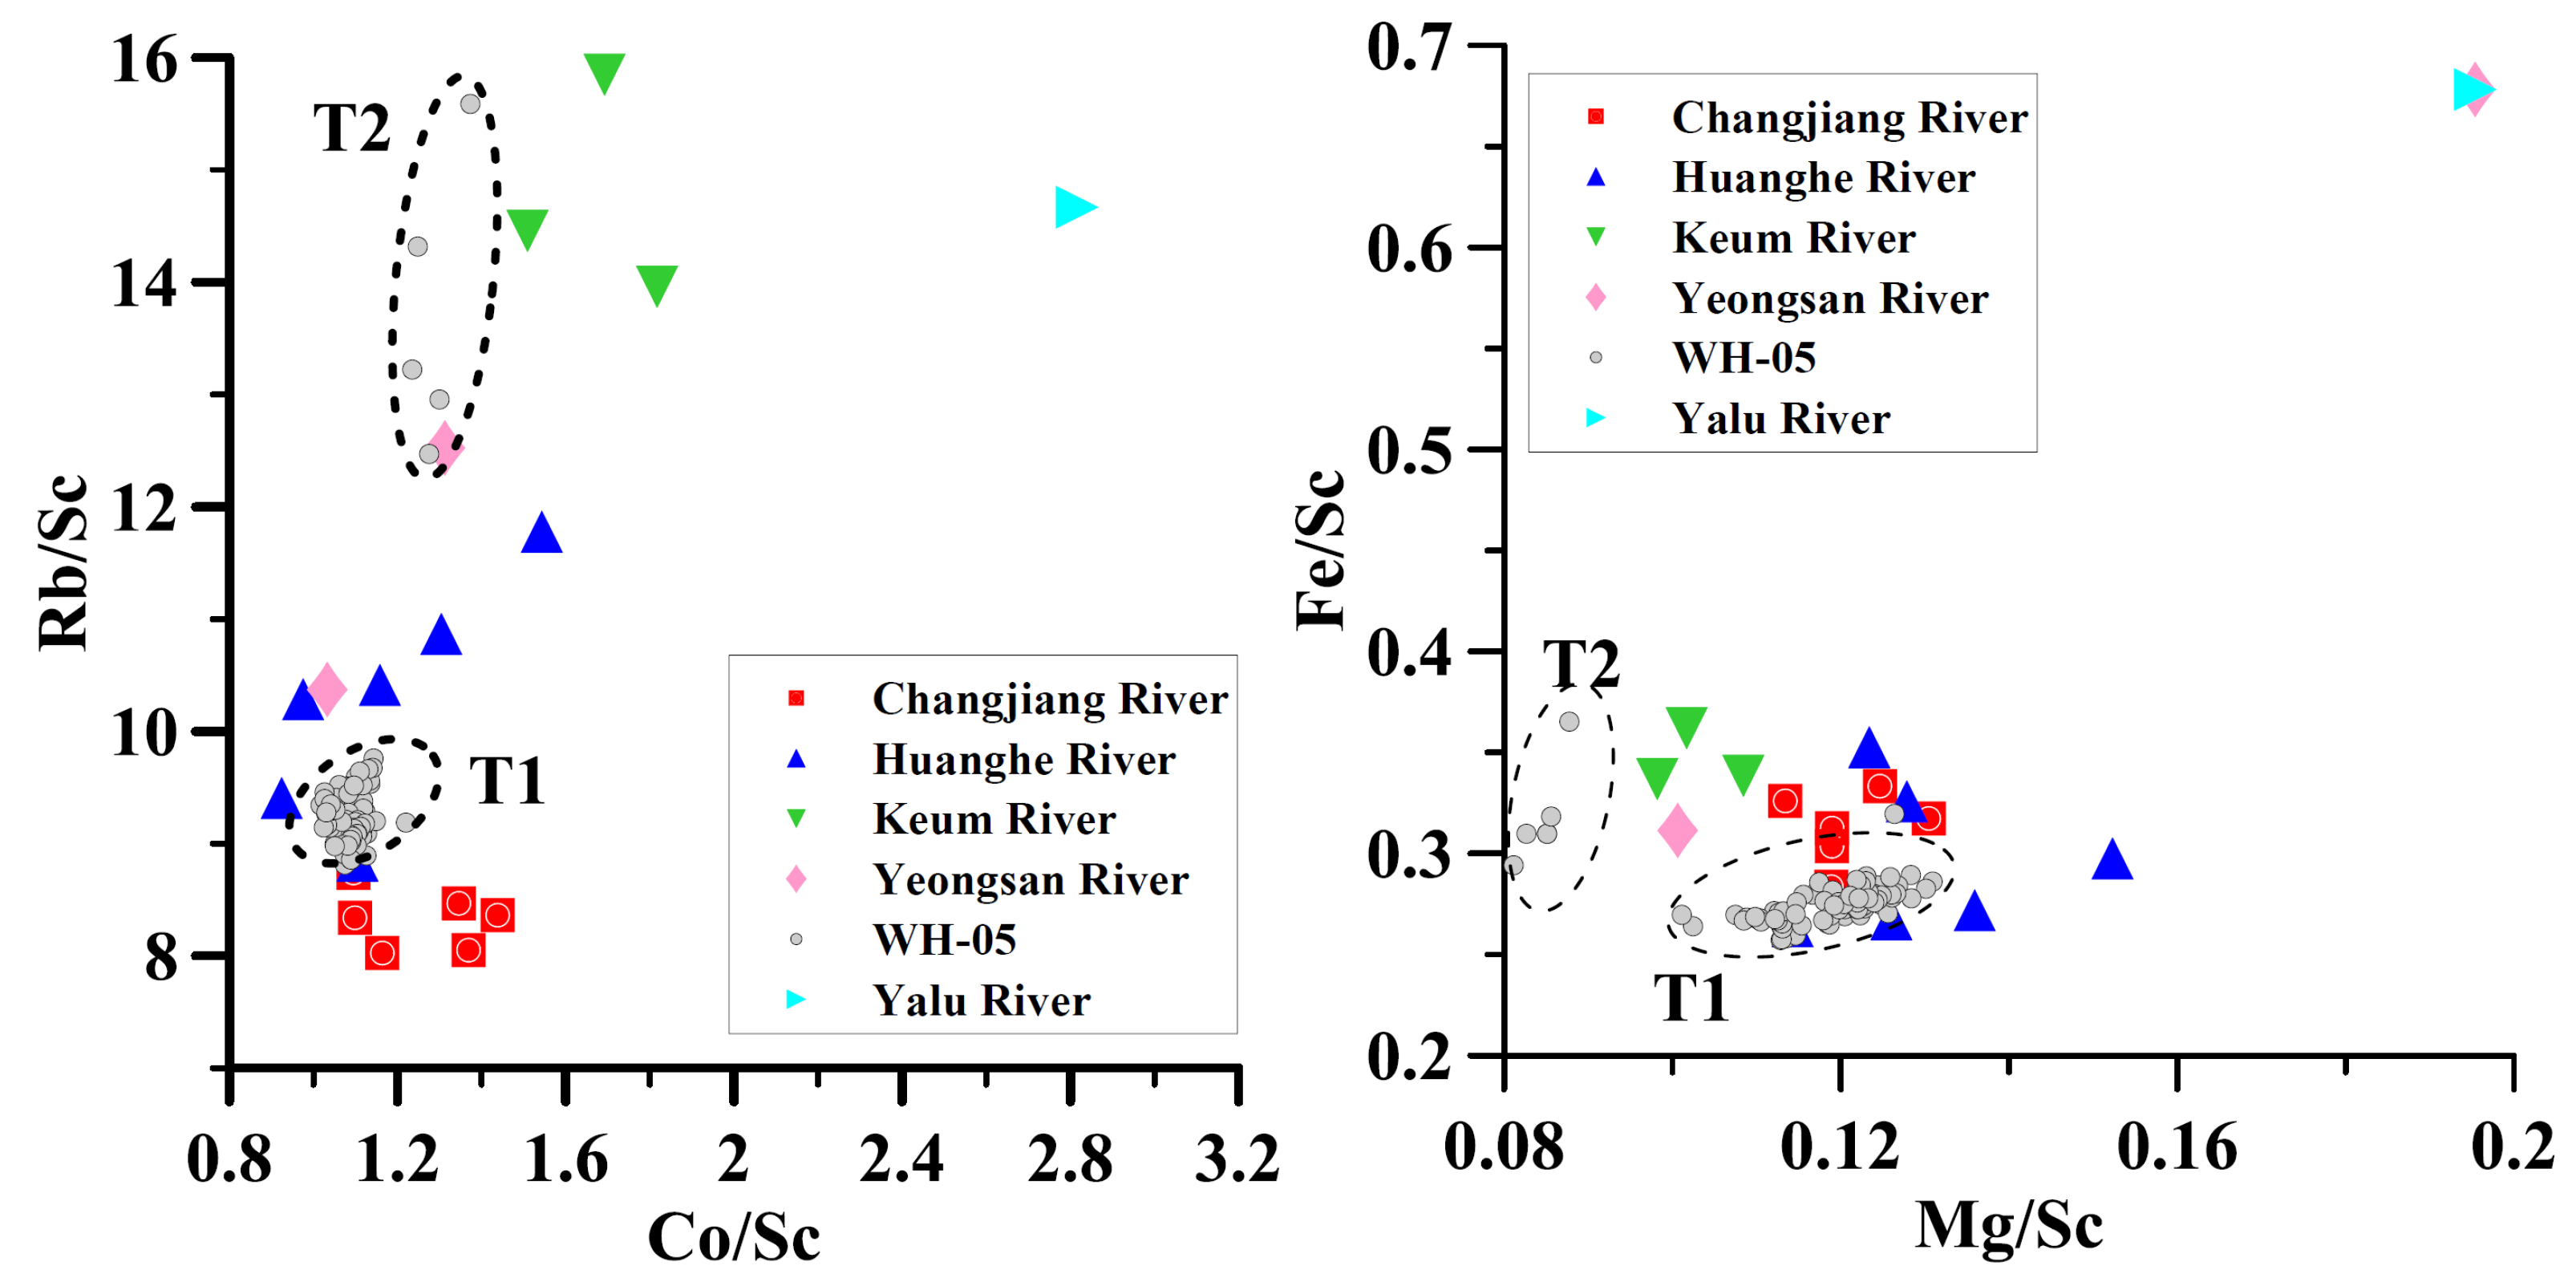
4.3. Identification of Sediment Provenance

The contents of major and trace elements in marine sediments are affected not only by the provenance, but also by chemical weathering [28,29,30,31]. Therefore, the impact of chemical weathering on sediments must be evaluated before sediment source identification in the study area. Here, we use the modified chemical index of alteration (CIA*) (no CaO included) [27] to estimate chemical weathering intensity. CIA* is expressed as follows:
CIA * = 100 × Al 2 O 3 Na 2 O + K 2 O + Al 2 O 3
The CIA* values for the sediments from core WH-05 and potential provenance are presented in Table 3. The CIA* values of sediments in the T1 interval ranges from 69.4 to 71.9, with an average value of 70.5, which is between the values of potential provenance. The CIA* values of sediments in the T1 interval are slightly larger than those of Huanghe River sediments (69.2), and much smaller than those of Changjiang River sediments (78.4). In addition, the CIA* values of sediments in the T2 interval ranges from 65.6 to 67.1, with an average value of 66.6, which is much lower than those of surrounding river sediments. This result confirms that the Huanghe River sediments are the most likely source in the T1 interval. The degree of chemical weathering in Huanghe River sediments increases after ocean transportation, which might cause the CIA* values of sediments in the T1 interval to be slightly larger than those of Huanghe River sediments, whereas sediments in the T2 interval may not match the potential provenance because of its much smaller CIA* values compared to those of river sediments.
Based on the results of the correlation analysis, the correlation coefficients of various element contents with Mz are weak (R2 < 0.26), indicating that the grain size has little effect on the element contents of core WH-05 sediments. The results of the factor analysis show that the input of terrigenous materials is the main source of sediments from the core WH-05. The sediments of the North Yellow Sea, surrounded by the Chinese Mainland, Korea Peninsula, East China Sea, and Bohai Sea, mainly come from the river’s direct input, other seas (sediments transported by nearshore circulations from other seas to the North Yellow Sea), and coastal erosion [32]. Since almost no large rivers in the Shandong Peninsula directly flow into the North Yellow Sea, the river input sediments are mainly from the Liaodong Peninsula. The Yalu River sediments account for more than 60% of the rivers in the Liaodong Peninsula [32], so the main source of river input sediments is Yalu River sediments. The Bohai Sea and the South Yellow Sea, connected with the North Yellow Sea, are the main sources for the sediment from other seas. The Huanghe River with the largest sediment flux in China (1.5 × 10⁸ t/a) is the mainland-based material source to the Bohai Sea sediments [33]. The Changjiang River, Korean rivers, and the Huanghe River are also the main material sources of the South Yellow Sea sediments [24,25,26,27]. Therefore, sediments from other seas are initially from the Huanghe River, Changjiang River, and Korean rivers. Moreover, the Shandong Peninsula and Liaodong Peninsula are mainly bedrock coasts, and the erosion degree of waves and currents is very low, resulting in a limited sediment contribution. In conclusion, the Huanghe River, Changjiang River, Yalu River, and Korean rivers may be the main source of core WH-05 sediments, or even the main source of the subaqueous clinoform off the Shandong Peninsula.
Major and trace elements are often used as geochemical indicators for sediment source identification due to their different composition in river sediments [34,35]. The main source rocks in the Korean river basin are Jurassic and Cretaceous granites, Precambrian gneiss, and Quaternary loose alluvial deposits, which determine that Korean river sediments have relatively high contents of Al, K, and Ba [27]. The sediments of the Huanghe River inherit the characteristics of loess and have relatively high contents of Ca and Sr. The main source rocks in the Changjiang River basin are Paleozoic carbonate rocks and transition metal deposits, which determine that Changjiang River sediments have relatively high contents of trace elements [27]. The main source rocks in Yalu River basin are Archean metamorphic rocks and granite, which determine that Yalu River sediments have relatively high contents of K [36]. Therefore, major and trace elements in sediments are better indicators to distinguish these rivers’ sediments. We select Fe, Mg, Co, Rb, and Sc with a high load in factor 1, and use the element ratios as the source discrimination indices. According to Figure 8, the correlations between Fe/Sc, Mg/Sc, Co/Sc, Rb/Sc, and Mz are all weak (R2 ≤ 0.1528), which can well get rid of the effect of grain size.
It can be seen from Figure 9 that the element ratio points can be divided into T1 and T2 areas. The two areas correspond to the sediments in the 0~−17.8 m section and −17.8 m~−18.2 m section of the core, respectively, which again reveals that the core sediments were deposited in two completely different sedimentary environments. The two scatter diagrams both represent that the sediment points of the T1 section are closest to that of the Huanghe River, followed by Changjiang River and Yeongsan River, while the sediment points of the T2 section are far away from the sediments of all surrounding large rivers.
The drilling depth of th eT1 interval is from 0 to 17.8 m below the sea bed, and the drilling depth of the T2 interval is at about 18 m below the sea bed. Considering the present water depth of the location of core WH-05 (12 m), we can conclude that the T1 interval was formed from 30 m below the current sea level at the initial stage (~8.5 ka B.P.). At that time (~8.5 ka B.P.), the sea level was about 20 m lower than the present. Therefore, the initial water depth of that time (~8.5 ka B.P.) was about 10 m, where the influence of the tide and wave was limited. As a result, the T1 interval was formed in a relatively stable marine sedimentary environment. Since there is no test age, it can only be determined that the T2 interval was formed before 8.5 ka B.P. Here, we propose two possibilities for the formation time of the T2 interval, between 9.6 and ~8.5 ka B.P. or before 9.6 ka B.P. At the time of 9.6 ka B.P., the sea level was 30 m lower than the present [12,13]. If the T2 interval was formed before 9.6 ka B.P., seawater had not covered the location of the core WH-05 when the T2 interval formed. As a result, the T2 interval must be formed in the continental sedimentary environment. If the T2 interval formed between 9.6 and ~8.5 ka B.P. (water depth from 0 to 10 m), the sedimentary environment must have experienced drastic changes. However, it was difficult to form stable and uniform sediments (see Figure 3) such as the T2 interval in such a sedimentary environment. Therefore, we consider that the T2 interval formed before 9.6 ka B.P., and the sediments could not be deposited in the marine sedimentary environment.
As mentioned earlier, the sediment points of the T1 section are closest to that of the Huanghe River, followed by Changjiang River and Yeongsan River (Figure 9). It seems that the sediments from the Huanghe River, Changjiang River, and Yeongsan River may all affect the sediment of the T1 interval. However, it cannot be explained by transport processes. The circulation system of the North Yellow Sea (NYS) is mainly associated with the North Shandong Peninsula Coastal Current (NSCC), the South Liaoning Coastal Current (SLCC), and the Yellow Sea Warm Current (YSWC) [37,38]. The NSCC flows eastward along the northern coast of the Shandong Peninsula and reaches the South Yellow Sea (SYS) [39] (Figure 1). The YSWC enters the NYS along the west side of the Yellow Sea trough in winter [40,41] (Figure 1). Only considering the distribution of circulations and rivers, NSCC might be the driving force of the Huanghe River sediments, and the YSWC might bring the Changjiang River and Yeongsan River sediments to the study area. According to the results of Bi et al. (2011) [42], the suspended sediments in the Bohai Sea are mainly from Huanghe River sediments, and about 40 × 106 t/yr of these suspended sediments can transport through the southern Bohai Strait into the NYS. As a result, there is no doubt that the Yellow River sediments can be deposited in the study area fed by the NSCC. The YSWC formed at about 7.0 ka B.P. [15], which suggested that there was no current that could bring sediments from the Changjiang River and Yeongsan River to the study area before 7.0 ka B.P. After the formation of the YSWC, it could indeed carry part of the Yeongsan River and Changjiang River sediments into the North Yellow Sea, but only around 1 × 10⁶ t/yr of sediments [43]. In addition, a part of the limited sediments carried by the YSWC is the Huanghe sediments entering the South Yellow Sea. As a result, the contribution of the Yeongsan River and Changjiang River sediments to the study area can be neglected compared to the Huanghe River sediments.
Therefore, we believe that the element characteristics of sediments of the T1 interval were mainly affected by the sediments of the Huanghe River, while the T2 interval formed in the continental sedimentary environment.

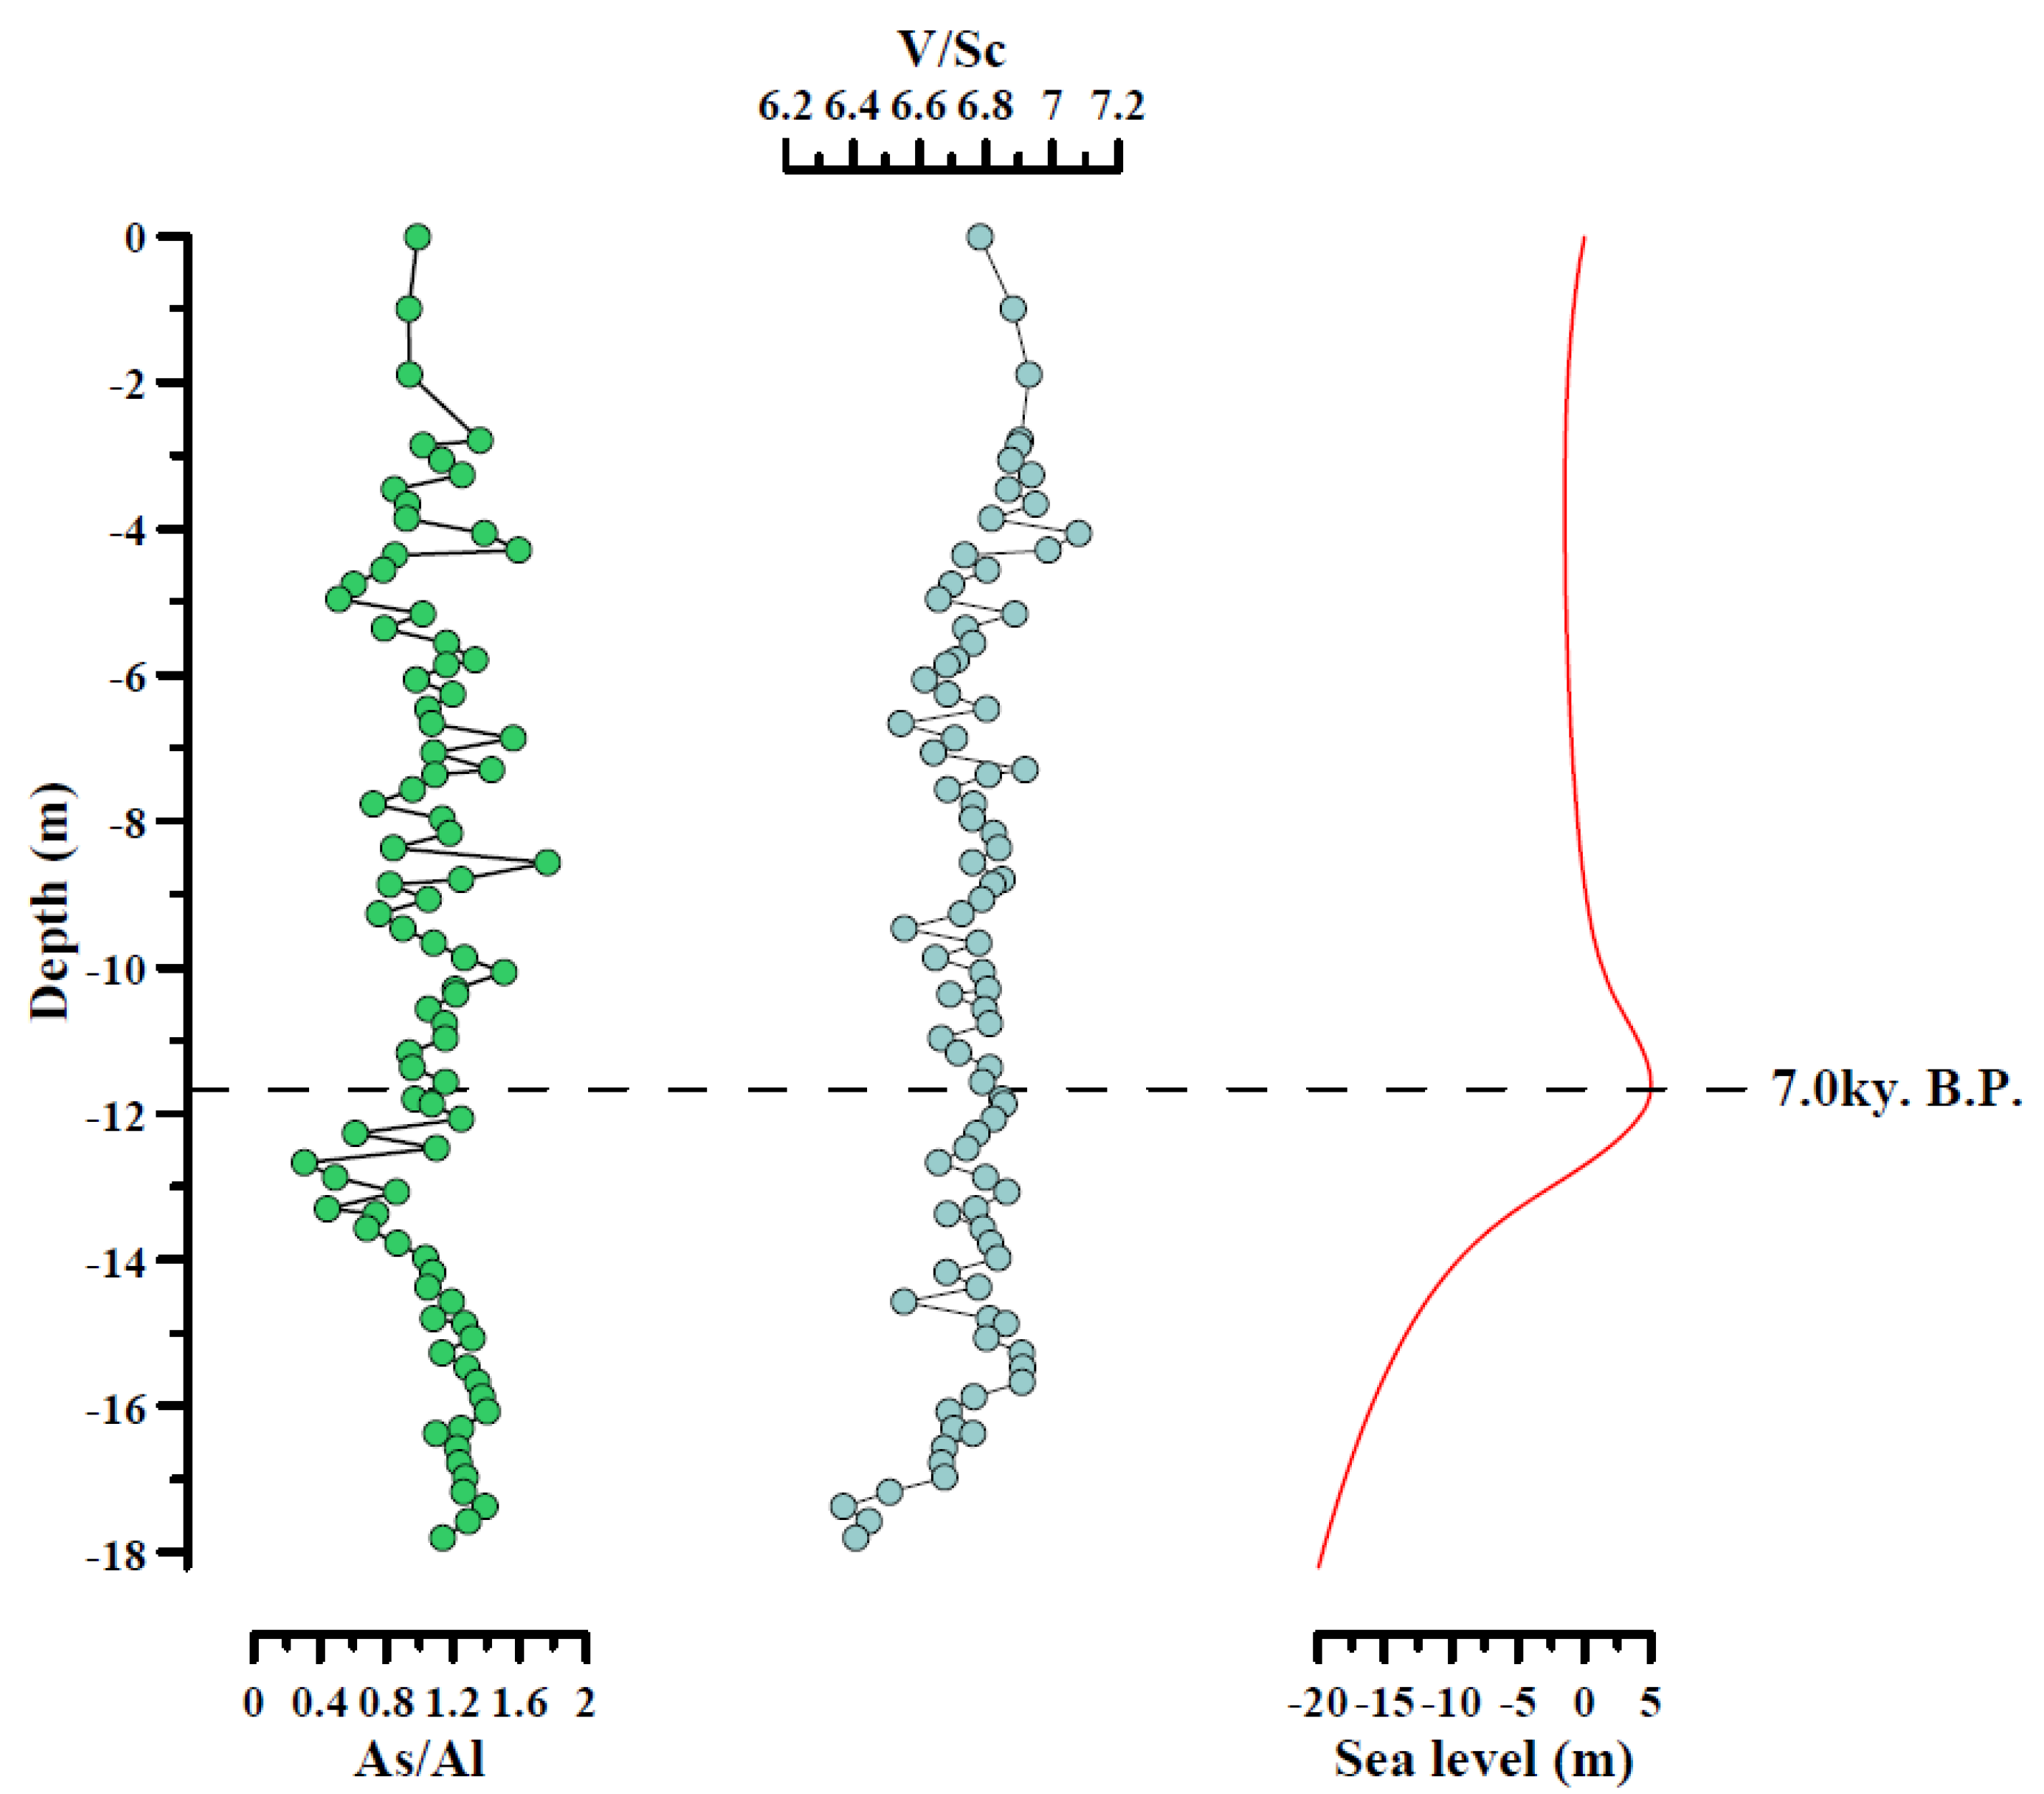
4.4. Paleo-Redox Evolution of Sedimentary Environment

V, Mo, Ni, Co, and As are often called redox sensitive elements (RSM) because of their significant chemical behavior difference in the redox environment, which has been widely used to identify paleo-redox environments [44,45,46]. In the oxidizing sedimentary environment, As often exists in negatively charged arsenate, which is easy to be adsorbed by Fe oxides and precipitated in sediments. In a low oxygen environment, arsenate is often reduced to arsenite which is more soluble in water. In a strong reducing environment (H2S containing environment), arsenite would be transformed into insoluble arsenic sulfide, deposited in the sediment [47]. Therefore, in the oxidizing environment, the stronger the oxidation, the higher the As content in the sediment. Here, we choose the value of As/Al as an alternative indicator of the paleo-redox environment excluding the influence of terrigenous sediment inputting.
V also exists in different valence states in different redox environments. In oxidizing water, V exists in the form of vanadate. In weakly reducing water, V is reduced from +5 valence to +4 valence vanadyl, which is easier to form a hydrate or complex with organic metal ligands and deposited. In the strong reducing environment, V changes from a +4 valence to +3 valence forming V2O3 or V(OH)3 directly and is preserved in the sediment [48,49,50]. Therefore, the stronger the oxidation of the sedimentary environment, the lower the V content in the sediment. Here, we also choose the value of V/Sc as an alternative indicator of the paleo-redox environment.
As can be seen from Figure 10, the value of As/Al and V/Sc changes oppositely. Before 7.0 ka B.P., As/Al and V/Sc changed relatively greater, presenting that the value of As/Al decreased wavily, and the value of V/Sc increased wavily. From 7.0 ka B.P. to now, both the values of As/Al and V/Sc fluctuated, but the changes were not obvious. Based on the current water depth (−12 m), the deposition rate, and sea level change since the Holocene, we argue that the core WH-05 was deposited in a shallow water environment. In other words, there was no strong reduction in the sedimentary environment since the Holocene, and the oxidation of the sedimentary environment increased and decreased with the change of water depth. Before 7.0 ka B.P., the sea level rose rapidly, about 25 m in 1500 years, much higher than the sedimentary thickness (less than 8 m) in this period, so the water depth at core WH-05 was gradually increasing, and the oxidation environment was gradually weakened. Since 7.0 ka B.P., the sea level decreased slightly. With the gradual accumulation of sediments, the water depth decreased gradually, and the oxidation environment increased slightly. Therefore, the change in redox is consistent with the change in sea level, the deposition rate, and sedimentary depth.

5. Conclusions

The subaqueous clinoform off the Shandong Peninsula is a typical geological body that records the marginal marine sedimentary evolution of the Yellow Sea since the Holocene. Based on the results of AMS 14C data, sediment grain size, and geochemistry, we discuss the deposition rate and provenance, and reveal the paleo-redox evolution of the clinoform. The dating results from core WH-05 show that sedimentation started at about 8.5 ka B.P., and the deposition rate decreased from the initial 28.37 m/ka to 0.52 m/ka. The core sediments can be divided into two types: sandy silt and silt, and the Mz ranged from 4.2 to 7.2Φ with an average value of 6.7Φ. The contents of major and trace elements in core WH-05 sediments are close to those in river sediments of China and Korea, and the Huanghe River sediment can be considered the main source of the clinoform. The North Shandong Peninsula Coastal Current was the main driving force for the sediments from the Huanghe River to the clinoform. By the analysis of element ratio indices and sea level change, we find that the development of the clinoform can be divided into two stages with a boundary of 7.0 ka B.P. The change in redox conditions is consistent with the change in sea level, the deposition rate, and sedimentary depth. Before 7.0 ka B.P., the sea level rose rapidly, and the oxidation environment was gradually weakened. From 7.0 ka B.P. to present, the sea level decreased slightly, and the oxidation environment increased slightly.

Author Contributions

Conceptualization, Y.Z. and L.Z.; Methodology, Y.Z. and Y.X.; Formal Analysis, Y.Z.; Investigation, Y.Z. and Y.X.; Resources, L.Z.; Data Curation, Y.Z.; Writing—Original Draft Preparation, Y.Z. and M.L.; Writing—Review and Editing, Y.Z., M.L. and Z.L.; Visualization, Y.Z., M.L. and Z.L.; Supervision, Y.Z.; Project Administration, L.Z.; Funding Acquisition, L.Z. All authors have read and agreed to the published version of the manuscript.

Funding

This research was funded by the National Natural Science Foundation of China, grant number 41776059.

Acknowledgments

We thank Rongrong Hao, Chaoran Lin, Xiaodong Yuan, and Bo Liu from the Ocean University of China for their assistance with the laboratory analyses.

Conflicts of Interest

The authors declare no conflict of interest.

References

  1. Scourse, J.D.; Austin, W.E.N. Quaternary shelf sea palaeoceanography: Recent developments in Europe. Mar. Geol. 2002, 191, 87–94. [Google Scholar] [CrossRef]
  2. Yang, S.Y.; Jung, H.S.; Lim, D.I.; Li, C.X. A review on the provenance discrimination of sediments in the Yellow Sea. Earth-Sci. Rev. 2003, 63, 93–120. [Google Scholar] [CrossRef]
  3. Lim, D.; Jung, H.S.; Choi, J.Y. REE partitioning in riverine sediments around the Yellow Sea and its importance in shelf sediment provenance. Mar. Geol. 2014, 357, 12–24. [Google Scholar] [CrossRef]
  4. Lim, D.; Kim, J.; Xu, Z.; Jung, H.; Yoo, D.-G.; Choi, M.; Kim, S.-Y. Quantitative reconstruction of Holocene sediment source variations in the Yellow and northern East China Seas and their forcings. Mar. Geol. 2020, 430, 106345. [Google Scholar] [CrossRef]
  5. Chappell, J.; Omura, A.; Esat, T.; McCulloch, M.; Pandolfi, J.; Ota, Y.; Pillans, B. Reconciliaion of late Quaternary sea levels derived from coral terraces at Huon Peninsula with deep sea oxygen isotope records. Earth Planet. Sci. Lett. 1996, 141, 227–236. [Google Scholar] [CrossRef]
  6. Chappell, J. Sea level changes forced ice breakouts in the Last Glacial cycle: New results from coral terraces. Quat. Sci. Rev. 2002, 21, 1229–1240. [Google Scholar] [CrossRef]
  7. Yokoyama, Y.; Lambeck, K.; De Deckker, P.; Johnston, P.; Fifield, L. Timing of the Last Glacial Maximum from observed sea-level minima. Nat. Cell Biol. 2000, 406, 713–716. [Google Scholar] [CrossRef]
  8. Bard, E.; Hamelin, B.; Fairbanks, R.G. U-Th ages obtained by mass spectrometry in corals from Barbados: Sea level during the past 130,000 years. Nat. Cell Biol. 1990, 346, 456–458. [Google Scholar] [CrossRef]
  9. Clark, P.U.; Mix, A.C. Ice sheets and sea level of the Last Glacial Maximum. Quat. Sci. Rev. 2002, 21, 1–7. [Google Scholar] [CrossRef]
  10. Xue, C.; Qin, Y.; Ye, S.; Laws, E.A.; Wang, Z. Evolution of Holocene ebb-tidal clinoform off the Shandong Peninsula on East China Sea shelf. Earth-Sci. Rev. 2018, 177, 478–496. [Google Scholar] [CrossRef]
  11. Fairbanks, R.G. A 17,000-year glacio-eustatic sea level record: Influence of glacial melting rates on the Younger Dryas event and deep-ocean circulation. Nature 1989, 342, 637–642. [Google Scholar] [CrossRef]
  12. Stanley, D.J.; Warne, A.G. Worldwide Initiation of Holocene Marine Deltas by Deceleration of Sea-Level Rise. Science 1994, 265, 228–231. [Google Scholar] [CrossRef]
  13. Nakada, M.; Lambeck, K. Late Pleistocene and Holocene sea-level change in the Australian region and mantle rheology. Geophys. J. Int. 1989, 96, 497–517. [Google Scholar] [CrossRef] [Green Version]
  14. Milliman, J.D.; Qin, Y.S.; Ren, M.E.; Saito, Y. Man’s Influence on the Erosion and Transport of Sediment by Asian Rivers: The Yellow River (Huanghe) Example. J. Geol. 1987, 95, 751–762. [Google Scholar] [CrossRef]
  15. Liu, J.; Saito, Y.; Kong, X.; Wang, H.; Zhao, L. Geochemical characteristics of sediment as indicators of post-glacial environmental changes off the Shandong Peninsula in the Yellow Sea. Cont. Shelf Res. 2009, 29, 846–855. [Google Scholar] [CrossRef]
  16. Yang, Z.S.; Liu, J.P. A unique Yellow River-derived distal subaqueous delta in the Yellow Sea. Mar. Geol. 2007, 240, 169–176. [Google Scholar] [CrossRef]
  17. Liu, P.; Kong, X.; Saito, Y.; Yang, Z.; Wen, C. Subaqueous deltaic formation of the Old Yellow River (AD 1128–1855) on the western South Yellow Sea. Mar. Geol. 2013, 344, 19–33. [Google Scholar] [CrossRef]
  18. Patruno, S.; Hampson, G.; Jackson, C.A.-L. Quantitative characterisation of deltaic and subaqueous clinoforms. Earth-Sci. Rev. 2015, 142, 79–119. [Google Scholar] [CrossRef] [Green Version]
  19. Li, Y.; Li, A.-C.; Huang, P.; Xu, F.-J.; Zheng, X.-F. Clay minerals in surface sediment of the north Yellow Sea and their implication to provenance and transportation. Cont. Shelf Res. 2014, 90, 33–40. [Google Scholar] [CrossRef]
  20. Lan, X.H.; Chen, X.H.; Mi, B.B.; Li, R.H.; Qin, Y.C.; Wang, Z.B. Distribution pattern and source of major and trace elements in the central North Yellow Sea since late Pleistocene. Mar. Geol. Quat. Geol. 2015, 35, 1–10. (In Chinese) [Google Scholar]
  21. Fang, H.C.; Huang, P.; Zhou, Y.; Zhang, J.; Li, A.C.; Yan, J.S. Distribution and controlling factors of the major elements in surface sediments of the North Yellow Sea. Mar. Sci. 2015, 39, 108–116. (In Chinese) [Google Scholar]
  22. McManus, J.; Berelson, W.M.; Klinkhammer, G.P.; Johnson, K.; Coale, K.H.; Anderson, R.; Kumar, N.; Burdige, D.; Hammond, D.; Brumsack, H.J.; et al. Geochemistry of barium in marine sediments: Implications for its use as a paleoproxy. Geochim. et Cosmochim. Acta 1998, 62, 3453–3473. [Google Scholar] [CrossRef]
  23. Folk, R.L.; Ward, A.W.C. Brazos River bar; a study in the significance of grain size parameters. Sediment. Res. 1957, 27, 3–26. [Google Scholar] [CrossRef]
  24. Chen, J.S.; Wang, F.; Li, X.; Song, J.J. Geographical variations of trace elements in sediments of the major rivers in eastern China. Environ. Earth Sci. 2000, 39, 1334–1340. [Google Scholar] [CrossRef]
  25. Yang, S.; Li, C.; Jung, H.; Lee, H. Discrimination of geochemical compositions between the Changjiang and the Huanghe sediments and its application for the identification of sediment source in the Jiangsu coastal plain, China. Mar. Geol. 2002, 186, 229–241. [Google Scholar] [CrossRef]
  26. Yang, S.Y.; Li, C.X.; Jung, H.S.; Lim, D.I.; Choi, M.S. Geochemistry of trace elements in Chinese and Korean River sediments. Mar. Geol. Quat. Geol. 2003, 23, 19–24. (In Chinese) [Google Scholar]
  27. Yang, S.Y.; Jung, H.S.; Li, C.X.; Lim, D.I. Major element geochemistry of sediments from Chinese and Korean Rivers. Geochimica 2004, 33, 99–105. (In Chinese) [Google Scholar]
  28. Nesbitt, H.; Markovics, G.; Price, R. Chemical processes affecting alkalis and alkaline earths during continental weathering. Geochim. et Cosmochim. Acta 1980, 44, 1659–1666. [Google Scholar] [CrossRef]
  29. Nesbitt, H.W.; Young, G.M. Early Proterozoic climates and plate motions inferred from major element chemistry of lutites. Nat. Cell Biol. 1982, 299, 715–717. [Google Scholar] [CrossRef]
  30. Nesbitt, H.W.; Fedo, C.; Young, G.M. Quartz and Feldspar Stability, Steady and Non-Steady-State Weathering, and Petrogenesis of Siliciclastic Sands and Muds. J. Geol. 1997, 105, 173–192. [Google Scholar] [CrossRef]
  31. Gyana, R.T.; Sunil, K.S.; Ramaswamy, V. Major and trace element geochemistry of Bay of Bengal sediments: Implications to provenances and their controlling factors. Palaeogeogr. Palaeocl. 2014, 397, 20–30. [Google Scholar]
  32. Cheng, P. Sediment characteristics and transport processes of fine-grained material over the Northern Yellow Sea. Ph.D. Thesis, Institute of Oceanology, Qingdao, China, 2000. [Google Scholar]
  33. Wang, H.; Yang, Z.; Saito, Y.; Liu, P.; Sun, X.; Wang, Y. Stepwise decreases of the Huanghe (Yellow River) sediment load (1950–2005): Impacts of climate change and human activities. Glob. Planet. Chang. 2007, 57, 331–354. [Google Scholar] [CrossRef]
  34. Li, J.; Liu, S.; Feng, X.; Sun, X.; Shi, X. Major and trace element geochemistry of the mid-Bay of Bengal surface sediments: Implications for provenance. Acta Oceanol. Sin. 2017, 36, 82–90. [Google Scholar] [CrossRef]
  35. Sun, X.; Liu, S.; Li, J.; Zhang, H.; Zhu, A.; Cao, P.; Chen, M.-T.; Zhao, G.; Khokiattiwong, S.; Kornkanitnan, N.; et al. Major and trace element compositions of surface sediments from the lower Bengal Fan: Implications for provenance discrimination and sedimentary environment. J. Asian Earth Sci. 2019, 184, 104000. [Google Scholar] [CrossRef]
  36. Li, J.; Gao, J.; Li, J.; Wang, Z.; Yan, J.; Bai, F.; Cheng, Y. Distribution and controlling factors of major elements in sediments of the yalu river estuary. Mar. Geol. Quat. Geol. 2010, 30, 25–32. [Google Scholar] [CrossRef]
  37. Xu, L.-L.; Wu, D.-X.; Lin, X.-P.; Ma, C. The Study of the Yellow Sea Warm Current and Its Seasonal Variability. J. Hydrodyn. 2009, 21, 159–165. [Google Scholar] [CrossRef]
  38. Teague, W.J.; Jacobs, G.A. Current observations on the development of the Yellow Sea Warm Current. J. Geophys. Res. Space Phys. 2000, 105, 3401–3411. [Google Scholar] [CrossRef]
  39. Bao, X.W.; Li, N.; Yao, Z.G.; Wu, D.X. Seasonal variation characteristics of temperature and salinity of the north Yellow Sea. Period. Ocean. Univ. China (Nat. Sci. Ed.) 2009, 39, 553–562. (In Chinese) [Google Scholar]
  40. Liu, J.P.; Milliman, J.D.; Gao, S. The Shandong mud wedge and post-glacial sediment accumulation in the Yellow Sea. Geo-Marine Lett. 2001, 21, 212–218. [Google Scholar] [CrossRef]
  41. Yu, F.; Zhang, Z.; Diao, X.; Guo, J. Observational evidence of the Yellow Sea warm current. Chin. J. Oceanol. Limnol. 2010, 28, 677–683. [Google Scholar] [CrossRef]
  42. Bi, N.; Yang, Z.; Wang, H.; Fan, D.; Sun, X.; Lei, K. Seasonal variation of suspended-sediment transport through the southern Bohai Strait. Estuar. Coast. Shelf Sci. 2011, 93, 239–247. [Google Scholar] [CrossRef]
  43. Gao, S.; Park, Y.; Zhao, Y.; Qin, Y. Transport and resuspension of fine-grained sediments over the southeastern Yellow Sea. In Proceedings of the Korean-China international seminar on Holocene and late Pleistocene environments in the Yellow Sea Basin, Seoul, Korea, 20–22 November 1996; pp. 83–98. [Google Scholar]
  44. Zou, J.J.; Shi, X.F.; Liu, Y.G.; Liu, J.H. The geochemical records of paleoproductivity and paleoredox in the Sea of Japan since 48 ka. Acta Oceanol. Sin. 2010, 32, 98–109. (In Chinese) [Google Scholar]
  45. Zhao, X.K. Geochemical characteristics of black shale and paleoceanic implications of Niutitang Formation of Early Cambrian, Guizhou and Hunan Province. Master’s Thesis, China University of Geosciences (Beijing), Beijing, China, 2015. (In Chinese). [Google Scholar]
  46. Chen, W. Paleoenvironmental implication indicated by trace elements of the Ostracod shell for upper-middle section of Shangganchaigou Formation in the western Qaidam Basin. Master’s Thesis, Lanzhou University, Lanzhou, China, 2019. (In Chinese). [Google Scholar]
  47. Chaillou, G.; Schäfer, J.; Anschutz, P.; Lavaux, G.; Blanc, G. The behaviour of arsenic in muddy sediments of the Bay of Biscay (France). Geochim. et Cosmochim. Acta 2003, 67, 2993–3003. [Google Scholar] [CrossRef]
  48. Breit, G.N.; Wanty, R.B. Vanadium accumulation in carbonaceous rocks: A review of geochemical controls during deposition and diagenesis. Chem. Geol. 1991, 91, 83–97. [Google Scholar] [CrossRef]
  49. Tian, W.; Wang, C.S.; Bai, Y.S.; Li, P.J. Shale geochemical characteristics and enrichment mechanism of organic matter of the upper Devonian Shetianqiao sormation shale in Lianyuan Sag, Central Hunan. Earth Sci. 2019, 44, 3794–3811. (In Chinese) [Google Scholar]
  50. Xu, S.M.; Zhai, S.K.; Zhang, A.B.; Zhang, X.D.; Zhang, H.J. Distribution and environment significance of redox sensitive trace elements of the Changjiang Estuary Hypoxia Zone and its contiguous sea area. Acta Sediment. Sin. 2007, 25, 759–766. (In Chinese) [Google Scholar]
Figure 1. Winter circulation and location of the subaqueous clinoform off Shandong Peninsula and core WH-05 (modified from [16]). NSCC = North Shandong Peninsula Coastal Current, SLCC = South Liaoning Coastal Current, KCC = Korean Peninsula Coastal Current, SBCC = South Bohai Coastal Current, SSCC = South Shandong Peninsula Coastal Current, SYS = South Yellow Sea, NJCC = North Jiangsu Coastal Current, YSWC = Yellow Sea Warm Current, YSCW = Yellow Sea Cold Water, B.S. = Bohai Strait.
Minerals 11 01209 g001
Figure 2. Location of ancient shorelines since 12 ka B.P. in the Bohai Sea and North Yellow Sea [10].
Minerals 11 01209 g002
Figure 3. Photos of core WH-05.
Minerals 11 01209 g003
Figure 4. Age framework and deposition rate of Core WH-05.
Minerals 11 01209 g004
Figure 5. Grainsize classification.
Minerals 11 01209 g005
Figure 6. Vertical distribution characteristics of sediment grain size from Core WH-05.
Minerals 11 01209 g006
Figure 7. Vertical distribution of major and trace elements in sediments of Core WH-05.
Minerals 11 01209 g007
Figure 8. Correlation between Rb/Sc, Co/Sc, Fe/Sc, Mg/Sc, and Mz.
Minerals 11 01209 g008
Figure 9. Rb/Sc-Co/Sc and Fe/Sc-Mg/Sc scatter diagrams of sediments from core WH-05 and surrounding rivers. Note: The data of Changjiang, Huanghe, Keum, and Yeongsan rivers are from [26,27]; and those of Yalu River are from [2,24,25]. T1: samples in 0~−17.8 m of Core WH-05; T2: samples in−17.8~−18.2 m of Core WH-05.
Minerals 11 01209 g009
Figure 10. The vertical distribution of geochemical index of As/Al and V/Sc.
Minerals 11 01209 g010
Table 1. Age framework and deposition rate list.
Code Numbers (Beta)Sample Depth (m)MaterialsAMS14C Age
(a)
Calendar Age
(a)
Deposition Rate (m/ka)
551445−1.38~−1.43Benthic foraminifera2920 ± 30 B.P.27020.52
551446−8.74~−8.79Benthic foraminifera5550 ± 30 B.P.59402.27
551447−12.92~−12.97Benthic foraminifera7000 ± 30 B.P.74932.69
551448−15.28~−15.33Benthic foraminifera7910 ± 30 B.P.83722.68
551449−17.72~−17.77Benthic foraminifera8000 ± 30 B.P.845828.37
Table 2. Statistical table of grain size parameters and fraction content of sediments of Core WH-05 (n = 89).
Content of Each Fraction (%)Grain Size Parameters
ClaySiltSandMz (%)δSkKu
Max30.293.742.57.23.62.42.7
Min3.753.90.04.21.3−4.01.2
Ave16.182.71.26.71.8−1.91.6
STD6.16.45.00.40.40.80.4
C. V. (%)37.77.7413.25.920.6−44.122.0
Note: Ave: Average; STD: standard deviation; C. V.: coefficient of variation.
Table 3. Comparison of element composition between the Core sediments and river sediments.
ElementsCore SedimentsRiver
Max.Min.AverageSTDC. V. (%)ChangjiangHuangheKeumYeongsanYalu
Al *7.25.96.60.34.97.25.36.57.27.2
Ca *3.20.62.80.620.03.33.70.60.52.3
Fe *4.62.23.70.512.34.32.23.43.85.9
K *3.02.22.50.26.12.11.82.12.32.9
Mg *1.90.61.60.316.61.71.00.91.11.7
Na *2.01.51.70.14.60.91.71.31.11.0
Ti4362.42249.43985.2376.39.45889.03138.03933.04546.04445.0
P651.3244.1579.483.114.4785.0572.0597.0449.0---
Mn1223.0227.8585.0131.222.4956.0451.0586.0526.0---
Ba1210.0405.3481.7158.332.9473.0498.0492.0385.0---
Li60.827.450.36.813.545.021.235.169.6---
V109.247.891.513.014.2105.550.864.286.7---
Cr84.432.174.410.213.674.342.344.752.044.6
Co17.78.614.81.812.017.38.714.715.724.5
Ni47.018.634.64.914.040.719.326.132.840.2
Cu34.211.227.45.219.150.714.227.320.442.3
Zn92.236.678.811.714.8106.533.973.576.6231.0
Sr257.6180.0200.214.97.5146.7218.7148.7119.0---
Nb16.39.315.21.06.717.510.116.918.0---
Pb29.518.823.62.510.438.517.736.726.840.0
Sc15.86.613.51.914.213.87.69.013.58.7
Rb142.298.7126.411.28.9114.976.9131.7153.4127.6
Th15.87.613.81.712.013.48.716.116.3---
CIA*(T1)71.969.470.50.60.878.469.274.176.273.7
CIA*(T2)67.165.666.60.50.8
Note: *: unit in wt.%, others in μg/g. The data of Changjiang, Huanghe, Keum, and Yeongsan rivers are from [26,27]; and those of Yalu River are from [2,24,25]. “---” means no data.
Table 4. Correlation coefficient between the element contents and Grain size parameter (n = 89).
MzClaySiltSandAlCaFeKMgNaTiPMnBaLiVCrCoNiCuZnSrNbPbRbScTh
Mz1.00
Clay0.711.00
Silt−0.02−0.681.00
Sand−0.84−0.34−0.461.00
Al0.08−0.420.52−0.151.00
Ca0.510.310.10−0.500.211.00
Fe0.32−0.180.46−0.370.860.631.00
K−0.35−0.540.280.300.53−0.660.081.00
Mg0.420.010.34−0.450.650.840.92−0.231.00
Na−0.24−0.210.040.200.05−0.41−0.180.34−0.251.00
Ti0.440.150.19−0.430.480.880.80−0.460.93−0.251.00
P0.500.210.18−0.480.390.940.75−0.500.93−0.340.951.00
Mn0.31−0.090.33−0.320.680.600.890.000.81−0.250.690.691.00
Ba−0.50−0.30−0.100.50−0.22−0.96−0.640.69−0.860.34−0.92−0.95−0.591.00
Li0.30−0.180.43−0.330.870.610.980.110.92−0.120.800.750.83−0.621.00
V0.37−0.090.41−0.410.800.700.96−0.030.93−0.140.860.810.83−0.710.971.00
Cr0.39−0.010.33−0.410.700.780.92−0.190.95−0.190.920.870.79−0.790.930.971.00
Co0.31−0.160.41−0.340.810.650.970.050.92−0.160.810.780.88−0.660.980.970.931.00
Ni0.31−0.160.42−0.340.820.620.950.070.89−0.100.780.740.83−0.610.960.970.930.971.00
Cu0.31−0.190.47−0.380.860.600.970.100.88−0.100.770.710.83−0.590.970.970.930.960.961.00
Zn0.39−0.030.35−0.410.740.760.95−0.120.97−0.190.900.870.84−0.780.960.960.960.950.930.931.00
Sr−0.34−0.370.130.280.14−0.65−0.240.69−0.510.42−0.57−0.66−0.320.74−0.21−0.24−0.36−0.26−0.17−0.12−0.401.00
Nb0.340.070.20−0.340.520.810.79−0.380.88−0.170.950.880.67−0.860.810.870.910.830.810.780.89−0.451.00
Pb−0.15−0.540.460.060.79−0.260.500.760.190.270.03−0.090.400.260.520.430.300.450.490.560.330.540.101.00
Rb0.21−0.290.49−0.270.920.420.920.310.770.010.630.550.75−0.400.940.920.840.910.930.950.840.090.690.681.00
Sc0.32−0.140.42−0.370.820.670.960.010.92−0.100.850.790.82−0.680.980.990.970.970.970.980.96−0.210.860.460.941.00
Th0.32−0.090.37−0.360.750.730.94−0.130.93−0.200.890.830.80−0.750.930.950.960.910.900.930.95−0.340.870.380.850.951.00
Table 5. Results of factor analysis (n = 89).
ElementsFactor 1Factor 2ElementsFactor 1Factor 2
Fe0.9820.158Mg0.8620.478
Li0.9760.140Mn0.8420.208
Cu0.9590.135Nb0.7220.526
Rb0.951−0.076Ti0.7130.615
Co0.9480.202K0.244−0.922
Sc0.9450.225Ca0.5050.861
Al0.939−0.310Ba−0.510−0.828
Ni0.9390.166P0.6560.712
V0.9360.268Sr−0.121−0.706
Zn0.9090.356Pb0.618−0.667
Th0.8990.325Na−0.101−0.420
Cr0.8730.398
Variance (%)62.8924.25Variance (%)62.8924.25
Publisher’s Note: MDPI stays neutral with regard to jurisdictional claims in published maps and institutional affiliations.

