
An Integrated Imaging Study of the Pore Structure of the Cobourg Limestone—A Potential Nuclear Waste Host Rock in Canada

 , and
, and
Abstract
:1. Introduction
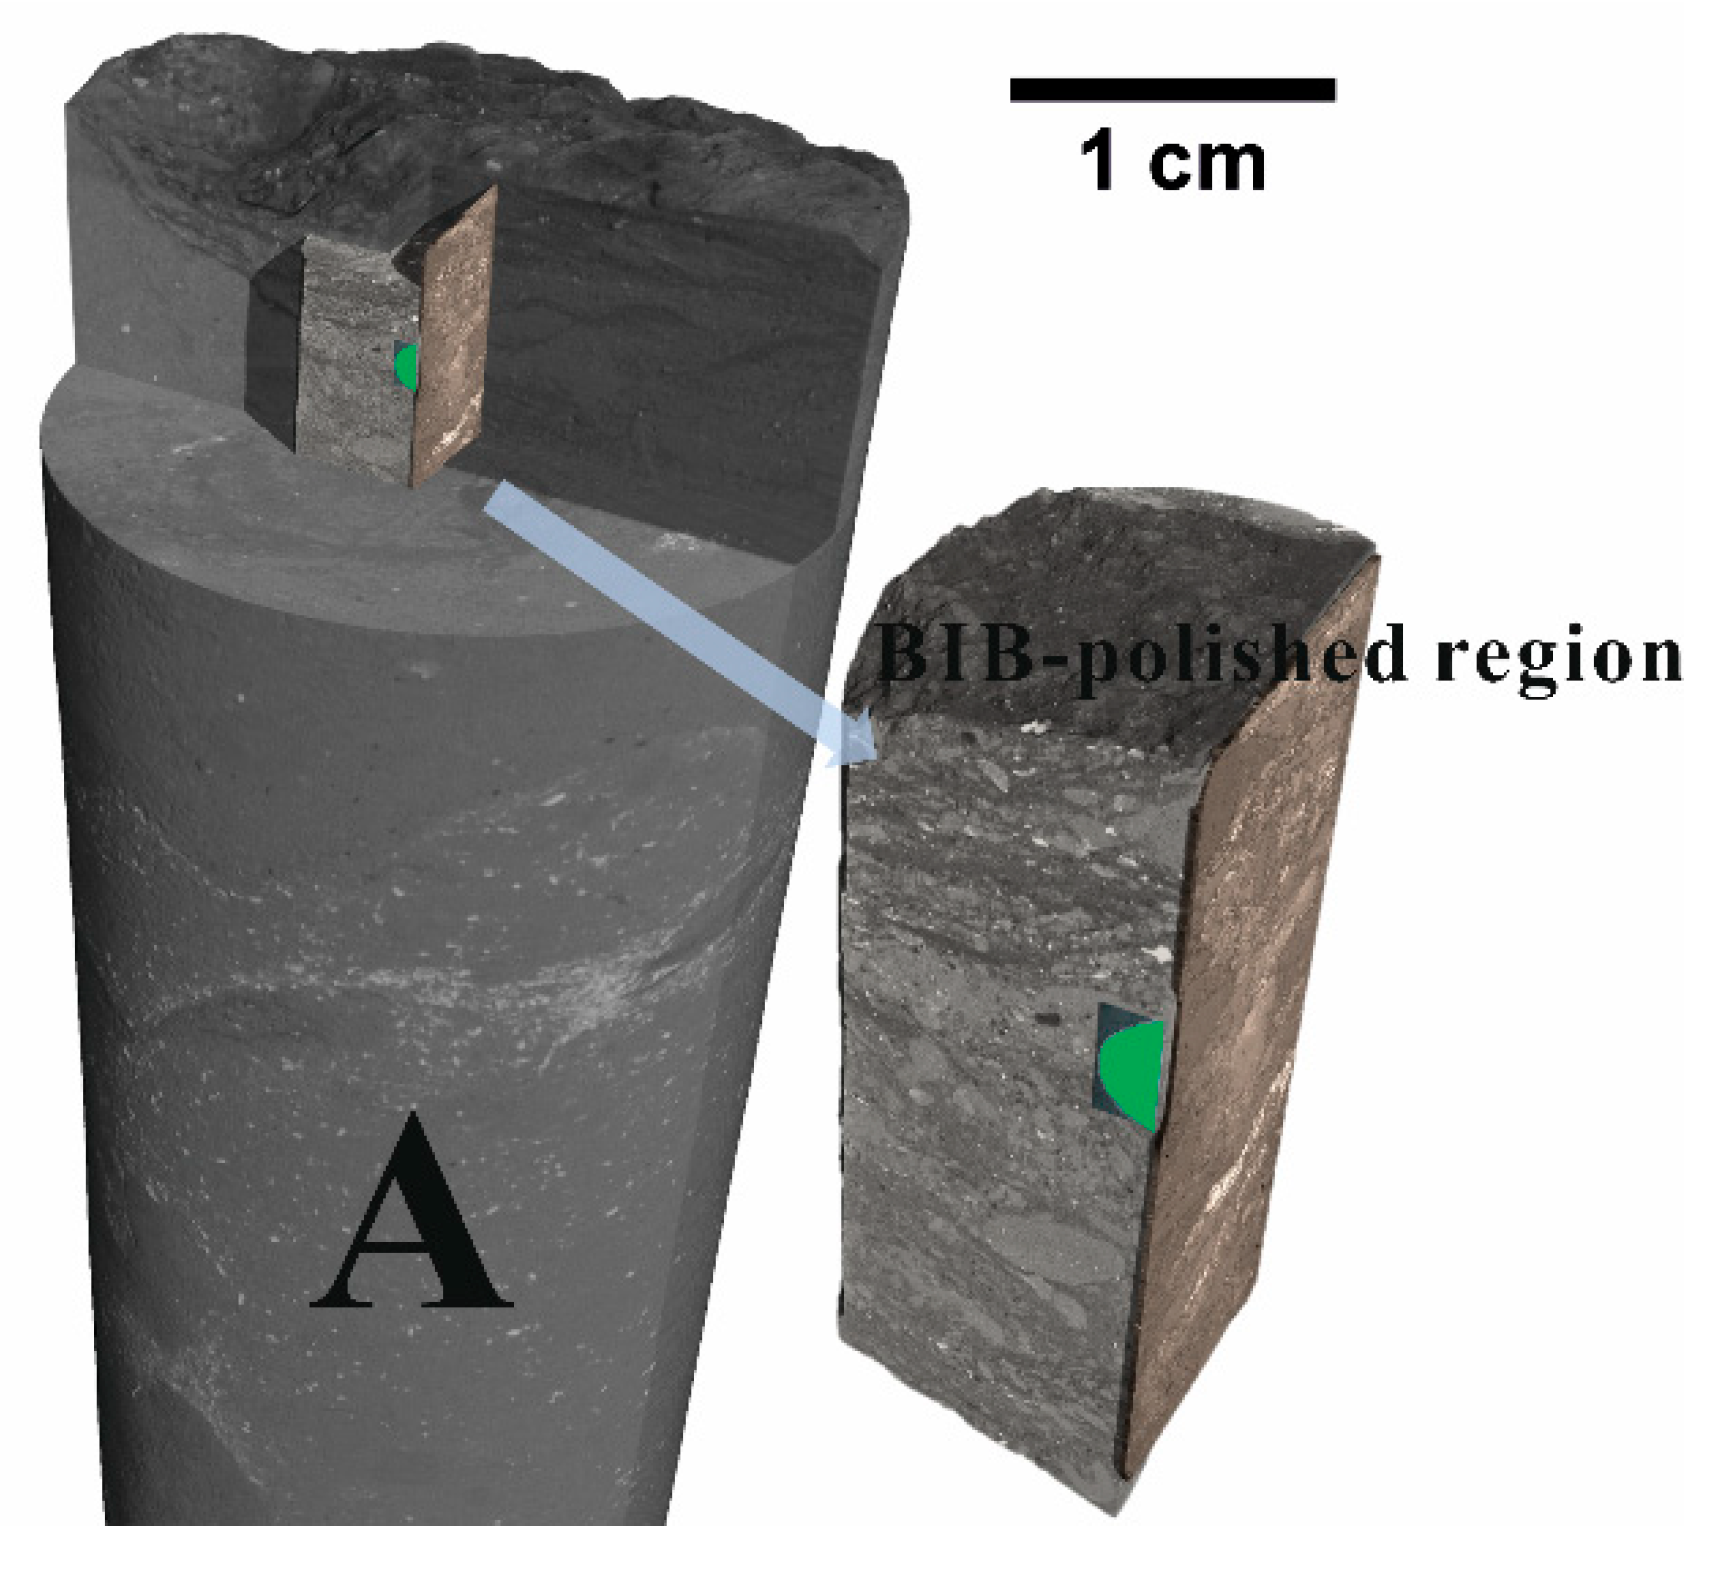
2. Samples
3. Imaging Experiments and Simulation
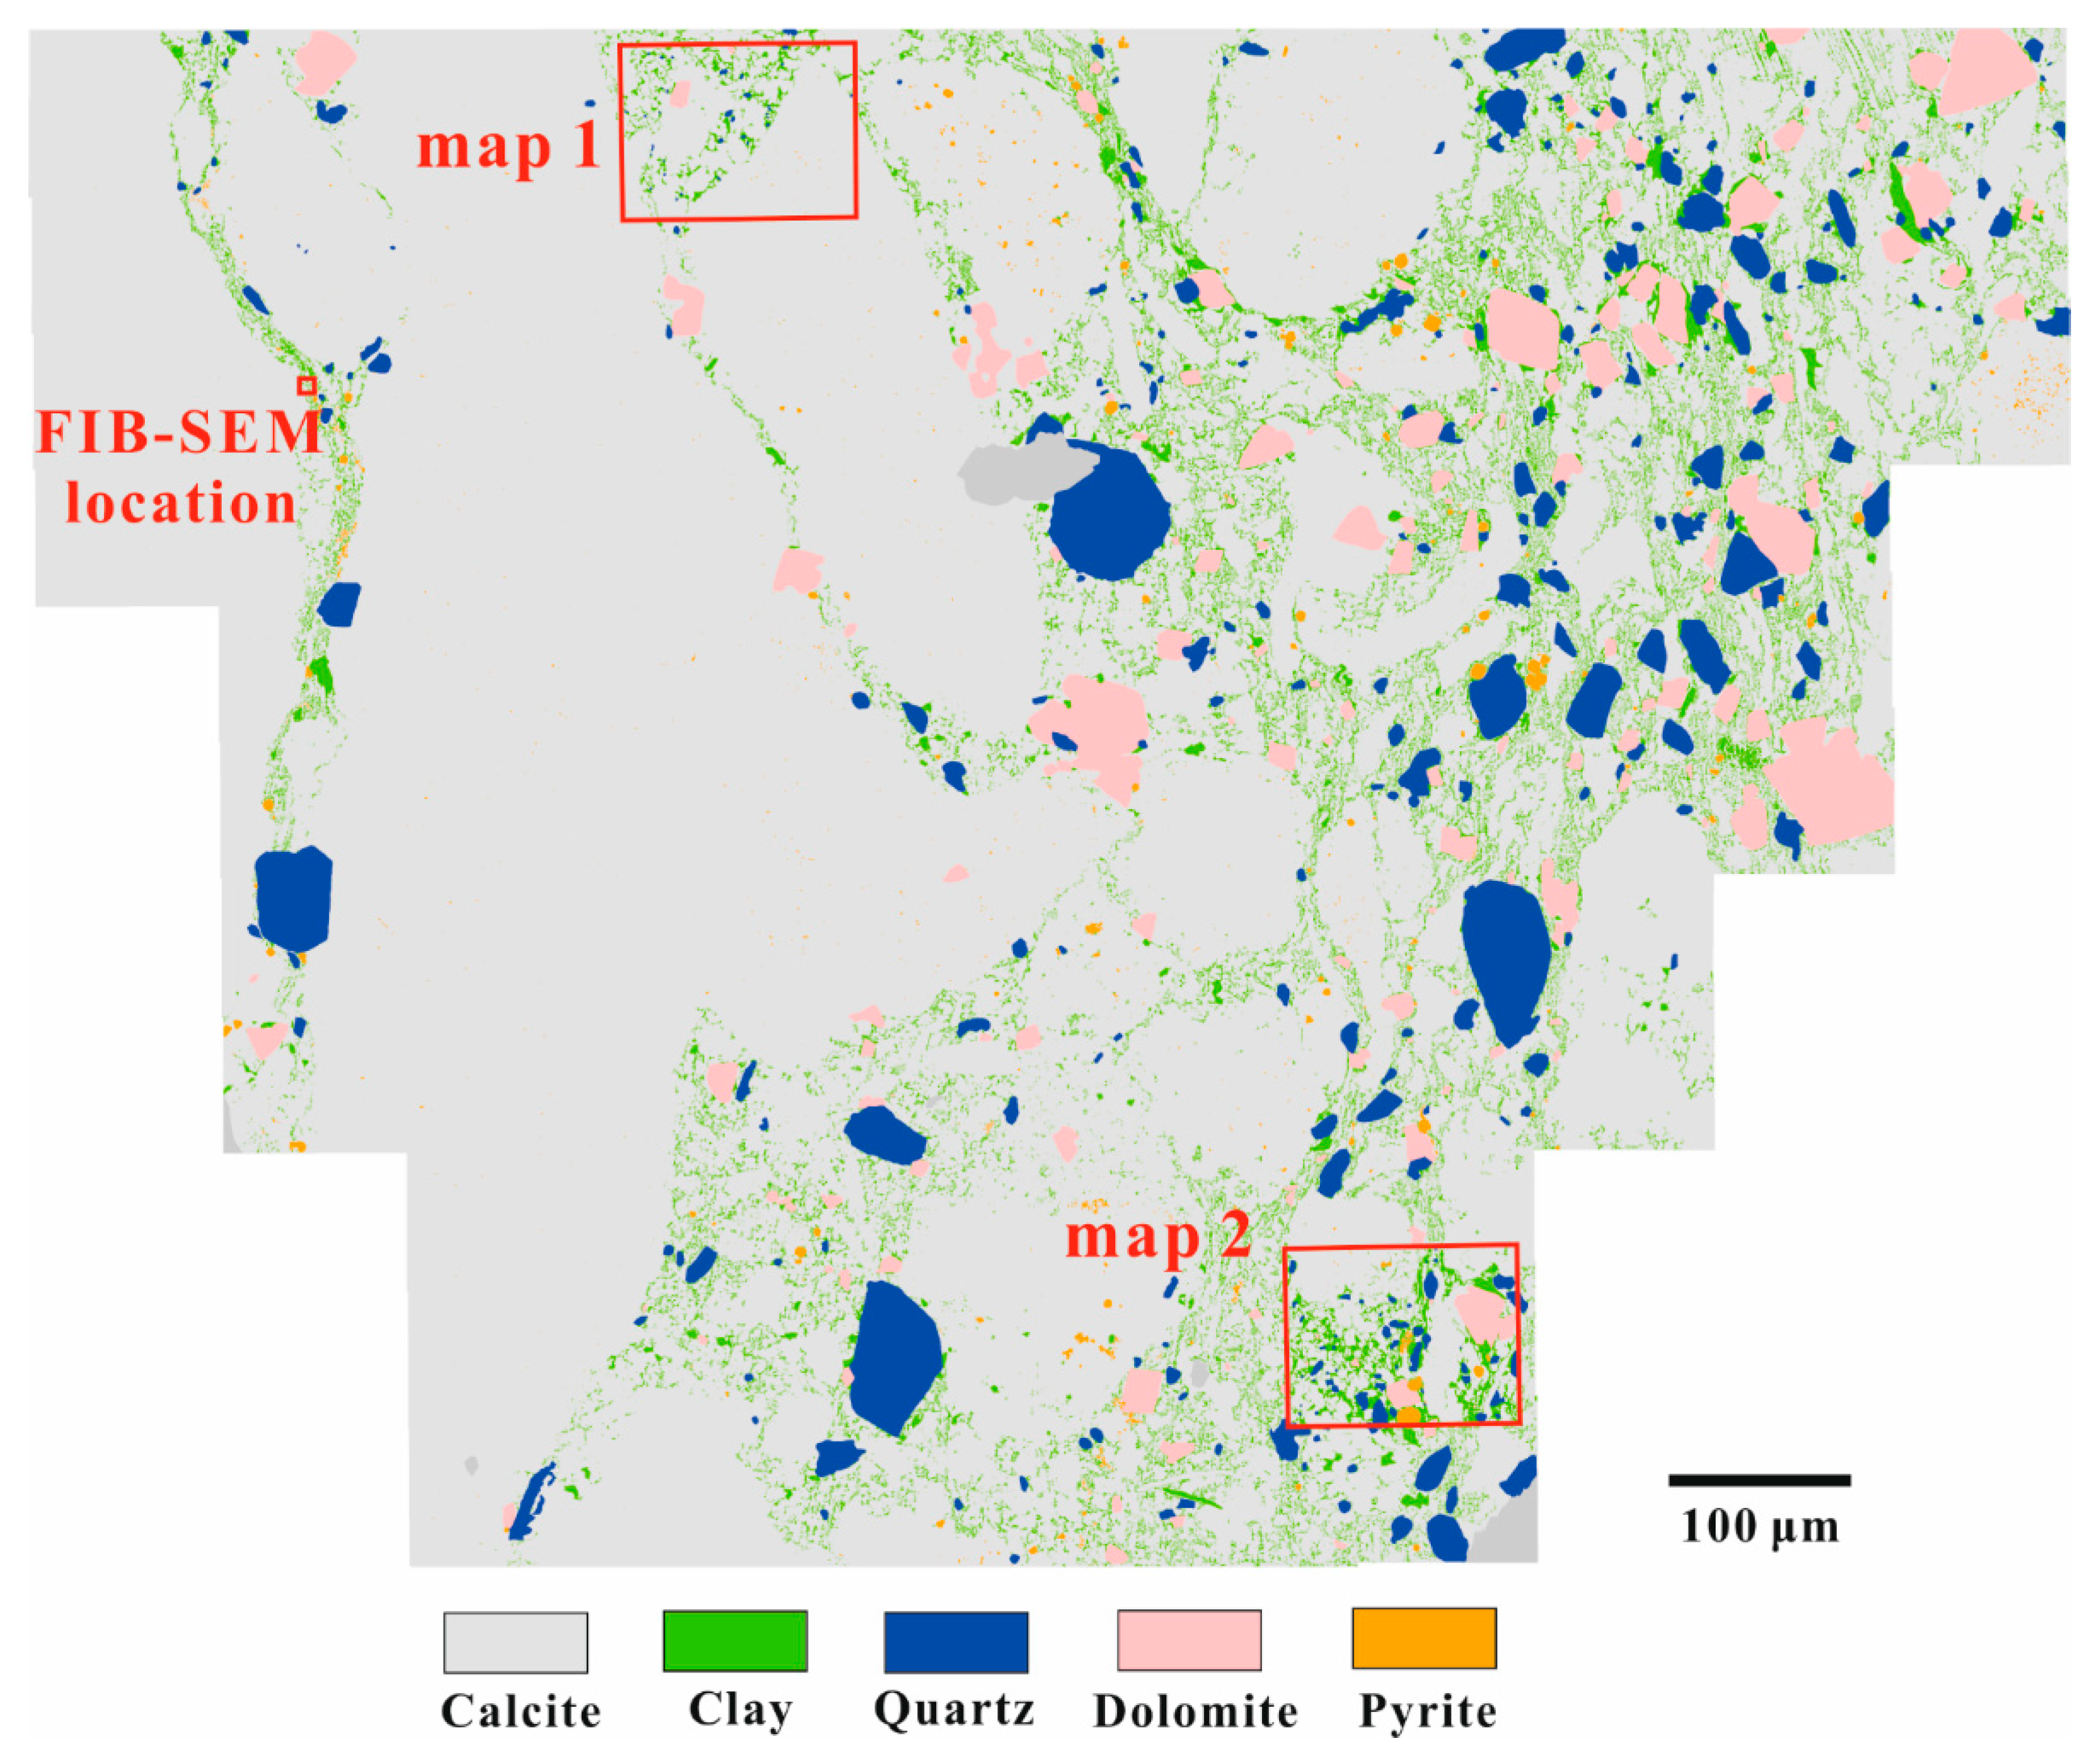
3.1. X-ray Micro-CT
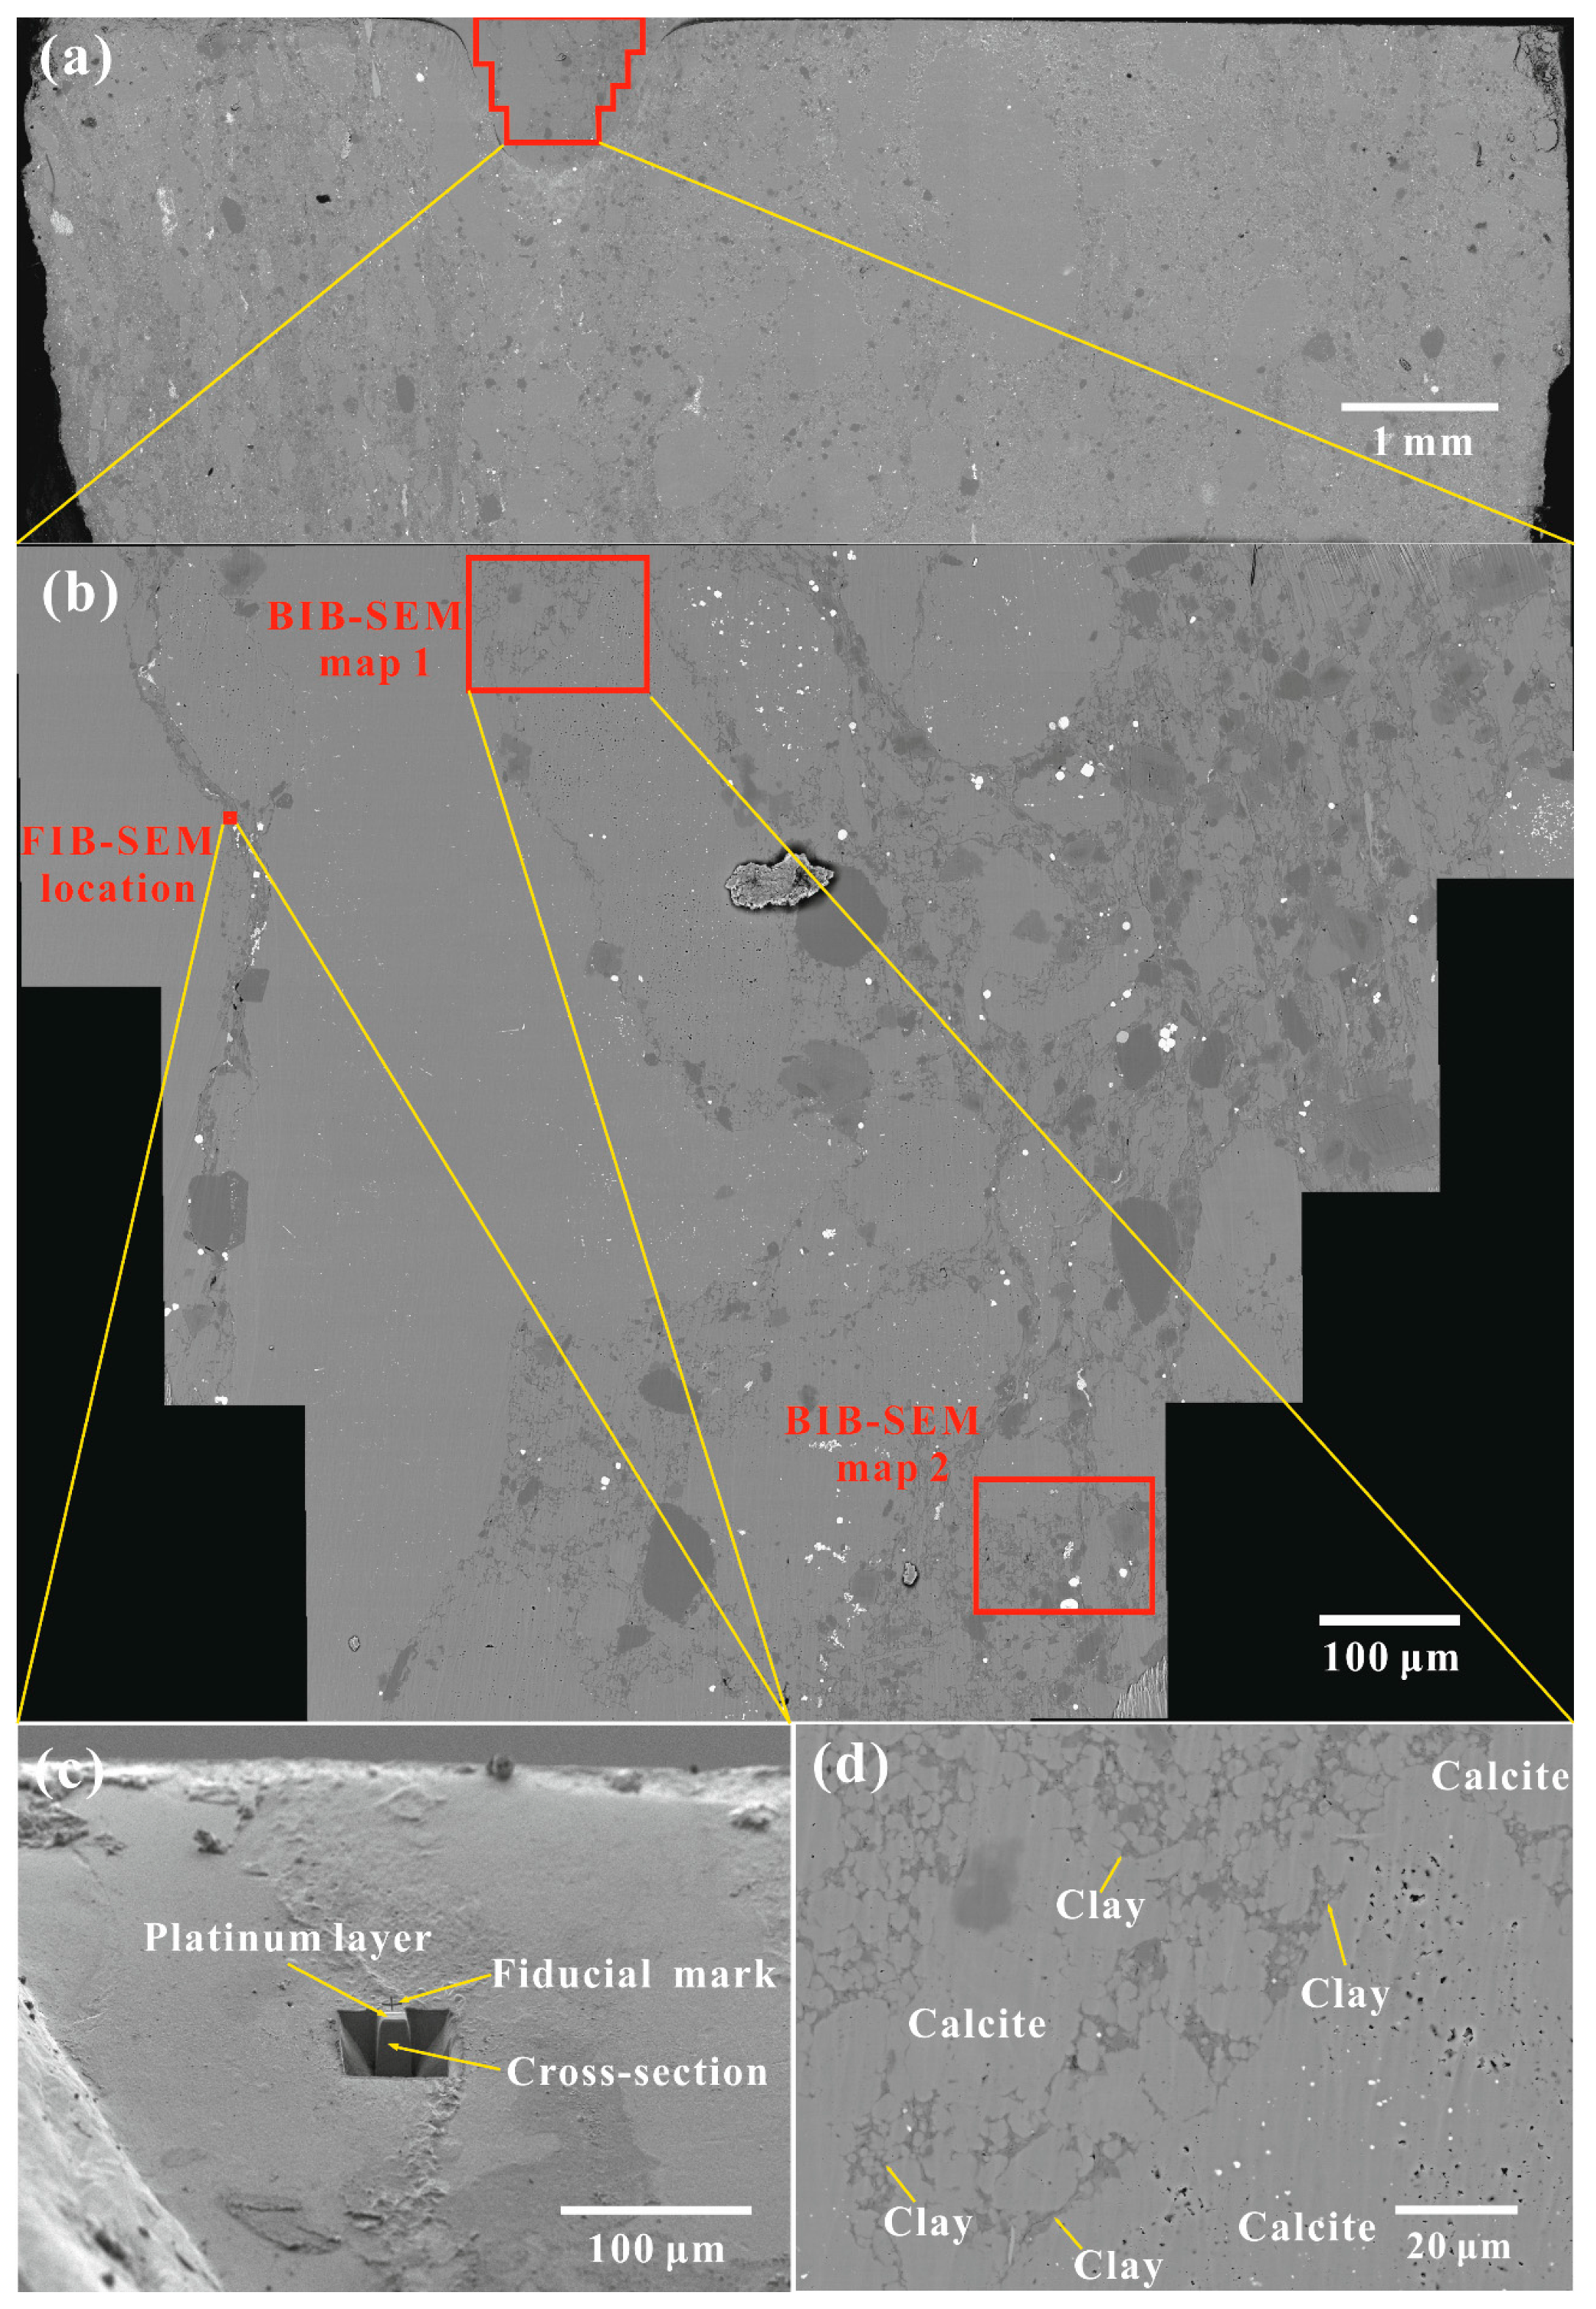
3.2. BIB-SEM
3.3. FIB-SEM
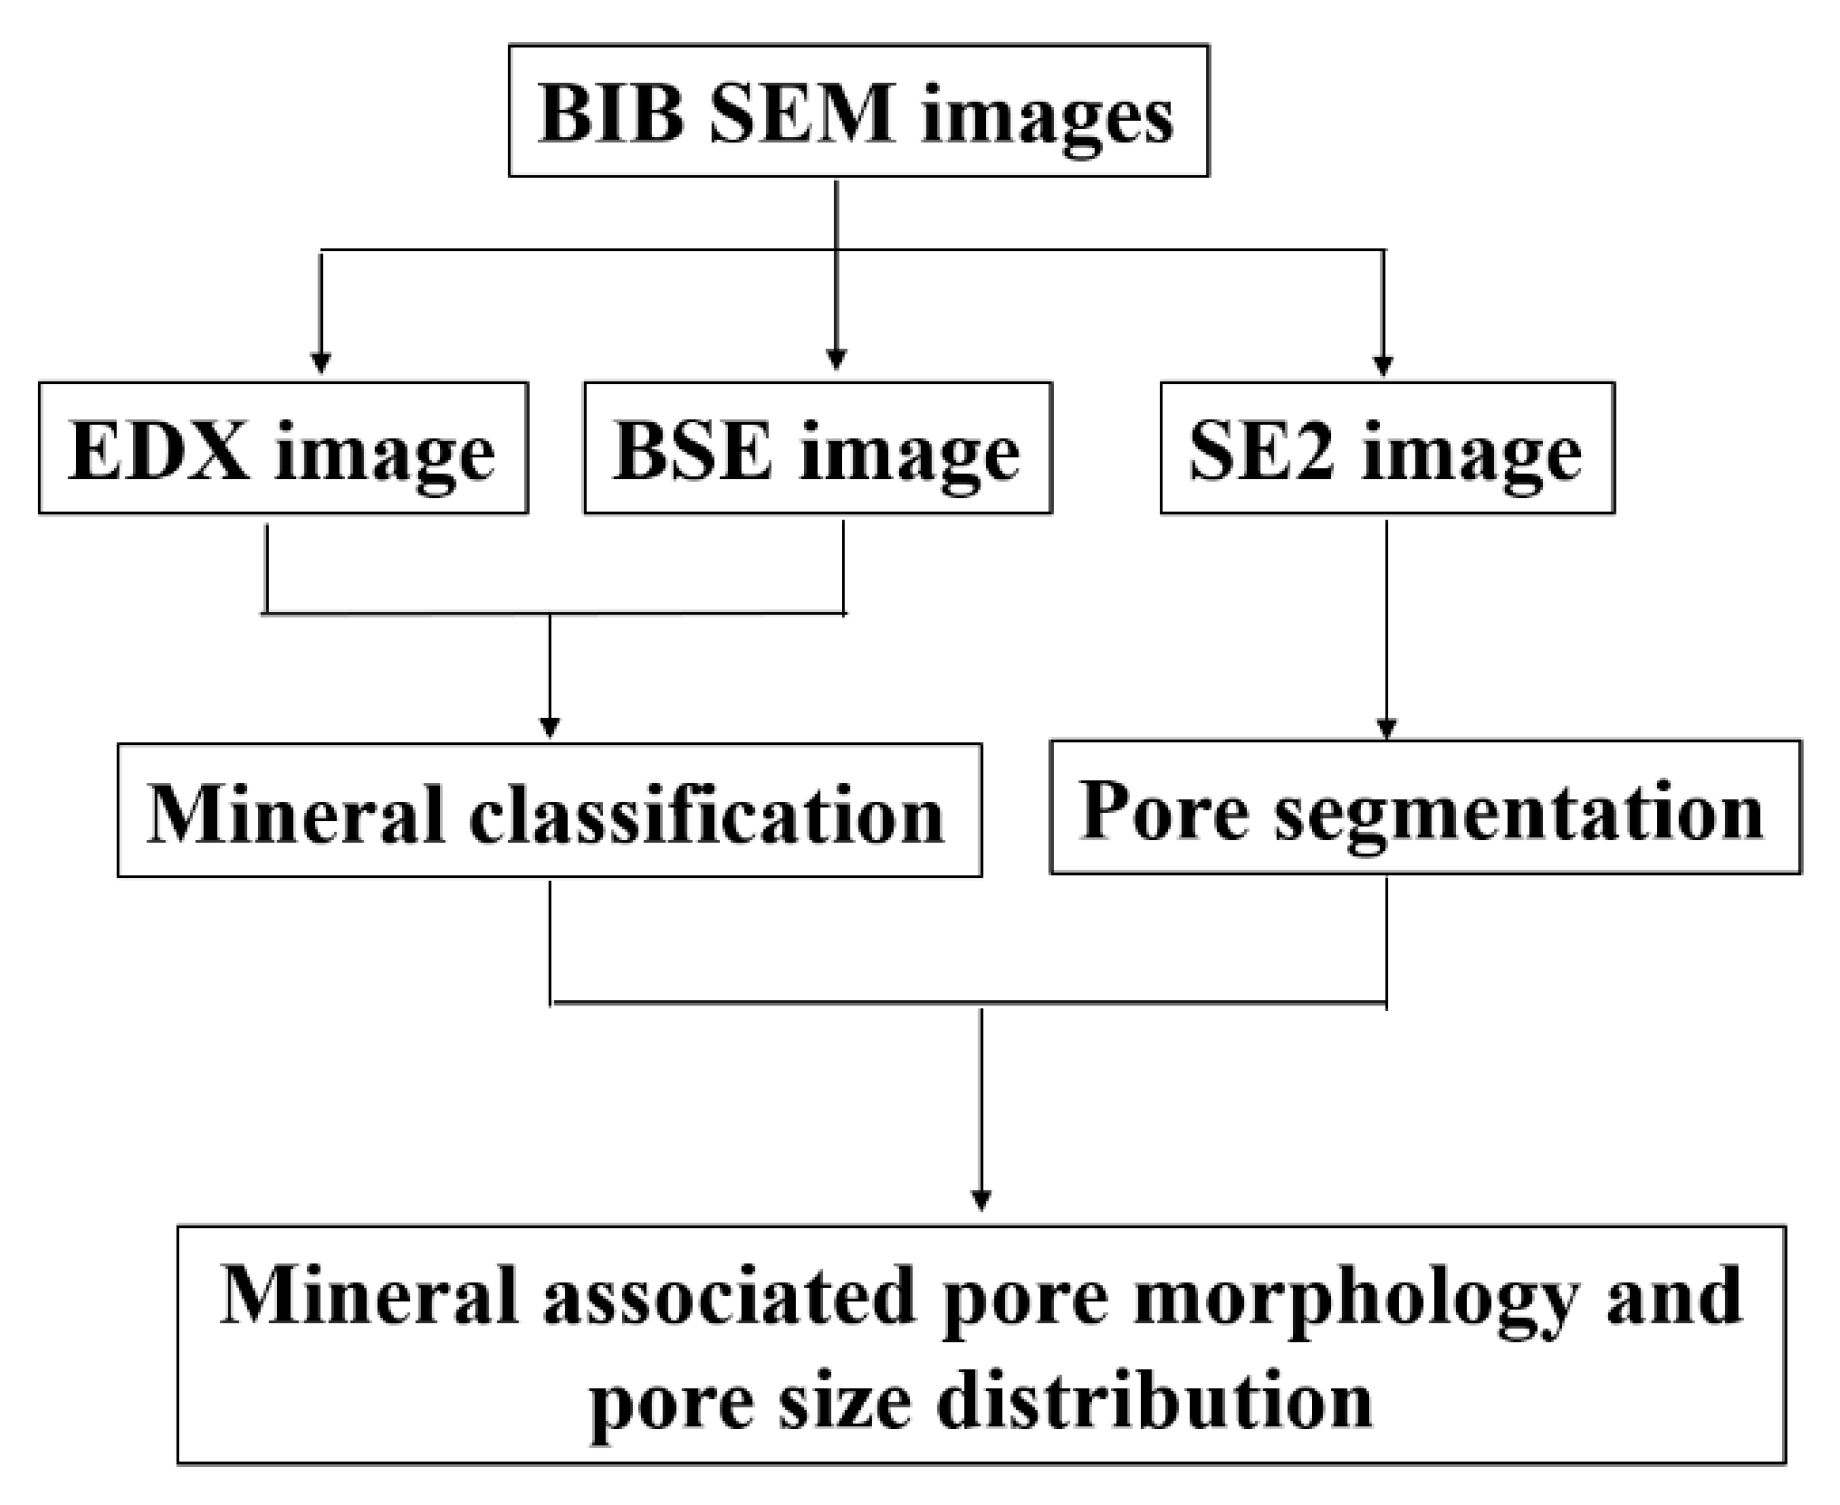
3.4. Image Analysis
3.5. Permeability Simulation
4. Results
4.1. X-ray Micro-CT Image Analysis
4.2. BIB-SEM Image Analysis
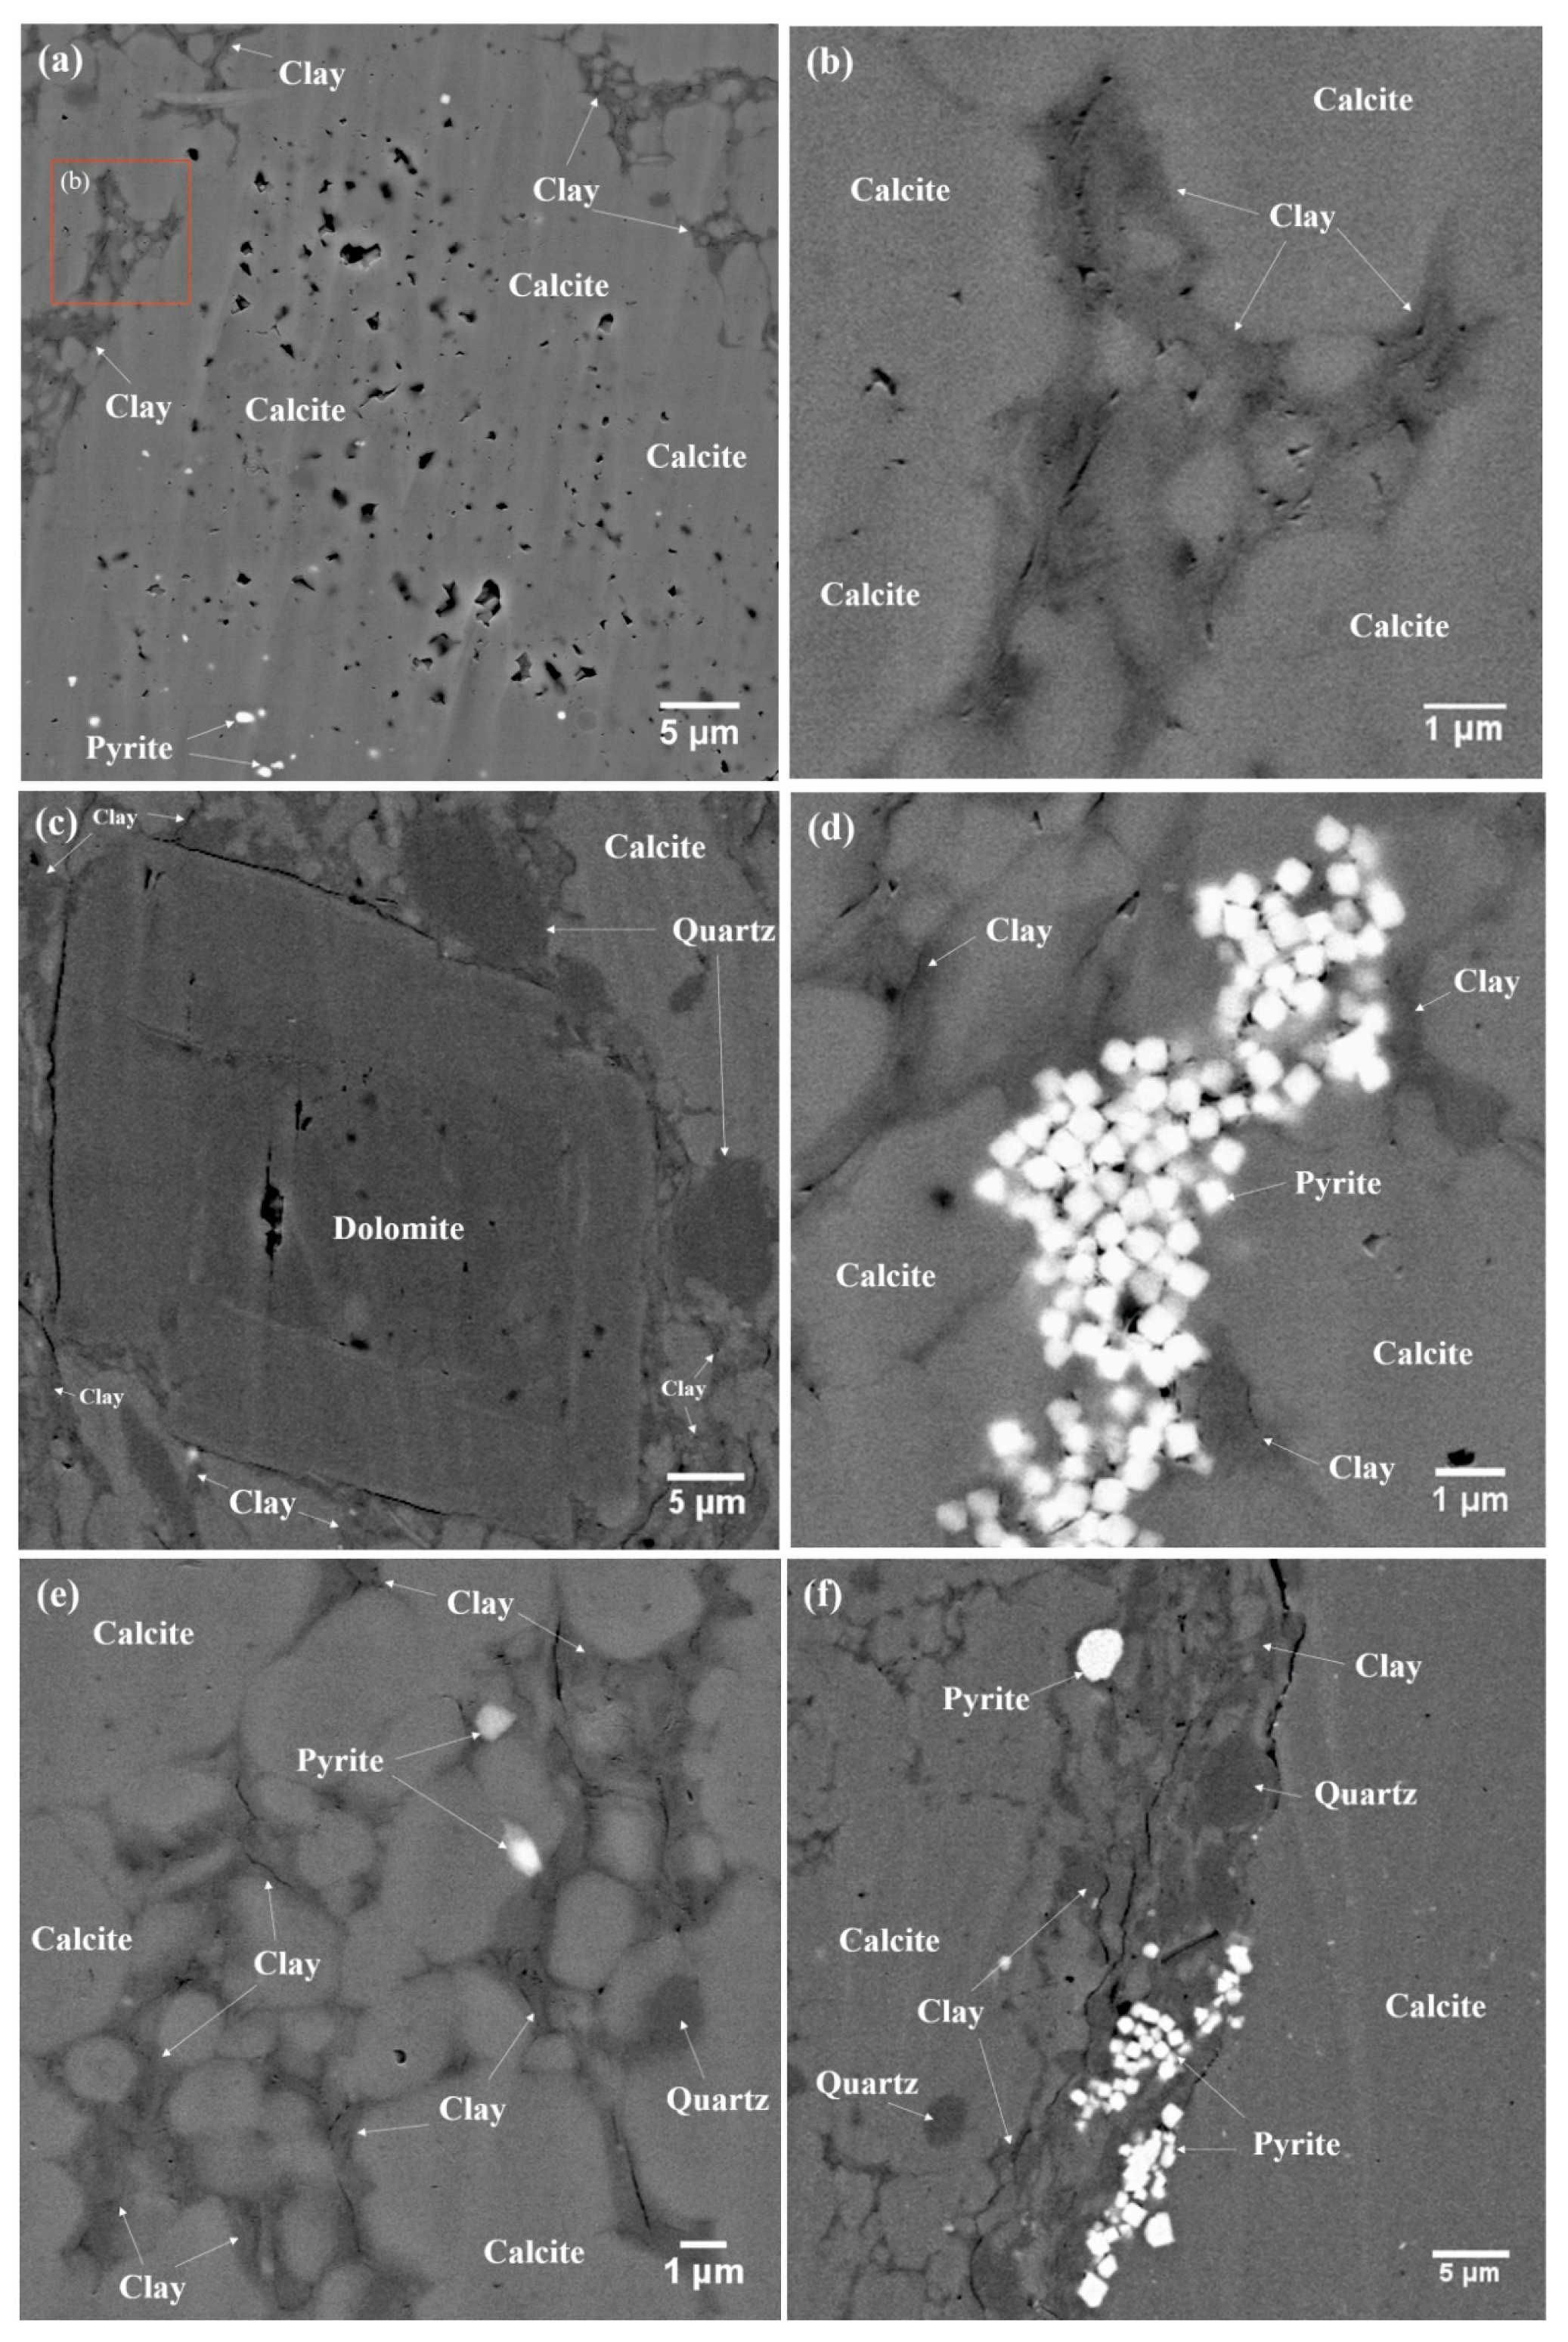
4.2.1. Mineralogy and Pore Morphology
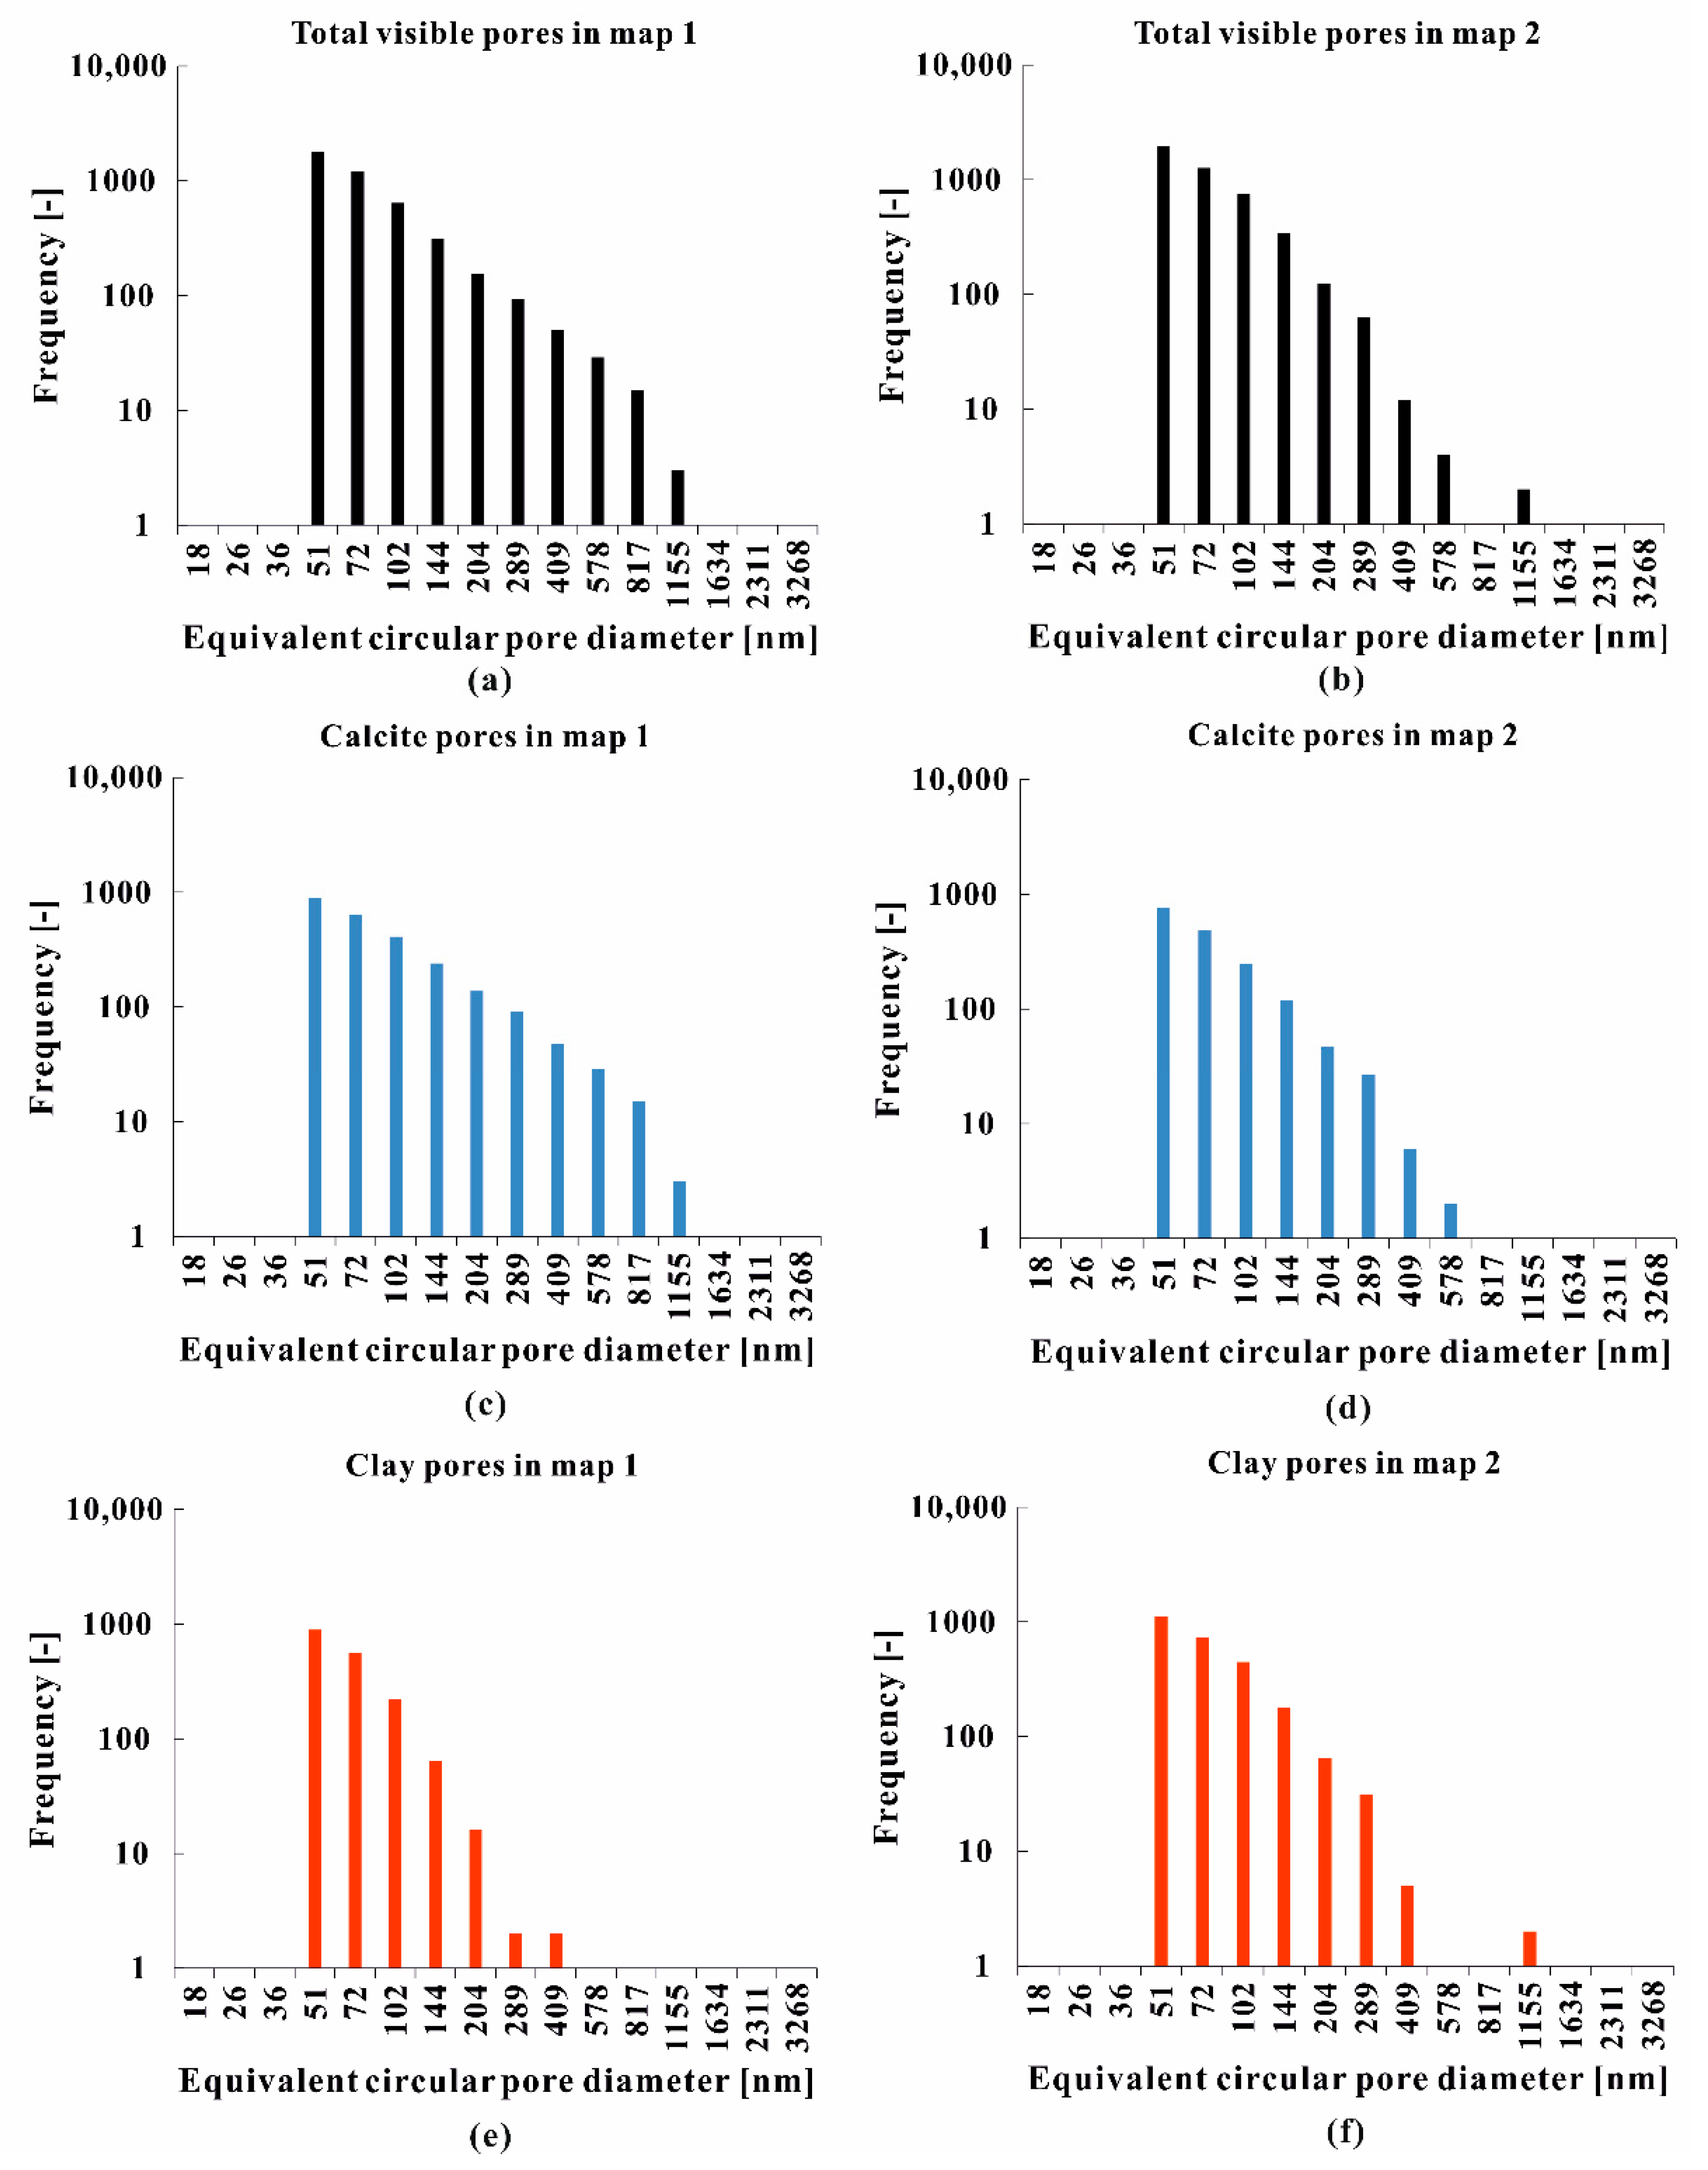
4.2.2. Porosity and Pore Size Distribution
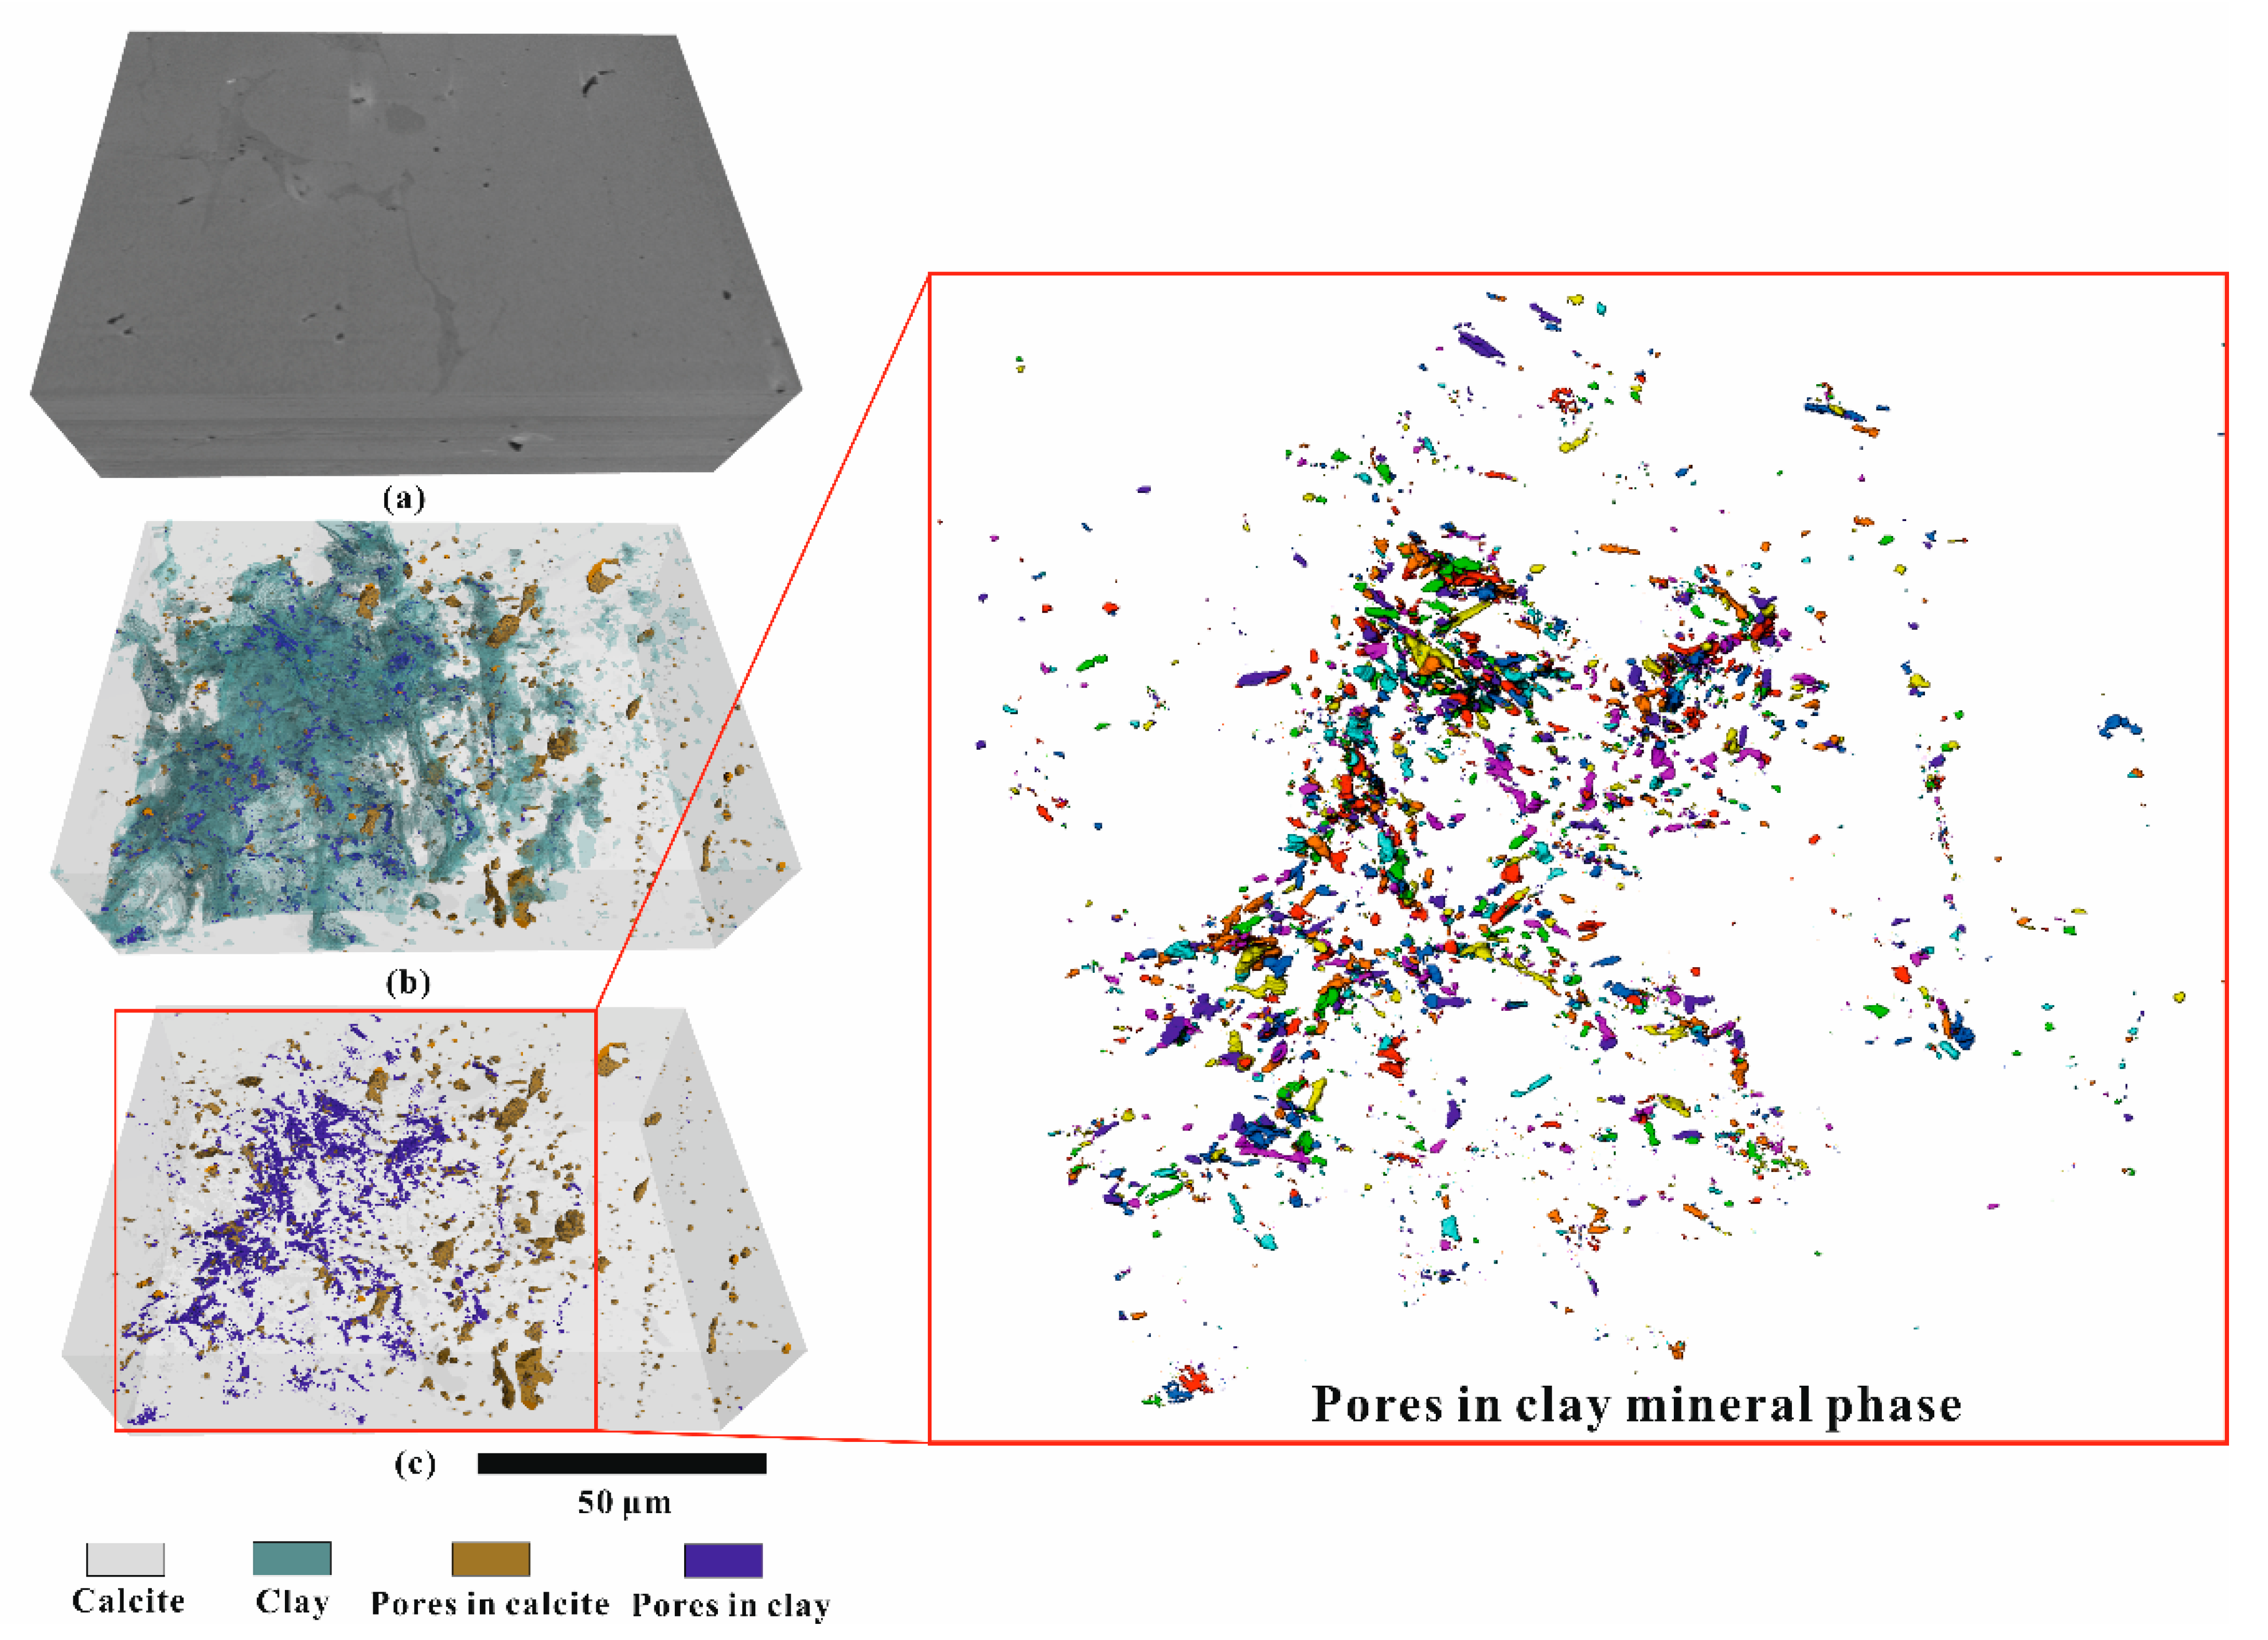
4.3. FIB-SEM Image Analysis
4.4. Permeability Simulation
5. Discussion
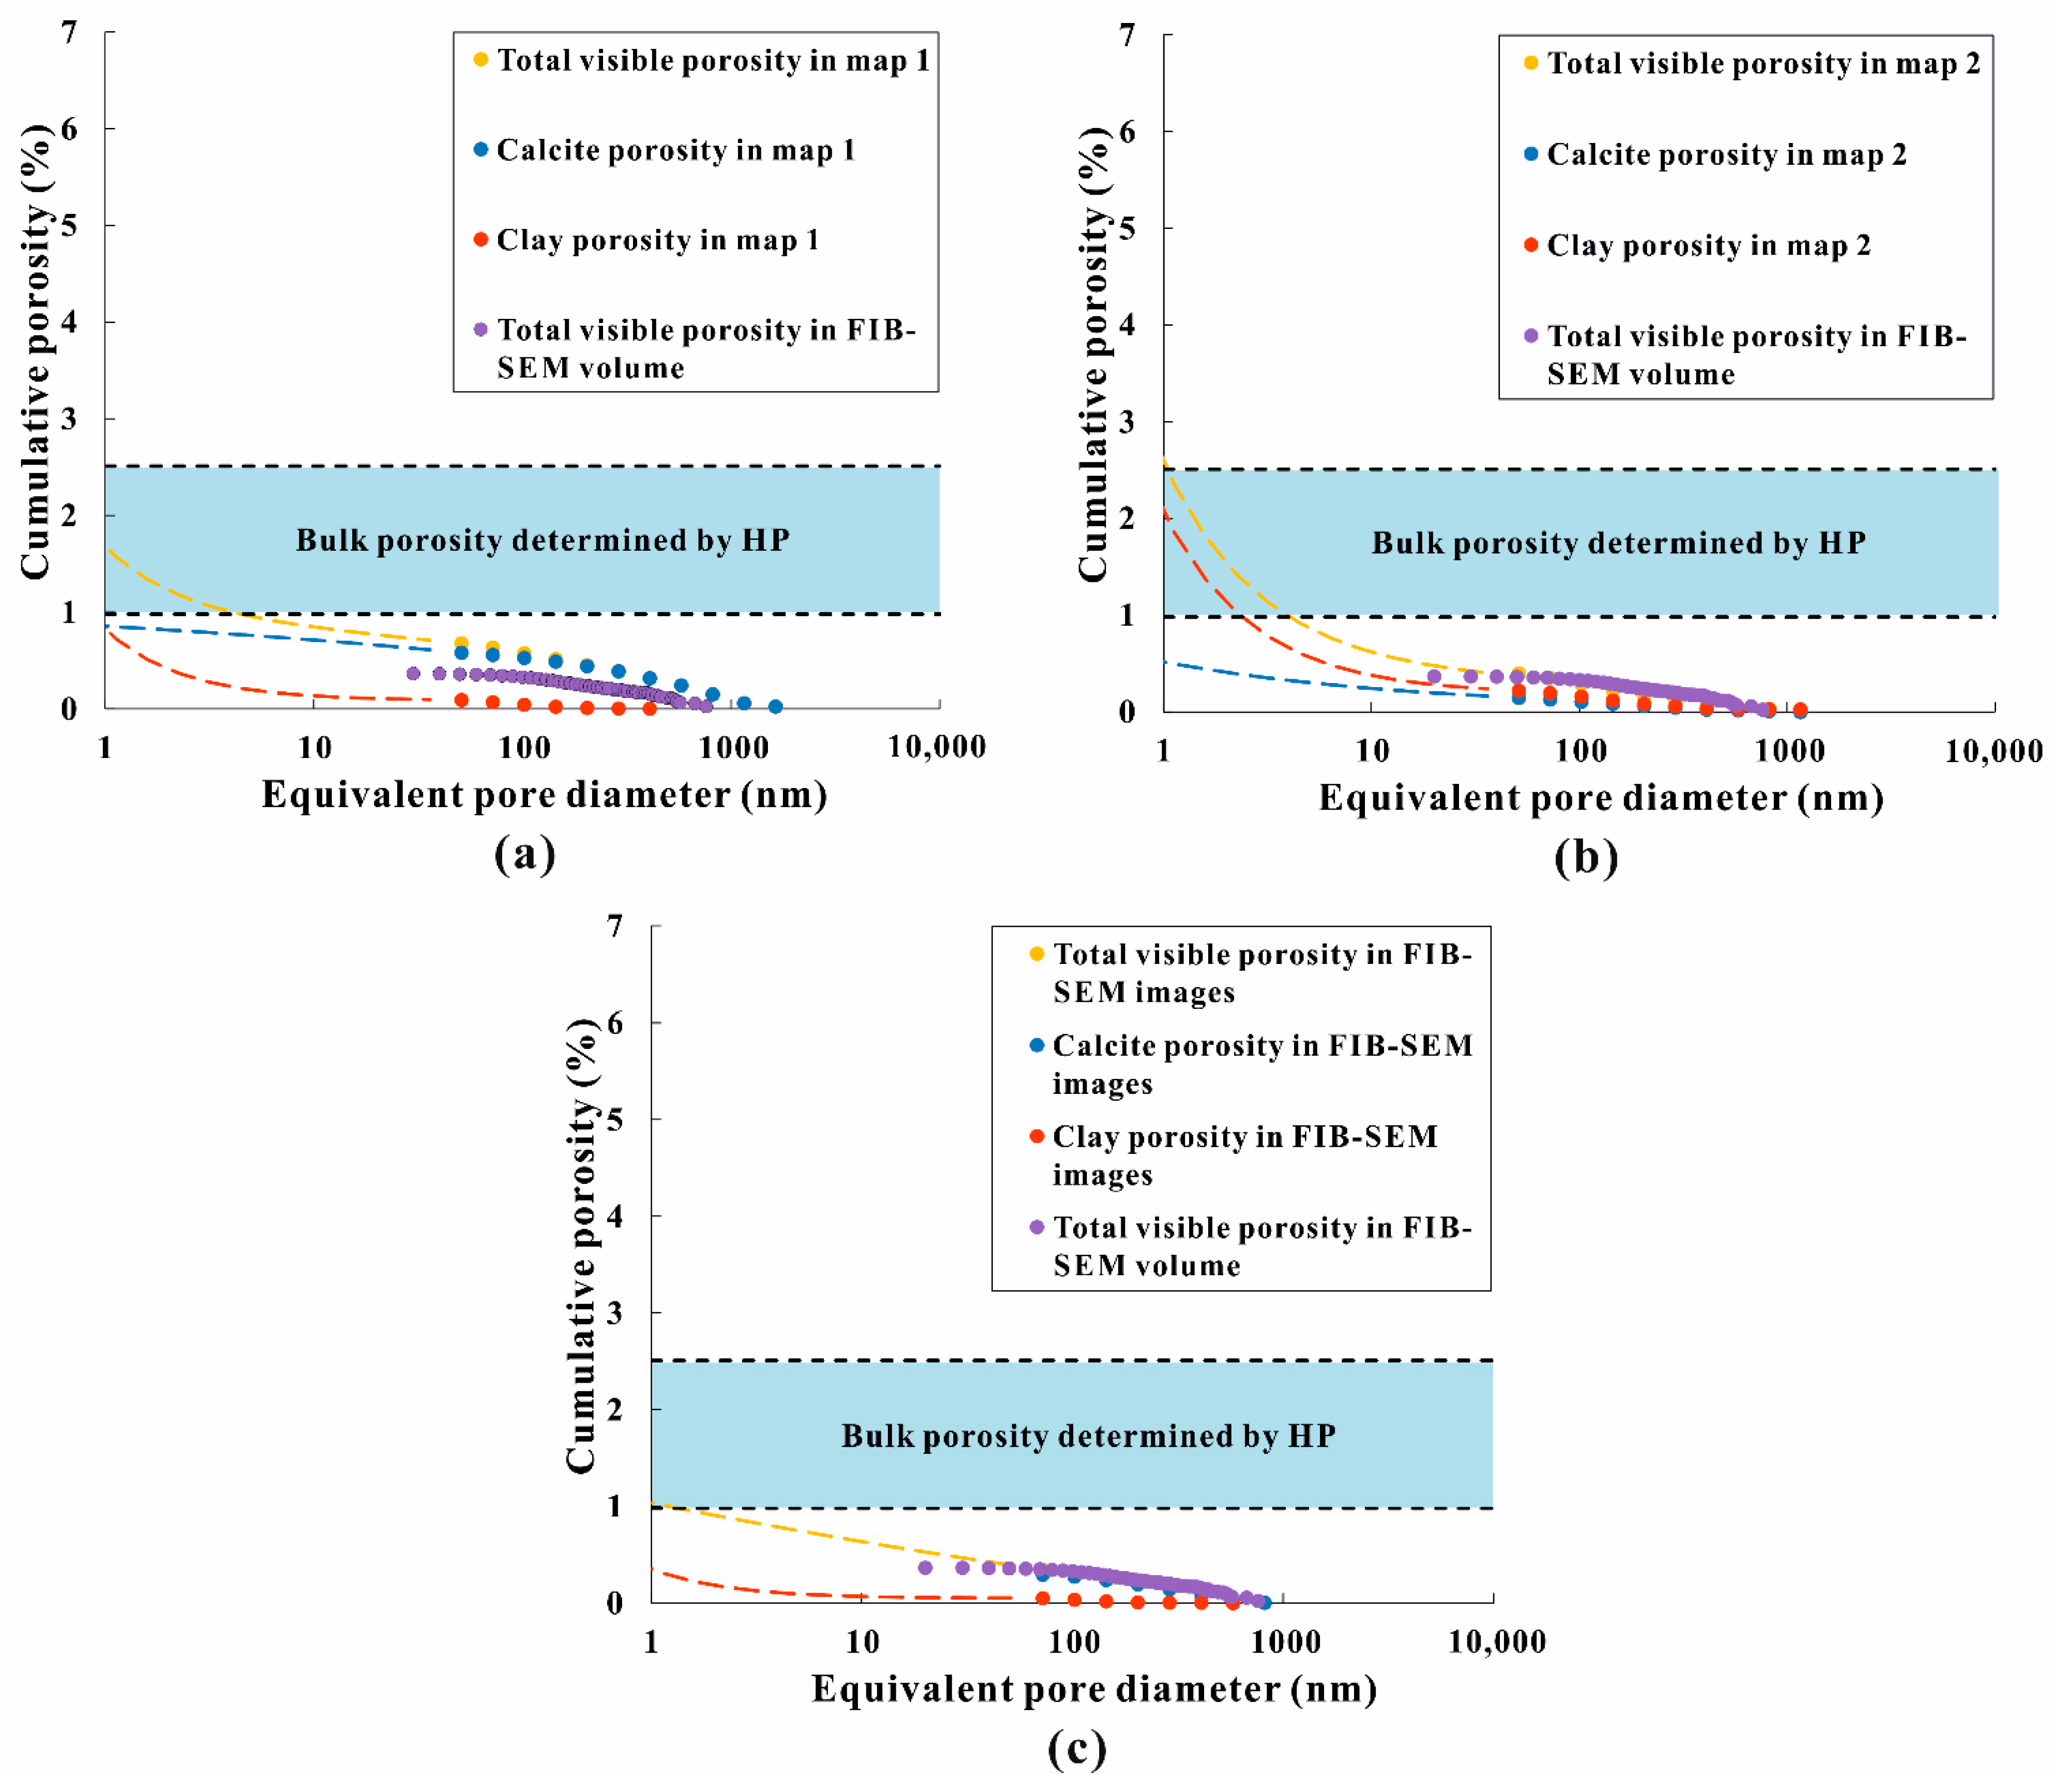
5.1. Methodological Comparison of Porosity
5.2. Pore Morphology and Pore Size Distribution
5.3. Implications on the Dominant Flow Pathways
- (a)
- Identified pores in the calcite phase are bound to individual grains and therefore could potentially be isolated (Figure 6a). Although calcite is the dominant mineral phase, the clay mineral phase is finely dispersed throughout the whole sample, often enveloping the carbonate grains to a large extent (Figure 5).
- (b)
- Shortest distance analyses of the FIB-SEM reconstruction indicate that pores in the clay mineral phase are closer to each other than those in the calcite phase, which indicates a higher possibility that these pores are connected.
- (c)
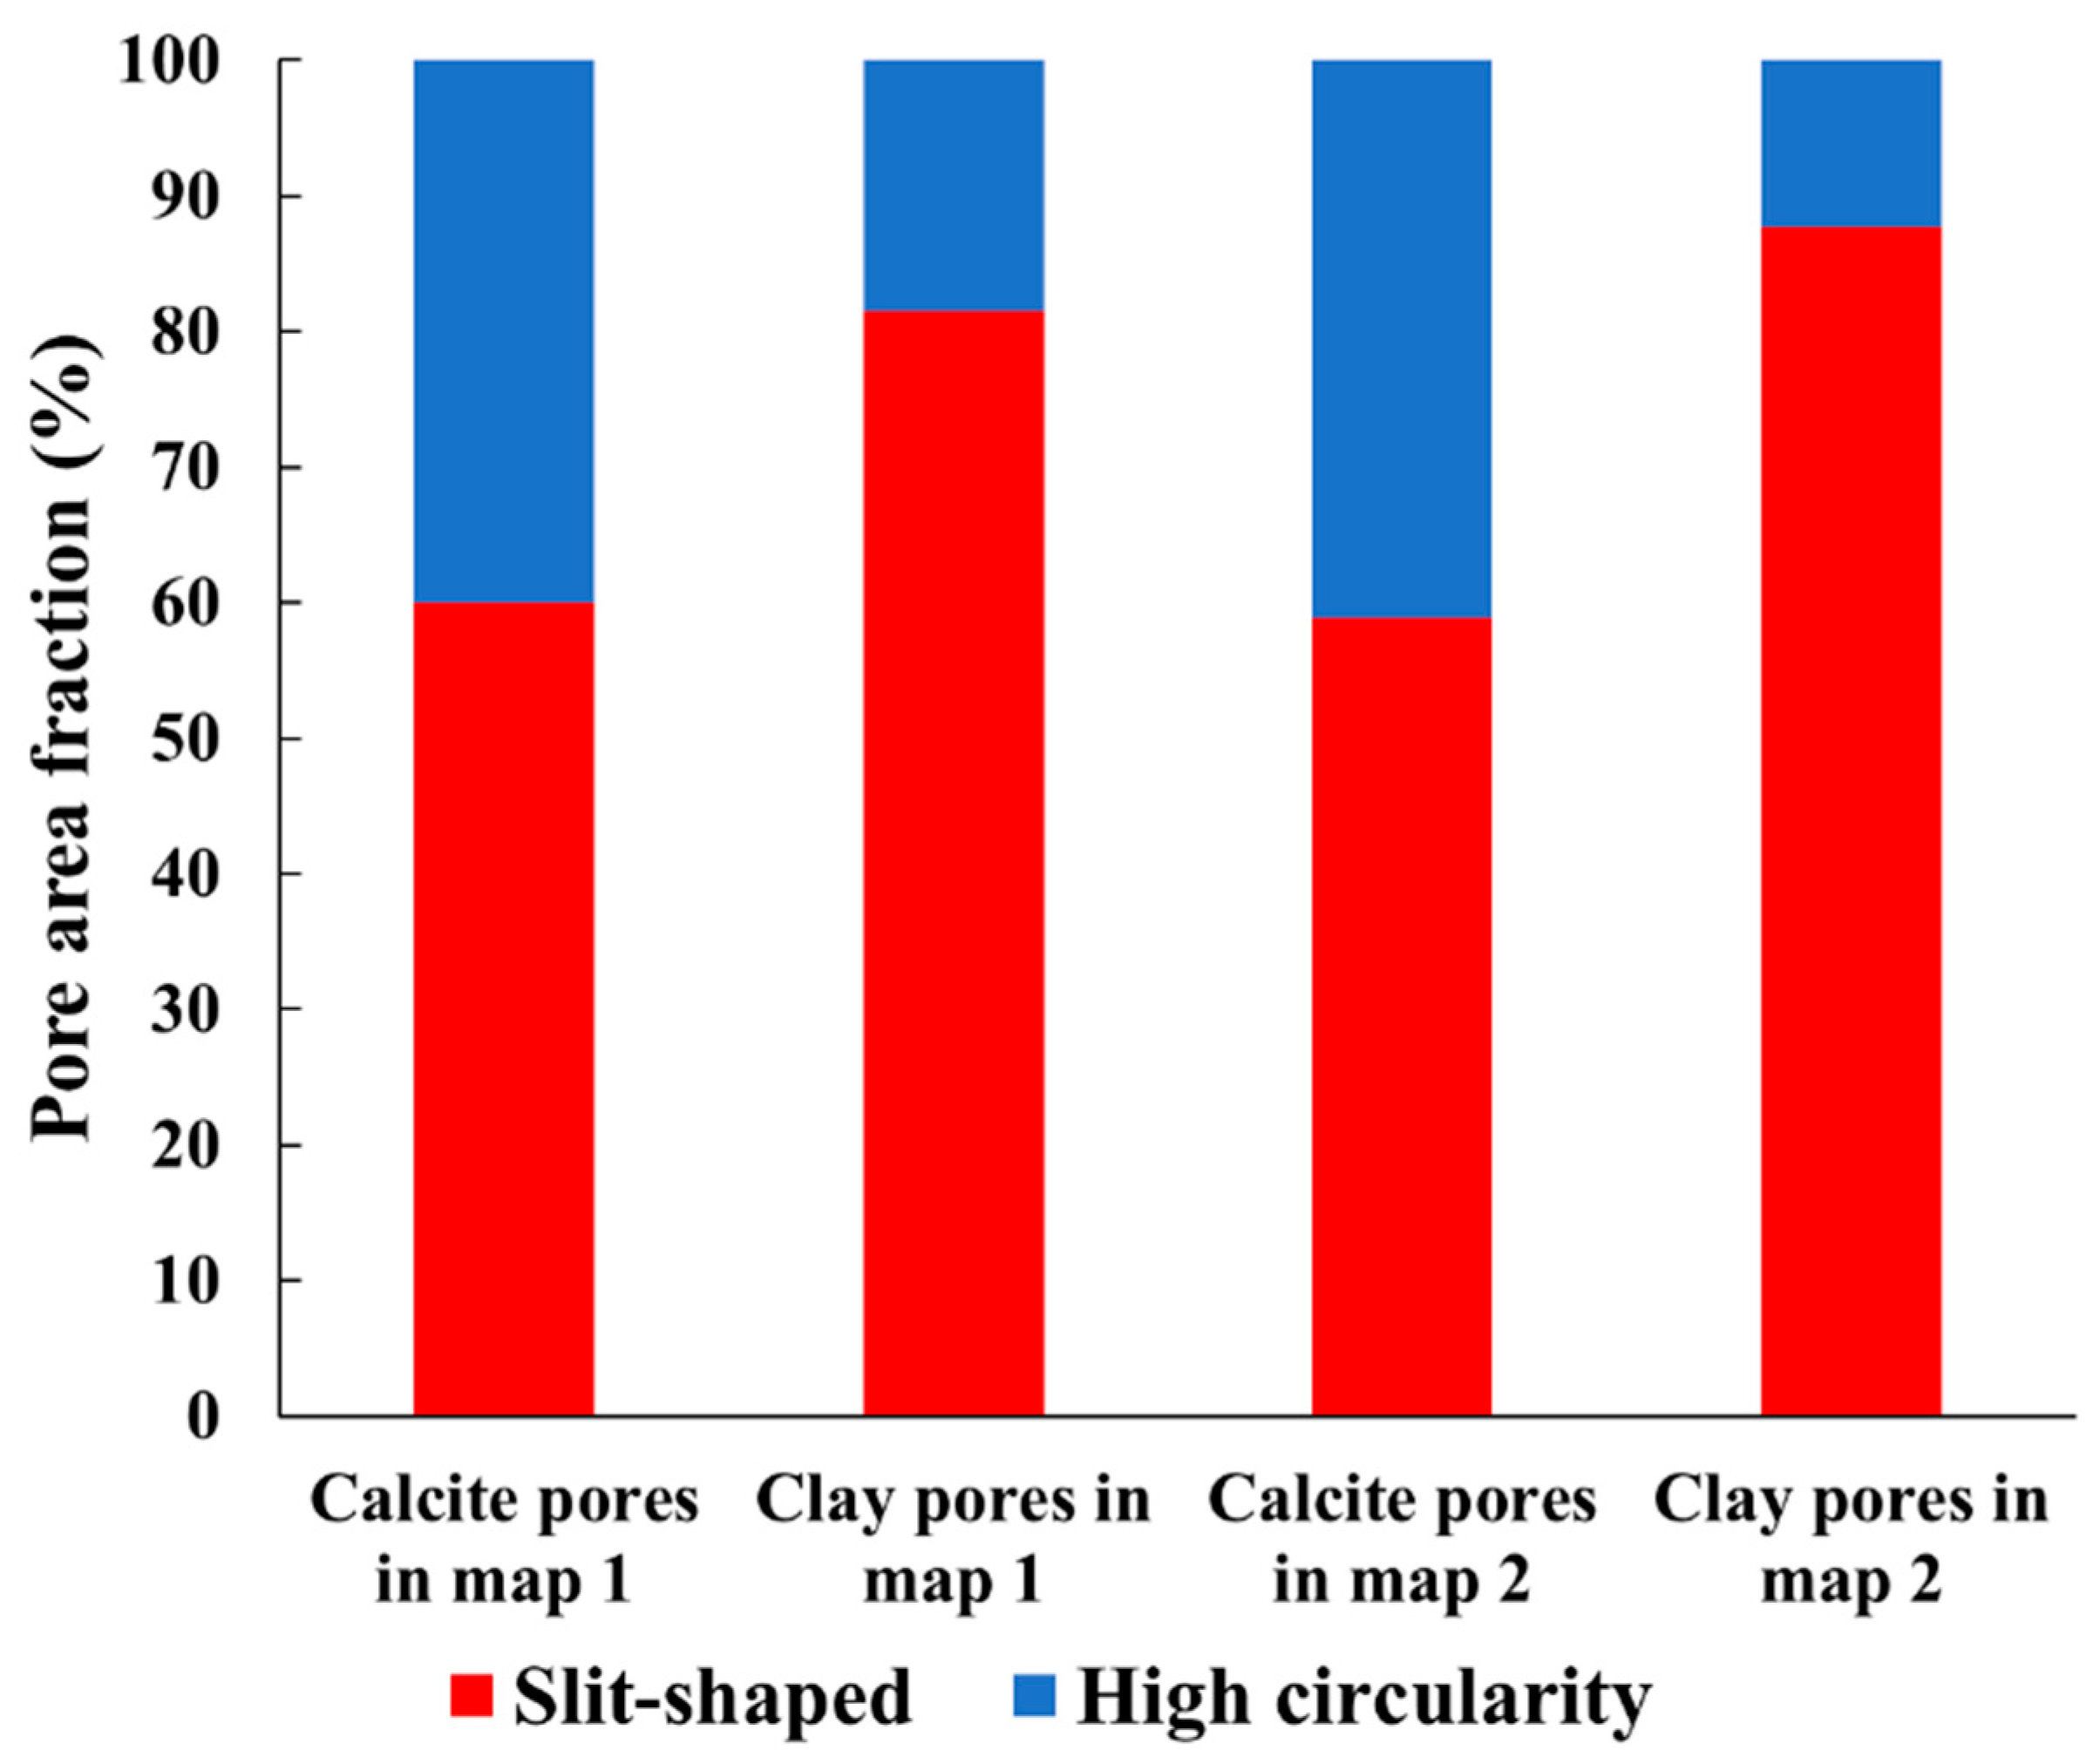
- The dominant slit-shaped pores in the clay mineral phase are likely to form a connected pore network, considering the high elongation of these pores and highest visible relative porosity (1.06–1.46%).
- (a)
- HP-derived grain densities on intact (plugs) and crushed samples (<63 µm particle size) showed no significant differences. Disruption or destruction of the rock fabric by grinding/milling should make an increasing percentage of pore volume accessible by physically opening isolated pores if existent. It can therefore be concluded that pores in calcite are connected for helium and contribute to transport.
- (b)
- Extrapolated porosities from mineralogical representative map 1, including calcite and clay mineral phases, are similar to the HP-derived porosities. As the HP-derived porosity measured on plugs represents an effective porosity, this is another piece of supporting evidence that the pores in the calcite phase are not isolated.
- (c)
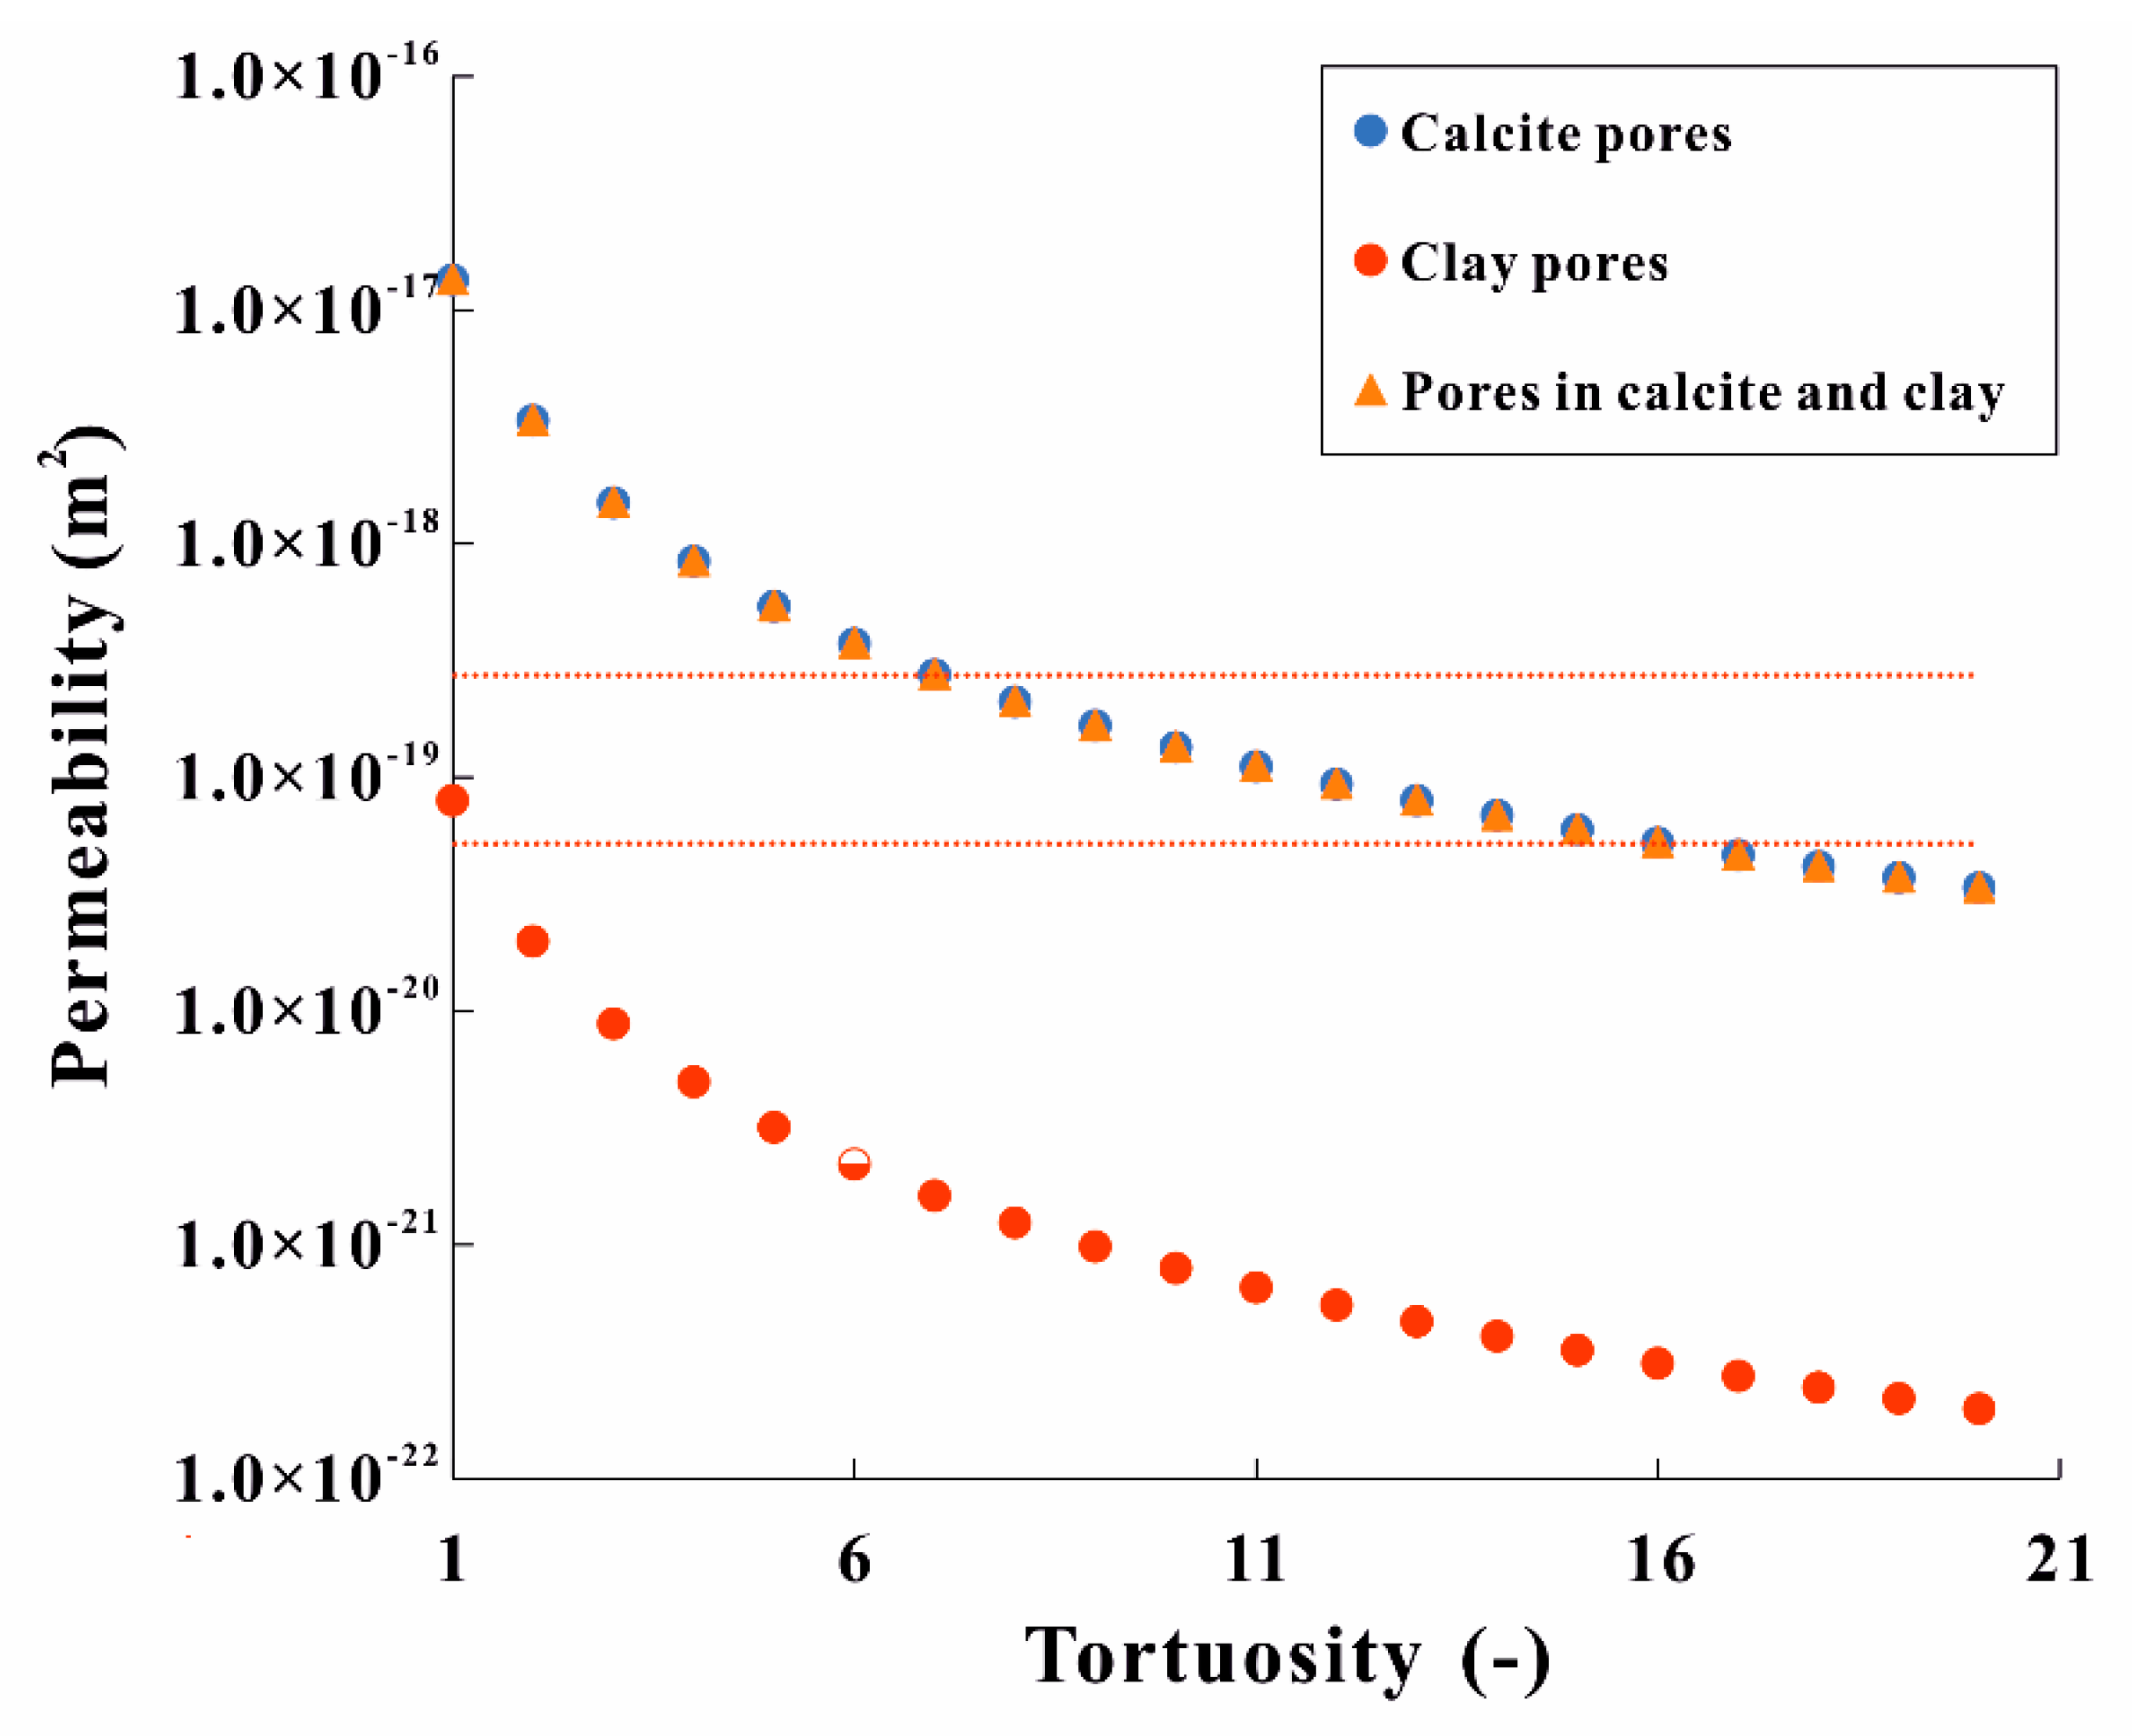
- BIB-SEM-derived permeability coefficients for the clay mineral phase can only be matched to laboratory-derived permeability coefficients with a tortuosity value of 1. Such tortuosity appears unrealistic considering that pore throats could not be visualized (e.g., all pores are isolated based on FIB-SEM), and clays are finely dispersed throughout the rock, making up only 6 vol.% of the bulk rock.
- (d)
- Slit-shaped pores and microfractures are generally more susceptible to deformation than cylindrical pores. Under realistic conditions (burial depths of 250–1000 m for underground mining repositories), the proportion of slit-shaped pores and microcracks would likely be significantly lower than in this study. Additionally, the calcite phase is much more rigid than the clay mineral phase, leading to better preservation potential of pores.
6. Conclusions
- (1)
- Based on the mineral composition analysis of BIB-SEM images, the Cobourg limestone can be characterized as a tight rock dominated by calcite grains of variable sizes (µm –cm) surrounded by idiomorphic or subhedral minerals (quartz, dolomite, and pyrite) and meshy clay minerals.
- (2)
- Qualitative and quantitative pore analyses indicate that calcite and clay mineral phases together contribute over 90% of the total pore areas in two BIB-SEM maps. The clay pores are relatively small and close to each other, dominated by slit-shaped pores, and are interpreted as interparticle pores. The pores associated with calcite have a larger pore size range and are distant from each other, equidimensional, or elongated in shape, and can mostly be considered as intraparticle pores.
- (3)
- The calcite and clay mineral phases show different pore size distribution, which can be characterized by a power law relationship between pore area and normalized pore frequency. The power law exponent D values measured in the clay mineral phase (2.50–2.59) are higher than those measured in the calcite phase (1.93–2.18).
- (4)
- The discrepancy in porosity values measured by HP and BIB-SEM can be attributed to the sample heterogeneity and the relatively lower resolution of BIB-SEM. The similarity between extrapolated porosities (down to 1 nm) and bulk porosities measured by HP indicates that valid porosity models can be reached by BIB-SEM imaging and interpretation towards smaller-sized pores, if a representative mineralogy is present in the studied map.
- (5)
- Based on detailed characterizations of the pore size distribution and pore morphology, and the uncertainty with respect to the connectivity of pores in the calcite and clay mineral phases, it cannot be concluded that the clay mineral phase exclusively provides pathways for flow; rather, it is possible that microfractures in the interface between calcite and clay phases enhance the flow, as well as interconnected pore networks in the calcite phase. However, this has to be investigated in more detail in the future.
Author Contributions
Funding
Data Availability Statement
Acknowledgments
Conflicts of Interest
References
- McKinley, I.G. The management of long lived nuclear waste. Energy Policy 1992, 20, 683–692. [Google Scholar] [CrossRef]
- Allan, C.; Nuttall, K. How to cope with the hazards of nuclear fuel waste. Nucl. Eng. Des. 1997, 176, 51–66. [Google Scholar] [CrossRef]
- International Atomic Energy Agency. The Use of Scientific and Technical Results from Underground Research Laboratory Investigations for the Geological Disposal of Radioactive Waste; International Atomic Energy Agency: Vienna, Austria, 2001. [Google Scholar]
- Loubergé, H.; Villeneuve, S.; Chesney, M. Long-term risk management of nuclear waste: A real options approach. J. Econ. Dyn. Control. 2002, 27, 157–180. [Google Scholar] [CrossRef]
- Birkholzer, J.; Houseworth, J.; Tsang, C.-F. Geologic Disposal of High-Level Radioactive Waste: Status, Key Issues, and Trends. Ann. Rev. Environ. Resour. 2012, 37, 79–106. [Google Scholar] [CrossRef]
- Apted, M.J.; Ahn, J. Geological Repository Systems for Safe Disposal of Spent Nuclear Fuels and Radioactive Waste; Elsevier Science: Amsterdam, The Netherlands, 2017. [Google Scholar]
- Witherspoon, P.A.; Bodvarsson, G.S. Geological Challenges in Radioactive Waste Isolation: Fourth Worldwide Review; University of California: Berkley, CA, USA, 2006. [Google Scholar]
- Hekimi, B. The Physical and Mechanical Properties of an Argillaceous Limestone; McGill University: Montreal, QC, Canada, 2013. [Google Scholar]
- Nasseri, M.; Goodfellow, S.; Wanne, T.; Young, R. Thermo-hydro-mechanical properties of Cobourg limestone. Int. J. Rock Mech. Min. Sci. 2013, 61, 212–222. [Google Scholar] [CrossRef]
- Selvadurai, A.P.S. Geomechanical Characterization of the Cobourg Limestone; Nuclear Waste Management Organization TR-2017: Toronto, ON, Canada, 2017. [Google Scholar]
- Nguyen, T.; Li, Z.; Su, G.; Nasseri, M.; Young, R. Hydro-mechanical behavior of an argillaceous limestone considered as a potential host formation for radioactive waste disposal. J. Rock Mech. Geotech. Eng. 2018, 10, 1063–1081. [Google Scholar] [CrossRef]
- Lippitt, L. Statistical Analysis of Regional Facies Change in Ordovician Cobourg Limestone in Northwestern New York and Southern Ontario. AAPG Bull. 1959, 43, 807–816. [Google Scholar] [CrossRef]
- Haeri-Ardakani, O.; Al-Aasm, I.; Coniglio, M. Petrologic and geochemical attributes of fracture-related dolomitization in Ordovician carbonates and their spatial distribution in southwestern Ontario, Canada. Mar. Pet. Geol. 2013, 43, 409–422. [Google Scholar] [CrossRef]
- Petts, D.C.; Saso, J.K.; Diamond, L.W.; Aschwanden, L.; Al, T.A.; Jensen, M. The source and evolution of paleofluids responsible for secondary minerals in low-permeability Ordovician limestones of the Michigan Basin. Appl. Geochem. 2017, 86, 121–137. [Google Scholar] [CrossRef]
- Vilks, P.; Miller, N.H. Evaluation of experimental protocols for characterizing diffusion in sedimentary rocks. In Atomic Energy of Canada Limited, Nuclear Waste Management Division Report TR-2007-11; Nuclear Waste Management Organization: Toronto, ON, Canada, 2007. [Google Scholar]
- Cavé, L.; Al, T.; Xiang, Y.; Vilks, P. A technique for estimating one-dimensional diffusion coefficients in low-permeability sedimentary rock using X-ray radiography: Comparison with through-diffusion measurements. J. Contam. Hydrol. 2009, 103, 1–12. [Google Scholar] [CrossRef] [PubMed]
- Hu, Z.; Klaver, J.; Schmatz, J.; Dewanckele, J.; Littke, R.; Krooss, B.M.; Amann-Hildenbrand, A. Stress sensitivity of porosity and permeability of Cobourg limestone. Eng. Geol. 2020, 273, 105632. [Google Scholar] [CrossRef]
- Letendre, A. Permeability Changes in Lindsay Limestone Due to Isotropic Compression. Master’s Thesis, McGill University, Montreal, QC, Canada, 2011. [Google Scholar]
- Day, J.J.; Diederichs, M.S.; Hutchinson, D.J. The Influence of Mineralogy and Grain Scale Features in Healed Intrablock Structure on Direct Shear Properties in the Cobourg Limestone. In Proceedings of the 51st U.S. Rock Mechanics/Geomechanics Symposium, American Rock Mechanics Association, San Francisco, CA, USA, 25–28 June 2017; p. 12. [Google Scholar]
- Hildenbrand, A.; Urai, J.L. Investigation of the morphology of pore space in mudstones-first results. Mar. Pet. Geol. 2003, 20, 1185–1200. [Google Scholar] [CrossRef]
- Seemann, T.; Bertier, P.; Krooss, B.M.; Stanjek, H. Water vapour sorption on mudrocks. Geol. Soc. Lond. Spéc. Publ. 2017, 454, 201–233. [Google Scholar] [CrossRef]
- Hu, Z.; Gaus, G.; Seemann, T.; Zhang, Q.; Littke, R.; Fink, R. Pore structure and sorption capacity investigations of Ediacaran and Lower Silurian gas shales from the Upper Yangtze platform, China. Géoméch. Geophys. Geo-Energy Geo-Resour. 2021, 7, 1–26. [Google Scholar] [CrossRef]
- Klaver, J.; Desbois, G.; Urai, J.L.; Littke, R. BIB-SEM study of the pore space morphology in early mature Posidonia Shale from the Hils area, Germany. Int. J. Coal Geol. 2012, 103, 12–25. [Google Scholar] [CrossRef]
- Curtis, M.E.; Sondergeld, C.H.; Ambrose, R.J.; Rai, C.S. Microstructural investigation of gas shales in two and three dimensions using nanometer-scale resolution im-aging. AAPG Bull. 2012, 96, 665–677. [Google Scholar] [CrossRef]
- Anovitz, L.M.; Cole, D.R. Characterization and Analysis of Porosity and Pore Structures. Rev. Miner. Geochem. 2015, 80, 61–164. [Google Scholar] [CrossRef] [Green Version]
- Cnudde, V.; Boone, M.N. High-resolution X-ray computed tomography in geosciences: A review of the current technology and applications. Earth-Sci. Rev. 2013, 123, 1–17. [Google Scholar] [CrossRef] [Green Version]
- Mostaghimi, P.; Blunt, M.; Bijeljic, B. Computations of Absolute Permeability on Micro-CT Images. Math. Geol. 2013, 45, 103–125. [Google Scholar] [CrossRef]
- Andrä, H.; Combaret, N.; Dvorkin, J.; Glatt, E.; Han, J.; Kabel, M.; Keehm, Y.; Krzikalla, F.; Lee, M.; Madonna, C.; et al. Digital rock physics benchmarks—part II: Computing effective properties. Comput. Geosci. 2013, 50, 33–43. [Google Scholar] [CrossRef]
- Kelly, S.; El-Sobky, H.; Torres-Verdín, C.; Balhoff, M.T. Assessing the utility of FIB-SEM images for shale digital rock physics. Adv. Water Resour. 2016, 95, 302–316. [Google Scholar] [CrossRef]
- Saxena, N.; Hofmann, R.; Alpak, F.O.; Berg, S.; Dietderich, J.; Agarwal, U.; Tandon, K.; Hunter, S.; Freeman, J.; Wilson, O.B. References and benchmarks for pore-scale flow simulated using micro-CT images of porous media and digital rocks. Adv. Water Resour. 2017, 109, 211–235. [Google Scholar] [CrossRef]
- Desbois, G.; Urai, J.L.; Hemes, S.; Brassinnes, S.; De Craen, M.; Sillen, X. Nanometer-scale pore fluid distribution and drying damage in preserved clay cores from Belgian clay formations inferred by BIB-cryo-SEM. Eng. Geol. 2014, 179, 117–131. [Google Scholar] [CrossRef]
- Klaver, J.; Desbois, G.; Littke, R.; Urai, J.L. BIB-SEM characterization of pore space morphology and distribution in postmature to overmature samples from the Haynesville and Bossier Shales. Mar. Pet. Geol. 2015, 59, 451–466. [Google Scholar] [CrossRef]
- Philipp, T.; Amann-Hildenbrand, A.; Laurich, B.; Desbois, G.; Littke, R.; Urai, J.L. The effect of microstructural heterogeneity on pore size distribution and permeability in Opalinus Clay (Mont Terri, Switzerland): Insights from an integrated study of laboratory fluid flow and pore morphology from BIB-SEM images. Geol. Soc. Lond. Spéc. Publ. 2017, 454, 85–106. [Google Scholar] [CrossRef]
- Keller, L.; Schuetz, P.; Erni, R.; Rossell, M.D.; Lucas, F.; Gasser, P.; Holzer, L. Characterization of multi-scale microstructural features in Opalinus Clay. Microporous Mesoporous Mater. 2013, 170, 83–94. [Google Scholar] [CrossRef]
- Bultreys, T.; Van Hoorebeke, L.; Cnudde, V. Multi-scale, micro-computed tomography-based pore network models to simulate drainage in heterogeneous rocks. Adv. Water Resour. 2015, 78, 36–49. [Google Scholar] [CrossRef]
- Davy, C.A.; Hu, Z.; Selvadurai, A.P.S.; Klaver, J.; Willemetz, M.C.; Agostini, F.; Skoczylas, F.; Dewanckele, J.; Amann-Hildenbrand, A.; Lenormand, R. Transport properties of the Cobourg Limestone: A benchmark investigation. In Proceedings of the 2019 International Symposium of the Society of Core Analysts, Pau, France, 26–30 August 2019. [Google Scholar]
- Masschaele, B.C.; Cnudde, V.; Dierick, M.; Jacobs, P.; Van Hoorebeke, L.; Vlassen, J. UGCT: New x-ray radiography and tomography facility. Nucl. Instrum. Methods Phys. Res. Sect. A Accel. Spectrometers Detect. Assoc. Equip. 2007, 580, 266–269. [Google Scholar] [CrossRef]
- Dierick, M.; Van Loo, D.; Masschaele, B.; Boone, M.; Pauwels, E.; Brabant, L.; Van Hoorebeke, L. HECTOR, a new multifunctional micro-CT scanner at UGCT. In Proceedings of the IEEE 10th International Symposium on Biomedical Imaging: From Nano to Macro, San Francisco, CA, USA, 7–11 April 2013. [Google Scholar]
- Desbois, G.; Urai, J.L.; Kukla, P.A. Morphology of the pore space in claystones–evidence from BIB/FIB ion beam sectioning and cryo-SEM observations. eEarth Discuss. 2009, 4, 1–19. [Google Scholar] [CrossRef] [Green Version]
- Sing, K.S.W.; Everett, D.H.; Haul, R.A.W.; Moscou, L.; Pierotti, R.A.; Rouqérol, J.; Siemieniewska, T. Reporting Physisorption Data for Gas/solid Systems with Special Reference to the Determination of Surface area and Porosity. Pure Appl. Chem. 1985, 57, 603–619. [Google Scholar] [CrossRef]
- Ollion, J.; Cochennec, J.; Loll, F.; Escudé, C.; Boudier, T. Tango: A generic tool for high-throughput 3D image analysis for studying nuclear organization. Bioinform. 2013, 29, 1840–1841. [Google Scholar] [CrossRef]
- Peters, E.J. Petrophysics; University of Texas at Austin: Austin, TX, USA, 2005. [Google Scholar]
- Robie, R.A.; Bethke, P.M. Molar Volumes and Densities of Minerals; United States Department of the Interior Geological Survey: Reston, VI, USA, 1962; pp. 4–21. [Google Scholar]
- Loucks, R.G.; Reed, R.M.; Ruppel, S.C.; Hammes, U. Spectrum of pore types and networks in mudrocks and a descriptive classification for matrix-related mudrock pores. AAPG Bull. 2012, 96, 1071–1098. [Google Scholar] [CrossRef] [Green Version]
- Al-Mukhtar, M.; Khattab, S.; Alcover, J.-F. Microstructure and geotechnical properties of lime-treated expansive clayey soil. Eng. Geol. 2012, 139–140, 17–27. [Google Scholar] [CrossRef]
- Ghanbarian, B.; Hunt, A.; Ewing, R.P.; Sahimi, M. Tortuosity in Porous Media: A Critical Review. Soil Sci. Soc. Am. J. 2013, 77, 1461–1477. [Google Scholar] [CrossRef]
- Joos, G.; Freeman, I.M. Theoretical Physics; Dover Publications: Mineola, NY, USA, 1987. [Google Scholar]
- Jlassi, K.; Krupa, I.; Chehimi, M.M. (Eds.) Chapter 1-Overview: Clay Preparation, Properties, Modification, in Clay-Polymer Nanocomposites; Matthew Deans: Cambridge, MA, USA, 2017; pp. 1–28. [Google Scholar]
- Selvadurai, A.P.S. A Multi-Phasic Perspective of the Intact Permeability of the Heterogeneous Argillaceous Cobourg Limestone. Sci. Rep. 2019, 9, 1–14. [Google Scholar] [CrossRef]
- Selvadurai, A.; Głowacki, A. Estimates for the local permeability of the Cobourg limestone. J. Rock Mech. Geotech. Eng. 2018, 10, 1009–1019. [Google Scholar] [CrossRef]
- Keller, L.; Holzer, L.; Wepf, R.; Gasser, P. 3D geometry and topology of pore pathways in Opalinus clay: Implications for mass transport. Appl. Clay Sci. 2011, 52, 85–95. [Google Scholar] [CrossRef]
- Soeder, D. Porosity and Permeability of Eastern Devonian Gas Shale. SPE Form. Eval. 1988, 3, 116–124. [Google Scholar] [CrossRef]
- Backeberg, N.R.; Iacoviello, F.; Rittner, M.; Mitchell, T.; Jones, A.P.; Day, R.; Wheeler, J.; Shearing, P.R.; Vermeesch, P.; Striolo, A. Quantifying the anisotropy and tortuosity of permeable pathways in clay-rich mudstones using models based on X-ray tomography. Sci. Rep. 2017, 7, 1–12. [Google Scholar] [CrossRef]
- Klaver, J.; Hemes, S.; Houben, M.; Desbois, G.; Radi, Z.; Urai, J.L. The connectivity of pore space in mudstones: Insights from high-pressure Wood’s metal injection, BIB-SEM imaging, and mercury intrusion porosimetry. Geofluids 2015, 15, 577–591. [Google Scholar] [CrossRef]


| Sample | Calcite (%) | Dolomite/Ankerite (%) | Clay Minerals (%) | Quartz (%) | Pyrite (%) | Others (%) | Carbonate (%) | Silicate (%) |
|---|---|---|---|---|---|---|---|---|
| BIB-SEM map 1 | 89.5 | 1.2 | 8.4 | 0.8 | 0.1 | 0.0 | 90.7 | 9.2 |
| BIB-SEM map 2 | 61.2 | 7.6 | 20.9 | 8.4 | 2.0 | 0.0 | 68.7 | 29.3 |
| FIB-SEM volume | 95.6 | 4.39 | 95.6 | 4.39 | ||||
| BIB-SEM overview map | 84.1 | 4.0 | 6.5 | 4.6 | 0.4 | 0.5 | 88.1 | 11.1 |
| XRD analysis * | 80.0 | 8.4 | 6.4 | 5.0 | 0.3 | 0.0 | 88.4 | 11.4 |
| Sample | Porosity (%) | Calcite | Dolomite | Clay | Quartz | Pyrite | Total |
|---|---|---|---|---|---|---|---|
| BIB-SEM map 1 | Absolute | 0.58 | 0.00 | 0.09 | 0.00 | 0.00 | 0.68 |
| Relative | 0.65 | 0.03 | 1.11 | 0.18 | 0.60 | ||
| BIB-SEM map 2 | Absolute | 0.15 | 0.01 | 0.22 | 0.01 | 0.02 | 0.41 |
| Relative | 0.24 | 0.08 | 1.06 | 0.16 | 0.88 | ||
| FIB-SEM volume | Absolute | 0.30 | 0.06 | 0.37 | |||
| Relative | 0.32 | 1.46 |
| Mineral Phase | Calcite | Clay | Total | |||
|---|---|---|---|---|---|---|
| D | logC | D | logC | D | logC | |
| map 1 | 1.93 | −3.51 | 2.59 | −1.32 | 2.04 | −2.91 |
| map 2 | 2.18 | −2.84 | 2.50 | −1.37 | 2.25 | −2.11 |
| FIB-SEM images | 2.59 | 2.04 | ||||
Publisher’s Note: MDPI stays neutral with regard to jurisdictional claims in published maps and institutional affiliations. |
© 2021 by the authors. Licensee MDPI, Basel, Switzerland. This article is an open access article distributed under the terms and conditions of the Creative Commons Attribution (CC BY) license (https://creativecommons.org/licenses/by/4.0/).
Share and Cite
Hu, Z.; Lu, S.; Klaver, J.; Dewanckele, J.; Amann-Hildenbrand, A.; Gaus, G.; Littke, R. An Integrated Imaging Study of the Pore Structure of the Cobourg Limestone—A Potential Nuclear Waste Host Rock in Canada. Minerals 2021, 11, 1042. https://doi.org/10.3390/min11101042
Hu Z, Lu S, Klaver J, Dewanckele J, Amann-Hildenbrand A, Gaus G, Littke R. An Integrated Imaging Study of the Pore Structure of the Cobourg Limestone—A Potential Nuclear Waste Host Rock in Canada. Minerals. 2021; 11(10):1042. https://doi.org/10.3390/min11101042
Chicago/Turabian StyleHu, Zhazha, Shuangfang Lu, Jop Klaver, Jan Dewanckele, Alexandra Amann-Hildenbrand, Garri Gaus, and Ralf Littke. 2021. "An Integrated Imaging Study of the Pore Structure of the Cobourg Limestone—A Potential Nuclear Waste Host Rock in Canada" Minerals 11, no. 10: 1042. https://doi.org/10.3390/min11101042
APA StyleHu, Z., Lu, S., Klaver, J., Dewanckele, J., Amann-Hildenbrand, A., Gaus, G., & Littke, R. (2021). An Integrated Imaging Study of the Pore Structure of the Cobourg Limestone—A Potential Nuclear Waste Host Rock in Canada. Minerals, 11(10), 1042. https://doi.org/10.3390/min11101042