Article

A Process Mineralogical Evaluation of Chromite at the Nkomati Nickel Mine, Uitkomst Complex, South Africa

by
Thomas Dzvinamurungu
1,†,
Derek Hugh Rose
1,*,
Karel Stephanus Viljoen
1 and
Antoine Floribert Mulaba-Bafubiandi
2
1
Department of Geology, University of Johannesburg, Auckland Park, Kingsway Campus, Gauteng 2006, South Africa
2
Department of Metallurgy, University of Johannesburg, Doornfontein Campus, Gauteng 2028, South Africa
*
Author to whom correspondence should be addressed.
Present Address: Department of Geosciences, Midlands State University, Private Bag 9055, Senga Road, Gweru, Zimbabwe.
Minerals 2020, 10(8), 709; https://doi.org/10.3390/min10080709
Submission received: 21 June 2020 / Revised: 22 July 2020 / Accepted: 23 July 2020 / Published: 12 August 2020
(This article belongs to the Section Mineral Processing and Extractive Metallurgy)

Abstract

:
A process mineralogical study based on three texturally and mineralogically different chromite-bearing ore types at the Nkomati nickel mine was undertaken, with focus on chromite. Chromite is a by-product of the Ni-Cu-Co-PGE ore at Nkomati Nickel mine. These being the PCMZ_MG (medium-grade Ni-Cu sulphide silicate ore with disseminated chromite), PCMZ_HG (high-grade Ni-Cu sulphide silicate ore containing disseminated chromite) and MCHR (massive chromite unit) ore types. These were processed using benchtop flotation followed by gravity concentration using a shaking table at different grind sizes. Quantitative mineralogical data was obtained using a 600F Mineral Liberation Analyser for the unprocessed and processed ores at three selected target grinds. The Mineral Liberation Analyser data indicated that increased milling does not relate to increased chromite grades and recoveries, particularly for the disseminated PCMZ type ores based on laboratory-scale gravity concentration. The recovery is controlled largely by the chromite chemistry. The results also showed that the MCHR samples that underwent a pre-flotation stage before gravity separation had better Cr2O3 grades (45% to 47%) and recoveries (52% to 61%) than MCHR ore that did not undergo a pre-flotation stage, which recorded grades ranging from 44% to 46% and recoveries ranging from 43% to 60%. This holds promise for the blending of MCHR ores with the PCMZ ores. The PCMZ ores also displayed better Cr2O3 grades and recoveries at coarser grinds. The optimal target grind to process all three ore types is a P80 of 75 μm, which is the current grind size employed at Nkomati Nickel mine. Due to the low nickel price and grade the Nkomati Nickel mine is currently under care and maintenance.

1. Introduction

Chromite is a member of the spinel group and is the only economically important ore mineral of chromium. It is used extensively by the metallurgical industry as feedstock for ferroalloy production [1,2,3,4]. Chromite ore is commonly classified into different grades based on the Cr/Fe ratio as well as the Cr2O3 content. These being metallurgical grade, chemical grade and refractory grade [5]. Historically most of the chromite mined in South Africa was sourced from the Bushveld Complex. The Bushveld Complex hosts the largest chromite deposits worldwide [5]. In addition to hosting the largest chromite deposits, it is also the largest known layered intrusion in the world. The Bushveld Complex also contains the largest resources of platinum-group element mineralization. Cousins [6] proposed that the 13 chromitite layers found in the Critical Zone of the Bushveld Complex be grouped into the Lower Group (LG), Middle Group (MG) and Upper Group (UG) based on their stratigraphic occurrence in the Critical Zone. The LG chromitites occur in the Lower Critical Zone, while the MG chromitites straddle the boundary between the Lower Critical Zone and the Upper Critical Zone and the UG chromitites occur in the Upper Critical Zone. Cousins and Feringa [7] further proposed that the chromitite layers be labelled from the base upwards. Various studies focusing on the chemistry and geological setting of the different chromitite groups of the Bushveld Complex have been carried out ([8] and references within, [9,10,11,12,13,14,15,16,17,18,19,20,21]). It was shown that the LG chromites have the highest Cr/Fe ratio (i.e., most primitive) which decreases systematically upwards such that the UG chromites have low Cr/Fe ratios and are thus more evolved. The high Cr/Fe ratio of the LG chromitite layers, particularly the LG6, coupled with its ideal thickness allowed for this horizon to be mined primarily for its chromium content. The Cr/Fe ratio can thus be used as a proxy for the quality of chromite ore [22]. The lower grade deposits, with low Cr/Fe ratios (i.e., high iron content and low Cr2O3 content) were as a result not mined. These low-grade deposits have however, been exploited and successfully upgraded using physical methods such as gravity separation [1,4]. Such advances in chromite beneficiation offered an opportunity to investigate the chromite-bearing ore from the Uitkomst Complex at the Nkomati nickel mine. This was done as the massive chromitite unit (MCHR) is considered a sub-economic by-product of the Ni-Cu-Co-PGE ore (i.e., high-grade Ni-Cu sulphide silicate ore containing disseminated chromite (PCMZ_HG) and medium-grade Ni-Cu sulphide silicate ore with disseminated chromite (PCMZ_MG)). The MCHR was only mined for a short time-span during open-pit development in the early noughties. During this time the steel price was high and China bought large quantities of the low-grade and fine-grained MCHR ore compared to the high-grade Bushveld chromite ore. After this phase, the ore was stockpiled. Although the Peridotitic Chromititic Mineralized Zone (PCMZ) ores contain disseminated chromite mineralization, these are not considered as a chrome ore due to the high dilution of silicates.
The disseminated chromite-bearing ores (PCMZ) and the massive ore (MCHR) are characterized by various textures with reference to the base-metal sulphide and chromite mineralization. Since mineral liberation and recoveries are known to be closely related to the textural properties of the minerals in ores [23,24], these mineral textures present chromite liberation problems and ultimately influence chromite recoveries.
Textural analysis of ore minerals provides predictive liberation information and acts as a basis for economic evaluation of a mineral processing technological scheme [25]. Optimum liberation and recovery of valuable minerals from texturally complex ores requires various degrees of milling to optimize energy consumption of the beneficiation operation. This is achieved by having the ore milled not finer than the optimum liberation required and to ensure that the liberated minerals are not milled any further as this tends to inhibit recovery. This is particularly true for gravity separation. The process becomes inefficient for particles smaller than 100 μm due to the force of flowing water being more dominant than that associated with gravity [2].
Modern quantitative mineralogical techniques i.e., automated scanning electron microscope (SEM)-based platforms such as the INCAMineral, Mineralogic, MLA, QEMSCAN and TIMA platforms ([26] and reference within) have allowed for the rapid collection of statistically significant mineralogical and textural data from geological and metallurgical samples. Application of the QEMSCAN and MLA platforms has however, been used more extensively (i.e., [27,28,29]). Lotter et al. [30] demonstrated that the application of automated SEM-based platforms in combination with laboratory scale metallurgical testing and plant trials can be used successfully to gain an intimate understanding of the metallurgical response of the ore.
Chromite mineralization occurs in the Uitkomst Complex but, in contrast to the chromitite layers of the Bushveld Complex, very few studies have been carried out. There is currently a lack of published process mineralogical studies on chromite from the Uitkomst Complex. The current study primarily focuses on chromite mineralization from the PCMZ as well as chromite from the MCHR for contrast, with specific emphasis on contrasting mineralogy, ore texture and the influence these parameters have on chromium recoveries.
In view of the lack of studies on the chromite from Nkomati, this study places emphasis on chromite recovery during progressive milling of chromite ores with different textures [30,31,32] using modern techniques such as the Mineral Liberation Analyser (MLA) in conjunction with laboratory scale metallurgical test work.
Benchtop flotation test work was performed on the PCMZ_MG, PCMZ_HG and MCHR ore using the same reagent scheme as described below as a pre-treatment step before processing by gravity separation. This was done to investigate the influence that the pre-flotation stage has on chromite recovery.
Metallurgical samples from the Nkomati PCMZ-Chrome and MCHR-Chrome washing plants were also collected and used as a baseline to evaluate the performances of the ore both at the plant-and laboratory scale.

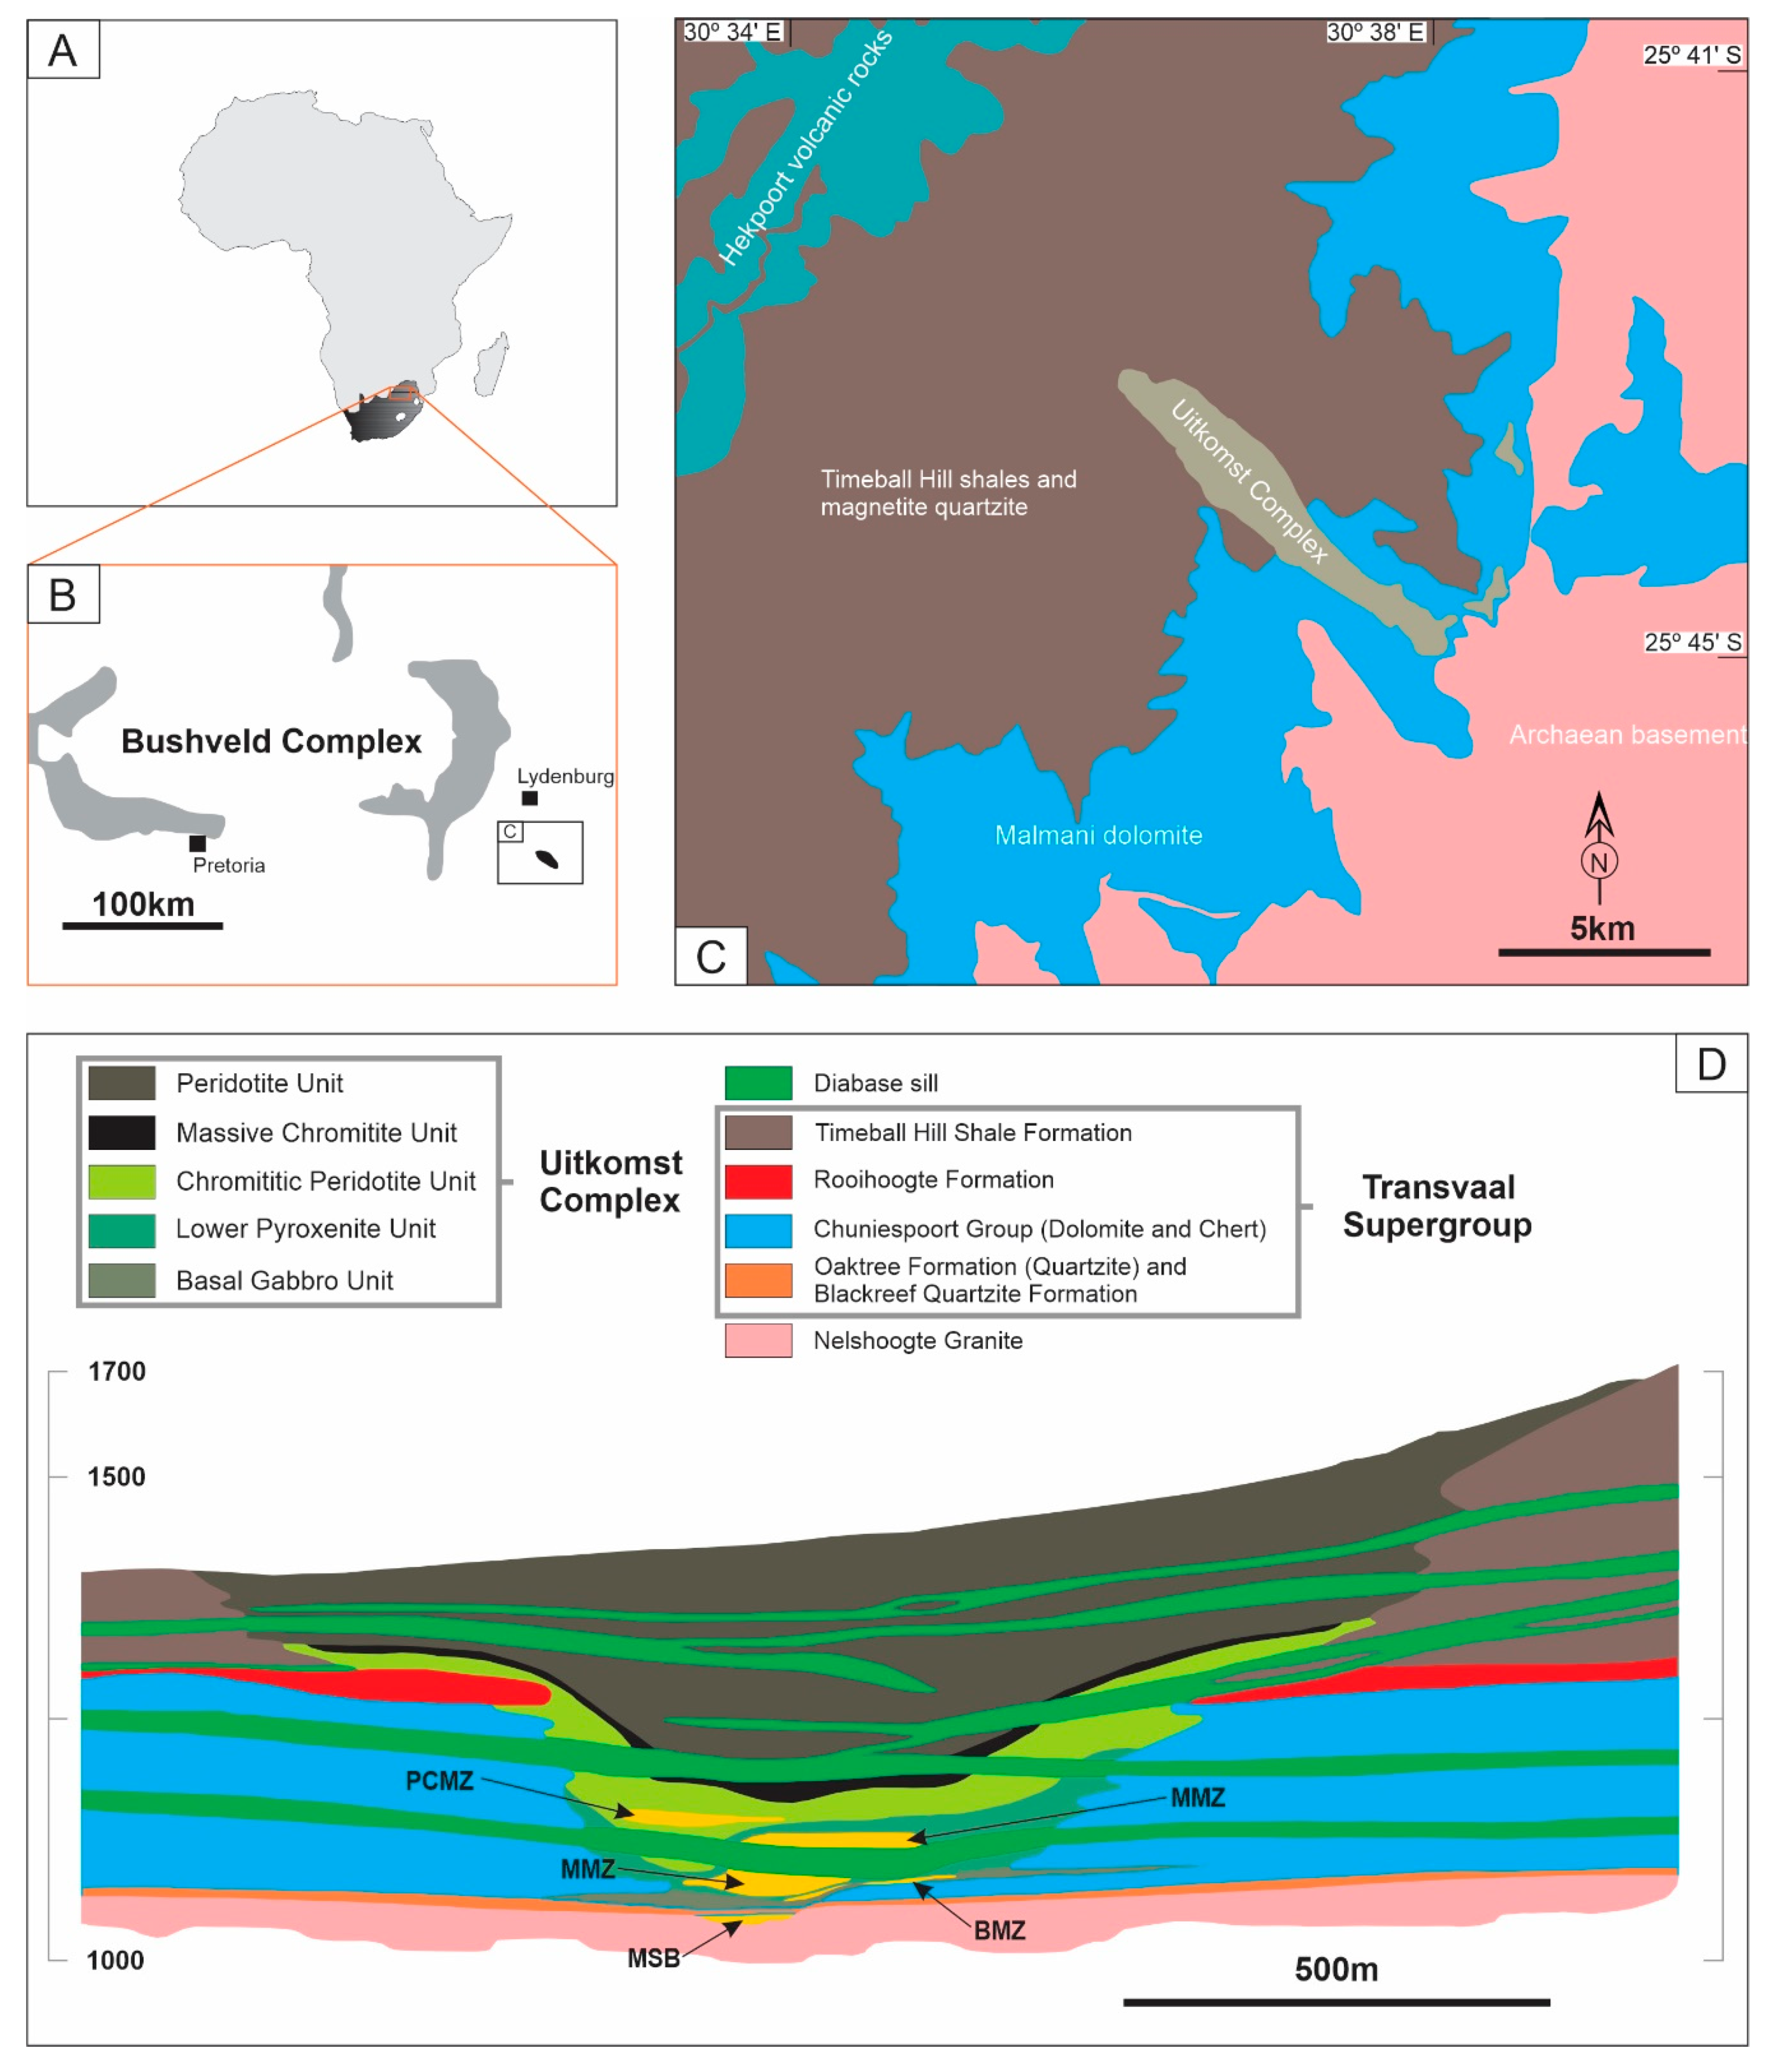
2. Geological Background

The Uitkomst Complex is a satellite intrusion of the Bushveld Complex [33,34]. It is a long tubular shaped (or chonolith, [34,35,36]) layered intrusion that hosts base-metal (Ni, Co, Cu and Cr) as well as platinum-group element (PGE) mineralization [37]. Nkomati Nickel mine, located on the Uitkomst Complex approximately 250 km due east of Pretoria, is currently the sole primary nickel producer in South Africa (Figure 1C, [34]). Although the Uitkomst Complex was described by Wagner [38], mining of the massive sulphide ore for its primary base-metal sulphide (BMS) and secondary PGE mineralization only began more than six decades later in 1996 [39]. The economically important mineralization is restricted to the base and lower parts of the intrusion and is distributed over five distinct orebodies mainly as lenses [39]. These being the Massive Sulphide Body (MSB) which occurs at the base of the intrusion, followed by the Basal Mineralized Zone (BMZ), the Main Mineralized Zone (MMZ), the Peridotitic Chromititic Mineralized Zone (PCMZ) and the Massive Chromitite (MCHR) which is stratigraphically the shallowest of the mineralized zones (Figure 1D).
The MSB has been mined out [34,40] with the BMZ currently being unexploited [40]. Since inception of the mining operation, previous studies of this deposit placed emphasis on the process mineralogy of the base-metal sulphide mineralization focusing on reagent and flotation optimization [41,42,43,44,45,46,47,48]. Similar studies focusing on chromite beneficiation at Nkomati nickel mine are currently lacking. With depletion of the massive sulphide mineralization, the PCMZ, although being a low-grade Ni ore deposit, also hosts chromite mineralization which adds value to the mining operation [49].
The geology of the Uitkomst Complex has previously been described by [34,36,37,39,50,51] and [52]. The Uitkomst Complex is host to one of the largest magmatic sulphide Ni-Cu-Cr-PGE deposits in South Africa [34]. It is a linear, tubular mafic–ultramafic intrusion that strikes in a northwest–southwest direction and dips 4° northwest [33] for at least 8 km and attains a thickness of 800 m [24]. The bulk of the intrusion occurs within the farms of Slaaihoek and Uitkomst in the South African province of Mpumalanga. A recent U-Pb zircon age of 2057.64 ± 0.69 Ma by Maier et al. [34] indicates that the Uitkomst Complex is coeval with the Bushveld Complex.
The Uitkomst Complex is composed of the Basal Gabbro unit at the base of the intrusion overlain by the Lower Harzburgite (Lower Pyroxenite Unit in Figure 1), followed by the Chromitiferous Harzburgite (commonly known as the PCR or Chromititic Peridotite unit), Main Harzburgite, Pyroxenite and a Gabbronorite unit that caps the intrusion [37,50]. Sulphide mineralization within the intrusion occurs as disseminated, net-textured, localized concentrations and massive textural varieties [37,50]. Nickel, Cu, PGE and Cr mineralization occurs within five discrete zones being: (1) the Massive Sulphide Body (MSB), (2) the Basal Mineralized Zone (BMZ), (3) the Main Mineralized Zone (MMZ), (4) Chromititic pyroxenite mineralized Zone or Peridotitic Chromitite Mineralized Zone (PCMZ) and (5) the Massive chromitite Unit (MCHR) (Figure 1D). Chromite from the PCMZ is disseminated within the host rocks. The chromite ores from the PCMZ are further classified on the basis of BMS grade and texture. These being the PCMZ medium grade (PCMZ_MG) and PCMZ high grade (PCMZ_HG) varieties. The PCMZ and the MCHR occur within the Chromititic Peridotite Unit. The PCMZ is rich in talc and highly altered, and is gradationally in contact with the underlying Lower Pyroxenite Unit which hosts the MMZ [39,50,51]. The contact between the PCMZ and the Lower Pyroxenite Unit is recognized by the first appearance of thin chromite bands or lenses with the PCMZ being restricted to the middle of the intrusion. The MCHR occurs at the top of the PCR and is oxidized.
During mining operations, only the MMZ and PCMZ are exploited at Nkomati nickel mine with the other orebodies being exhausted. The MMZ is exploited primarily for Ni with PGE as by-products and the PCMZ is exploited for Ni with PGE and chromium as by-products. The Nkomati Nickel mine is currently under care and maintenance due to lower nickel grades and price.

3. Technological Approach at Nkomati Nickel Mine

The Nkomati Nickel mine is a 50:50 joint venture between African Rainbow Minerals and Noril’sk Nickel. Ores from the MMZ and the PCMZ are mined from open pit and underground operations and are processed separately through two concentrator plants (i.e., the MMZ and PCMZ concentrator plants) to recover base-metal sulphides through bulk froth flotation. The feed for the PCMZ-BMS concentrator plant comprises of a blend of PCMZ_MG and PCMZ_HG ores. Ore feed for the MMZ has a cut-off grade of 0.3% Ni, with the ore being autogenously milled to a target grind of 67% of the ore by mass passing a particle size of 75 μm (P67 of 75 μm). For the PCMZ-BMS concentrator plant the cut-off grade is 0.25% Ni and the ore is milled to a target grind of 80 wt% passing 75 μm (i.e., 80% of the ore by mass passing a particle size of 75 μm or P80 of 75 μm).
The chromite-rich tailings from the PCMZ-BMS flotation circuit are subsequently reticulated as feed into the PCMZ-Chrome plant to recover chromite as a by-product to add further value to the operation. The MCHR is also processed separately to concentrate chromite in the MCHR-Chrome plant (or Chrome Washing Plant, CWP), with both concentrator plants employing spiral gravity concentrators. The target grind for the MCHR-Chrome plant is the same as that of the PCMZ-Chrome plant (80 wt% passing 75 μm, or P80 of 75 μm). Two cleaning circuits are used for both the PCMZ-and MCHR-Chrome plants, with Cr2O3 grades ranging from 17–50% being considered economical. The chromite ore is processed through a rougher spiral concentrator circuit with the primary rougher concentrate from the roughers sent to the cleaner circuit to produce the final concentrate. The middlings from the primary rougher circuit are reticulated into a scavenger cleaner spiral circuit as well as a scavenger re-cleaner.

4. Materials and Methods

4.1. Samples

Sampling of geological samples for this study was based primarily on the textural varieties of base-metal sulphide and chromite mineralization found at the Nkomati nickel mine. This classification is the convention used at Nkomati Nickel mine based on the Ni-Cu-Co-PGE ore, refer to [47]. On this basis, three representative geological samples consisting of PCMZ_MG, PCMZ_HG and MCHR ores were collected. A minimum mass of 40 kg for each ore type was collected, after textural classification, 12 kg of each ore type was selected for further study.
Three metallurgical samples weighing 4 kg each were representatively collected from each chrome plant, these being the feed (F), concentrate (C) and tailings (T) for a total of six samples for the PCMZ disseminated chromite ore type and the massive chromitite (MCHR) ore type. The masses and descriptions of all the samples collected can be found in Table 1 below.

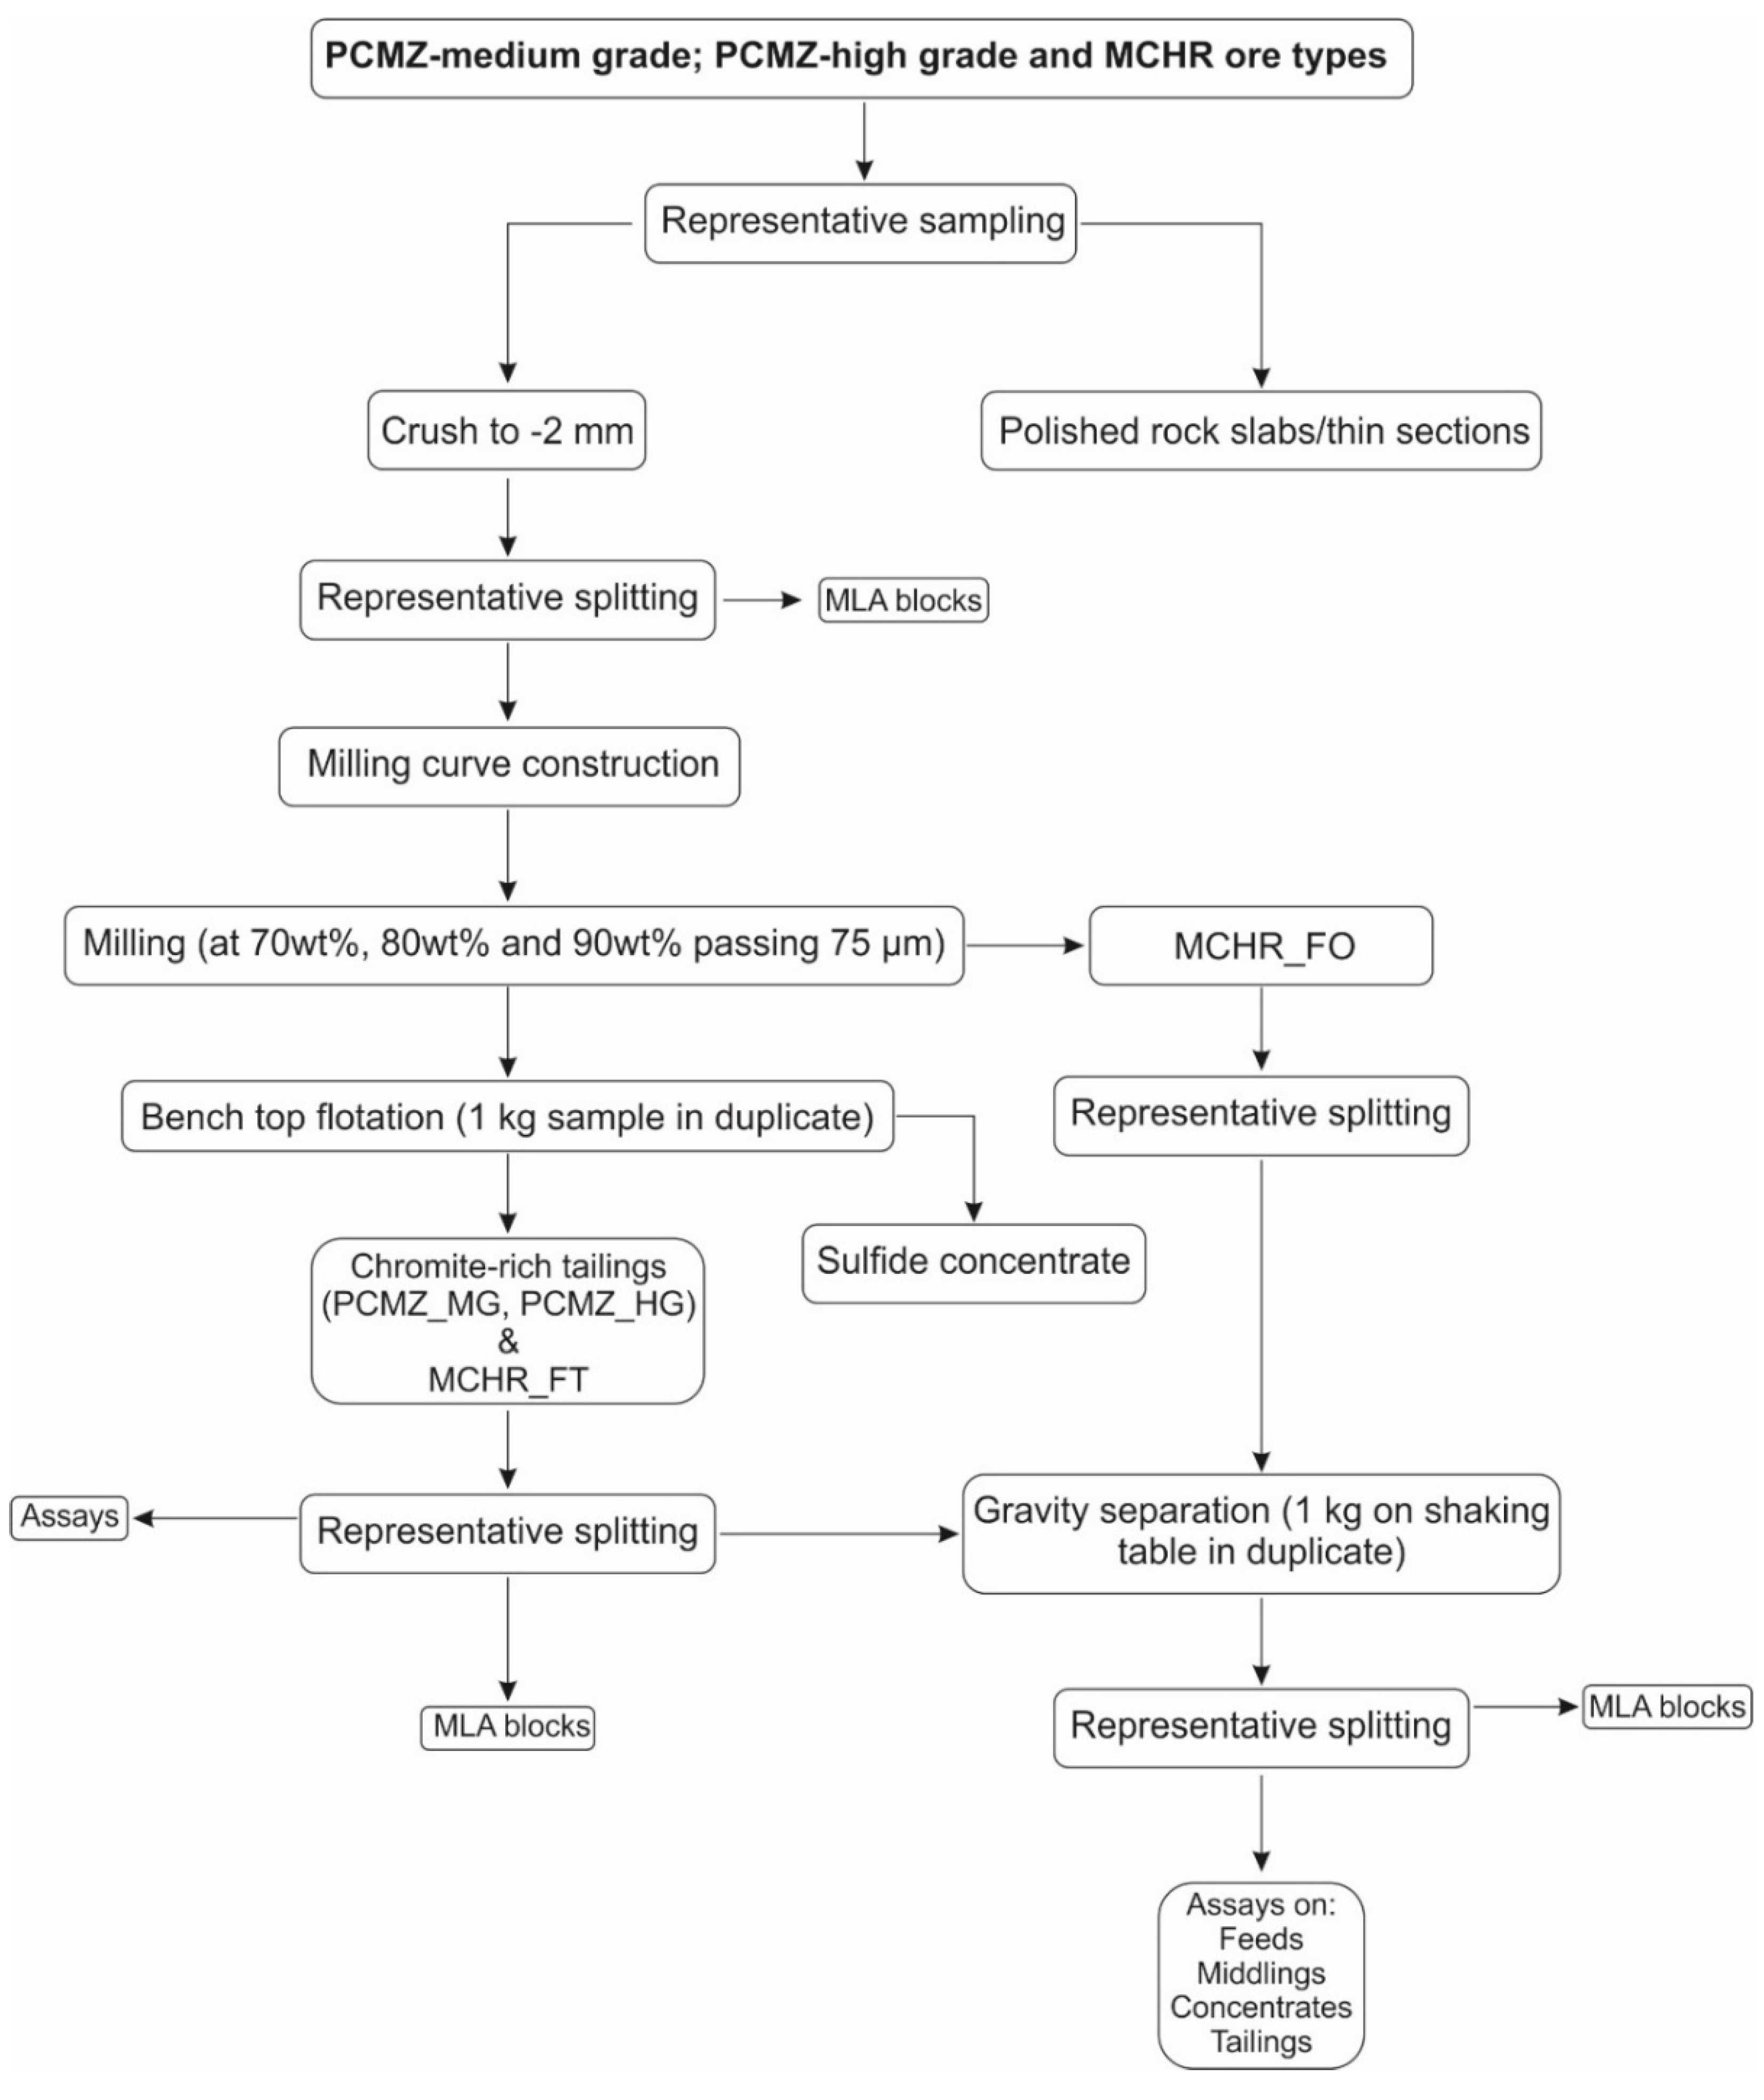
4.2. Experimental Procedure

Thin sections were prepared from the geological samples for petrographical studies with emphasis on the textural differences of chromite across the samples. The geological samples were then processed as shown in Figure 2. This included crushing the samples to 100% passing 2 mm (unprocessed ore) and splitting into 1 kg aliquots. Milling curves were constructed [53]. Three target grind sizes were selected for this study. The target grind employed at the mine (i.e., P80 of 75 μm), was selected for comparison along with a coarser and finer grind relative to this. These being, P70-, P80- and P90 of 75 μm. In a P70 of 75 μm target grind, 70% of the particle sizes are smaller than 75 μm. The milling times required to achieve these target grinds were determined from the milling curves.
The PCMZ_MG, PCMZ_HG and MCHR samples were then subjected to rougher benchtop flotation at the three target grinds in duplicate on 1 kg samples. The reagent suite and dosages used for the benchtop flotation test work for the recovery of the sulphides can be found in the Table 2.
The rod mill configuration and milling procedure can be found in Dzvinamurungu et al. [53] and references within.
The flotation tailings from the PCMZ_MG, PCMZ_HG were subsequently treated on a Wilfley shaking table. For the MCHR ore one set of samples was pre-treated with benchtop flotation (referred to as MCHR_FT) followed by gravity separation on the Wilfley shaking table at the three target grind sizes. Another set of MCHR samples (referred to as MCHR_FO) were milled to the three target grind sizes and treated on the Wilfley shaking table without a pre-flotation treatment stage.

4.2.1. Flotation Test Work

Laboratory benchtop flotation test work was conducted using a 2.5 L flotation cell mounted on a Denver laboratory flotation test machine. A slurry was made up to 35% solids by adding a further 1.36 L of water.
The flotation reagents, addition sequence, and conditioning times used in this study are shown in Table 2. The impeller speed was set at 1100 rpm. A froth depth of 2 cm and a scraping depth of 0.5 cm above the slurry level, after the impeller and armature of the Denver flotation machine (located at the Mineral Processing and Technology Research Centre (MPTRC), Doornfontein Campus of the University of Johannesburg, Gauteng, South Africa) were lowered into the cell, was maintained throughout the flotation process. Concentrates were collected at 15 s intervals for 1 min (concentrate 1 or conc1), 2 min (conc 2), 7 min (conc 3) and 20 min (conc 4) for a total elapsed time of 30 min. Flotation was carried out in duplicate. Although the results of the flotation test work are not reported here, this section is included for completeness. Pre-flotation of the MCHR ore was performed to assess recovery of Cr2O3 relative to the MCHR_FO ore and to explore the possibility of blending the PCMZ and MCHR ores.

4.2.2. Gravity Separation

Flotation tailings from the PCMZ_MG, PCMZ_HG and MCHR ores at the different grind sizes were dried at 110 °C in an oven, combined and split into representative 1 kg splits using a rotary splitter.
These were then subjected to gravity separation using a Wilfley wet shaking table [22,54,55,56,57] housed at the MPTRC, Gauteng, South Africa. Gravity concentration was carried out in duplicate.
In addition, representative splits of the chromitite samples from the MCHR unit were milled to the three target grinds described previously (i.e., P70-, P80- and P90 of 75 μm) and were not treated with a pre-flotation stage. A 1 kg aliquot of each sample at the different grind sizes was subsequently subjected to gravity concentration in duplicate using a Wilfley wet shaking table. The operating parameters were as follows: deck or table slope angle (Ø) = 4 degrees, table speed or number of strokes per minute = 200, stroke length = 5 mm, inter riffles gap = 12 mm, riffle height = 5 mm, slurry density = 20% solids by weight, water flow rate = variable, but slurry density kept constant; feed rates: variable, depending on specific ore throughput. Concentrate, middling and tailing samples were collected for each feed type, and the concentrates analysed and their assay results determined.

4.3. Analytical Methods

Three round 30 mm MLA mounts were prepared per grind size from the flotation tailings of the PCMZ_MG, PCMZ_HG and MCHR ore types. Vertical MLA mounts were prepared to account for particle settling that occurs during the curing stage of the epoxy resin. Graphite (milled to 100% passing 63 μm) in a 50:50 ratio with the sample was also added for particle separation and mixed with the epoxy resin. Further details can be found in Lougheed et al. [58] and references therein. The modal mineralogy of the unprocessed ore (−2 mm crush) was also determined by preparing three 30 mm MLA mounts for each ore type. These were analysed with an FEI 600F MLA [28,29] housed at the University of Johannesburg’s Central Analytical Facility, SPECTRUM, Gauteng, South Africa. A minimum of 10,000 particles per 30 mm MLA mount were analysed. Quantitative mineralogical data was acquired from the samples by the MLA and included modal mineralogy, grain size distributions, liberation as well as density data of chromite.
Three Round 30 mm MLA mounts per ore type were prepared for the six metallurgical samples collected from the two Chrome plants at Nkomati. Their quantitative mineralogical data was obtained using the MLA with the GXMAP and SPL_GXMAP routines [28,29]. No stereological corrections were applied to the data; however, the MLA Dataview software suite expresses the data as an equivalent circle diameter.
Thin sections of the three ore types investigated in this study were examined using a Tescan VEGA 3 LMU scanning electron microscope equipped with an Oxford Instruments X-max 20 mm2 Silicon Drift EDS detector housed at SPECTRUM, which is the University of Johannesburg’s central analytical facility. The operating parameters of the SEM are as follows: a spot size of 230 nm and an acceleration voltage of 20 kV with a beam intensity of 14 at a working distance of 15 mm and an emission current of 140 μA.
Chromite chemistry was recorded using a CAMECA SX 100 housed at SPECTRUM using the operating conditions described by Yudovskaya et al. [36].
Representative splits of between 75 g and 100 g were sent to Intertek laboratories in Australia for Co, Cr, Cu, Fe, Ni and S elemental analysis of the feeds, concentrates, middlings and tailings from the laboratory scale metallurgical test work as well as the −2 mm crush. Cobalt, Cr, Cu, Fe, Ni and S were recovered by the zirconium crucible fusion process and hydrochloric acid dissolution and quantitatively analyzed using the inductively coupled optical emission spectroscopy (ICP-OES) technique. However, only the Cr assay data are reported in Table 4, as this is the element of interest.

5. Results

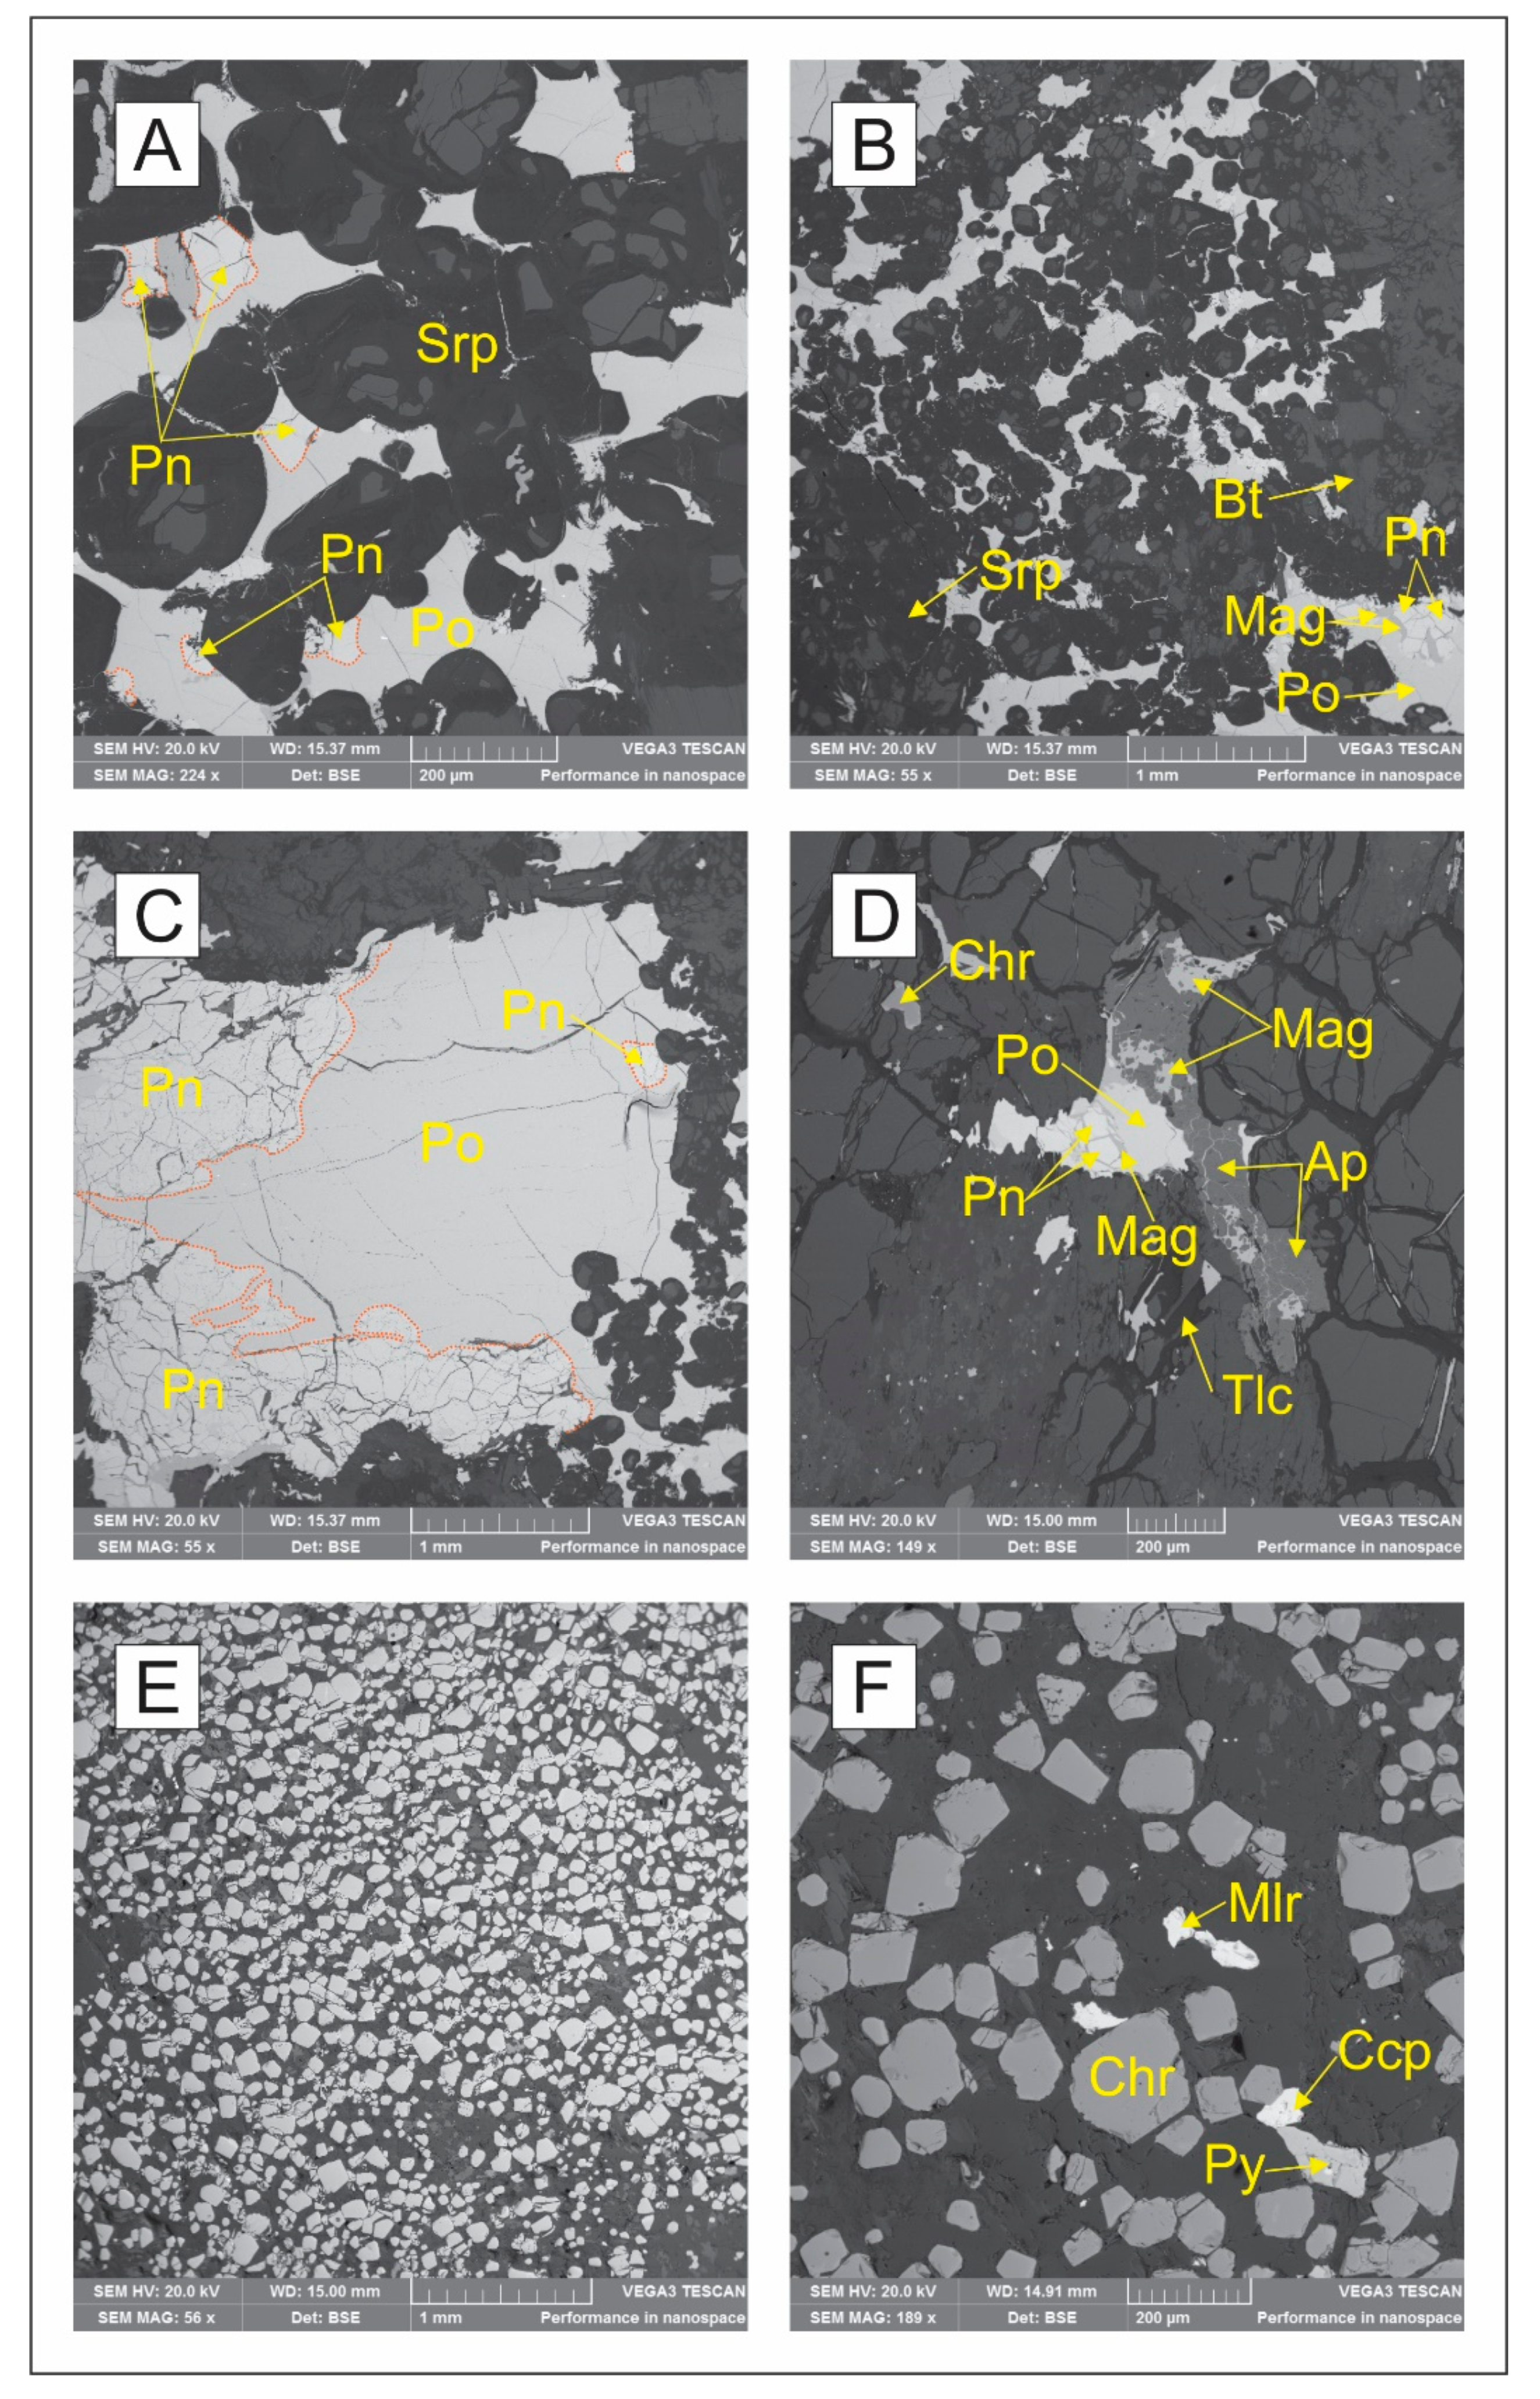
5.1. Mineralogy and Textures

All three ore varieties from the PCR (i.e., PCMZ_HG, PCMZ_MG and MCHR) contained similar mineral assemblages contrasted by variable modal abundances of the major minerals between the different ore types. Chromite, clinopyroxene, orthopyroxene, chlorite and serpentine were the major minerals found within the ore types of interest. The major BMS found in both the PCMZ_MG and PCMZ_HG as well as the MCHR ore were pyrrhotite and pentlandite with lesser chalcopyrite and pyrite. The modal abundances of the different ore samples are discussed in Section 5.4.
Large poikilitic crystals (reaching a maximum size of 3 mm) of orthopyroxene enclosing olivine and chlorite were common within the PCMZ_HG and PCMZ_MG ores. Pervasive alteration of pyroxene to chlorite commonly occurred along the edges and fractures of pyroxene. The BMS (which can be larger than 10 mm) and chromite occurred interstitial to the silicates. Veins of BMS were observed to occur in chromite cracks. The individual ore types will be briefly described below.
The PCMZ_HG ore variant contained higher modal abundances of coarser orthopyroxene, clinopyroxene and a network of BMS interstitial to the silicates. The chromite grains were commonly subhedral, averaging 65 μm in size and were disseminated throughout this unit. Base-metal sulphides most commonly occurred as a core of pyrrhotite with a rim of pentlandite [59]. Replacement of BMS by silicates was observed. Cuspate chromite grains can contain inclusions of pyrrhotite and pentlandite as well as amphibole. Base-metal sulphide mineralization also occurred within the cleavage planes and cracks of biotite.
The PCMZ_MG variant had a similar texture and modal abundance of minerals as that of the PCMZ_HG although this ore was pervasively altered as seen by the appearance of apatite and magnetite that replaced pyrrhotite as well as the replacement of BMS by talc (Figure 3D). The BMS were not as coarse-grained as in the PCMZ_HG and were also less abundant relative to the PCMZ_HG.
The MCHR ore was comprised largely of subhedral to sub-rounded chromite grains that were enclosed in a network of altered fibrous chlorite and serpentine. Chromite grain sizes varied from less than 22 μm to over 1 mm with average sizes that ranged from <36 μm to 180 μm. The chromite grains were commonly not densely packed with BMS occurring interstitial to chromite within a matrix of chlorite and serpentine. Base-metal sulphide mineralization made up less than 1% by volume and was interstitial to chromite and commonly found where the chromite grains were loosely packed (Figure 3E,F). Millerite and pyrite were commonly found within the MCHR.

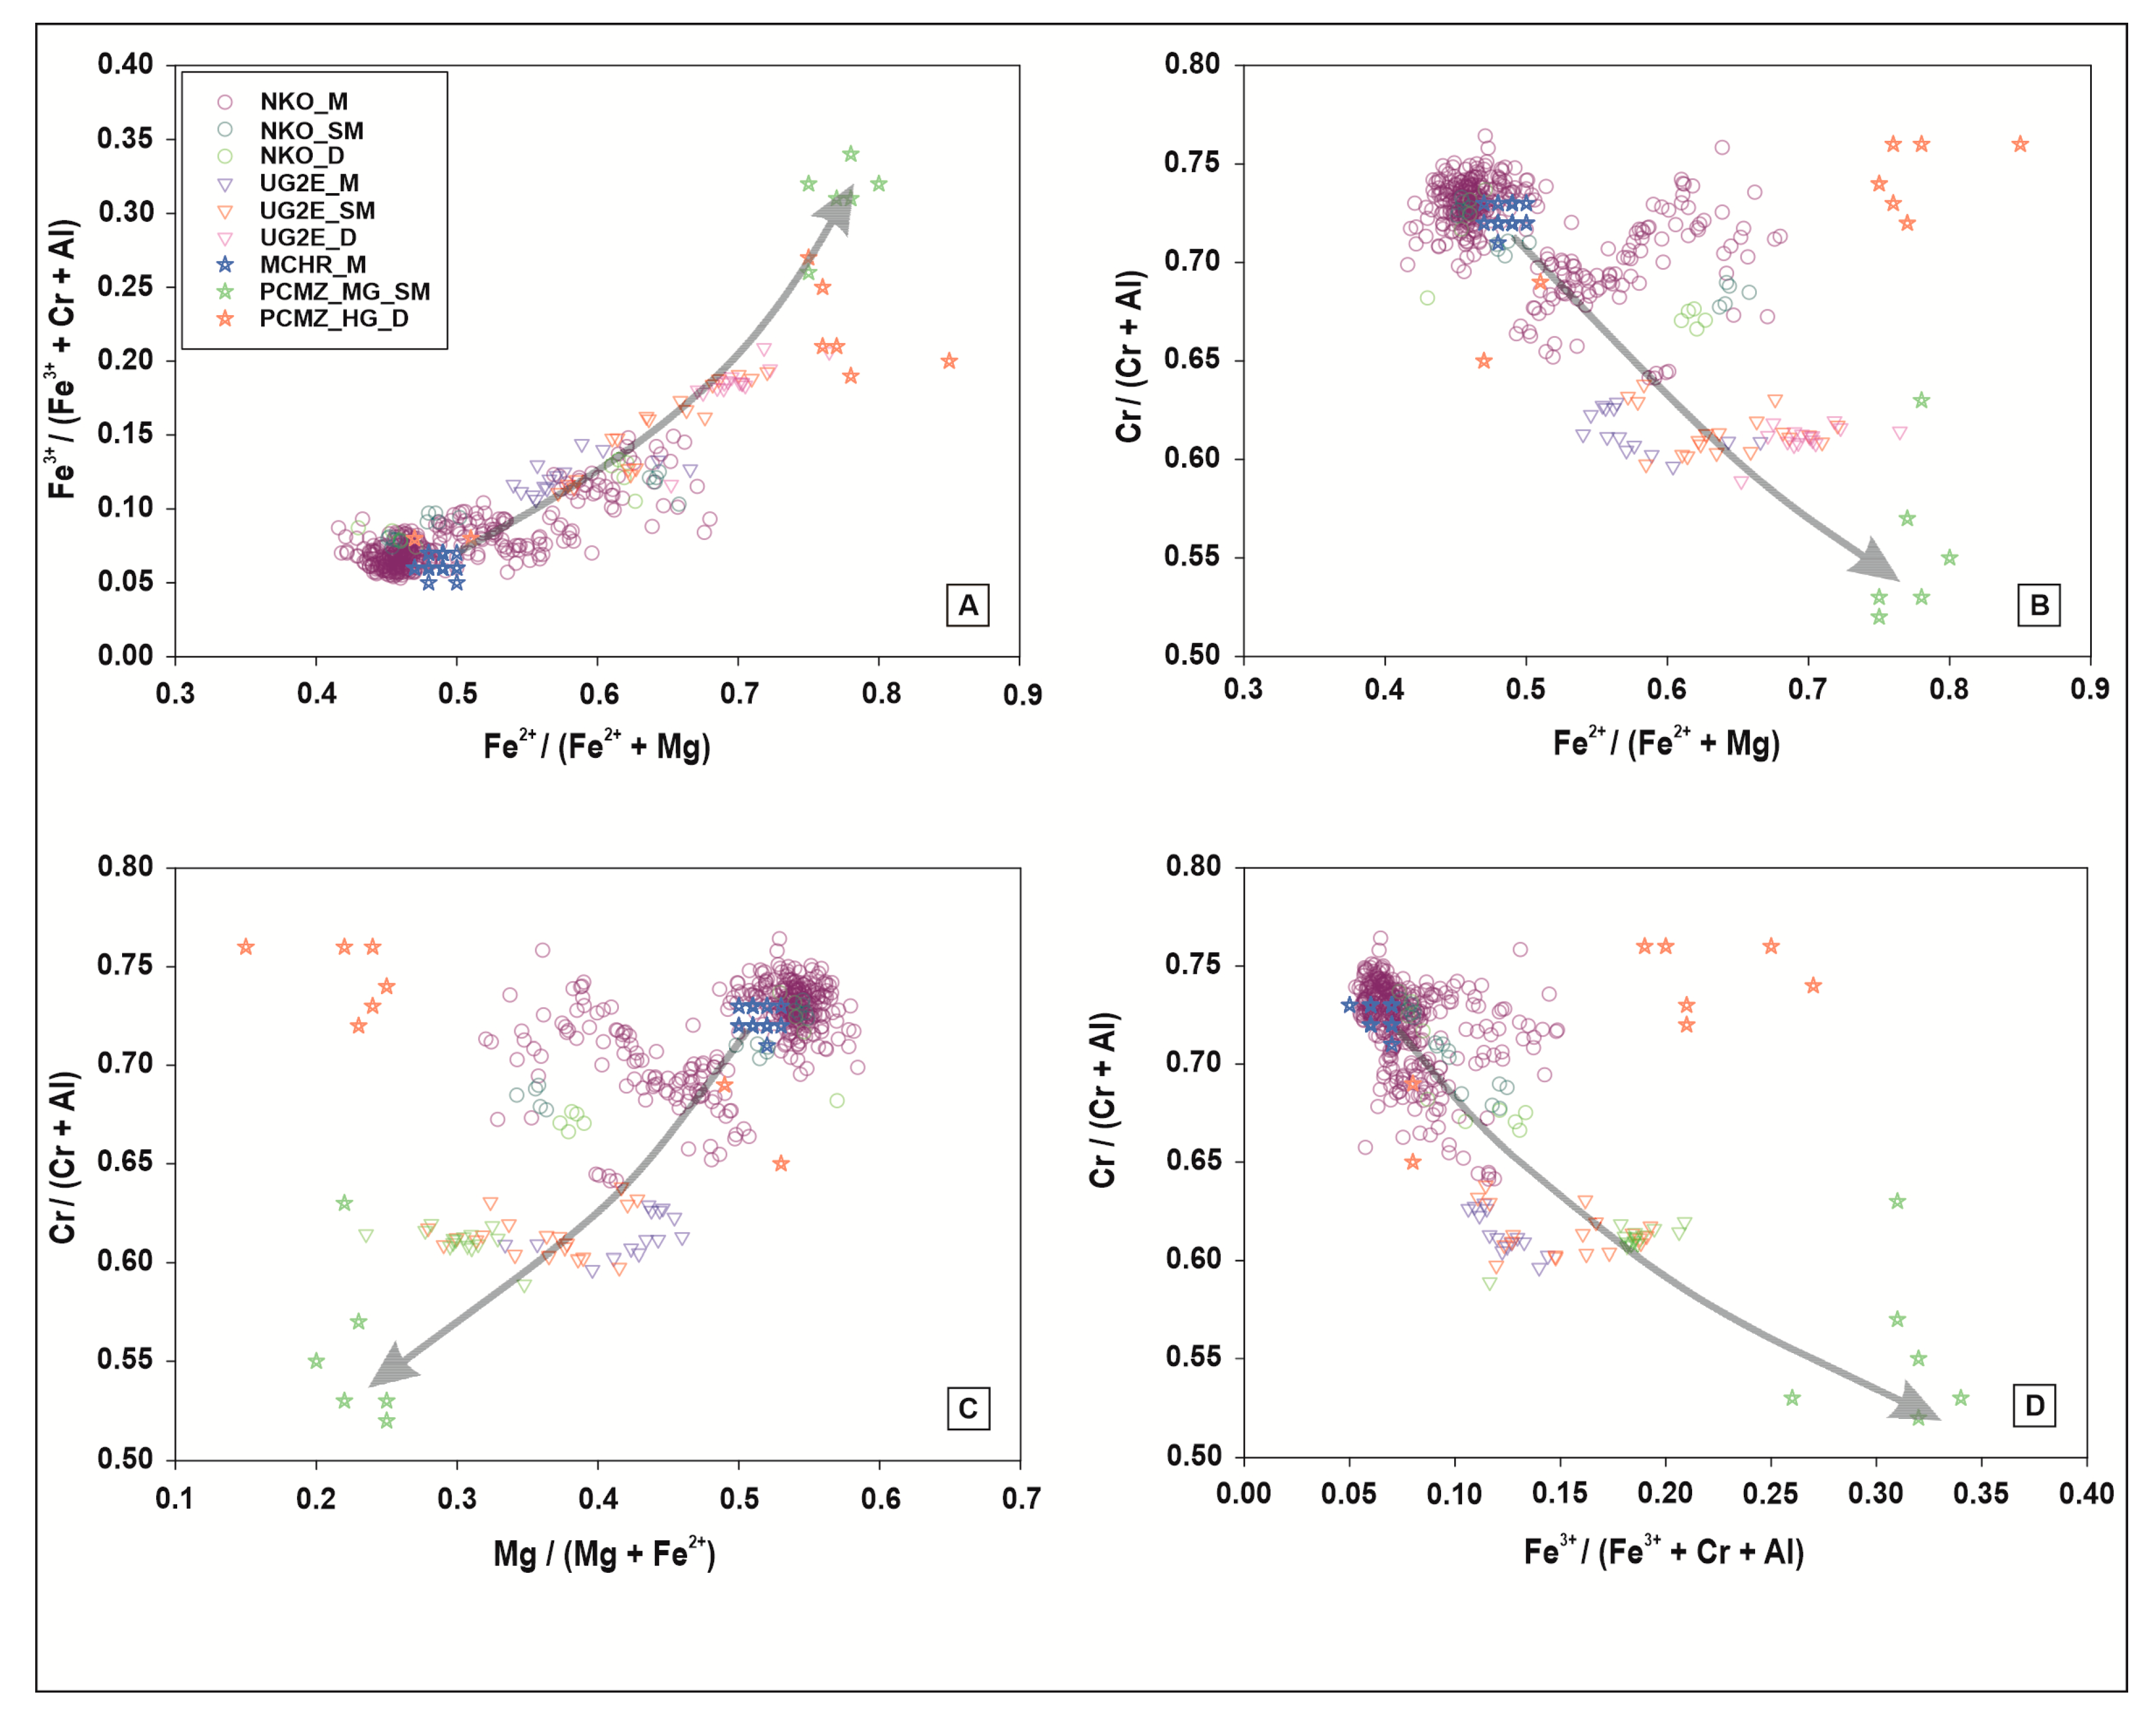
5.2. Chromite Chemistry

The chromite chemistry was determined by analyzing chromite grains in thin sections using a CAMECA SX 100 electron microprobe. Variation in composition occurs between the chromite found in the massive type ores (i.e., MCHR) versus that found in the disseminated type (PCMZ_MG and PCMZ_HG). The general trend is a decrease in the Cr#(Cr/(Cr +Al)) from chromite found in the massive ore to the disseminated ore types in the direction of the arrow in Figure 4. The Mg# (Mg/(Mg + Fe2+)) was highest in the chromite found in the massive ore and decreased in the chromite found the disseminated ores (see Figure 4).
These trends are consistent with those recorded from the Uitkomst Complex and Northern Limb of the Bushveld Complex [21,36]. The chromite chemistry evolved from being Cr-rich in the massive ores to being more iron-rich in the disseminated ore types. This is consistent with a decreasing Cr/Fe ratio from the massive ore to disseminated ore types (Figure 5).

5.3. Metallurgical Test Work

5.3.1. Milling Curves

The particle size distributions for the milling curve construction are not included here for the sake of brevity. These can however, be determined from Table 3 which records a percentage of the weight fraction passing 75 μm based on a 1 kg sample. The times required to mill the PCMZ_MG; PCMZ_HG and MCHR ores to the three target grind sizes selected for this study (i.e., P70-, P80- and P90 of 75 μm) were calculated from the milling equation in Table 3 which is derived empirically from the milling curves. The PCMZ_HG ores required the longest milling times, (ranging from 34 min for the coarsest grind to 50 min for the finest grind i.e., P70- and P90 of 75 μm, respectively) followed by the PCMZ_MG (20 to 44 min) with the MCHR requiring the least milling time (17 to 38 min).

5.3.2. Gravity Separation Test Work

The mass pull or recovery of the concentrates from the gravity separation test work performed on the Wilfley shaking table can be found in Table 4. The flotation tailings samples used as feed for the Wilfley shaking table from the PCMZ_MG and PCMZ_HG ores indicate that the highest mass pull recoveries were obtained at a target grind of P80 of 75 μm. For the MCHR_FT sample, the best recoveries were obtained at a target grind of P90 of 75 μm. The MCHR_FO achieved the best mass pull recoveries at a grind of P80 of 75 μm.

5.3.3. Assays and Recoveries of Chromite

Assay results for the different mill streams of the PCMZ_MG, PCMZ_HG, MCHR_FT and MCHR_FO at the selected target grinds based on the laboratory metallurgical test work can be found in Table 4. The PCMZ_MG and PCMZ_HG flotation tailings treated by gravity separation indicate that the best Cr2O3 recovery and grade was achieved at the coarse grind (P70 of 75 μm) with the grade and recoveries decreasing with successive milling.
The MCHR_FT ore recorded better Cr2O3 recoveries and grades than the MCHR_FO sample. The MCHR samples also recorded the best grades and recoveries with successive milling with the finest grind (P90 of 75 μm) recording the best recoveries in both the MCHR_FT and MCHR_FO samples. In general however, the MCHR_FT samples recorded better Cr2O3 grades and recoveries than the MCHR_FO samples.

5.4. Quantitative Mineralogy: Modal Mineralogy and Chromite Grain Size Distributions

5.4.1. Modal Mineralogy

The modal mineralogical abundances for the unprocessed ore, laboratory-scale metallurgical, and plant-scale metallurgical samples for the three ore types of interest in this study can be found in Figure 6. The modal abundances are reported as area %.
All three ore types comprised of variable abundances of, silicates (amphibole, chlorite, clinopyroxene, olivine, feldspar, orthopyroxene, mica, quartz, and serpentine); carbonates (calcite and dolomite); BMS (chalcopyrite, pentlandite, pyrrhotite and pyrite), chromite and magnetite. Chromite, chlorite, amphibole and pyroxene (both clinopyroxene and orthopyroxene) were, however, the most abundant minerals in the unprocessed ore. Chromite abundances in the unprocessed ore ranged from 10% to 23% in the PCMZ_HG and PCMZ_MG ore types, respectively, and 63% in the MCHR ore.
The benchtop flotation tailings stream samples were the feed samples for the gravity separation processing stage (shaking table feed). The chromite abundance in the flotation tailings (shaking table feed) increased to 65% and 64% in the PCMZ_MG ores at a target grind of P70- and P80 of 75 μm, respectively, from an abundance of 23% in the unprocessed ore. The chromite abundance at the finest grind (P90 of 75 μm), was lower than the P70- and P80 of 75 μm target grinds with an abundance of 18%. For the PCMZ_HG flotation tailings the chromite abundance decreased with increased milling from 10% in the unprocessed ore to 5% at the coarsest grind, and increased to 8% at a target grind of P80 of 75 μm and 6% at P90 of 75 μm.
For the MCHR_FT sample, there was an increase in chromite abundance with increased milling. The chromite abundance ranged from 31% for the coarsest grind to 64% in the finest grind. The MCHR_FO samples indicate that the chromite abundance decreased with increased milling. The chromite abundance increased to 67% at the coarsest grind and decreased to 31% at a grind of P80 of 75 μm and increased to 63% at P90 of 75 μm.
Overall, the laboratory-scale concentration of the chromite on the Wilfley table shows an upgrade in the chromite abundance from the feed into the concentrates with the exception of the concentrate of the MCHR ore with a grind of 80 wt% passing 75 μm, which decreased somewhat from 40% in the feed to 39% in the concentrate. The PCMZ_MG middlings samples contained significant abundances of chromite in the P70- and P80 of 75 μm target grinds.
The plant PCMZ concentrator plant chromite feed abundance (consisting of a blend of PCMZ_MG and PCMZ_HG ores) was similar to that of the unprocessed PCMZ_MG ore, with both having a chromite abundance of 23%. The chromite abundance in the PCMZ concentrator plant concentrate increased to 72% and 13% in the tailings. For the MCHR ore, the feed chromite abundance was 51% and was upgraded to 66% in the concentrate and 20% in the tailings.

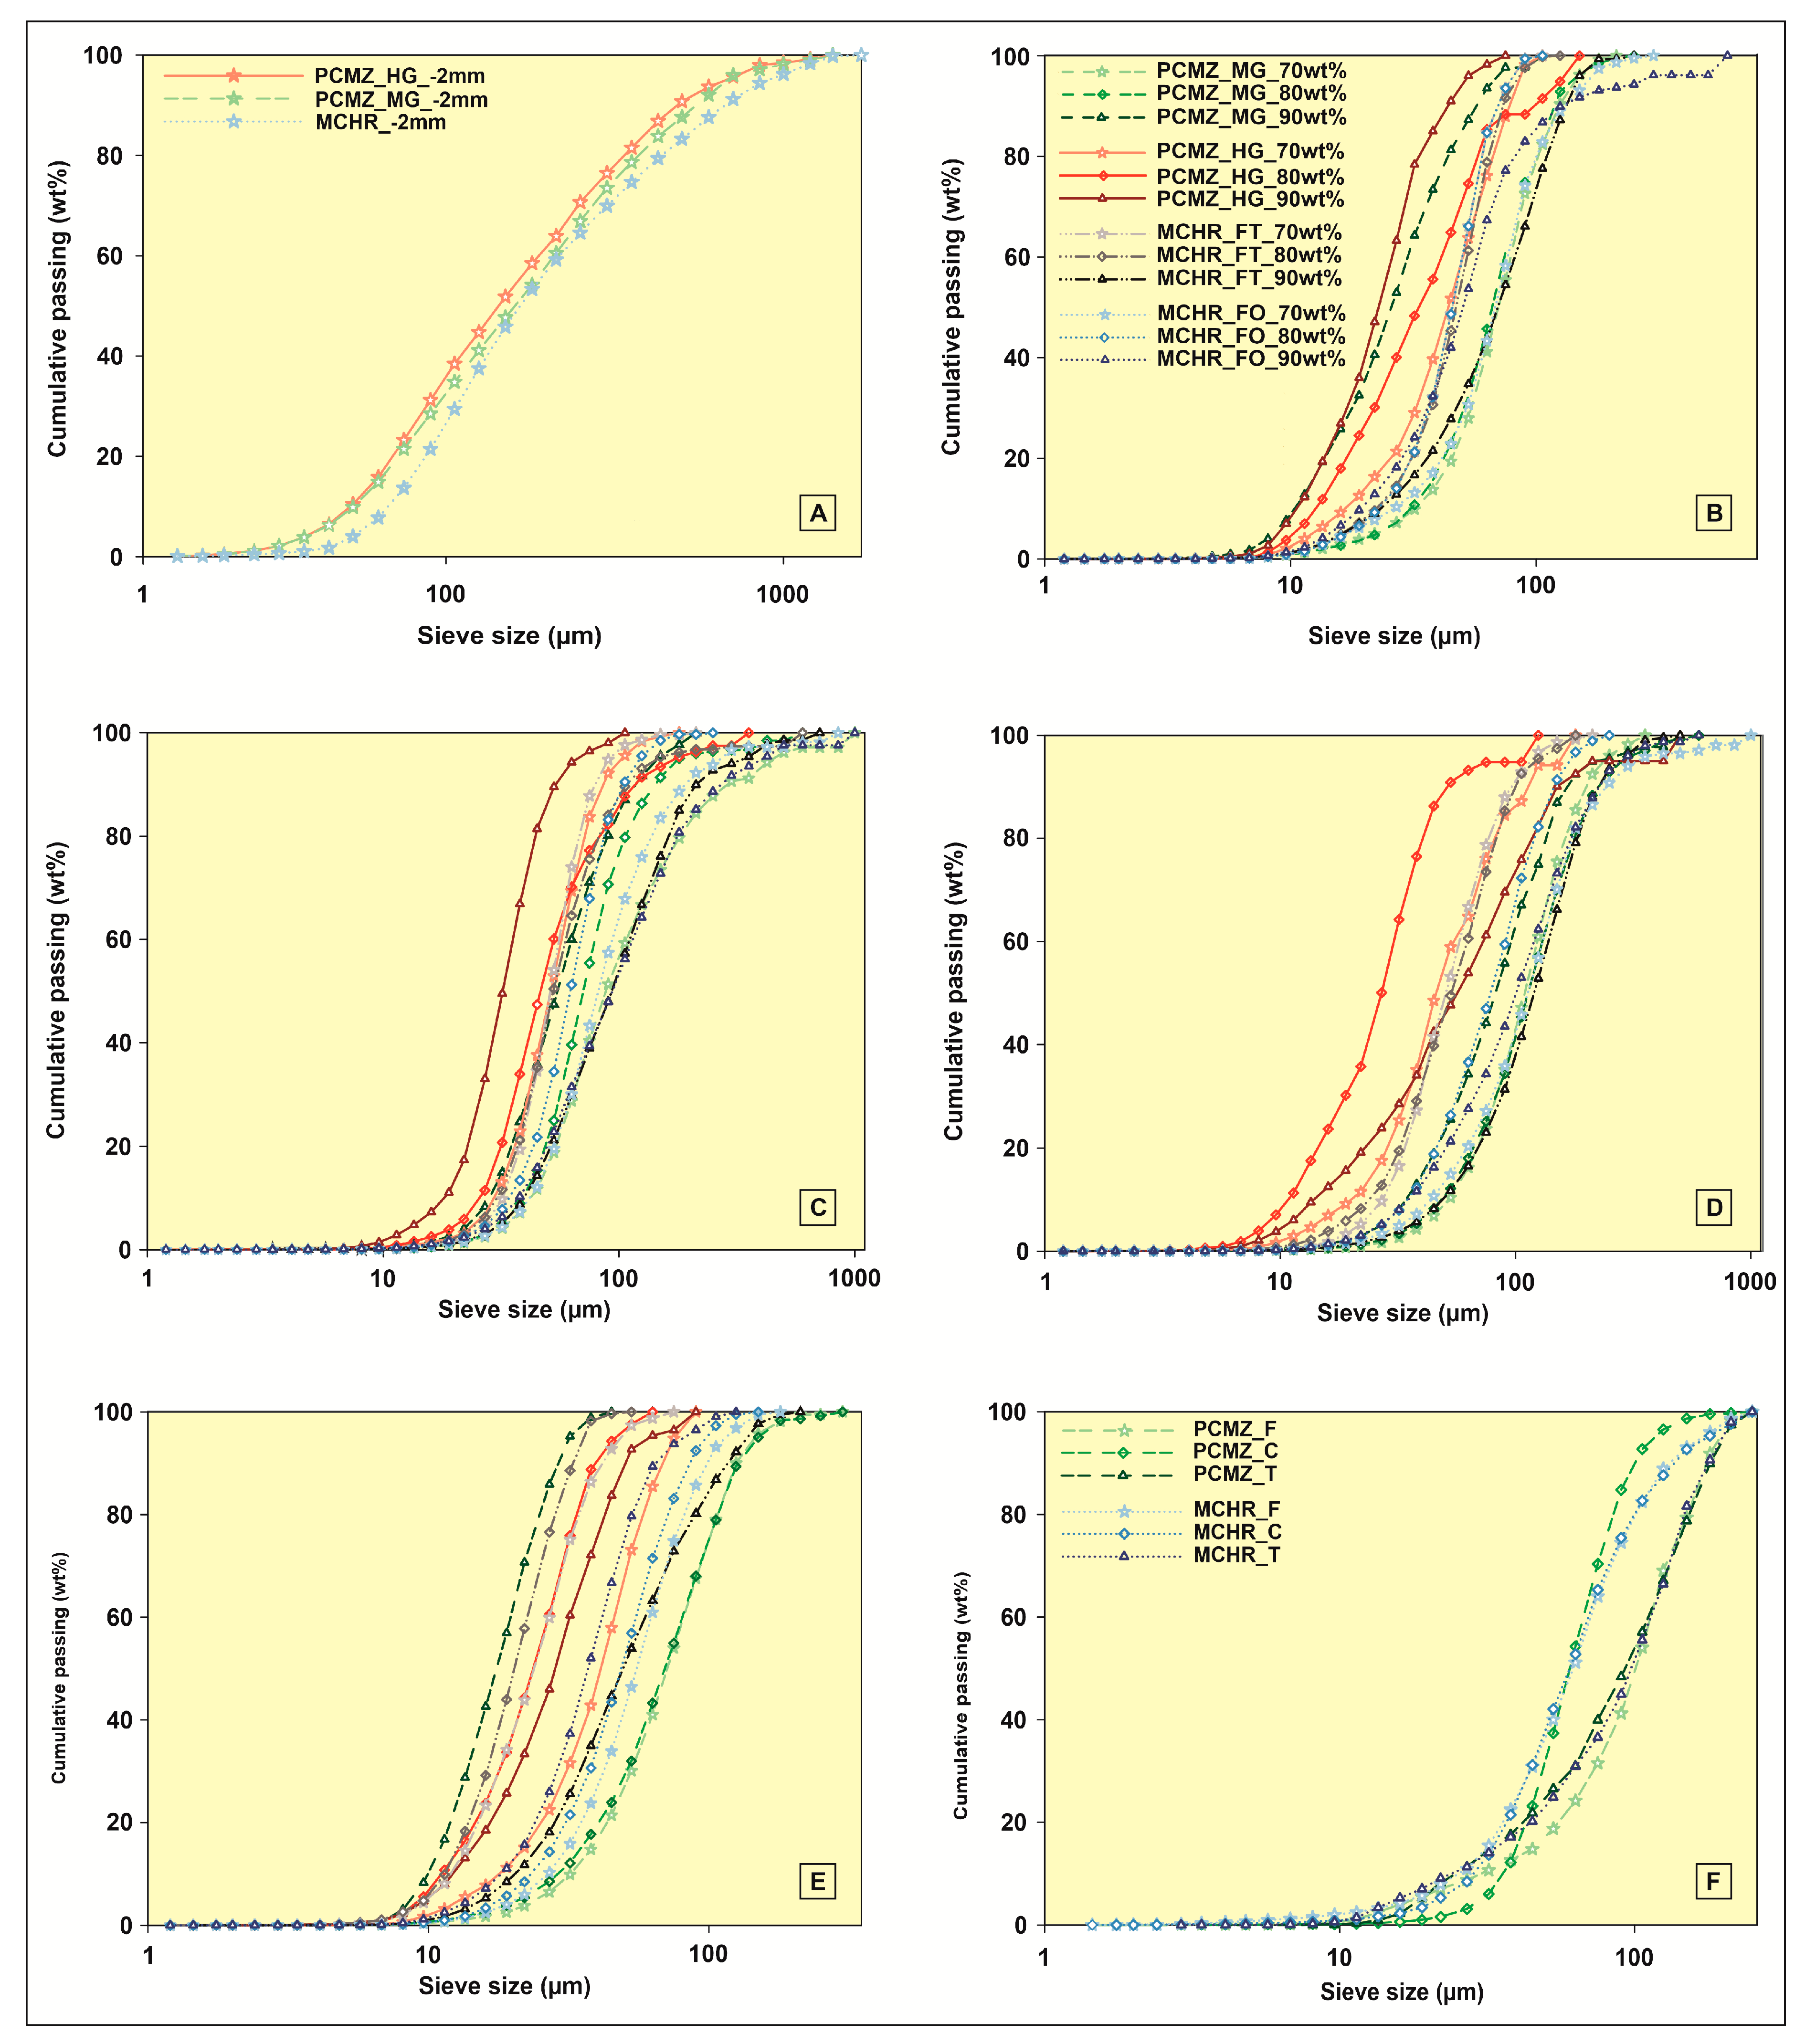
5.4.2. Chromite Grain Size Distributions

Chromite grain size distributions for the three ore types at the three target grinds can be found in Figure 7. The data is reported at a cumulative passing of 80 wt%. In the unprocessed ores the chromite grain sizes ranged from 477 to 576 μm for the PCMZ_HG and MCHR, respectively, with the PCMZ_MG ore having a chromite grain size of 515 μm.
Tracking of the chromite grain sizes in the different streams from the shaking table broadly indicates that there was an increase in size from the feed to middlings. The PCMZ_MG and PCMZ_HG chromite grain sizes from the shaking table feed samples show a decrease with increased milling from 107- to 58 μm and 74- to 47 μm, respectively, from the coarsest grind (P70 of 75 μm) to the finest grind (P90 of 75 μm).
The MCHR_FT ore shaking table feed samples indicate that the chromite grain sizes did not decrease with successive milling. At a grind of P70 of 75 μm the chromite grain sizes were 70 μm and successively increased to 72 μm and 139 μm at the P80- and P90 of 75 μm grinds, respectively. For the MCHR_FO ore feed samples, the chromite grain sizes decreased from 100 μm to 70 μm for the P70- to P80 of 75 μm grinds, respectively, and increased to 82 μm at the finest grind.
Chromite grain sizes in the concentrate collected from the shaking table indicate that for the PCMZ_MG ore there was a decrease with successive milling. For the other ore types the chromite grain sizes in the concentrates tended to increase with successive milling. The MCHR_FO sample contained chromite grain sizes that ranged from 225 at P70 of 75 μm and decreased to 84 μm at the P80 of 75 μm grind and increased to 325 μm in the P90 of 75 μm grind for the shaking table concentrates.
The middlings and tailings samples also did not record any relationship between chromite grain size and successive milling. Overall the chromite grain sizes tended to increase with successive milling in the middlings samples. In the tailings samples the chromite grain sizes tended to decrease from the P70- to P80 of 75 μm grinds and increase at the finest grind with the exception of the MCHR_FO sample which showed a progressive decrease in the chromite grain sizes with increased milling.
Tracking of the chromite grain sizes in the metallurgical samples from the concentrator plants indicates similar trends as those described for the laboratory-scale metallurgical samples. In the PCMZ chrome plant the chromite grain size in the feed was 160 μm and decreased to 84 μm in the concentrate and increased to 167 μm in the tailings.
A similar trend was observed from the MCHR chrome plant with the chromite grain sizes being 101 μm in the feed and 100 μm in the concentrate and increasing to 152 μm in the tailings.

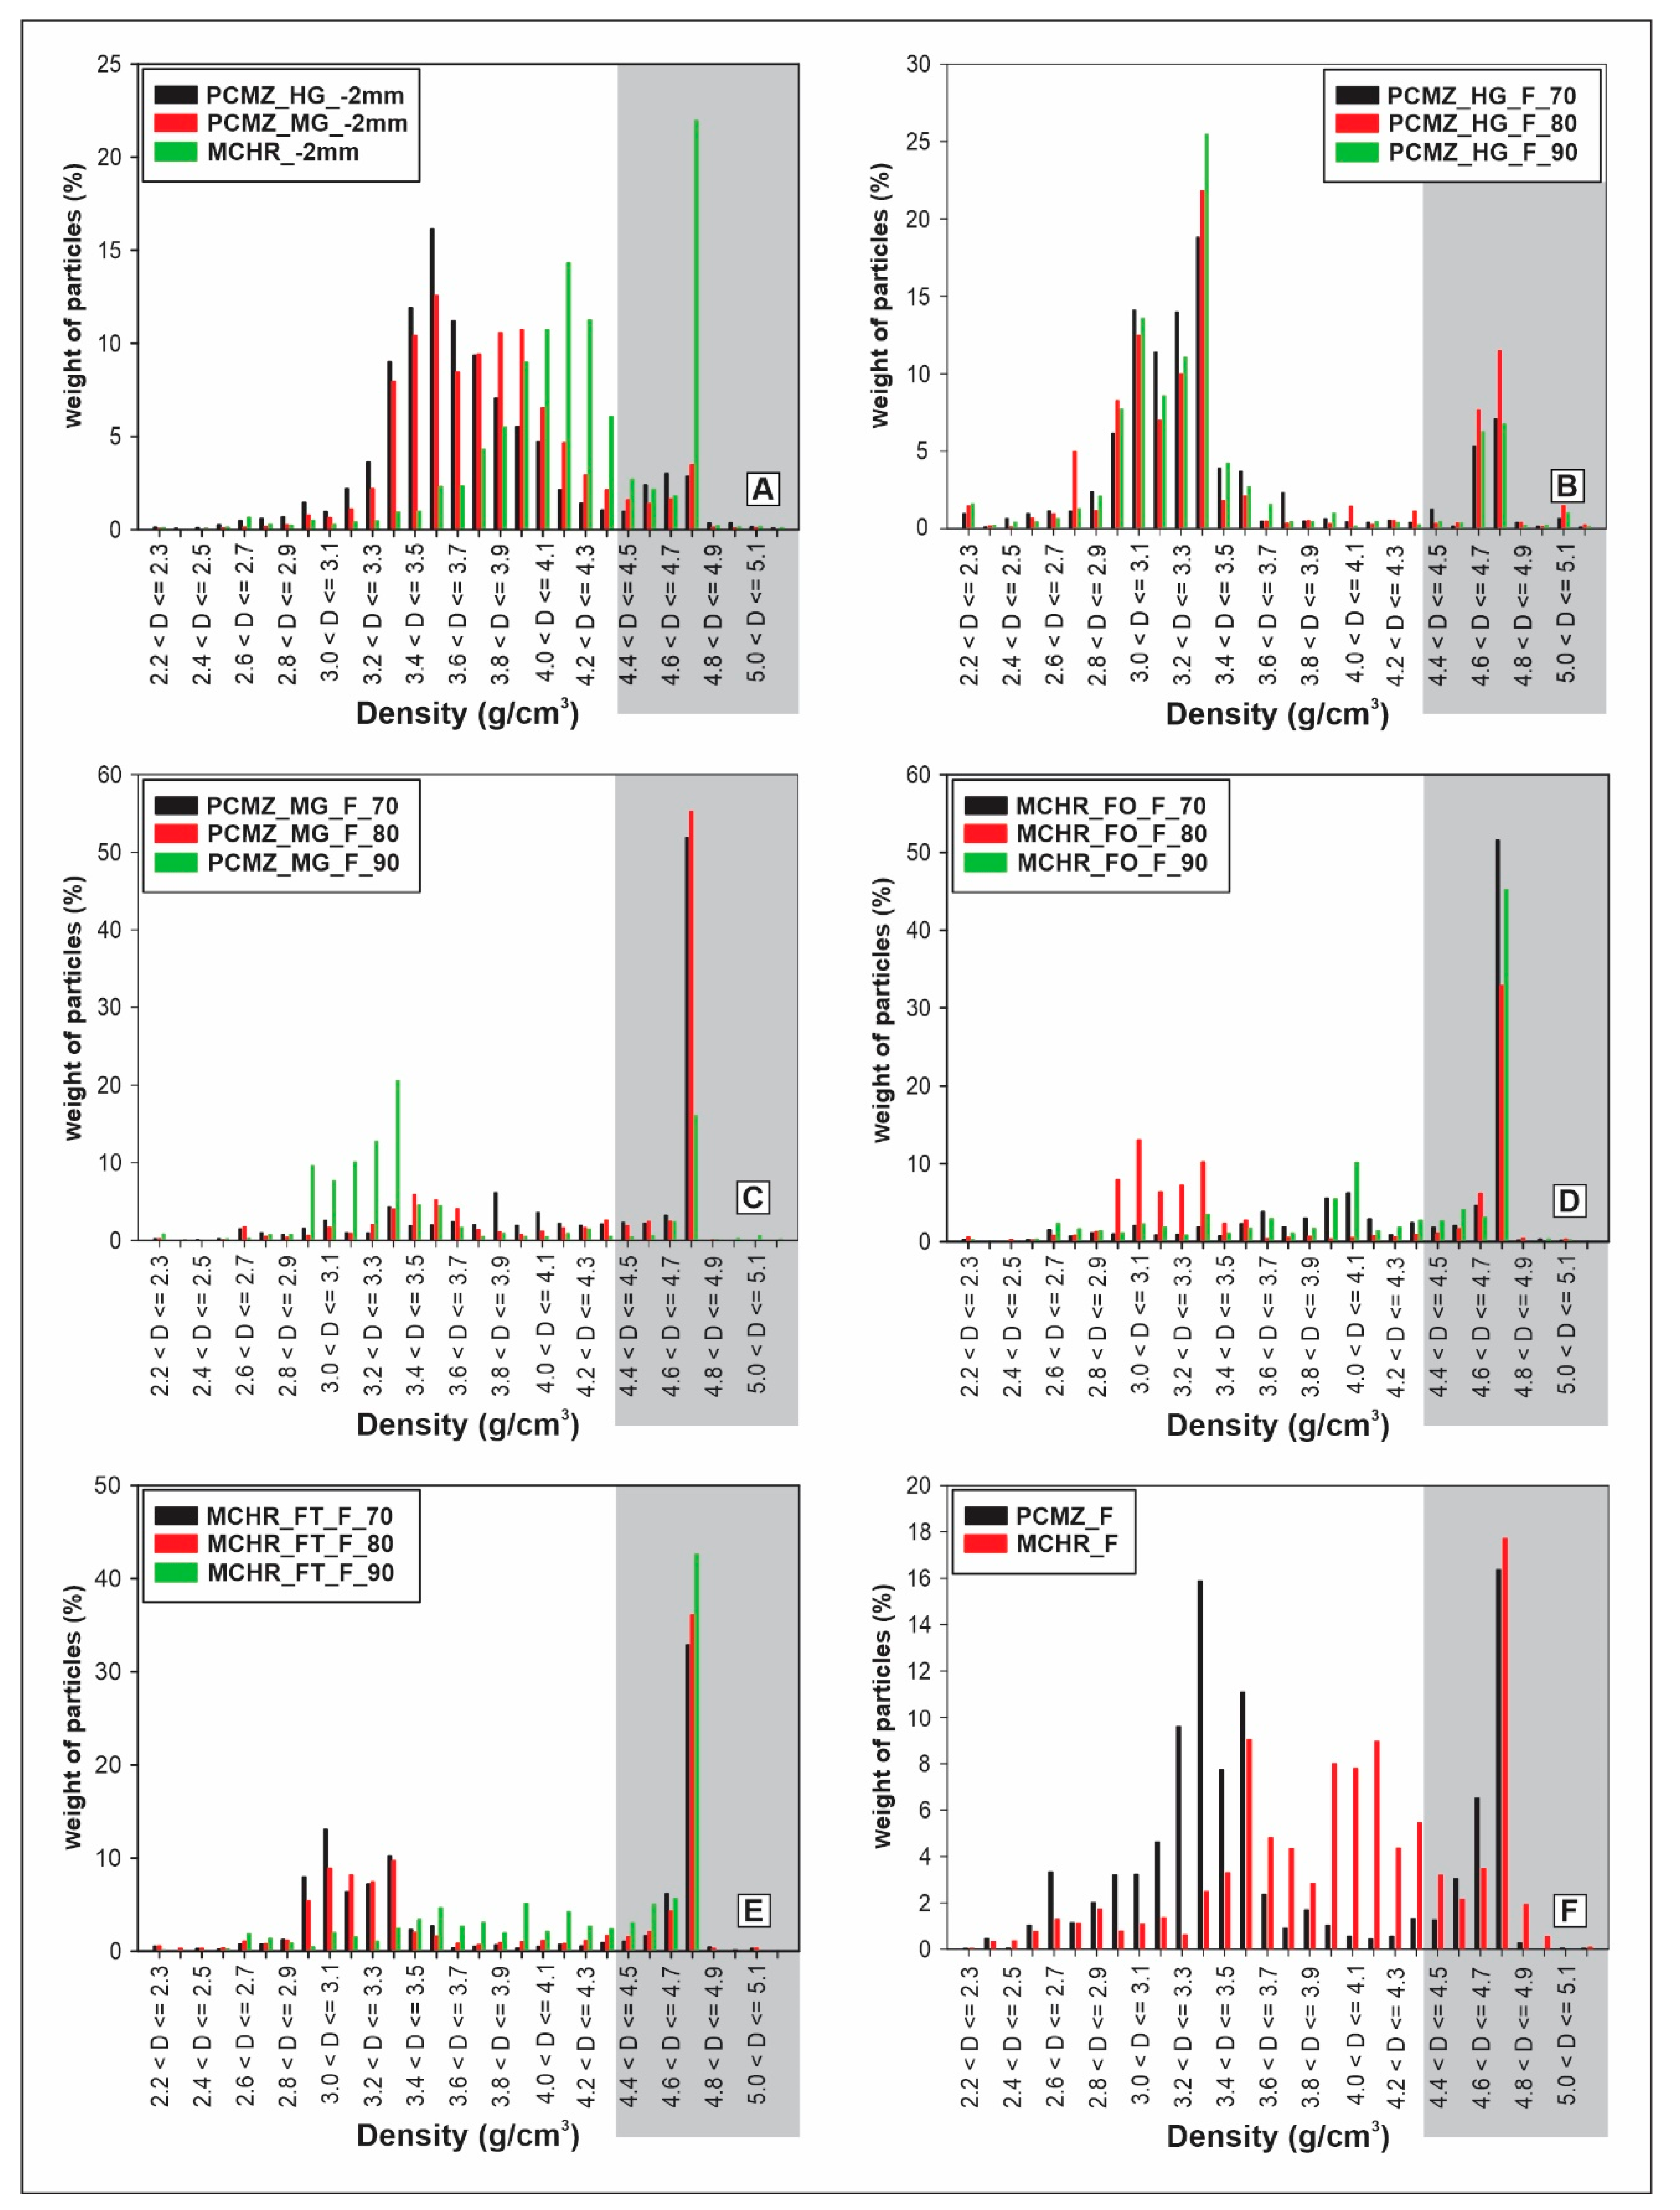
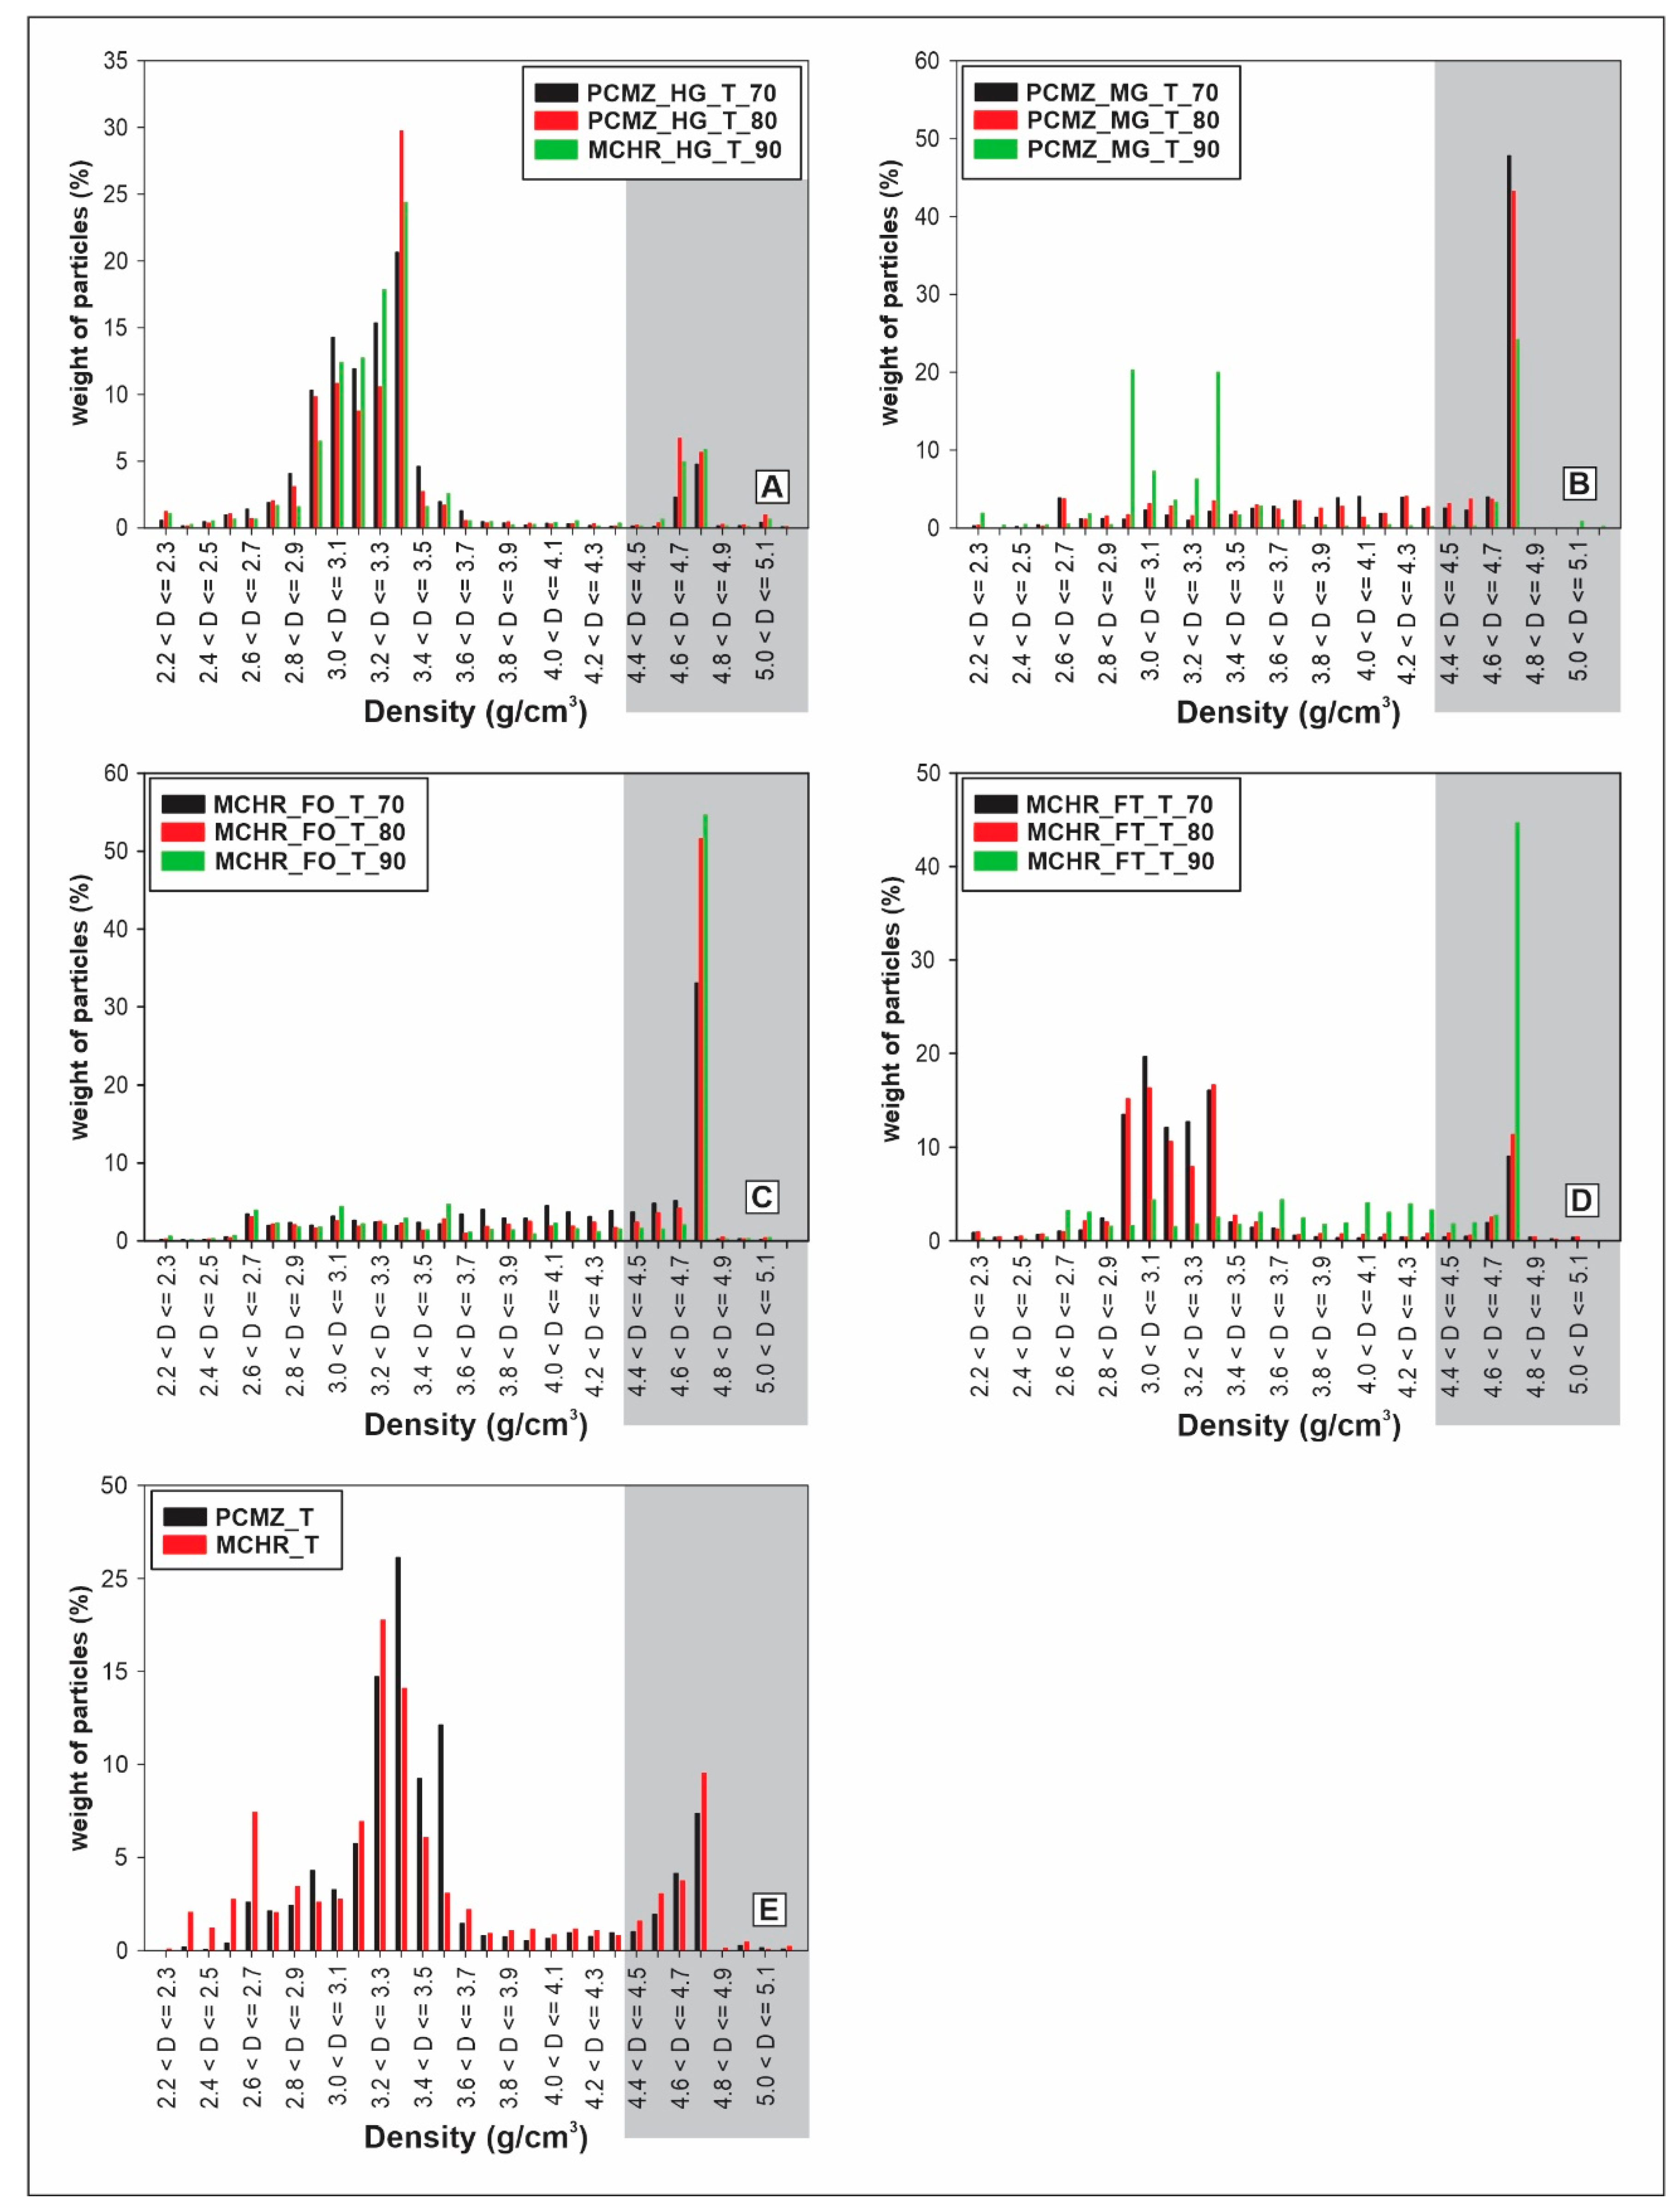
5.4.3. Particle Density Distributions

The densities of the entire mineral populations making up the different samples were extracted from the MLA Dataview software based on computations carried out by the MLA Data Processing software.
The densities computed from the MLA Data Processing software cover the entire population (i.e., both the gangue minerals and chromite) in each sample. For this discussion however, focus was on those minerals that have densities ranging from 4.50 to 4.80 g/cm3 as chromite densities fall within this range.
In the unprocessed ore (i.e., −2 mm crush), approximately 29%, 10% and 8% of the MCHR, PCMZ_HG and PCMZ_MG samples, respectively, were composed of chromite. In the disseminated ore feeds, the P80 of 75 μm grind size contained the highest population of chromite which decreased into the finest grind of P90 of 75 μm (Figure 8).
In the MCHR_FO sample, the highest chromite population was found in the coarsest grind. For the MCHR_FT ore, the highest chromite population was found in the finest grind size. The metallurgical samples collected from the plant indicate that the chromite populations in both the disseminated and massive ore feeds are similar at 28% and 29%, respectively, based on the density population.
The tailings also contained considerable abundances of chromite which ranged from 15% in the PCMZ to 18% in the MCHR samples from the plant (Figure 9).

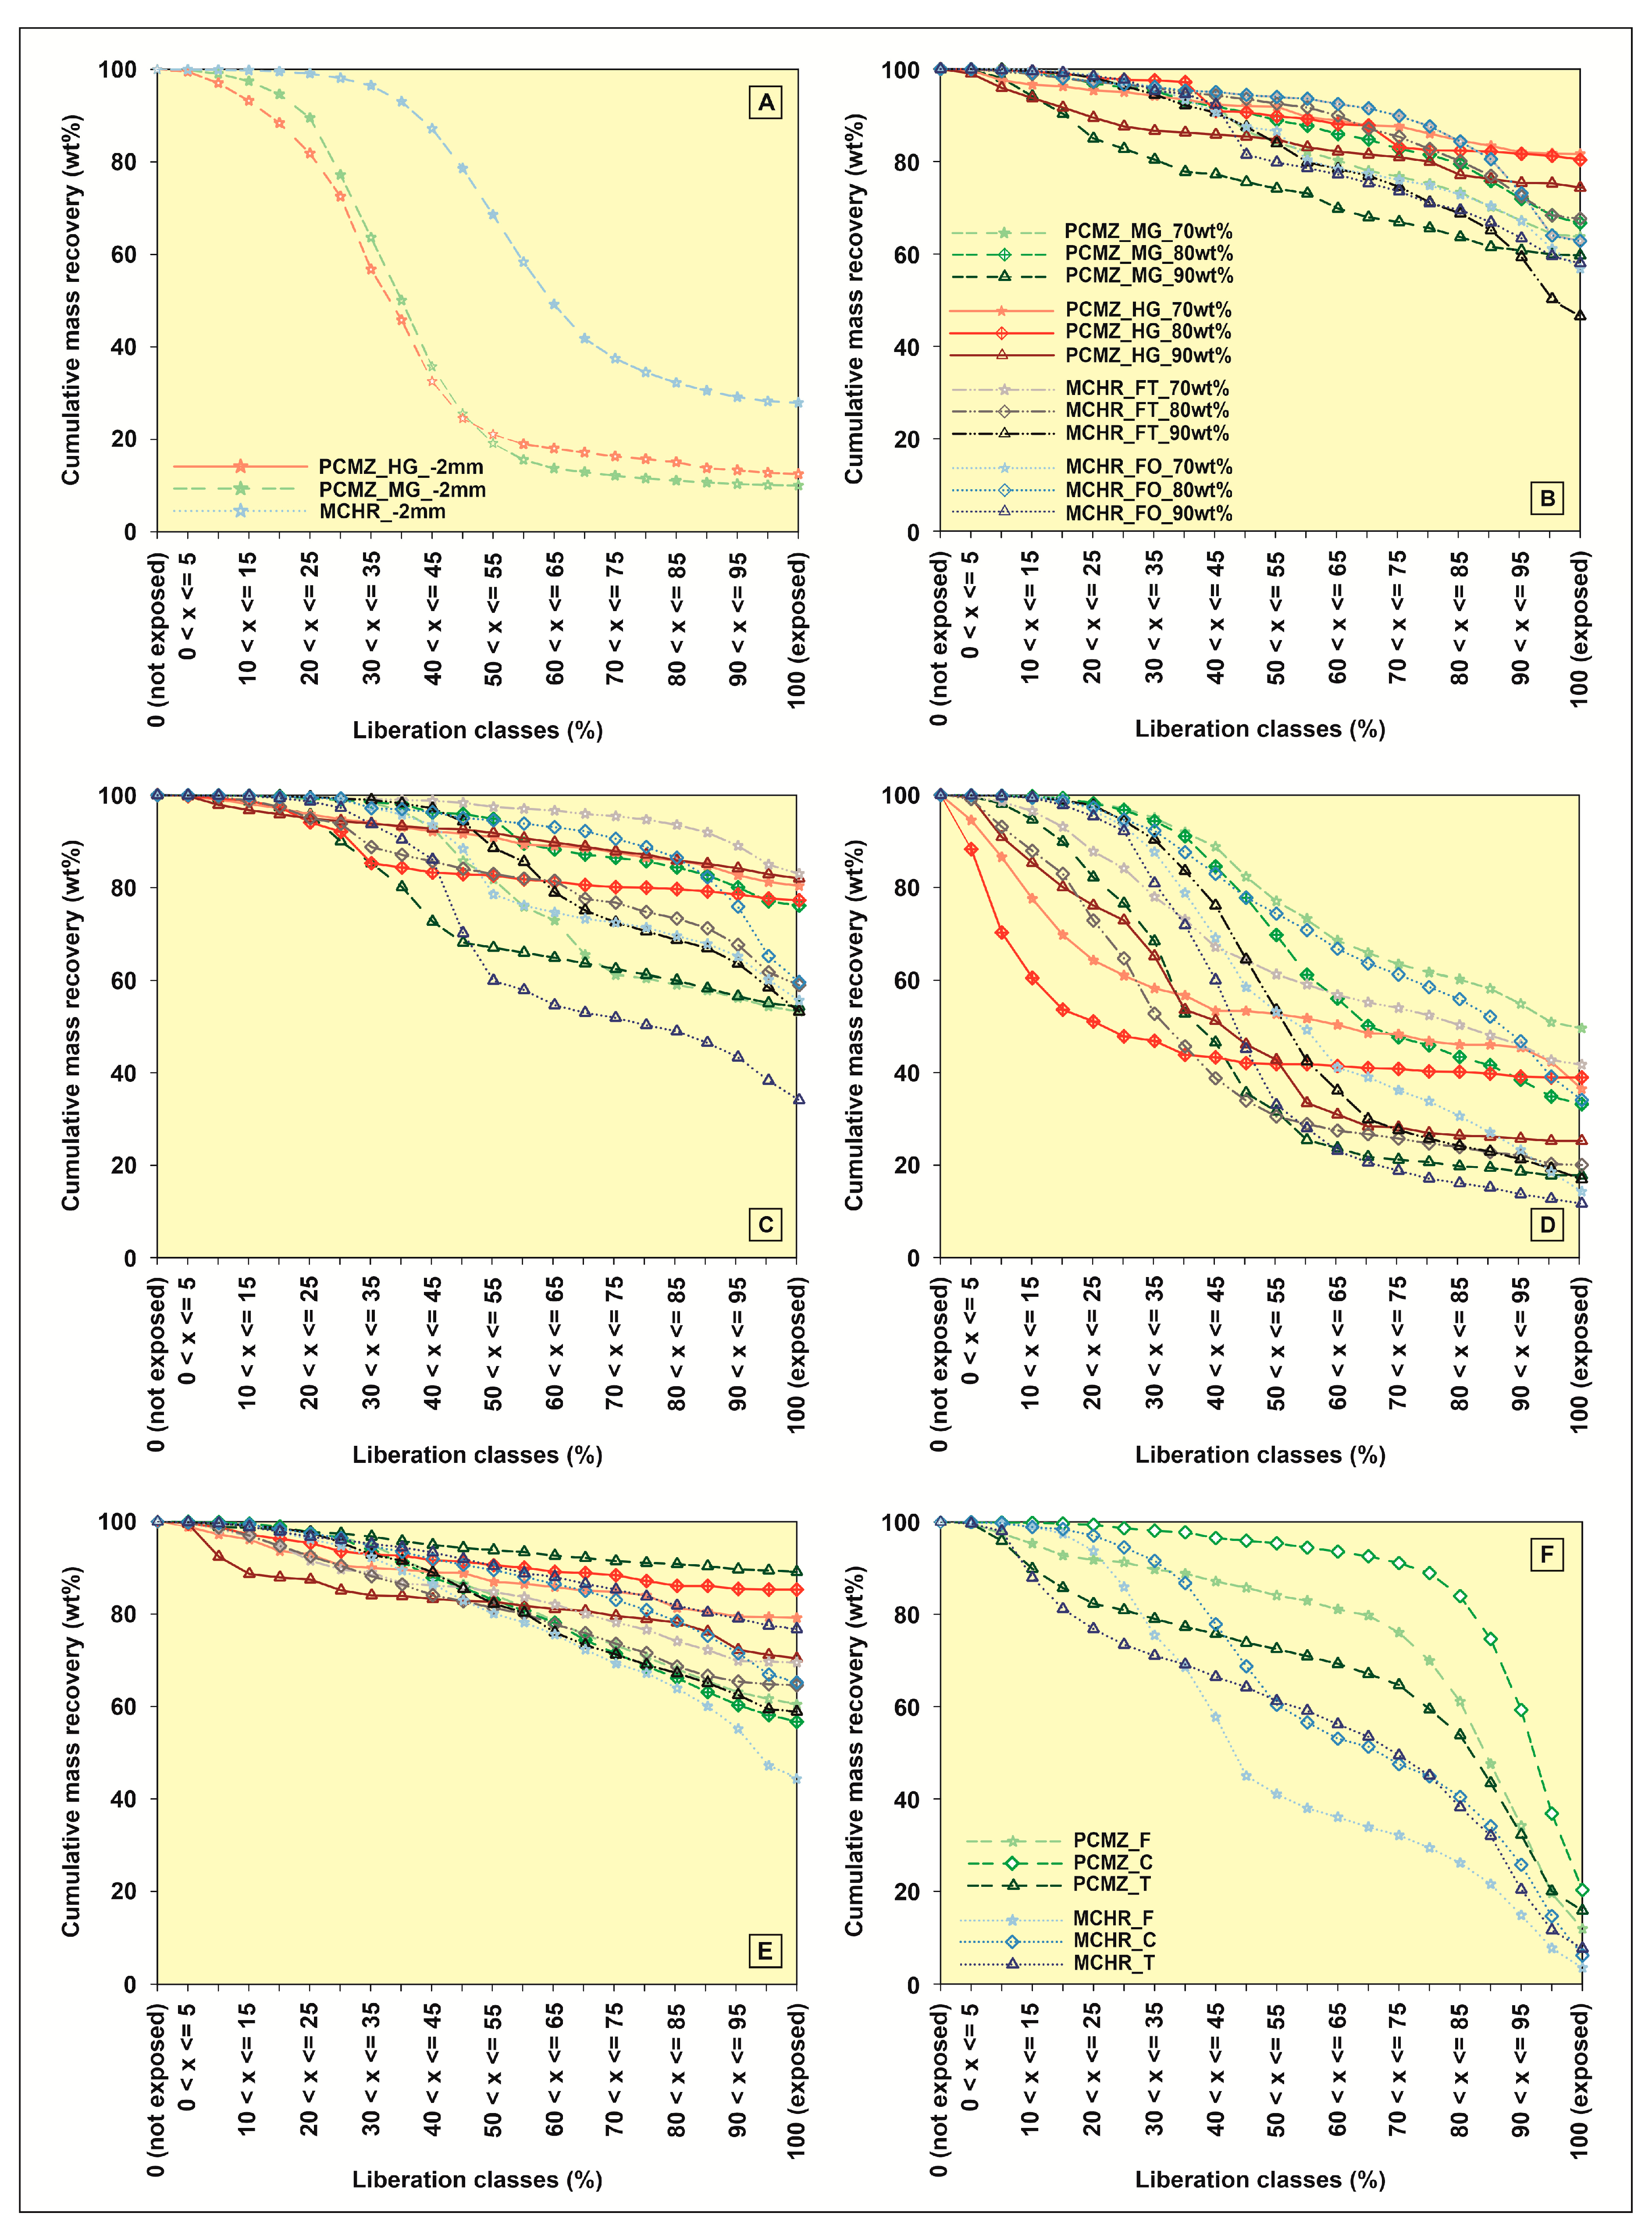
5.4.4. Chromite Liberation

Chromite liberation plots for the three ore types as well as the three target grinds can be found in Figure 10.
The chromite liberation data record a similar trend to what was observed in the chromite grain size distribution plots. Chromite in the disseminated ores showed better liberations in the feed at the P80 of 75 μm grind. A similar trend is also seen in the MCHR_FT and MCHR_FO feeds where the best liberation was at the P80 of 75 μm grind. The PCMZ ore samples from the metallurgical plant recorded better liberations than the MCHR (Figure 10F). The chromite liberations in the tailings of the disseminated ore samples were generally better than in the feeds and concentrates.

6. Discussion

6.1. Chromite Chemistry

The chromite compositions in this study are in broad agreement with those of Yudovskaya et al. [36]. The narrow range in chemistry from chromites in the MCHR and wide range in the disseminated ores can best be attributed to the trapped liquid shift effect [61]. Chromite compositions vary due to numerous cation substitutions that can occur within the crystal structure, particularly in the presence of a silicate phase under subsolidus conditions. Under these conditions, iron is replaced by magnesium while chromium tends to be replaced by ferric iron and aluminium [2]. In the massive chromite ores, there is minimal interaction with silicates and thus a narrower range in chromite chemistries is recorded. Similar trends were also documented by [21] who characterized the massive chromites as having Mg numbers larger than 0.4 while the disseminated chromites tended to have Mg numbers less than 0.4. In comparison to the Bushveld (i.e., the Northern Limb, [21]) the chromite chemistry of the MCHR at Nkomati is primitive and in agreement with the findings of Yudovskaya et al. [36].
The wide range of compositions in the PCMZ ores is also believed to have an influence on the density of chromite, which ranges from 4.50 to 4.80 g/cm3. The densities of the most common gangue silicates range from 2.50 to 3.20 g/cm3. This large differential in chromite and gangue silicate densities allows it to be beneficiated using gravity techniques, particularly spirals [1]. Most of the gravity techniques however, become inefficient particularly when treating fine particle sizes that are smaller than 75 μm, as the forces associated with water flow become more dominant than the forces associated with gravity resulting in losses to the tailings [2]. In addition, at smaller particle sizes the gangue minerals have similar densities to chromite which renders gravity separation inefficient ([4] and references within).

6.2. Milling Performances of the Three Nkomati Mine Ores

The milling performance of an ore is determined empirically by determining the time required to mill an ore to a specific particle size (termed target grind size) such that optimal liberation of the ore mineral(s) is achieved [59]. Under ideal conditions, increased milling should result in better liberation of the ore minerals.
At the Nkomati nickel mine, the target grinds for the PCMZ chrome plant feed (consisting of a blend of PCMZ_HG and PCMZ_MG) and the MCHR chrome plant feed are both P80 of 75 μm and are the same as the target grind used to process UG2 chromitite from the Bushveld Complex [62]. The PCMZ_HG ore required the longest milling times to achieve the P70-, P80- and P90 of 75 μm target grinds requiring 34, 42 and 50 min, respectively, and this is attributed to the overall higher abundance of silicates. Similarly the PCMZ_MG contains the second highest abundance of silicates and required the second longest milling times to achieve the required target grinds. The MCHR ore required the lowest milling times to achieve the required target grinds. The milling times for the PCMZ and MCHR ore types at Nkomati are in broad agreement with those of the Merensky Reef and UG2 [53,58] and confirm the findings of Dzvinamurungu et al. [53], that the milling times are primarily controlled by the chromite abundance.

6.3. Implications for Chromite Ore Processing

The grade and recovery of chromite beneficiation are influenced by the (i) textural, (ii) mineralogical and (iii) chemical attributes of the ore [62]. The three ores studied have been shown to display variations in textural, mineralogical and chemical attributes. The textural and mineralogical attributes have an influence on the milling behavior of the ore. This can be seen by the PCMZ_HG ore type recording the longest milling times due to this ore type having the highest abundance of silicates. Chromite chemistry has also been shown to be influenced by the nature of the host rock. The chromite chemistry maybe be influenced during formation i.e., under subsolidus conditions where the trapped liquid shift effect [61] is dominant in disseminated chromite ores hosted in silicate rocks. As a result, the MCHR ore type is more primitive (i.e., lower Cr/Fe ratio and thus higher densities) than those hosted in silicate lithologies such as the PCMZ ore types. The inherent compositional variation of the chromite from the PCMZ could also be attributed to the chemistry of the source magmas.
The chromite chemistry may also be influenced after crystallization by alteration. Such alteration of chromite-bearing ores by aqueous fluids has been documented worldwide ([63,64,65] and references within). During partial metasomatism of the ore, chromium is redistributed within the gangue silicate minerals and is related to the formation of ferritchromite and chromium-rich chlorite which partially replace chromite and olivine or secondary chromite and serpentine assemblages [66,67,68]. Such textures were however, were not observed in the studied samples. The PCMZ ore variants at Nkomati nickel mine have, however, undergone varying degrees of alteration evidenced by intergrowths of magnetite and apatite as well as replacement of base-metal sulphides by secondary magnetite (Figure 3) as well as the high abundance of secondary silicates and minerals (Figure 6).
Relatively high chromite grade and recoveries in the PCMZ_MG and PCMZ_HG ore types being achieved at a coarse grind size (P70 of 75 μm) are attributed to a number of factors. The first being the texture of these ores. Chromite in the PCMZ ore types is commonly subhedral and cuspate while the chromite in the MCHR ore tends to be subhedral-to-sub rounded. The second factor could be attributed to the chemistry and grind size of the ore. The disseminated chromites record a wide range in chemistry which in turn has an influence on the density of chromite. The PCMZ_HG ore type records the least modal abundance of chromite (Figure 6) as well as having the least population of chromite (Figure 8). The PCMZ_MG ore would thus be a semi-massive ore type while PCMZ_HG is sensu stricto disseminated.
The high abundances of chromite recorded in the laboratory scale PCMZ_MG metallurgical samples correlates with a lower degree of liberation. The lower degree of chromite liberation in the PCMZ_MG samples (see Figure 10A), as well as this sample being semi-massive, is the most likely explanation for the high modal abundance of chromite in the laboratory scale metallurgical samples, particularly at the coarser grind sizes. This can be seen by the high abundance of chromite in the middlings. At coarser grinds the chromite is concentrated effectively although the liberation is low.
The higher recoveries of Cr2O3 in the PCMZ ores at coarse grinds (P70 of 75 μm) will be discussed in subsequent sections below.
The mechanism controlling the higher Cr2O3 grade and recovery in the MCHR_FT sample is not fully understood but is most likely influenced by the pre-flotation stage. Wesseldijk et al. [69] carried out a study on chromite from the UG2 ore of the Bushveld Complex and explored the influence of the addition of reagents had on the floatability of chromite. It was shown that under certain conditions of pH, and in conjunction with the addition of copper sulphate at specific concentrations, the chromite surface chemistry changes. During flotation of BMS such as was done here, copper sulphate is added into the pulp. It is believed that the pre-flotation stage enables the chromite surface chemistry to be altered thereby increasing amenability to gravity concentration.
An apparent relationship between the chromite grain sizes and liberations can be seen. Ideally ores milled to fine target grinds should have better liberation of the ore minerals but this was not seen, particularly for the PCMZ ore types. Tracking of the chromite, grain sizes, particularly the shaking table feeds, tend to decrease in size with increased milling for the PCMZ ores, which is not seen in the MCHR ores. The MCHR_FT ore shows an initial decrease in size from the P70- to P80 of 75 μm grind size and increases from the P80- to P90 of 75 μm grind, which is unexpected. The chromite grain sizes in the concentrates and middlings streams are also larger than those of the shaking table feed of any of the three ore types. It is also noteworthy that in the unprocessed ores the chromite grain sizes vary but, at the P80 of 75 μm target grind, the grain sizes are all similar for the three ore types. The larger grain sizes reporting to the concentrates and middlings samples is most probably related to the chemistry of these grains. This is most prominent in the PCMZ_HG ores where the chromite chemistry was most probably altered during subsolidus equilibration with the silicate phases. The disseminated chromite thus displays low densities as can be seen in Figure 7 where the PCMZ_HG ores have a lower population of minerals that fall within the density range of chromite. To compensate for the lower densities, larger grains of chromite are required if these are to be concentrated. Gravity techniques such as spiral concentrators, which are the standard for processing chromite ore, are largely controlled by target grind (i.e., particle size and to a lesser degree by liberation). Murthy et al. [2] allude to spiral concentrators being inefficient at fine grinds. In particles less than 100 μm, the force of the flowing water is more dominant than the force of gravity and these particles are lost to the tailings. At smaller particles sizes the chromite grains also record densities similar to the gangue and are thus lost to the tailings [4]. This explains the higher Cr2O3 grades and recoveries for the PCMZ ores at coarse grinds and highlights the importance of the target grind being more important than liberation. Finer grinding of disseminated chromite ores is more detrimental for mineral processing particularly in gravity spiral concentration techniques. The tailings for all the samples generally recorded higher liberations of chromite grains at smaller sizes. The lower liberations recorded at finer grinds imply that the separation technique is controlled more by particle size than liberation and would explain why the chromite in the tailings samples are better liberated. For the MCHR ore which has a tight range of chemistry, finer grinds result in improved grades and recoveries.
The chromite grain sizes at the plant scale are broadly similar to those at the laboratory scale. This holds promise for ultimately blending all the three ore types and processing these in a two-step stage where the blended ore is treated by a flotation stage to remove the BMS followed by reticulating the flotation tailings into the spiral circuit.
The implications for processing chromite ore specifically at Nkomati would mean a target grind based on the chromite chemistry (with a focus on density) and that chromite liberation should not be the focal point during beneficiation. This is to say if the ore contains disseminated chromite, milling to a fine grind will most likely result in most of the chromite reporting to the tailings.

7. Conclusions

Metallurgical test work with the aid of automated scanning electron microscopy applied to three ore types at the Nkomati nickel mine has provided insights into the processing behavior of chromite during beneficiation. Tracking of the chromite grain sizes, liberations, density and modal mineralogy of the unprocessed ore to the various metallurgical samples with the aid of an MLA was used to gain insights into the processing behavior of the ores. These include:
  • A fine grind size is not optimal for processing PCMZ ores. This implies that the target grind (particle size) is more important than liberation.
  • Increased milling of the ore to finer grinds does not result in improved chromite recoveries or grades for the PCMZ ores. The chromite chemistry controls the recovery of chromite.
  • Increased milling of the ore to finer grinds results in improved chromite recoveries or grades for the MCHR ores, particularly the MCHR_FT ore.
  • The MCHR_FT ore performed better than the MCHR_FO ore. This holds promise for blending of the PCMZ ores with the MCHR ore. This would involve blending of the MCHR with the PCMZ ore prior to flotation with the flotation tailings being feed for the chrome plants.
  • The P80 of 75 μm grind size is the most optimal grind size to process all three ore types.

Author Contributions

Conceptualization, K.S.V. and T.D.; methodology, T.D., K.S.V. and A.F.M.-B.; software, D.H.R.; validation, T.D., D.H.R., K.S.V. and A.F.M.-B.; formal analysis, T.D. and D.H.R.; investigation, T.D.; resources, K.S.V. and A.F.M.-B.; data curation, D.H.R. and T.D.; writing—original draft preparation, T.D. and D.H.R.; writing—review and editing, D.H.R.; supervision, K.S.V.; project administration, T.D. All authors have read and agreed to the published version of the manuscript.

Funding

This research received no external funding.

Acknowledgments

The authors would like to express their gratitude to Nkomati mine management for giving access to their operation to collect samples used in this study. K.S.V. acknowledges funding from the Department of Science and Technology Research Chairs initiative, as administered by the National Research Foundation. The support of the DST-NRF Centre of excellence for Integrated Mineral and Energy Resource Analysis (DST-NRF CIMERA) towards this research is hereby acknowledged. Opinions expressed and conclusions arrived at are those of the author(s), and are not necessarily to be attributed to the CoE. We thank the assigned editor for the editorial handling as well as the reviews, comments and suggestions from four anonymous reviewers, which greatly improved the paper.

Conflicts of Interest

The authors declare no conflict of interest.

References

  1. Dawson, N.F. Experiences in the production of metallurgical and chemical grade UG2 chromite concentrates from PGM tailings streams. J. S. Afr. Inst. Min. Metall. 2010, 110, 683–690. [Google Scholar]
  2. Murthy, Y.R.; Tripathy, S.K.; Kumar, C.R. Chrome ore beneficiation challenges & opportunities—A review. Miner. Eng. 2011, 24, 375–380. [Google Scholar]
  3. Freire, L.A.; Leite, J.Y.P.; da Silva, D.N.; da silva, B.G.; Oliveira, J.C.S. Behaviour of the chromite tailings in a centrifugal concentrator (FALCON). Rem Rev. Esc. Minas 2019, 72, 147–152. [Google Scholar]
  4. Tripathy, S.K.; Murthy, Y.R.; Singh, V.; Farrokhpay, S.; Filippov, L.O. Improving the quality of ferruginous chromite concentrates via physical separation methods. Minerals 2019, 9, 667. [Google Scholar] [CrossRef] [Green Version]
  5. Nafzinger, R.H. A review of the deposits and beneficiation of lower grade chromite. J. S. Afr. Inst. Min. Metall. 1982, 82, 205–226. [Google Scholar]
  6. Cousins, C.A. Additional notes on the chromite deposits of the Eastern part of the Bushveld Complex. In The Geology of Some ore Deposits of Southern Africa; Haughton, S.H., Ed.; Geological Society of South Africa: Johannesburg, South Africa, 1964; p. 750. [Google Scholar]
  7. Cousins, C.A.; Feringa, G. The chromite deposits of the Western belt of the Bushveld Complex. In The Geology of Some ore Deposits of Southern Africa; Haughton, S.H., Ed.; Geological Society of South Africa: Johannesburg, South Africa, 1964; p. 750. [Google Scholar]
  8. Cameron, E.N. Chromite in the Central sector of the eastern Bushveld Complex, South Africa. Am. Mineral. 1977, 62, 1082–1096. [Google Scholar]
  9. Von Gruenewaldt, G.; Hatton, C.J.; Merkle, R.K.W.; Gain, S.B. Platinum-group element–chromitite associations in the Bushveld Complex. Econ Geol. 1986, 81, 1067–1079. [Google Scholar] [CrossRef]
  10. Teigler, B.; Eales, H.V. Correlation between chromite composition and PGE mineralization in the Critical Zone of the western Bushveld Complex. Miner Deposita 1993, 28, 291–302. [Google Scholar] [CrossRef]
  11. Scoon, R.N.; Teigler, B.A. New LG-6 chromitite reserve at Eerste Geluk in the boundary zone between the Central and Southern Sectors of the Eastern Bushveld Complex. Econ Geol. 1995, 90, 969–982. [Google Scholar] [CrossRef]
  12. Teigler, B. Chromite chemistry and platinum-group element distribution of the LG6 chromitite, northwestern Bushveld Complex. S. Afr J. Geol. 1999, 102, 282–285. [Google Scholar]
  13. Eales, H.V. Implications of the chromium budget of the Western Limb of the Bushveld Complex. S. Afr. J. Geol. 2000, 103, 141–150. [Google Scholar] [CrossRef]
  14. Kinnaird, J.A.; Kruger, F.J.; Nex, P.A.M.; Cawthorn, R.G. Chromitite formation–a key to understanding processes of platinum enrichment. Appl. Earth Sci. 2002, 111, 23–35. [Google Scholar] [CrossRef]
  15. Mondal, S.K.; Mathez, E.A. Origin of the UG2 chromitite layer, Bushveld Complex. J. Petrol. 2007, 48, 495–510. [Google Scholar] [CrossRef]
  16. Kottke-Levin, J.; Tredoux, M.; Gräbe, P.-J. An investigation of the geochemistry of the Middle Group of the eastern Bushveld Complex, South Africa. Part 1–the chromitite layers. Appl. Earth Sci. 2009, 118, 111–130. [Google Scholar] [CrossRef]
  17. Naldrett, A.J.; Kinnaird, J.; Wilson, A.; Yudovskaya, M.; McQuade, S.; Chunnett, G.; Stanley, C. Chromite composition and and PGE content of Bushveld chromitites: Part 1–the lower and middle groups. Trans. Inst. Metall. B 2009, 118, 131–161. [Google Scholar] [CrossRef]
  18. Naldrett, A.J.; Wilson, A.; Kinnaird, J.; Yudovskaya, M.; Chunnett, G. The origin of chromites and related PGE mineralization in the Bushveld Complex: New mineralogical and petrological contraints. Miner. Depos. 2012, 47, 209–232. [Google Scholar] [CrossRef]
  19. Junge, M.; Oberthür, T.; Melcher, F. Cryptic variationof chromite chemistry, platinum group element and platinum group mineral distribution in the UG-2 chromitite: An example from the Karee mine, Western Bushveld Complex, South Africa. Econ. Geol. 2014, 109, 795–810. [Google Scholar] [CrossRef]
  20. Bachmann, K.; Menzel, P.; Tolosana-Delgado, R.; Schmidt, C.; Hill, M.; Gutzmer, J. Multivariate geochemical classification of chromitite layers in the Bushveld Complex, South Africa. Appl. Geochem. 2019, 102, 106–117. [Google Scholar] [CrossRef]
  21. Langa, M.M.; Jugo, P.J.; Leybourne, M.I.; Grobler, D.F.; Adetunji, J.; Skogby, H. Chromite chemistry of a massive seam in the Northern Limb of the Bushveld Igneous Complex, South Africa: Correlation with the UG-2 in the eastern and western limbs and evidence of variable assimilation of footwall rocks. Miner. Depos. 2020, in press. [Google Scholar] [CrossRef] [Green Version]
  22. Tripathy, S.K.; Singh, V.; Ramamurthy, Y. Improvement in Cr: Fe ratio of Indian chromite ore for ferro chrome production. Int. J. Min. Eng. Miner. Process. 2012, 1, 101–106. [Google Scholar]
  23. Lastra, R. Seven practical application cases of liberation analysis. Int. J. Miner. Process. 2007, 84, 337–347. [Google Scholar] [CrossRef]
  24. Dai, Z.; Bos, J.; Lee, A.; Wells, P. Mass balance and mineralogical analysis of flotation plant survey samples to improve plant metallurgy. Miner. Eng. 2008, 21, 826–831. [Google Scholar] [CrossRef]
  25. Tomanec, R.; Cablik, V.; Simovic, I.; Gacina, R. Ore microscopy characterization as a mineral processing control. inzynieria mineralna-LIPIEC-GRUDZIEN. J. Pol. Miner. Eng. Soc. 2014, 2, 101–106. [Google Scholar]
  26. Little, L.; Becker, M.; Wiese, J.; Mainza, A. Auto-SEM particle shape characterisation: Investigating fine grinding of UG2 ore. Miner. Eng. 2015, 82, 92–100. [Google Scholar] [CrossRef]
  27. Gottlieb, P.; Wilkie, G.; Sutherland, D.; Ho-Tun, E.; Suthers, S.; Perera, K.; Jenkins, B.; Spencer, S.; Butcher, A.; Rayner, J. Using quantitative electron microscopy for process mineralogy applications. J. Miner. Met. Mater. Soc. 2000, 52, 24–25. [Google Scholar] [CrossRef]
  28. Gu, Y. Automated scanning electron based mineral liberation analysis. J. Miner. Mater. Charact. Eng. 2003, 2, 33–41. [Google Scholar]
  29. Fandrich, R.; Gu, Y.; Burrows, D.; Moeller, K. Modern SEM-based mineral liberation analysis. Int. J. Miner. Proc. 2007, 84, 310–320. [Google Scholar] [CrossRef]
  30. Lotter, N.O.; Kormos, L.J.; Oliveira, J.; Fragomeni, D.; Whiteman, E. Modern Process Mineralogy: Two Case studies. Miner. Eng. 2011, 24, 638–650. [Google Scholar] [CrossRef]
  31. Young, M.F.; Pease, J.D.; Johnson, N.W.; Munro, P.D. Developments in Milling Practice at the Lead/Zinc Concentrator of Mount Isa Mines Limited. In Proceedings of the AusIMM Sixth Mill Operators Conference, Madang, Papua New Guinea, 6–8 October 1997; pp. 1–19. [Google Scholar]
  32. Mulaba-Bafubiandi, A.F.; Medupe, O. An assessment of pentlandite occurrence in the run of mine ore from BCL Mine (Botswana) and its impact on the flotation yield. The Southern African Institute of Mining and Metallurgy. In Proceedings of the Fourth Southern African Conference on Base Metals—‘Africa’s Metals Resurgence, Swakopmund, Namibia, 23–27 July 2017; pp. 57–75. [Google Scholar]
  33. Wabo, H.; Olsson, J.R.; de Kock, M.O.; Humbert, F.; Söderlund, U.; Klausen, M.B. New U-Pb age and paleomagnetic constraints from the Uitkomst Complex, South Africa: Clues to timing of intrusion. GFF 2016, 138, 152–163. [Google Scholar] [CrossRef]
  34. Maier, W.D.; Prevec, S.A.; Scoates, J.S.; Wall, C.J.; Barnes, S.-J.; Gomwe, T. The Uitkomst intrusion and Nkomati Ni-Cu-PGE deposit, South Africa: Trace element geochemistry, Nd isotopes and high-precision geochronology. Miner. Depos. 2018, 53, 67–88. [Google Scholar] [CrossRef] [Green Version]
  35. Barnes, S.J.; Cruden, A.R.; Arndt, N.; Saumur, B.M. The mineral system approach applied to magmatic Ni-Cu-PGE sulphide deposits. Ore Geol. Rev. 2016, 76, 296–316. [Google Scholar] [CrossRef] [Green Version]
  36. Yudovskaya, M.A.; Naldrett, A.J.; Woolfe, J.A.S.; Costin, G.; Kinnaird, J.A. Reverse compositional zoning as an indicator of crystallization in a magmatic conduit. J. Petrol. 2016, 56, 2373–2394. [Google Scholar] [CrossRef] [Green Version]
  37. Theart, H.F.J.; De Nooy, C.D. The platinum group minerals in two parts of the Massive sulphide Body of the Uitkomst Complex, Mpumalanga, Africa. S. Afr. J. Geol. 2001, 104, 287–300. [Google Scholar] [CrossRef]
  38. Wagner, P.A. The Platinum Deposits and Mines of South Africa; Oliver and Boyd: Edinburgh, UK, 1929. [Google Scholar]
  39. De Waal, S.A.; Maier, W.D.; Armstrong, R.A.; Gauert, C.D.K. Parental magma and emplacement of the stratiform Uitkomst Complex, South Africa. Can Mineral. 2001, 39, 557–571. [Google Scholar] [CrossRef] [Green Version]
  40. Cockburn, G. Challenges and successes at the Nkomati JV: Pit-to-product process improvements. In Proceedings of the 7th Southern African Base Metals Conference, White River, South Africa, 2–6 September 2013; South African Institute of Mining and Metallurgy: Mpumalanga, South Africa, 2013; pp. 151–167. [Google Scholar]
  41. Bradford, L.; McInnes, C.; Stange, W.; de Beer, C.; David, D.; Jardin, A. The development of the proposed milling circuit for the Nkomati main concentrator plant. Miner. Eng. 1998, 11, 1103–1117. [Google Scholar] [CrossRef]
  42. Newell, A.J.H.; Bradshaw, D.J. The development of a sulfidisation technique to restore the flotation of oxidised pentlandite. Miner. Eng. 2007, 20, 1039–1046. [Google Scholar] [CrossRef]
  43. Becker, M.; de Villiers, J.; Bradshaw, D. The flotation of magnetic and non-magnetic pyrrhotite from selected nickel ore deposits. Miner. Eng. 2010, 23, 1045–1052. [Google Scholar] [CrossRef] [Green Version]
  44. Ekmekçi, Z.; Becker, M.; Tekes, E.B.; Bradshaw, D. The relationship between the electrochemical, mineralogical and flotation characteristics of pyrrhotite sampls from different Ni ore. J. Electroanal. Chem. 2010, 647, 133–143. [Google Scholar] [CrossRef]
  45. Marape, G.; Vermaak, M.K.G. Fundamentals of pentlandite mineralogy and its effect on its electrochemical behaviour. Miner. Eng. 2012, 32, 60–67. [Google Scholar] [CrossRef]
  46. Chimbganda, T.; Becker, M.; Broadhurst, J.L.; Harrison, S.T.L.; Franzidis, J.-P. A comparison of pyrrhotite rejection and passivation in two nickel ores. Miner. Eng. 2013, 46–47, 38–44. [Google Scholar] [CrossRef]
  47. Mishra, G.; Viljoen, K.S.; Mouri, H. Influence of mineralogy and ore texture on pentlandite flotation at the Nkomati nickel mine, South Africa. Miner. Eng. 2013, 54, 63–78. [Google Scholar] [CrossRef]
  48. Ngobeni, W.A.; Hangone, G. The effect of using sodium di-methyl-dithiocarbamate as a co-collector with xanthates in the froth flotation of pentlandite containing ore from Nkomati mine in South Africa. Miner. Eng. 2013, 54, 94–99. [Google Scholar] [CrossRef]
  49. Bowers, R.L.; Smit, D.S. Process development of the Nkomati PCMZ base metals sulphide deposit. In Proceedings of the 4th Southern African Base Metals Conference, Swakopmund, Namibia, 23–27 July 2007; South African Institute of Mining and metallurgy: Swakopmund, Namibia, 2007; pp. 415–431. [Google Scholar]
  50. Gauert, C.D.K.; De Waal, S.A.; Wallmach, T. Geology of the ultrabasic Uitkomst Complex, eastern Transvaal, South Africa: An overview. J. Afr. Earth Sci. 1995, 21, 553–570. [Google Scholar] [CrossRef]
  51. Gauert, C. Sulphide and oxide mineralization in the Uitkomst Complex, South Africa: Origin in a magma conduit. J. Afr. Earth Sci. 2001, 32, 149–161. [Google Scholar] [CrossRef]
  52. Trubăc, J.; Ackerman, L.; Gauert, C.; Ďurišová, J.; Hrstka, T. Platinum-group elements and Gold in base metal sulfides, platinum-group minerals, and Re-Os isotope compositions of the Uitkomst Complex, South Africa. Econ. Geol. 2018, 113, 439–461. [Google Scholar] [CrossRef]
  53. Dzvinamurungu, T.; Viljoen, K.S.; Knoper, M.W.; Mulaba-Bafubiandi, A. Geometallurgical characterisation of Merensky Reef and UG2 at the Marikana mine, Bushveld Complex, South Africa. Miner. Eng. 2013, 52, 74–81. [Google Scholar] [CrossRef]
  54. English, B.L.; Desborough, G.A.; Raymond, W.H. A Mechanical Panning Technique for Separation of Fine-Grained Gold and Other Heavy Minerals; Open-File Report; United States Department of the Interior Geological Survey: Denver, CO, USA, 1987; Volume 87-0364, pp. 1–9. [Google Scholar]
  55. Mitchell, C.J.; Styles, M.T.; Evans, E.J. The Design, Construction and Testing of a Simple Shaking Table for Gold Recovery: Laboratory Testing and Field Trials; Technical Report WC\97\61; Overseas Geology Series; British Geological Survey: Nottingham, UK, 1997; pp. 1–27. [Google Scholar]
  56. Falconer, A. Gravity Separation: Old technique/new methods. Phys. Sep. Sci. Eng. 2003, 12, 31–48. [Google Scholar] [CrossRef] [Green Version]
  57. Wills, B.A. Wills’ Minerals Processing Technology: An Introduction to the Practical Aspects of Ore Treatment and Mineral Recovery, 7th ed.; Napier-Munn, T., Ed.; JKMRC; Elsevier Ltd.: Oxford, UK, 2006; pp. 267–344. [Google Scholar]
  58. Lougheed, H.D.; McClenaghan, M.B.; Layton-Matthews, D.; Leybourne, M. Exploration potential of fine-fraction heavy mineral concentrates from till using automated mineralogy: A case study from the Izok Lake Cu-Zn-Pb-Ag VMS deposit, Nunavut, Canada. Minerals 2020, 10, 310. [Google Scholar] [CrossRef] [Green Version]
  59. Rose, D.H.; Viljoen, K.S.; Mulaba-Bafubiandi, A. A mineralogical perspective on the recovery of platinum group elements from the Merensky Reef and UG2 at the Two Rivers mine on the Eastern Limb of the Bushveld Complex in South Africa. Miner. Petrol. 2018, 112, 881–902. [Google Scholar] [CrossRef]
  60. Whitney, D.L.; Evans, B.W. Abbreviations of names of rock-forming minerals. Am. Miner. 2010, 95, 185–187. [Google Scholar] [CrossRef]
  61. Barnes, S.J. The effect of trapped liquid crystallization on cumulus mineral compositions in layered intrusions. Contrib. Miner. Petrol. 1986, 93, 524–531. [Google Scholar] [CrossRef]
  62. Hay, M.P.; Roy, R. A case study of optimising UG2 flotation performance. Part 1: Bench, pilot, and plant scale factors which influence Cr2O3 entrainment in UG2 flotation. Miner. Eng. 2010, 23, 855–867. [Google Scholar] [CrossRef]
  63. Chayka, I.F.; Zhitova, L.M.; Antsiferova, T.N.; Abersteiner, A.; Shevko, A.Y.; Izokh, A.E.; Tolstykh, N.D.; Gora, M.P.; Chubarov, V.M.; Kamenetsky, V.S. In-situ crystallization and continuous modification of chromian spinel in the “sulfide-poor platinum-group metal ores” of the Norilsk-1 Intrusion (Northern Siberia, Russia). Minerals 2020, 10, 498. [Google Scholar] [CrossRef]
  64. Mekhonoshin, A.S.; Kolotilina, T.B.; Doroshkov, A.A.; Pikiner, E.E. Compositional variations of Cr-spinel in high-Mg intrusions of the primorsky ridge (Western Baikal Region, Russia). Minerals 2020, 10, 608. [Google Scholar] [CrossRef]
  65. Grieco, G.; Pedrotti, M.; Moroni, M. Metamorphic redistribution of Cr within chromitites and its influence on chromite ore enrichment. Miner. Eng. 2011, 24, 102–107. [Google Scholar] [CrossRef]
  66. Kimball, K.L. Effects of hydrothermal alteration on the composition of chromian spinels. Contrib. Miner. Petrol. 1990, 105, 337–346. [Google Scholar] [CrossRef]
  67. Barnes, S.J. Chromite in komatiites, II Modification during greenschist to mid-amphibolite facies metamorphism. J. Petrol. 2000, 41, 387–409. [Google Scholar] [CrossRef] [Green Version]
  68. Mellini, M.; Rumori, C.; Viti, C. Hydrothermally reset magmatic spinels in retrograde serpentinites, formation of “ferritchromit” rims and chlorite aureoles. Contrib. Miner. Petrol. 2005, 149, 266–275. [Google Scholar] [CrossRef]
  69. Wesseldijk, Q.I.; Reuter, M.A.; Bradshaw, D.J.; Harris, P.J. The flotation behaviour of chromite with respect to the beneficiation of UG2 ore. Miner. Eng. 1999, 12, 1177–1184. [Google Scholar] [CrossRef]
Figure 1. Locality and simplified geological map including a cross section of the Uitkomst Complex at Nkomati Nickel mine. (A) = Regional location. (B) = Enlarged region as shown in A. (C) = Simplified geological map showing the Uitkomst Complex. (D) = Cross section of the Uitkomst Complex at the Nkomati Nickel mine including the ore bodies. Modified after [34,36,37].
Minerals 10 00709 g001
Figure 2. Sample tree showing handling and processing of samples from the study area.
Minerals 10 00709 g002
Figure 3. Backscattered electron photomicrographs showing some of the common textural properties of the ore types based on examination of thin sections. (A) Interstitial base-metal sulphide (BMS) characterized by secondary silicates replacing pyrrhotite. This texture was common in the high-grade Ni-Cu sulphide silicate ore containing disseminated chromite (PCMZ_HG) ore. (B) Interstitial BMS showing the pervasive alteration indicated by the formation of magnetite interstitially to pentlandite and pyrrhotite. (C) A core of pyrrhotite with coronas of pentlandite common in the medium-grade Ni-Cu sulphide silicate ore with disseminated chromite (PCMZ_HG) ore. (D) Pervasive alteration of the PCMZ-MG ore. Note the anhedral chromite as well as the development of magnetite interstitially to pentlandite and pyrrhotite. (E) Texture of the massive chromitite unit (MCHR) ore. Note the euhedral to subhedral morphology of chromite with interstitial silicates. (F) Texture of the MCHR ore showing millerite interstitial to chromite. Millerite, chalcopyrite and pyrite were more common in the MCHR ore. Mineral abbreviations after [60].
Minerals 10 00709 g003
Figure 4. Binary diagrams of cation proportions in chromite. (A) Fe2+/(Fe2+ + Mg) vs. Fe3+/(Fe3+ + Cr + Al). (B) Fe2+/(Fe2+ + Mg) vs. Cr/(Cr + Al). (C) Mg/(Mg + Fe2+) vs. Cr/(Cr + Al). (D) Fe3+/(Fe3+ + Cr + Al) vs. Cr/(Cr + Al). NKO represents data from [36]. UG2E represents data from [21]. The suffixes M, SM and D are abbreviations for massive, semi-massive and disseminated, respectively. The arrows represent change in chemistry from the massive to disseminated chromite.
Minerals 10 00709 g004
Figure 5. Cr-Al-Fe3+ ternary plot based on chromite cation proportions. NKO represents data from [36]. UG2E represents data from [21].
Minerals 10 00709 g005
Figure 6. Modal mineralogy of all the samples analyzed in this study at the three target grinds. (A) = Modal mineralogy of the unprocessed ore (−2 mm crush) and concentrator plant (denoted by the suffixes, F, C, T). (B) = Modal mineralogy of the PCMZ_MG. (C) = Modal mineralogy of the PCMZ_HG. (D) = Modal mineralogy of the MCHR_FT. (E) = Modal mineralogy of the MCHR_FO. (E) Mineral abbreviations after [60].
Minerals 10 00709 g006
Figure 7. Chromite grain size distributions. (A) −2 mm crush samples. (B) Feed samples. (C) Concentrate samples. (D) Middlings samples. (E) Tailings samples. (F) PCMZ and MCHR samples from the concentrator plant.
Minerals 10 00709 g007
Figure 8. Particle density distribution plots for the feed samples. (A) −2 mm crush. (B) PCMZ_HG. (C) PCMZ_MG. (D) MCHR_FO. (E) MCHR_FT. (F) PCMZ and MCHR samples from the concentrator plant. The grey shaded areas represent the chromite population.
Minerals 10 00709 g008
Figure 9. Particle density distribution plots for the tailings samples. (A) PCMZ_HG. (B) PCMZ_MG. (C) MCHR_FO. (D) MCHR_FT. (E) PCMZ and MCHR samples from the concentrator plant.
Minerals 10 00709 g009
Figure 10. Plot of cumulative liberation yield (‘cumulative mass recovery%’) versus the level of liberation (‘exposure’) of chromite. (A) −2 mm crush samples. (B) Feed samples. (C) Concentrate samples. (D) Middlings samples. (E) Tailings samples. (F) PCMZ and MCHR samples collected from the concentrator plant.
Minerals 10 00709 g010
Table 1. Details of the samples collected for this study.
SampleMass (kg)Sample TypeSample Description
PCMZ_MG12GeologicalMedium grade, disseminated chromite ore from stock pile
PCMZ_HG12GeologicalHigh grade, disseminated chromite ore from stock pile
MCHR12GeologicalMassive chromite ore from stock pile
PCMZ_F4MetallurgicalFeed of PCMZ blend, flotation to recover BMS, PCMZ tailings sent to PCMZ Chrome plant
PCMZ_C4MetallurgicalConcentrate of PCMZ blend, flotation to recover BMS, PCMZ tailings sent to PCMZ Chrome plant
PCMZ_T4MetallurgicalTailings of PCMZ blend, flotation to recover BMS, PCMZ tailings sent to PCMZ Chrome plant
MCHR_F4MetallurgicalFeed from Nkomati MCHR Chrome concentrator plant
MCHR_C4MetallurgicalConcentrate from Nkomati MCHR Chrome concentrator plant
MCHR_T4MetallurgicalTailings from Nkomati MCHR Chrome concentrator plant
PCMZ_MG_FT1.50MetallurgicalBench top flotation first to recover BMS, tailings sent to Wilfley shaker to concentrate chromite
PCMZ-HG_FT1.50MetallurgicalBench top flotation first to recover BMS, tailings sent to Wilfley shaker to concentrate chromite
MCHR_FT1.50MetallurgicalBench top flotation first to recover BMS, tailings sent to Wilfley shaker to concentrate chromite
Table 2. Reagent suite used for the flotation test work including the sequence of addition, conditioning time and reagent dosages.
Reagent and Sequence of AdditionSolution Strength (%)Conc Active Ingredient (%)Reagent Dosage (g/t)Volume of Reagent to Add to Cell Per 1 kg Ore (mL)Conditoning Time (Min)
(1) Collector: Senkol 700100100100.01Add during milling
(2) Collector: SIBX1100100101
(3) Frother: Senfroth XP20011002022
(4) Depressant: Sendep 300710035052
Table 3. Milling times for the ores from the Nkomati nickel mine. Milling times for the different target grinds are determined by substituting y = 70, 80 and 90.
SampleWeight Fraction (%)Milling EquationR2 Value
10 min25 min50 min
PCMZ_MG57.5080.6092.60y = 0.8369x + 53.1870.8987
PCMZ_HG39.4061.7089.50y = 1.2382x + 28.4520.9936
MCHR57.9086.8098.50y = 0.9592x + 53.8900.8602
Weight fraction computed as % of mass that passes a 75 μm sieve.
Table 4. Chromite assays of the three ores including chromite recovery and mass pulls based on laboratory-scale gravity separation using a Wilfley shaking table at the three target grinds.
SampleCr (ppm)Cr2O3 Grade (%)Cr2O3 Recovery (%)Mass Pull (%)
PCMZ_MG_FT_70 wt%_F103,554---
PCMZ_MG_FT_70 wt%_C248,260367130
PCMZ_MG_FT_70 wt%_M64,9701059
PCMZ_MG_FT_70 wt%_T44,17562355
PCMZ_MG_FT_80 wt%_F90,147---
PCMZ_MG_FT_80 wt%_C183,863277035
PCMZ_MG_FT_80 wt%_M40,945649
PCMZ_MG_FT_80 wt%_T53,94182543
PCMZ_MG_FT_90 wt%_F100,288---
PCMZ_MG_FT_90 wt%_C182,966276133
PCMZ_MG_FT_90 wt%_M80,8441223
PCMZ_MG_FT_90 wt%_T82,82052160
PCMZ_HG_FT_70 wt%_F37,178---
PCMZ_HG_FT_70 wt%_C74,102116432
PCMZ_HG_FT_70 wt%_M11,430228
PCMZ_HG_FT_70 wt%_T28,38943344
PCMZ_HG_FT_80 wt%_F39,034---
PCMZ_HG_FT_80 wt%_C60,12995435
PCMZ_HG_FT_80 wt%_M10,4312313
PCMZ_HG_FT_80 wt%_T28,97043952
SampleCr (ppm)Cr2O3 Grade (%)Cr2O3 Recovery (%)Mass Pull (%)
PCMZ_HG_FT_90 wt%_F36,648---
PCMZ_HG_FT_90 wt%_C70,048103619
PCMZ_HG_FT_90 wt%_M21,714334
PCMZ_HG_FT_90 wt%_T35,62755961
MCHR_70 wt%_F249,049---
MCHR_70 wt%_C312,095464334
MCHR_70 wt%_M271,0424099
MCHR_70 wt%_T250,542374848
MCHR_80 wt%_F248,890---
MCHR_80 wt%_C317,386466047
MCHR_80 wt%_M253,4553744
MCHR_80 wt%_T240,433343638
MCHR_90 wt%_F228,904---
MCHR_90 wt%_C304,072445743
MCHR_90 wt%_M225,8583345
MCHR_90 wt%_T229,401343838
MCHR_FT_70 wt%_F249,256---
MCHR_FT_70 wt%_C322,812475240
MCHR_FT_70 wt%_M269,2203998
MCHR_FT_70 wt%_T238,004353840
MCHR_FT_80 wt%_F246,030---
MCHR_FT_80 wt%_C317,050465341
MCHR_FT_80 wt%_M281,395411311
MCHR_FT_80 wt%_T220,029323337
MCHR_FT_90 wt%_F241,793---
MCHR_FT_90 wt%_C308,442456148
MCHR_FT_90 wt%_M246,7933655
MCHR_FT_90 wt%_T230,475343334

