Article

Microstructure Investigation of Oil-Bearing Rhyolites: A Case Study from the Hailar Basin, NE China

1
School of Geosciences and Info-Physics, Central South University, Changsha 410083, China
2
College of Earth Sciences, Jilin University, Changchun 130061, China
3
Key Laboratory of Mineral Resources Evaluation in Northeast Asia, Ministry of Natural Resources, Changchun 130061, China
*
Author to whom correspondence should be addressed.
Minerals 2020, 10(8), 699; https://doi.org/10.3390/min10080699
Submission received: 6 June 2020 / Revised: 1 August 2020 / Accepted: 5 August 2020 / Published: 6 August 2020
(This article belongs to the Special Issue Microtexture Characterization of Rocks and Minerals)

Abstract

:
Understanding the microstructure of rhyolites may greatly promote exploration efforts on rhyolitic hydrocarbon reservoirs; however, related studies are sparse. In this contribution, the microstructure and related porosity of oil-bearing rhyolitic lavas from the Hailar Basin (NE China) were investigated using a combination of optical microscopy, fluorescence image analysis, and scanning electron microscopy. The direct visual and quantitative analyses show that the rhyolites are heterogeneous and porous rocks and have complex microstructures. Phenocryst-rich rhyolitic lava, perlitic lava, and spherulitic rhyolite may be favorable targets for rhyolitic hydrocarbon exploration. For the phenocryst-rich rhyolitic lavas, embayment pores, cleavages, cavitational and shear fractures, and intracrystalline sieve pores are commonly observed in the phenocrysts; while flow-parallel laminar and micropores are ubiquitous in the groundmass. Perlitic lavas are characterized by the occurrence of numerous perlitic fractures which can also be produced in the glassy groundmass of other lavas. Spherulitic rhyolites mainly consist of small-sized (<1 mm) clustered or large-sized (>1 mm) isolated spherulites. Clustered spherulites are characterized by the development of interspherulite pores. Isolated spherulites contain numerous radiating micropores. Both types of spherulites may have water expulsion pores formed in the spherulite–glass border. The formation of the microstructure and related porosity of rhyolites is controlled by pre-, syn- (e.g., deuteric crystal dissolution, cavitation, ductile–brittle deformation, and high-T devitrification), and post-volcanic (e.g., hydration and low-T devitrification) processes. Although pores with diameters > 50 μm are often observed, small pores dominate in pore-size distribution. Small (<15 μm) and large (>300 μm) pores give the most volumetric contribution in most cases. Medium-sized pores with diameters ranging from ~150–300 μm are the least developed and contribute the least to the total volume. The results of this paper can be beneficial to further the understanding of the microstructure and pore system of rhyolites and may be applied to rhyolitic lava hydrocarbon reservoirs elsewhere.

1. Introduction

Volcanic rocks occupy approximately 8% of global exposures [1]. Rhyolites are one of the major constituents of volcanic rocks (~20% globally) but are historically considered to have insignificant reservoir potential [2,3,4]. In the past two decades, advanced understandings of volcanology and reservoir characteristics suggest that rhyolitic reservoirs can be a valuable hydrocarbon source [5,6,7,8,9,10,11]. The identification and appropriate interpretation of rhyolitic rocks can considerably promote hydrocarbon exploration efforts [6,7,8,9]. An increasing number of rhyolitic hydrocarbon reservoirs have thus been discovered and developed worldwide [4,5,9].
Rhyolites consist of phenocrysts of quartz and alkali feldspar, often with minor plagioclase and biotite, in a microcrystalline or glassy groundmass. They can be pyroclastic deposits (fragmental and glassy) or lavas/intrusions (non-fragmental, partly glassy, and partly devitrified) and are characterized by variable textures and strong anisotropy, resulting in a complicated pore system [7,8,9,10,12]. For example, the summarized porosity and permeability of rhyolitic reservoirs in China exhibit a wide range of variations from 0.8 to 32.3% and 9.87 × 10⁻¹⁸ to 2.11 × 10⁻¹³ m2, respectively [13]; and the measured porosity and permeability of rhyolitic tuffisites from the Cordón Caulle and Chaitén volcanoes of Chile are 8.8 to 28.6% and 1.91 × 10⁻¹⁶ to 6.87 × 10⁻¹⁵ m2 [14]. Consequently, more efficient hydrocarbon exploitation and recovery of this valuable but heterogeneous reservoir will require a clear understanding of the storage and transport processes related to the fluids, which are considered to be mainly controlled by the microstructure of such rocks [12,13,14,15,16]. Moreover, rhyolites play an important role in geothermal reservoirs as well, and so fluid flow characteristics are also important for geothermal energy production. For example, in the Krafla volcano of Iceland, supercritical fluids suitable for powerful energy extraction can be stored at the margins of the rhyolitic intrusions [12,17]. Thus, the microstructural investigation of rhyolites has far-reaching scientific and economic implications; however, to date, such studies are sparse.
Microstructural investigations are typically made by fluid invasions such as gas physisorption, helium pycnometry, and mercury intrusion [14,18,19,20,21,22,23,24]. Although these indirect experimental techniques can provide quantitative measures of connected porosity, and the diameters of connected pore throats, they do not involve direct observations of the morphology of pore system and often provide only very limited information on individual or non-connected pores [18,25,26]. Therefore, direct microscopic observation is widely used to study the morphology, pore-size distribution, and pore-volume contribution of pore networks [14,27,28,29,30]. For example, textural information from fluorescence images and/or scanning electron microscope images reveals the nature of the porous architecture [10,11,14]. Furthermore, the microscopic imaging of organic-matter-bearing samples can clearly show the relationship between organic matters and the pore system and avoid the artefacts caused by the intrusion of analogue epoxy.
The main objective of this paper is to provide direct visual and quantitative analyses of the microstructure of oil-bearing rhyolitic lavas. We investigated the microstructures of samples filled by solidified crude oil from the Hailar Basin (NE China) using a combination of optical microscopy, fluorescence image analysis, and scanning electron microscopy. The type, morphology, pore-size distribution, and pore-volume contribution of different pores were deciphered. The formation mechanisms of various microstructures are discussed, and the related reservoir spaces are evaluated. The analyzed results can be beneficial to further the understanding of the microstructure and pore system of rhyolites, and may be applied to rhyolitic lava hydrocarbon reservoirs elsewhere.

2. Geological Background

The study area is located in the Hulun Nur Sag of the Hailar Basin (NE China), ~1000 km north of Beijing (Figure 1a). The basin is a Mesozoic to Cenozoic petroliferous volcanic basin, with NE–SW-trending boundary faults (Figure 1a,c) [31,32]. The estimated oil and natural gas reserves of the Hailar Basin are ~4.2 × 10⁸ bbl and 113.3 × 10⁸ m3, respectively [33]. The Lower Jurassic Budate Group and sub-Jurassic units are considered to be the basement of the Hailar Basin [32,34]. The tectono-stratigraphic sequences of the basin are generally subdivided into four stages: (1) pre-rift; (2) syn-rift; (3) post-rift; and (4) uplift (Figure 1b). Among them, the fault-controlled syn-rift stage accounts for the most intense subsidence and sedimentation of the basin [32]. The formation of Tongbomiao and Nantun formations (together also known as the Shangkuli Formation) during this stage is characterized by the deposition of thick dark mudstones and eruption of voluminous rhyolites (Figure 1b). The dark mudstones usually have total organic carbon (TOC) contents > 2% and serve as primary source rocks (Figure 1b) [33]. The previously developed hydrocarbon fields within the Hailar Basin are mainly conventional reservoirs [33], but the rhyolitic reservoirs have been proven to have important potential in recent studies [10,11,35].
The present study focuses on a rhyolitic lava dome located in the west margin of the Hulun Nur Depression (Figure 1a). Coherent rhyolitic lavas comprise ~70 vol.% of the volcanic edifice, other rocks are mainly autobreccias, hyaloclastites, and pyroclastic rocks. The studied outcrop is a ~200 m-long section of a 5–15 m-thick rhyolitic lava flow. The lavas exhibit a compositional range from ~70 to 80 wt. % SiO2 and yield zircon U–Pb ages between 136 and 125 Ma [10,36]. The lavas are considered to be part of the Early Cretaceous Shangkuli Formation and are underlain by thick dark mudstone (>792 m) of the Nantun formation that performs as source rocks [10,33]. Almost all rhyolitic lavas contain crude oil that makes the outcrop a representative site for investigating the microstructure of rhyolites (Figure 2a). The NE–SW-trending boundary fault (crustal-scale) and secondary faults (mesoscale) serve as first-order channels for oil charging and migration [10]. On a smaller scale, fractures with lengths of 1–15 m, apertures of 0.5–15 mm, and spacings of 5–100 cm are well developed. These fractures are mainly joints formed in mode I (opening) during the emplacement and cooling of the rhyolitic lava at the ground surface [10]. The orientation of the fractures is varied but the steeply dipping set (>55°) is the most dominant. These fractures are commonly filled by crude oil and serve as second-order channels for oil charging and migration.
Figure 1. (a) Geological sketch map showing the location of samples analyzed in this study. (b) Conceptual tectono-stratigraphic column for the Hailar Basin, modified according to Zheng et al. [10]. J1b, Budate Group; J2–K1t, Tamulangou Formation (Fm.); K1t, Tongbomiao Fm.; K1n, Nantun Fm.; K1yl, Yiliekede Fm.; K1d, Damoguaihe Fm.; K1y, Yimin Fm.; K2q, Qingyuangang Fm. The circle in the second column (stress direction) represents the quadrant of the geographic orientation, the arrow indicates the strength of the stress, and the arrow direction stands for the main stress axis. (c) Cross-section of the basin fill drawn through A–B, modified according to Chen et al. [37].
Minerals 10 00699 g001

3. Samples and Methods

3.1. Samples

As the study area is located in the Lake Hulun National Nature Reserve, only one well (Well Lun 1 shown in Figure 1a) has been drilled ~10 km away. Oil-bearing rhyolites were taken from the outcrop shown in Figure 2a to represent the primary zone of interest. The lithological definitions and terminologies used in this study follow McPhie et al. [38]. Fourteen flow-banded lavas (Figure 2b) and twenty spherulitic rhyolites (Figure 2c,d) were selected for detailed analyses. These selected samples contain abundant crude oil and thus are representative for deciphering the oil-bearing features of rhyolites.
The flow-banded rhyolitic lava samples (n = 14) are dark grey or black and commonly non-vesicular. The samples are characterized by well-developed flow foliations that are defined by variations in crystallinity, color, and/or the degree of devitrification (Figure 2b). Among them, eight samples exhibit typical porphyritic textures; six samples are characterized by perlitic textures. The phenocryst-rich lavas consist of 5–15 vol. % phenocrysts (mainly K-feldspar with minor quartz), 60–70 vol. % microlites, and 10–30 vol. % glasses. In contrast, most of the perlitic lavas are vitreous.
The spherulitic rhyolite samples (n = 20) are black or grey and non-vesicular. All samples host abundant well-preserved spherulites. Among these, ten samples are rhyolitic vitrophyre (Figure 2c). The matrix is dark and coherent glass that contains visible flow bands. Isolated, light grey spherulites cross-cut flow bands and exhibit a variation of sizes (1–5 mm) that are distributed homogeneously. The spherulite contents commonly range from 30 to 60 vol. %. Another ten samples are spherulitic rhyolite that consists of clustered spherulites (Figure 2d). The spherulites are light grey and closely packed with sizes commonly less than 1 mm. The spherulite contents are between 70 and 100 vol. %, and the glass groundmass contents vary from 0 to 30 vol. %. The groundmass of all spherulitic rhyolite samples exhibits perlitic textures similar to those of the perlitic lava samples.

3.2. Methods

Hand-specimens were cut into polished thin-sections based on the standard DZ/T 0275.2-2015 of the Chinese geology and mineral resources industry. Photomicrographic observations and imaging were taken by an Olympus BX51 optical microscope. Then, fluorescence analyses and imaging of the thin sections were performed using a Zeiss Axio Imager M1m fluorescence image analyzer (FIA), housed at the Exploration and Development Research Institute of Daqing Oilfield Company Ltd. (EDD), Daqing, China. A mercury source equipped with UV excitation filters was used for fluorescence excitation. The peak intensity of the UV source was 360 to 365 nm, and the emitted fluorescence was received from 450 to 700 nm (visible light). Fluorescence images with a resolution of 2584 × 1936 pixels were collected with the FIA. As different oil compositions have diverse fluorescence-emission spectra, the light (aromatic), intermediate (resin), and heavy (asphaltene) components exhibit blue–green (455–577 nm), yellow–orange (577–622 nm), and red–dark-brown (622–700 nm) colors in the images, respectively.
The polished thin-sections were further imaged using a SEM (JXA8230, JEOL Co. Ltd., Tokyo, Japan) at the EDD, Daqing, China. Samples were mounted to SEM stubs and coated with carbon. SEM imaging was conducted using standard operating conditions: accelerating voltage of 20 kV, current value of 1 × 10⁻⁸ A, and working distance of 1 mm. Secondary electron images (SEIs) were obtained by a secondary electron detector.
The obtained fluorescence images were further analyzed via a CIAS-2004 color image analysis system, produced by Sichuan University, Chengdu, China, and housed at Jilin University, Changchun, China, to examine the oil-bearing pore system and calculate quantitative microstructural parameters. The effective porosity, pore size, and pore volume of each fluorescence image taken from samples were measured through hue-, luminance-, and saturation-based scanning and analyses. The connectivity levels of different pores were visually estimated by the distribution of various crude oil components based on their corresponding fluorescent colors. The bulk effective porosity for individual samples was calculated as the arithmetic average of six fluorescence images. The analytical errors for effective porosity, pore size, and pore volume were below 10%. The detailed techniques and calculation principles were based on the standard SY/T 6103-2004 of the Chinese petroleum industry.

4. Results

4.1. Pore Type Classification and Qualitative Description of Microstructures

Field and microscopic observations and fluorescence and SEM analyses show that rhyolites have diverse textures and associated microstructures (Table 1). The most commonly encountered textures of the rhyolites are porphyritic, perlitic, and spherulitic textures. The corresponding phenocryst-rich lavas, perlitic lavas, and spherulitic lavas occupy ~30 vol. %, ~20 vol. %, and ~40 vol. % of the studied outcrop, respectively.
The porphyritic texture consists of relatively large euhedral–subhedral phenocrysts scattered in much finer-grained or glassy groundmass (Figure 3a). The size of the phenocrysts is also heterogeneous, from 1 mm to several centimeters. Many phenocrysts have experienced shape-modifying processes, which give rise to embayed or rounded outlines (Figure 3a), and locally, fine-grained minerals surround the phenocrysts. The embayment-shaped pores of K-feldspars commonly contain abundant asphaltenes, which are large-sized with diameters ranging from 100 to 500 μm and aspect ratios between 1:1 and 1:2 (Figure 3b).
Phenocrysts are usually cracked or sometimes broken apart with jigsaw-fit textures (Figure 3a). The cracks include cleavages, cavitational fractures, and shear fractures. The cleavages of K-feldspars are perfect on {001} and less perfect on {010} [39]. In the studied samples (n = 8), the {001} cleavages of K-feldspars are well-developed, with apertures varying from 5 to 30 μm (Figure 3d), aromatics and resins may be injected along the fractures. The {010} cleavages are discontinuous and contain few oil components, the apertures are commonly <10 μm (Figure 3d). The cavitational and shear fractures mainly occur along original cleavages but modify the well-defined planes to irregular shapes (Figure 3b). Sieve texture is observed in almost all K-feldspars (Figure 3b,d), and varies in size from randomly distributed minute pores (1–5 μm) to large cavities (> 50 μm). Such porosity is defined as intracrystalline sieve pores. The closed and cul-de-sac cleavages and intracrystalline pores are often connected by cavitational and shear fractures to form an effective catenary pore network as observed in fluorescence images.
The fine-grained or glassy groundmass displays considerable porosity. Panels a and b of Figure 3 show the flow-banded groundmass filled by crude oil. Most of the flow bands are uniform in the outcrop-scale (Figure 3b) and gently dipped. At higher magnification, a strong alignment of needle-shaped microlites is apparent. The pores have characteristics unlike vesicles (usually smooth-walled and rounded- or elongated-shaped) [40,42]. Most of the pores have ragged walls marked by the protrusion of microlites and phenocrysts. These pores are formed by overlapping of two different types of pores, including flow-parallel laminar pores and micropores. The geometry of the laminar pores is commonly planar and exhibit various folds or s-shaped shear arrays. The apertures range from tens to hundreds of micrometers. The ragged pore walls indicate that the melt was ductile and effectively tore rather than fractured [42]. Some large-sized pores deviate around phenocrysts and have ragged walls and blunt terminations (Figure 3b). The pores occur in a ‘pressure shadows’ configuration further indicating that they are not the result of vesiculation or secondary fracturing [42]. The flow-parallel micropores develop between parallel crystal fibers (microlites) and display platy shapes (Figure 3c). The microlites are aligned parallel to the macroscopic layers. The micropores are micrometer-spaced and have a homogeneous size distribution with apertures of 3–10 μm. The micropores generally contain considerable light oil components (Figure 3b,c). Both flow-parallel laminar pores and micropores can extend over several centimeters horizontally and connect to each other by interweaving, or sometimes intersection with other oblique fractures.
Perlitic fractures are widespread in rhyolitic glasses [45,49,50]. They are fragile, intersecting, arcuate, and gently curved fractures arranged around unbroken glass cores (Figure 4a,b). In the studied samples (n = 6), the perlitic fractures are usually less than several millimeters across with apertures commonly from 10 to 20 μm. Most perlitic fractures are well-connected and contain moderate crude oil (Figure 4b).
Clustered spherulites are often observed in rhyolitic rocks [47,55]. They are a group of primarily spherical or equiaxial polyhedral masses comprising radiating acicular crystal fibers with concentric banding (Figure 4a–c). In the studied samples (n = 10), the diameter of a single spherulite is mainly less than 1 mm, and the cluster varies from several millimeters to several centimeters across (Figure 4a–c). The spherulites are arranged in a moderately packed irregular pattern and leave variously-shaped voids between their outlines (Figure 4c). Such pores show diameters from 50 to 500 μm and are defined as interspherulite pores. Moreover, considerable spaces develop in the contact zone between clustered spherulites and glassy groundmass (Figure 4a,b). These pores are referred to as water expulsion pores and have diameters ranging from 100 to 500 μm [47]. Both interspherulite and water expulsion pores may store crude oil (Figure 4a–c). The interior of a spherulite is generally imporous (Figure 4d) but may develop numerous tiny radial fractures (aperture < 5 μm) in the outermost layer and cavitational fractures (5 μm < aperture < 40 μm) (Figure 4d) [11,40].
Isolated spherulites are also widely seen in rhyolitic rocks and exhibit notable differences compared with those that grow in clusters [47,53,55]. The isolated spherulites mainly show spherical geometry and disperse in glassy groundmass (Figure 5a). They consist of radiating arrays of crystal fibers with well-defined crystallographic orientations (Figure 5a). In the studied samples (n = 10), the diameters of isolated spherulites (>1 mm) are larger than those of clustered spherulites (<1 mm). Additionally, in contrast to the imporous interior of clustered spherulites, isolated spherulites have abundant intraspherulite pores (Figure 5b). The microstructure of an individual spherulite can be divided into three zones from the inside out (Figure 5b): (Z1) imporous spherulite center; (Z2) porous middle layers; and (Z3) porous glassy shell. The Z1 usually occupies ~10 vol. % of an individual spherulite. More than 80% of spherulite is contained in the Z2. Numerous radiating crystal fibers and radiating micropores develop alternatively in Z2 (Figure 5c,d). Both crystal fibers and micropores are geometrically homogeneous and have diameters commonly between 3 and 8 μm. There are also some mosaic crystal masses which disperse in Z2, and impinge on the radiating crystal fibers (Figure 5c). Z3, the relatively thin (<10 vol. %), glassy outer skin of spherulites contains water expulsion pores (Figure 5b). The pores are concentric ring cavities and may occur on the outside or inside, or both sides of the glassy shell (Figure 5c). The above microstructural characteristics can be further revealed from the perspective of another spherulite cross-section (not across the center of sphere) (Figure 6). The bundle-shaped radiating crystal fibers, mosaic crystal masses, and radiating micropores distribute homogeneously in Z2, which represent the primary reservoir space of an isolated spherulite.

4.2. Estimates of Porosity and Connectivity of Rhyolites

As rhyolites are highly heterogeneous rocks, various microstructures develop in different subtypes of rhyolites [7,42,45,55]. Flow-banded rhyolites are rhyolitic lavas in which flow foliations are well-developed [41,44,57]. The samples are characterized by porphyritic textures and yield effective porosities (n = 8) between 4.7 and 29.8% with a mean value of 14.3%. The connectivity of the pore system in the samples is fairly good. Perlitic lavas are rhyolitic glass with abundant perlitic fractures [49,50]. The samples have effective porosities (n = 6) ranging from 2.9 to 31.9% with a mean value of 10.9% and exhibit moderate permeability. The perlitic rhyolitic lava from the Yellowstone geothermal system of Wyoming has low porosity and permeability as reported by Dobson [58]. This is in great contrast to the results of our study and is probably caused by different hydration intensities during the formation of perlitic fractures [49,50]. Spherulitic rhyolites are characterized by conspicuous spherulites in different sizes and densities [47,53,55]. Spherulitic rhyolites I are defined here as those rhyolites that consist mainly of clustered spherulites, sometimes with minor perlitic-fractured glass. They show effective porosities (n = 10) between 4.6 and 19.7% (mean value = 11.2%) with fairly good pore connectivity. In contrast, other spherulitic rhyolites are characterized by scattering of isolated spherulites in perlitic-fractured glass and are classified as spherulitic rhyolites II. Such rhyolites have effective porosities (n = 10) of 4.8–28.5% (mean value = 16.8%) and display good connectivity of the pore network. There is no continuum between spherulitic rhyolites I and II, and they always occur independently in the study area. The effective porosity and estimated connectivity of these different types of rhyolites are listed in Table 2.
Notably, vesicles and joints are usually encountered in the rhyolites of the study area. Our observations show that vesicles are commonly centimeter-sized closed (sometimes cul-de-sac) pores and are essentially oil-free (Figure 2e). Joints mainly act as channels for oil charging. Thus, the contribution of these pores to the bulk effective porosity is negligible and not discussed here. For the spatial distribution of these different rhyolites, the phenocryst-rich lavas and spherulitic rhyolites II are mainly located in the proximal and medial zones of the volcanic edifice, the spherulitic rhyolites I and perlitic lavas dominate the medial zone, while the distal zone is characterized by vesicular rhyolites (Figure 2a). This distribution pattern suggests that the proximal and medial zones may be the preferred target for oil exploration in the study area, and the reservoir quality probably decreases away from the crater. This understanding is consistent with the reservoir evaluation results of the Qingshen rhyolitic gas field in the Songliao Basin, NE China [9].

4.3. Quantitative Analyses of Microstructures and Pore System

The number of individual pore-body sizes is estimated from the fluorescence images. The pores filled with crude oil with various fluorescence wavelengths are identified and measured by the color image analysis system. Thus, all pores reported below are effective reservoir spaces. As individual flow-parallel and radiating micropores are too small and beyond the analytical resolution of fluorescence imaging, the connected pore network of these pores was analyzed to represent their size distribution and volumetric contribution. Panels a, c, e, g, and i of Figure 7 show histograms of the pore-size distribution for different microstructures of rhyolites, accompanied by the cumulative percent of the distribution. The sizes of the pores have been assumed as the diameters of spheres of equivalent volume to each pore. Furthermore, histograms of the total volumetric contribution of the pore sizes are displayed in panels b, d, f, h, and j of Figure 7, along with the cumulative percentage.
For phenocrysts (Figure 7a,b), smaller pores govern the distribution with the most abundant pores having a diameter of <15 μm. Number of pores decreases proportionally with increasing diameters from 15 μm to 165 μm. Pores with diameters between 165 and 300 μm are seldom observed. Though small pores dominate in number, the volumetric contributions of different-sized pores are almost equivalent, and the greatest one comes from large pores that have diameters > 300 μm.
For groundmass (flow banded) (Figure 7c,d), smaller pores still dominate in number. The proportional decrease in pore number with increasing pore size is smoother than that of phenocrysts. The volumetric contributions of different-sized pores show a similar pattern to its pore-size distribution. Smaller pores govern in both number and volume.
For perlitic textures (Figure 7e,f), the smallest pores (<15 μm) remarkably dominate in number. Although smaller pores still contribute the most volume, medium- and large-sized pores occupy considerable total volume.
Clustered spherulites (Figure 7g,h) exhibit similar pore-size distribution and pore-volume contribution patterns with those of the groundmass. Both the pore number and volume are dominated by small pores.
For isolated spherulites (Figure 7i,j), smaller pores are still the most numerous. The volumetric contributions of different-sized pores decrease slowly with pore-size increment, but large-sized pores (diameters > 300 μm) dominate in volume.

5. Discussions

5.1. Formation Mechanisms

The development of textures and corresponding microstructures in rhyolites depends on three major stages: (S1) formation of primary textures via pre-volcanic processes; (S2) reformation of primary textures by syn-volcanic processes; and (S3) modification by post-volcanic processes [10,38,45]. The S1 and S2 perform under closed-system conditions and are considered to be primary processes [7]. In contrast, the S3 occurs in open-system conditions and is thought to be a secondary process [7].
The porphyritic texture is produced by S1 and S2 (Figure 3) [38]. The crystals (phenocrysts) grow during early, slow, subsurface cooling of magma, and are suspended in the melt. Variation of chemical or physical conditions during magma migration triggers disequilibrium between the solid and liquid phases [59]. The resulting crystal partial resorption forms embayment and intracrystalline sieve pores [7,10,38]. Even in undeformed rhyolites, cavitational and shear fractures are often observed in phenocrysts. They are formed during S2. The cavitational fracture is formed by cavitation of the magma, which can extract volatiles from magma causing premature embrittlement and weakening [40]. They are not formed by rapid decompression of phenocrysts during vesiculation, as prominent vesicle textures are not observed in the samples [59]. The shear fractures are shear failures caused by magma movement during lava emplacement [40,41,43]. As cleavages represent the weakest planes of a feldspar phenocryst, cavitational and shear fractures tend to inherit the cleavage planes formed during S1. The length and aperture of the cleavage would be enhanced. New fractures oblique to cleavages would also be generated, with an angle that depends mainly on crystal properties and the state of stress [60,61].
Flow foliations are one of the most typical features of rhyolites (Figure 2b) [44]. They are generated in response to the flowage of viscous lava by extrusion and outflow during S2 [7,10,62]. Shear stresses make the horizontal layers propagate upwards from the flow base [38,44,62]. Three deformational processes may disrupt the initial lava flow configuration: the rise of coarse pumice diapirs from the base of the flow, the inward propagation of fractures in areas of extension, and surface folding in sites of flow-parallel compression [44]. When the lava is in the ductile–brittle state, the deformational processes form numerous flow-parallel laminar pores by ductile–brittle failure [38,44,62]. Flow-parallel micropores are formed by low-T devitrification during S3 [11]. Flow-parallel laminar pores provide channels for permeation of fluids into the rock and greatly promote the devitrification of glassy groundmass [45,46]. As the density of rhyolitic glass (2.13–2.51 g/cm3) is smaller than that of SiO2 polymorphs (2.65 g/cm3) and K-feldspars (2.55–2.63 g/cm3) [63,64], microlites formed by devitrification occupy less volume than the primary glass. This density decrease is caused by the rejection of water during the growth of anhydrous minerals of the microlites [47]. As the microlites grow and expel water outwardly, the flux of water at the microlite edge forms abundant open spaces and are defined as flow-parallel micropores [47].
Perlitic fractures are formed by the hydration of rhyolitic glass during S3 (Figure 4) [49,50]. Hydration involves the diffusion of water from external sources into the glass, resulting in a volume increase and fracturing during the stress release [38,45]. The lengthscales of water diffusion away from perlite fractures suggest that the fracturing happens at T << glass transition temperatures (Tg) [45].
Spherulites are formed by high-T devitrification under highly non-equilibrium conditions in liquids during S2 (Figure 4, Figure 5, and Figure 6) [47,52,53,54,55]. They are varieties of high-temperature crystallization domains [53]. The geometry of spherulites changes in relation to the supercooling (ΔT) [52,53,54]. Nucleation density increases and crystal size decreases with increasing ΔT [52,56]. Thus, clustered and isolated spherulites are formed at high and low ΔT conditions, respectively. The most likely cause of the formation of intra- and inter-spherulite pores is transient tensional stress that produces a mechanical opening and widening at the interface between the crystallization front and the host rhyolitic melt (T > Tg) [47,55]. The water expulsion pores are formed by expulsion of magmatic water during crystallization of an anhydrous spherulite as evidenced by the distribution of OH groups surrounding spherulites that decreases exponentially away from the spherulite–glass border [47]. The distribution of water around spherulites examined by von Aulock [45] further confirms this understanding.

5.2. Evaluation of Microstructure-Related Reservoir Spaces

Microstructures greatly control the storage and transport processes related to the fluids in rhyolites. Photomicrograph, fluorescence, and SEM observations and quantitative analyses indicate that rhyolites are porous rocks, and the pore size is much larger than most sedimentary rocks from conventional reservoirs. For all textures and associated microstructures, although pores with diameters > 50 μm are often observed, small pores dominate in pore-size distribution (Figure 7), especially those pores with diameters < 15 μm. Small (<15 μm) and large (>300 μm) pores contribute the most volume for most textures/microstructures (Figure 7). Medium-sized pores with diameters ranging from approximately 150 to 300 μm are the least developed, and contribute the least to the total volume (Figure 7).
For phenocrysts (Figure 3a,b,d), intracrystalline sieve pores are widespread and thus dominant in number. The greatest volumetric contribution comes from large-sized embayment pores (>40%). Such pores are good reservoir spaces. For the groundmass of rhyolites, flow-parallel micropores dominate in number and contribute the most volume (Figure 7c,d). The superposed flow-parallel laminar pores are also well-developed. The patterns of the cumulative percentage trend for the groundmass are the smoothest when compared with other textures/microstructures. Therefore, flow-foliation-related pores are stable and favorable reservoir spaces. Phenocryst-rich lavas commonly show good porosity, with the median and mean values of 11.7% and 14.3%, respectively.
The apertures of perlitic fractures are usually small (10–20 μm) (Figure 4a,b). Thus, the smallest pores (<15 μm) are the most abundant in perlitic textures. Perlitic texture (glassy and fractured) represents one of the most unstable textures of rhyolites and is more easily modified by other post-volcanic processes such as alteration and further fracturing [45,49,50,65]. These processes may improve the volume of perlitic fractures. Consequently, medium- and large-sized pores are important components. Perlitic fractures are widespread in rhyolites and are good reservoir spaces in most cases. Perlitic fractures represent the main reservoir spaces of perlites, which have median and mean porosities of 9.3% and 10.9%, respectively.
Interspherulite pores are irregular in morphology that depends on the pack pattern and size of the clustered spherulites. Most (>95%) interspherulite pores are small- to medium-sized (<50 μm) and give >60% volumetric contribution (Figure 7g,h). Radiating micropores are small but numerous in isolated spherulites. They occupy >90% size-distribution of isolated-spherulite-porosity and contribute >70% total volume. Water expulsion pores are typical large-sized pores, they are connected with interspherulite pores in clustered spherulites; together they form an excellent pore network. In isolated spherulites, expulsion pores only take < 1% pore-size distribution, but give >20% volumetric contribution (Figure 7i,j). These three types of pores are all good reservoir spaces, abundant crude oil with various fluorescence is reserved in these pores (Figure 4, Figure 5 and Figure 6). The development of spherulite may increase the reservoir capacity of rhyolites. The spherulitic rhyolites I have median and mean porosities of 11% and 11.2%, respectively, and the spherulitic rhyolites II show even better porosities (median = 15.7%; mean = 16.8%).
In most cases, the microstructure-related reservoir spaces are dominated by small (<15 μm) and large (>300 μm) pores in both pore volume contribution and pore-size distribution. The pore networks are well connected as evidenced by fluorescence images. For such a pore system, the traditional approaches such as water flooding, CO2 flooding, or other enhanced oil recovery techniques would be suitable for hydrocarbon production.

6. Conclusions

The microstructure of rhyolites from the Hailar Basin was imaged and analyzed by the integration of photomicrograph, fluorescence, and SEM techniques. The main findings are as follows:
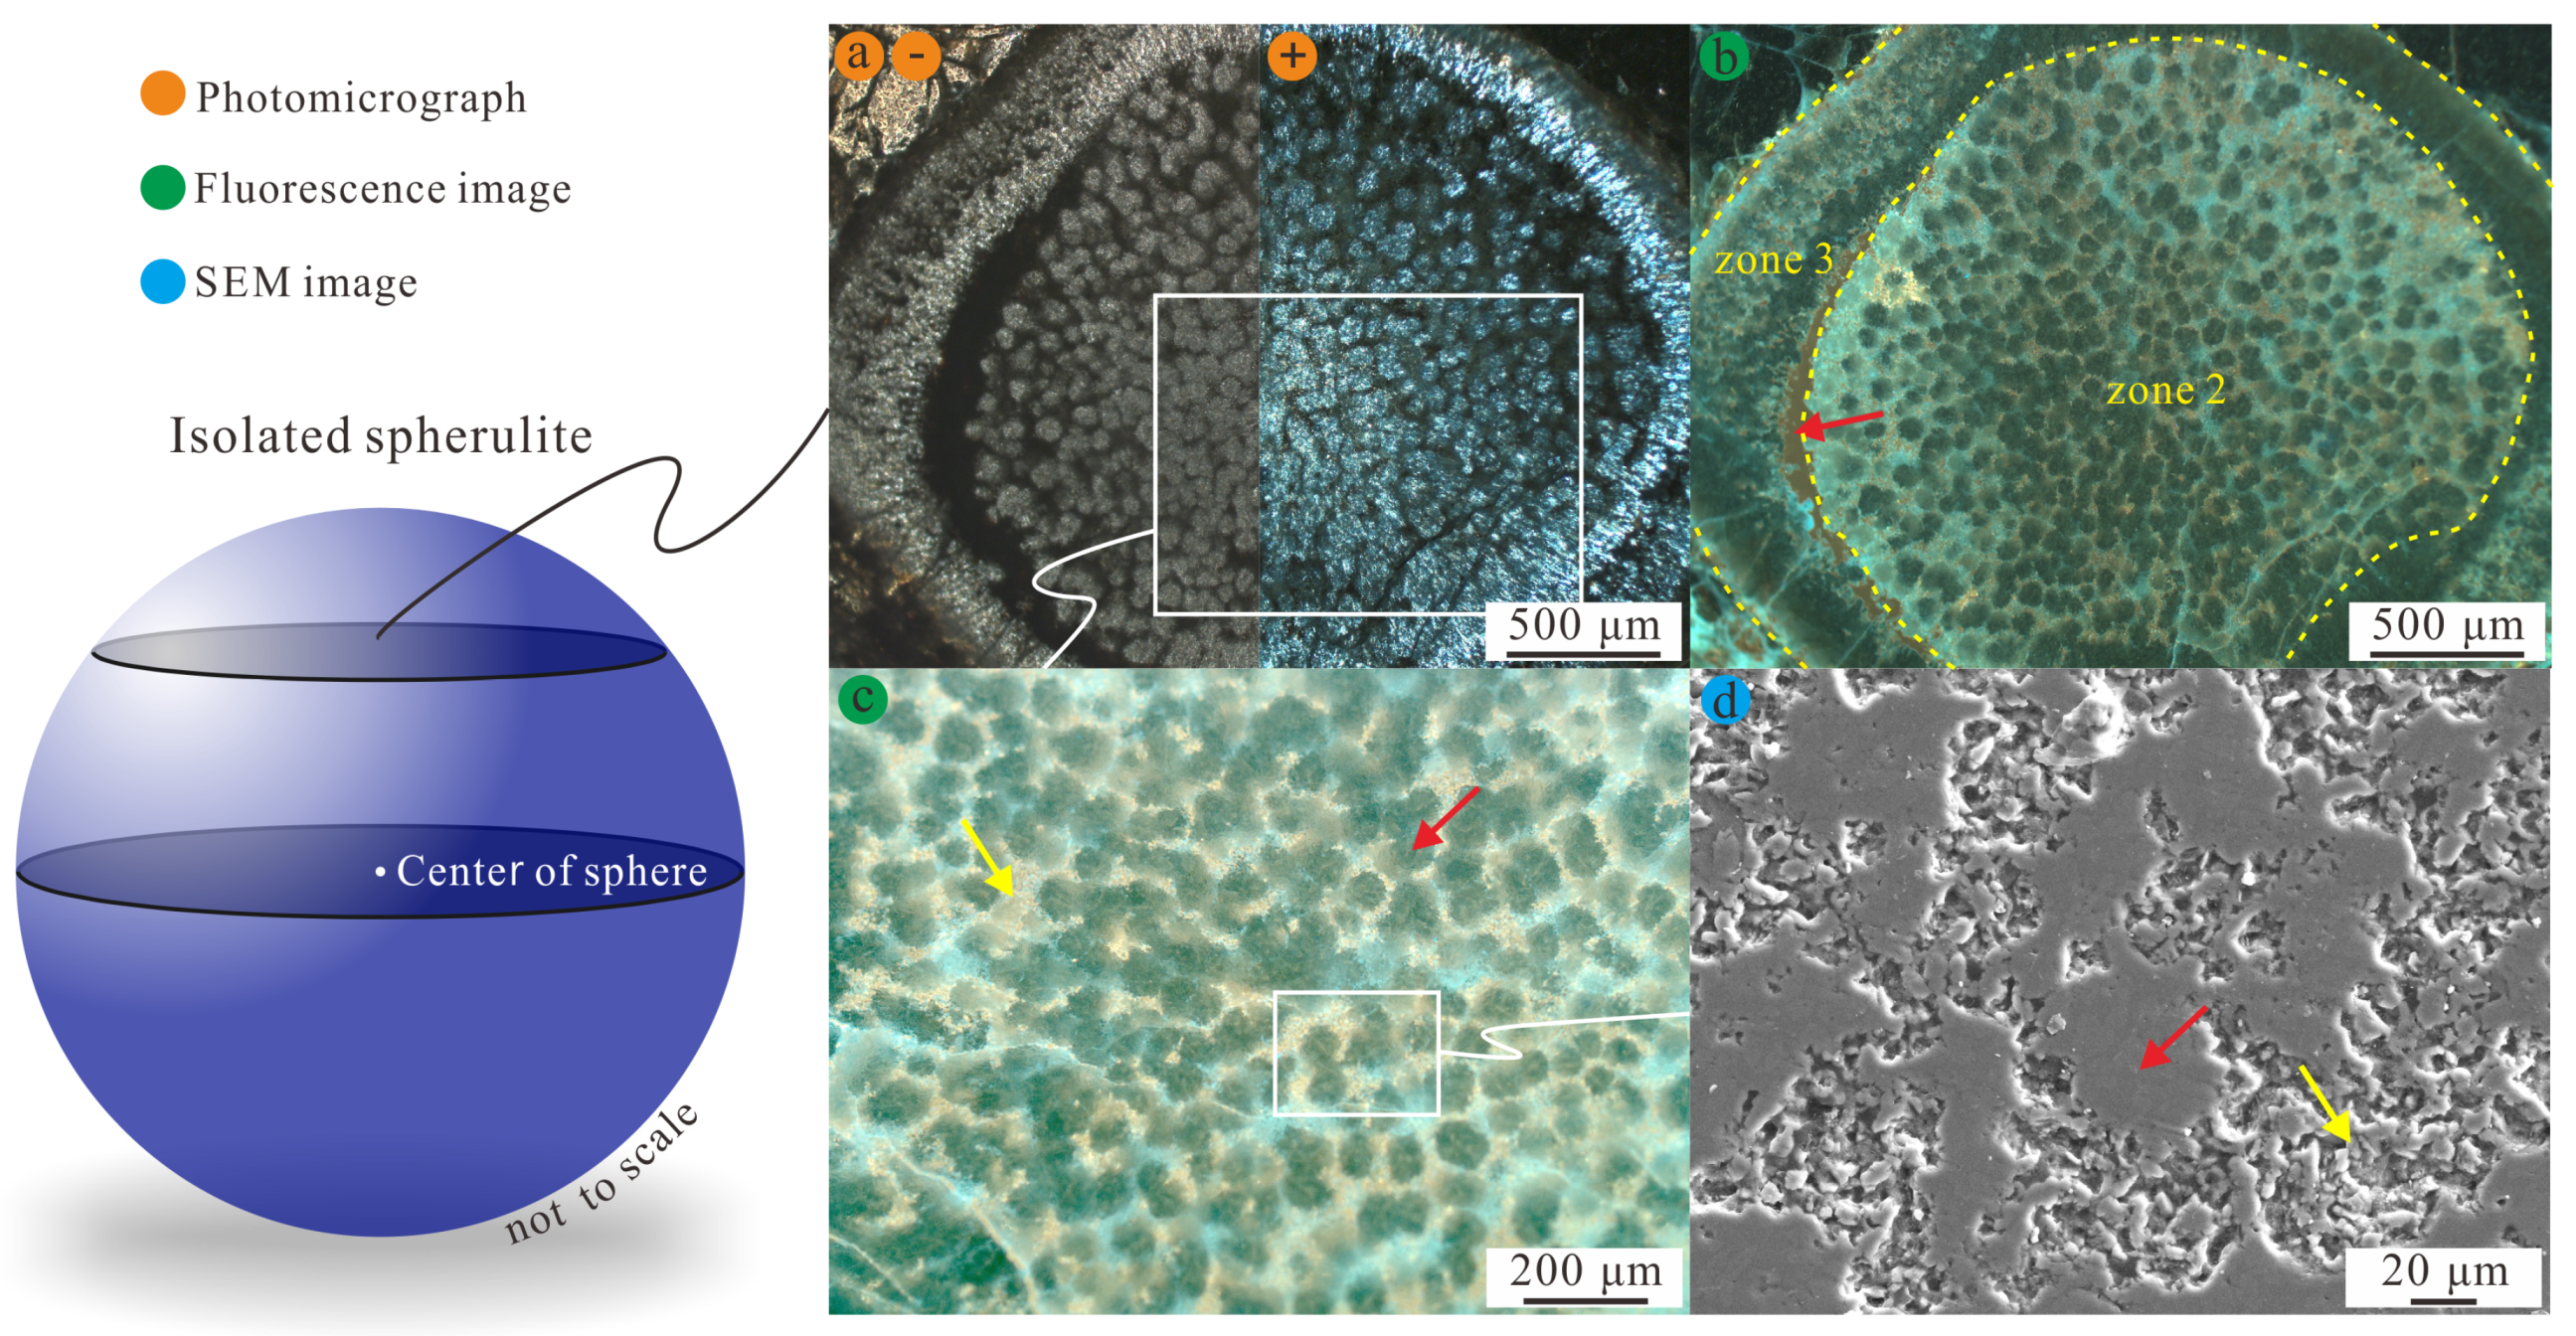
  • Rhyolitic lavas are heterogeneous and porous and have complex microstructures. Embayment pore, cleavage, cavitational and shear fractures, and intracrystalline sieve pores are related to the phenocrysts of the porphyritic texture. The groundmass contains flow-parallel laminar and micropores. Perlitic fractures occur in perlitic textures. Spherulitic textures tend to fall into two classes, being clustered or isolated spherulites. Clustered spherulites are characterized by the development of interspherulite pores. Isolated spherulites contain numerous radiating micropores. Both types of spherulites may have water expulsion pores.
  • Phenocryst-rich rhyolitic lava, perlitic lava, and spherulitic rhyolite may be favorable targets for rhyolitic hydrocarbon exploration.
  • The formation of microstructures and the related porosity of rhyolites are controlled by different processes, such as deuteric crystal dissolution, cavitation, ductile–brittle deformation, hydration, low- or high-T devitrification, and water expulsion.
  • For all microstructures and their related porosity, although pores with diameters > 50 μm are often observed, small pores dominate in pore-size distribution. Small (<15 μm) and large (>300 μm) pores contribute the most volume in most cases. Medium-sized pores with diameters ranging from ~150 to 300 μm are the least developed and contribute the least to the total volume.

Author Contributions

Conceptualization, A.M. and H.Z.; Data curation, H.Z.; Formal analysis, H.Z.; Methodology, H.Z. and X.S.; Project administration, H.Z.; Validation, H.Z.; Writing—original draft, A.M. All authors have read and agreed to the published version of the manuscript.

Funding

This research was funded by the National Natural Science Foundation of China (Grant 41790453) and Opening Foundation of Key Laboratory of Mineral Resources Evaluation in Northeast Asia, Ministry of Natural Resources (Grant DBY-KF-19-09).

Acknowledgments

The authors are grateful for very helpful review comments by two anonymous reviewers. Thanks to Jonathan B. Pham for his help with the English of the manuscript.

Conflicts of Interest

The authors declare no conflict of interest.

References

  1. Wilkinson, B.H.; McElroy, B.J.; Kesler, S.E.; Peters, S.E.; Rothman, E.D. Global geologic maps are tectonic speedometers—Rates of rock cycling from area-age frequencies. Bull. Geol. Soc. Am. 2009, 121, 760–779. [Google Scholar] [CrossRef]
  2. Kingston, D.R.; Dishroom, C.P.; Williams, P.A. Hydrocarbon plays, global basin classification. Oil Gas J. 1985, 6, 265–270. [Google Scholar]
  3. Sun, H.T.; Zhong, D.K. Origin and forming process of the porosity in volcanic hydrocarbon reservoirs of China. J. Volcanol. Geoth. Res. 2018, 350, 61–68. [Google Scholar] [CrossRef]
  4. Schutter, S.R. Occurrences of hydrocarbons in and around igneous rocks. Geol. Soc. London Spec. Publ. 2003, 214, 35–68. [Google Scholar] [CrossRef]
  5. Luo, J.; Morad, S.; Liang, Z.; Zhu, Y. Controls on the quality of Archean metamorphic and Jurassic volcanic reservoir rocks from the Xinglongtai buried hill, western depression of Liaohe basin, China. Am. Assoc. Pet. Geol. Bull. 2005, 89, 1319–1346. [Google Scholar] [CrossRef]
  6. Sun, H.; Zhong, D.; Zhan, W. Reservoir characteristics in the Cretaceous volcanic rocks of Songliao Basin, China: A case of dynamics and evolution of the volcano-porosity and diagenesis. Energy Explor. Exploit. 2019, 37, 607–625. [Google Scholar] [CrossRef] [Green Version]
  7. Sruoga, P.; Rubinstein, N. Processes controlling porosity and permeability in volcanic reservoirs from the Austral and Neuquén basins, Argentina. Am. Assoc. Pet. Geol. Bull. 2007, 91, 115–129. [Google Scholar] [CrossRef]
  8. Lenhardt, N.; Götz, A.E. Volcanic settings and their reservoir potential: An outcrop analog study on the Miocene Tepoztlán Formation, Central Mexico. J. Volcanol. Geoth. Res. 2011, 204, 66–75. [Google Scholar] [CrossRef] [Green Version]
  9. Wang, P.; Chen, S. Cretaceous volcanic reservoirs and their exploration in the Songliao Basin, northeast China. Am. Assoc. Pet. Geol. Bull. 2015, 99, 499–523. [Google Scholar] [CrossRef]
  10. Zheng, H.; Sun, X.; Zhu, D.; Tian, J.; Wang, P.; Zhang, X. Characteristics and factors controlling reservoir space in the Cretaceous volcanic rocks of the Hailar Basin, NE China. Mar. Pet. Geol. 2018, 91, 749–763. [Google Scholar] [CrossRef]
  11. Zheng, H.; Sun, X.; Wang, J.; Zhu, D.; Zhang, X. Devitrification pores and their contribution to volcanic reservoirs: A case study in the Hailar Basin, NE China. Mar. Pet. Geol. 2018, 98, 718–732. [Google Scholar] [CrossRef]
  12. Saubin, E.; Kennedy, B.; Tuffen, H.; Villeneuve, M.; Davidson, J.; Burchardt, S. Comparative field study of shallow rhyolite intrusions in Iceland: Emplacement mechanisms and impact on country rocks. J. Volcanol. Geotherm. Res. 2001, 388, 106691. [Google Scholar] [CrossRef] [Green Version]
  13. Zou, C.N. Volcanic Reservoirs in Petroleum Exploration; Petroleum Industry Press: Beijing, China, 2013. [Google Scholar]
  14. Heap, M.J.; Tuffen, H.; Wadsworth, F.B.; Reuschlé, T.; Castro, J.M.; Schipper, C.I. The permeability evolution of tuffisites and implications for outgassing through dense rhyolitic magma. J. Geophy. Res. Solid Earth. 2019, 124, 8281–8299. [Google Scholar] [CrossRef] [Green Version]
  15. Zhao, X.; Blunt, M.J.; Yao, J. Pore-scale modelling: Effects wettability on waterflood oil recovery. J. Pet. Sci. Eng. 2010, 71, 169–178. [Google Scholar] [CrossRef]
  16. Suicmez, V.S.; Piri, M.; Blunt, M.J. Effects of wettability and pore-level displacement on hydrocarbon trapping. Adv. Water Res. 2008, 31, 503–512. [Google Scholar] [CrossRef]
  17. Eggertsson, G.H.; Lavallée, Y.; Kendrick, J.E.; Markússon, S.H. Improving fluid flow in geothermal reservoirs by thermal and mechanical stimulation: The case of Krafla volcano, Iceland. J. Volcanol. Geotherm. Res. 2020, 391, 106351. [Google Scholar] [CrossRef]
  18. Curtis, M.E.; Sondergeld, C.H.; Ambrose, R.J.; Rai, C.S. Microstructural investigation of gas shales in two and three dimensions using nanometer-scale resolution imaging. Am. Assoc. Pet. Geol. Bull. 2012, 96, 665–677. [Google Scholar] [CrossRef]
  19. Emmanuel, S.; Eliyahu, M.; Day-Stirrat, R.J.; Hofmann, R.; Macaulay, C.I. Impact of thermal maturation on nano-scale elastic properties of organic matter in shales. Mar. Pet. Geol. 2016, 70, 175–184. [Google Scholar] [CrossRef]
  20. Wang, W.X.; Li, J.; Fan, M.; Abedi, S. Characterization of electrical properties of organic-rich shales at nano/micro scales. Mar. Pet. Geol. 2016, 86, 563–572. [Google Scholar] [CrossRef]
  21. Clarkson, C.R.; Solano, N.; Bustin, R.M.; Bustin, A.M.M.; Chalmers, G.R.L.; He, L.; Melnichenko, Y.B.; Radlinki, A.P.; Blach, T.P. Pore structure characterization of North American shale gas reservoirs using USANS/SANS, gas adsorption, and mercury intrusion. Fuel 2013, 103, 606–616. [Google Scholar] [CrossRef]
  22. Kuila, U.; Prasad, M. Specific surface area and pore-size distribution in clays and shales. Geophys. Prospect. 2013, 61, 341–362. [Google Scholar] [CrossRef]
  23. Xi, Z.; Tang, S.; Wang, J.; Yi, J.; Guo, Y.; Wang, K. Pore Structure and Fractal Characteristics of Niutitang Shale from China. Minerals 2018, 8, 163. [Google Scholar] [CrossRef] [Green Version]
  24. Gao, Z.; Fan, Y.; Hu, Q.; Jiang, Z.; Cheng, Y. The effects of pore structure on wettability and methane adsorption capability of Longmaxi Formation shale from the southern Sichuan Basin in China. Am. Assoc. Pet. Geol. Bull. 2020, 104, 1375–1399. [Google Scholar] [CrossRef]
  25. Zhang, J.; Scherer, G.W. Permeability of shale by the beam-bending method. Int. J. Rock Mech. Min. Sci. 2012, 53, 179–191. [Google Scholar]
  26. Ma, L.; Taylor, K.G.; Lee, P.D.; Dobson, K.J.; Dowey, P.J.; Courtois, L. Novel 3D centimetre-to nano-scale quantification of an organic-rich mudstone: The Carboniferous Bowland Shale, Northern England. Mar. Pet. Geol. 2016, 72, 193–205. [Google Scholar] [CrossRef]
  27. Loucks, R.G.; Reed, R.M.; Ruppel, S.C.; Jarvie, D.M. Morphology, genesis, and distribution of nanometer-scale pores in siliceous mudstones of the Mississippian Barnett Shale. J. Sediment. Res. 2009, 79, 848–861. [Google Scholar] [CrossRef] [Green Version]
  28. Chalmers, G.R.; Bustin, R.M.; Power, I.M. Characterization of gas shale pore systems by porosimetry, pycnometry, surface area, and field emission scanning electron microscopy/transmission electron microscopy image analyses: Examples from the Barnett, Woodford, Haynesville, Marcellus, and Doig units. Am. Assoc. Pet. Geol. Bull. 2012, 96, 1099–1119. [Google Scholar]
  29. Keller, L.M.; Schuetz, P.; Erni, R.; Rossell, M.D.; Lucas, F.; Gasser, P.; Holzer, L. Characterization of multi-scale microstructural features in Opalinus Clay. Micropor. Mesopor. Mat. 2013, 170, 83–94. [Google Scholar] [CrossRef]
  30. Poonoosamy, J.; Haber-Pohlmeier, S.; Deng, H.; Deissmann, G.; Klinkenberg, M.; Gizatullin, B.; Stapf, S.; Brandt, F.; Bosbach, D.; Pohlmeier, A. Combination of MRI and SEM to Assess Changes in the Chemical Properties and Permeability of Porous Media due to Barite Precipitation. Minerals 2020, 10, 226. [Google Scholar] [CrossRef] [Green Version]
  31. Sun, X.M.; Lu, B.L.; Zhang, M.S.; Du, J.Y.; Xu, W.Q. Typical structural styles and deformation sequence in outcrop area of Hailaer basin and its margin. J. Jilin Univ. 2011, 41, 18–23, (In Chinese with English abstract). [Google Scholar]
  32. Minna, A.; Zhang, F.Q.; Yang, S.F.; Chen, H.L.; Batt, G.E.; Sun, M.D.; Meng, Q.A.; Zhu, D.F.; Cao, R.C.; Li, J.S. Early Cretaceous provenance change in the southern Hailar Basin, northeastern China and its implication for basin evolution. Cretac. Res. 2013, 40, 21–42. [Google Scholar] [CrossRef]
  33. Feng, Z.Q.; Zhang, X.D.; Ren, T.G.; Wu, H.Y.; Li, C.B.; Dong, W.B. Hydrocarbon reservoir forming characteristics and distribution rule of Hailar Basin. Petrol. Geol. Oilfield Dev. Daqing 2004, 23, 16–19, (In Chinese with English abstract). [Google Scholar]
  34. Song, J.; Liu, Z.; Wang, C.; Gao, X.; Liu, X. Multistage structural deformations of a superimposed basin system and its tectonic response to regional geological evolution: A case study from the Late Jurassic-Early Cretaceous Tanan depression, Hailar-Tamtsag basin. Mar. Pet. Geol. 2019, 110, 1–20. [Google Scholar] [CrossRef]
  35. Tian, J.X.; Sun, X.M.; Zhang, X.Q.; Shou, Y.C. Reservoir space types and the factors influencing the characteristics of spherulite in rhyolite. Sci. China Earth Sci. 2013, 56, 748–755. [Google Scholar] [CrossRef]
  36. Li, S.Q.; Hegner, E.; Yang, Y.Z.; Wu, J.D.; Chen, F.K. Age constraints on late Mesozoic lithospheric extension and origin of bimodal volcanic rocks from the Hailar Basin, NE China. Lithos 2014, 190–191, 204–219. [Google Scholar] [CrossRef]
  37. Chen, J.L.; Wu, H.Y.; Zhu, D.F.; Lin, C.H.; Yu, D.S. Tectonic evolution of the Hailar Basin and its potentials of oil-gas exploration. Chinese J. Geol. 2007, 42, 147–159, (In Chinese with English abstract). [Google Scholar]
  38. McPhie, J.; Doyle, M.; Allen, R. Volcanic Textures: A Guide to the Interpretation of Textures in Volcanic Rocks; University of Tasmania: Tasmania, Australia, 1993. [Google Scholar]
  39. Anthony, J.W.; Bideaux, R.A.; Bladh, K.W.; Nichols, M.C. Handbook of Mineralogy; Mineralogical Society of America: Chantilly, VA, USA, 2015. [Google Scholar]
  40. Smith, J.V.; Miyake, Y.; Oikawa, T. Interpretation of porosity in dacite lava domes as ductile-brittle failure textures. J. Volcanol. Geotherm. Res. 2001, 112, 25–35. [Google Scholar] [CrossRef]
  41. Smith, J.V. Structural analysis of flow-related textures in lavas. Earth-Sci. Rev. 2002, 57, 279–297. [Google Scholar] [CrossRef]
  42. Magnall, N.; James, M.R.; Tuffen, H.; Vye-Brown, C.; Ian Schipper, C.; Castro, J.M.; Davies, A.G. The origin and evolution of breakouts in a cooling-limited rhyolite lava flow. Bull. Geol. Soc. Am. 2019, 131, 137–154. [Google Scholar] [CrossRef] [Green Version]
  43. Wallace, P.A.; Kendrick, J.E.; Miwa, T.; Ashworth, J.D.; Coats, R.; Utley, J.E.P.; De Angelis, S.H.; Mariani, E.; Biggin, A.; Kendrick, R.; et al. Petrological architecture of a magmatic shear zone: A multidisciplinary investigation of strain localisation during magma ascent at Unzen volcano, Japan. J. Petrol. 2019, 60, 791–826. [Google Scholar] [CrossRef] [Green Version]
  44. Fink, J.H. Structure and emplacement of a rhyolitic obsidian flow: Little Glass Mountain, Medicine Lake Highland, northern California. GSA Bull. 1983, 94, 362–380. [Google Scholar] [CrossRef]
  45. von Aulock, F.W.; Nichols, A.R.L.; Kennedy, B.M.; Oze, C. Timescales of texture development in a cooling lava dome. Geochim. Cosmochim. Acta 2013, 114, 72–80. [Google Scholar] [CrossRef]
  46. Rowe, M.C.; Ellis, B.S.; Lindeberg, A. Quantifying crystallization and devitrification of rhyolites by means of X-ray diffraction and electron microprobe analysis. Am. Mineral. 2012, 97, 1685–1699. [Google Scholar] [CrossRef]
  47. Castro, J.M.; Beck, P.; Tuffen, H.; Nichols, A.R.L.; Dingwell, D.B.; Martin, M.C. Timescales of spherulite crystallization in obsidian inferred from water concentration profiles. Am. Mineral. 2008, 93, 1816–1822. [Google Scholar] [CrossRef]
  48. Manga, M.; Voltolini, M.; Wenk, H.R. Microlite orientation in obsidian flow measured by synchrotron X-ray diffraction. Contrib. Mineral. Petrol. 2018, 173, 58. [Google Scholar] [CrossRef] [Green Version]
  49. Denton, J.S.; Tuffen, H.; Gilbert, J.S. Variations in hydration within perlitised rhyolitic lavas—evidence from Torfajökull, Iceland. J. Volcanol. Geotherm. Res. 2012, 223–224, 64–73. [Google Scholar] [CrossRef]
  50. Denton, J.S.; Tuffen, H.; Gilbert, J.S.; Odling, N. The hydration and alteration of perlite and rhyolite. J. Geol. Soc. 2009, 166, 895–904. [Google Scholar] [CrossRef] [Green Version]
  51. Friedman, I.; Smith, R.G.; Long, W.D. Hydration of natural glass and formation of perlite. Geol. Soc. Am. Bull. 1966, 77, 323–328. [Google Scholar] [CrossRef]
  52. Gránásy, L.; Pusztai, T.; Tegze, G.; Warren, J.A.; Douglas, J.F. Growth and form of spherulites. Phys. Rev. E—Stat. Nonlinear Soft Matter Phys. 2005, 72, 1–15. [Google Scholar] [CrossRef] [Green Version]
  53. Watkins, J.; Manga, M.; Huber, C.; Martin, M. Diffusion-controlled spherulite growth in obsidian inferred from H2O concentration profiles. Contrib. Mineral. Petrol. 2009, 157, 163–172. [Google Scholar] [CrossRef] [Green Version]
  54. Lofgren, G. An experimental study of plagioclase crystal morphology: Isothermal crystallization. Am. J. Sci. 1974, 274, 243–273. [Google Scholar] [CrossRef]
  55. Breitkreuz, C. Spherulites and lithophysae—200 years of investigation on high-temperature crystallization domains in silica-rich volcanic rocks. Bull. Volcanol. 2013, 75, 705. [Google Scholar] [CrossRef]
  56. Bullock, L.A.; Gertisser, R.; O’Driscoll, B. Spherulite formation in obsidian lavas in the Aeolian Islands, Italy. Period. Mineral. 2017, 86, 37–54. [Google Scholar]
  57. Tuffen, H.; Dingwell, D.B.; Pinkerton, H. Repeated fracture and healing of silicic magma generate flow banding and earthquakes? Geology 2003, 31, 1089–1092. [Google Scholar] [CrossRef] [Green Version]
  58. Dobson, P.F.; Kneafsey, T.J.; Hulen, J.; Simmons, A. Porosity, permeability, and fluid flow in the Yellowstone geothermal system, Wyoming. J. Volcanol. Geotherm. Res. 2003, 123, 313–324. [Google Scholar] [CrossRef]
  59. Stemprok, M.; Dolejš, D.; Müller, A.; Seltmann, R. Textural evidence of magma decompression, devolatilization and disequilibrium quenching: An example from the Western Krušnéhory/Erzgebirge granite pluton. Contrib. Mineral. Petrol. 2008, 155, 93–109. [Google Scholar] [CrossRef]
  60. Fossen, H. Structural Geology; Cambridge University Press: New York, NY, USA, 2010. [Google Scholar]
  61. Hodge, K.F.; Carazzo, G.; Jellinek, A.M. Experimental constraints on the deformation and breakup of injected magma. Earth Planet. Sci. Lett. 2012, 325–326, 52–62. [Google Scholar] [CrossRef]
  62. Payacán, I.; Gutiérrez, F.; Gelman, S.E.; Bachmann, O.; Parada, M.Á. Comparing magnetic and magmatic fabrics to constrain the magma flow record in La Gloria pluton, central Chile. J. Struct. Geol. 2014, 69, 32–46. [Google Scholar] [CrossRef]
  63. Zhao, S.R.; Bian, Q.J.; Wang, Q.Y. Crystallography and Mineralogy, 2nd ed.; Higher Education Press: Beijing, China, 2010. (In Chinese) [Google Scholar]
  64. Rafferty, P.J. Rocks (Geology: Landforms, Minerals, and Rocks); Rosen Educational Services: New York, NY, USA, 2012. [Google Scholar]
  65. Davis, B.K.; McPhie, J. Spherulites, quench fractures and relict perlite in a Late Devonian rhyolite dyke, Queensland, Australia. J. Volcanol. Geoth. Res. 1996, 71, 1–11. [Google Scholar] [CrossRef]
Figure 2. (a) The studied rhyolitic lava dome located in the west margin of the Hailar Basin; (b) A phenocryst-rich flow-banded rhyolitic lava that is also glass-rich (yellow arrow) and has microlites in its groundmass matrix (white arrow); (c) A spherulitic rhyolite that consists of isolated spherulites (yellow arrow) and glass matrix (white arrow); (d) A spherulitic rhyolite that consists of clustered spherulites and minor glass matrix, the dark areas are solidified crude oil; (e) A vesicular-rich rhyolitic lava, the yellow and white arrows indicate vesicles and flow foliations, respectively.
Minerals 10 00699 g002
Figure 3. Photomicrograph, fluorescence, and second electron images of a cross-sectioned rhyolitic lava sample (sampled from the outcrop shown in Figure 2b) showing the microstructures of porphyritic texture and related porosity. The cartoon diagram illustrates the porous architecture. (a) A K-feldspar phenocryst and flow-banded groundmass. Symbols “−” and “+” represent plane- and cross-polarized light, respectively. (b) The distribution of crude oil in a phenocryst and groundmass. The red arrow indicates embayment pores filled with asphaltenes (dark-brown fluorescence); the white arrow indicates intracrystalline pores filled with aromatics (blue fluorescence); the yellow arrow indicates the fold hinge of a flow fold, the flow-parallel laminar pores contain asphaltenes (dark-brown fluorescence). (c) Flow-parallel micropores develop between parallel crystal fibers. The red and yellow arrows indicate crystal fibers and organic matter, respectively. (d) Intracrystalline porosity. The red arrow indicates {010} cleavages; the yellow arrow indicates a cavitational fracture; the white arrow indicates intracrystalline sieve pores.
Minerals 10 00699 g003
Figure 4. Photomicrograph, fluorescence, and second electron images of a cross-sectioned rhyolitic lava sample (sampled from the outcrop shown in Figure 2d) showing the microstructures of spherulitic and perlitic textures and related porosity. The cartoon diagram illustrates the porous architecture. (a) Clustered spherulites (yellow arrow) and glassy groundmass with perlitic fractures (red arrow). Symbols “−” and “+” represent plane- and cross-polarized light, respectively. (b) The distribution of crude oil in clustered-spherulite-related pores and perlitic fractures. The yellow arrow indicates interspherulite pores; the white arrow indicates water expulsion pores; the red arrow indicates perlitic fractures. All pores are filled with asphaltenes (dark-brown fluorescence). (c) Clustered spherulites and interspherulite pores. The white arrow indicates interspherulite pores filled with asphaltenes (brown fluorescence); the yellow arrow indicates the imporous microstructure of an individual spherulite. (d) The interior of a spherulite. The yellow arrow indicates the imporous microstructure; the white arrow indicates tiny radial fractures; the red arrow indicates cavitational fractures; the green arrow indicates interspherulite pores filled with organic matters.
Minerals 10 00699 g004
Figure 5. Photomicrograph, fluorescence, and second electron images of a cross-sectioned isolated spherulite (across the center of sphere; sampled from the outcrop shown in Figure 2c) showing the microstructures and related porosity. The cartoon diagram illustrates the section position. (a) An isolated spherulite. The red arrow indicates radiating arrays of crystal fibers. Symbols “−” and “+” represent plane- and cross-polarized light, respectively. (b) The distribution of crude oil in an isolated spherulite. Zone 1 is an imporous spherulite center; zone 2 is porous middle layers, abundant aromatics (blue fluorescence) and some asphaltenes (brown fluorescence) are stored in intraspherulite micropores; and zone 3 is a porous glassy shell. The red arrow indicates water expulsion pores filled with asphaltenes (dark-brown fluorescence). (c) bundle-shaped radiating crystal fibers (yellow arrow), mosaic crystal masses (red arrow), and radiating micropores. (d) radiating crystal fibers (yellow arrow) and micropores (red arrow).
Minerals 10 00699 g005
Figure 6. Photomicrograph, fluorescence, and second electron images of a cross-sectioned isolated spherulite (not across the center of sphere; sampled from the outcrop shown in Figure 2c) showing the microstructures and related porosity. The cartoon diagram illustrates the section position. (a) An isolated spherulite. Symbols “−” and “+” represent plane- and cross-polarized light, respectively. (b) The distribution of crude oil in an isolated spherulite. Intraspherulite micropores in zone 2 contain abundant aromatics (blue–green fluorescence) and resins (yellow fluorescence). The red arrow indicates a concentric ring cavity occurs along the inner surface of the glassy shell. (c) mosaic crystal masses (red arrow) and intraspherulite micropores (yellow arrow) filled with aromatics (blue–green fluorescence) and resins (yellow fluorescence). (d) mosaic crystal masses (red arrow) and radiating crystal fibers and micropores (yellow arrow).
Minerals 10 00699 g006
Figure 7. (a,c,e,g,i) Pore-size distribution estimated from the rhyolitic lava samples. The blue vertical bars indicate the number of pores at a given bin size, and the gray squares indicate the cumulative percentage of the distribution. (b,d,f,h,j) Volumetric contribution of the same pores. The data were measured from fluorescence images (n = 204) collected from the samples listed in Table 2 by the CIAS-2004 color image analysis system.
Minerals 10 00699 g007
Table 1. Classification and characteristics of different pore types found in rhyolites.
Texture/MicrostructurePore TypeConnectivityOriginTime of FormationReference
Porphyritic texturePhenocrystEmbayment poreCatenary–closedDeuteric crystal dissolutionSyn-volcanic[7,10,38]
CleavageCatenary–cul-de-sacCrystallizationPre-volcanic[39]
Cavitational fractureCatenaryCavitationSyn-volcanic[40,41]
Shear fractureCatenaryShear failureSyn-volcanic[41,42,43]
Intracrystalline sieve poreCatenary–closedDeuteric crystal dissolutionSyn-volcanic[7,10,38]
GroundmassFlow-parallel laminar poreCatenaryDuctile–brittle failureSyn-volcanic[7,41,44]
Flow-parallel microporeCatenaryLow-T devitrificationPost-volcanic[11,45,46,47,48]
Perlitic texturePerlitic fractureCatenaryHydrationPost-volcanic[45,49,50,51]
Spherulitic textureClustered spheruliteInterspherulite poreCatenaryHigh-T devitrificationSyn-volcanic[47,52,53,54,55,56]
SpheruliteWater expulsion poreCatenaryExpulsion of magmatic waterSyn-volcanic[47,52,53,55]
Isolated spheruliteRadiating microporeCatenaryHigh-T devitrificationSyn-volcanic[47,52,53,54,55,56]
Table 2. Estimates of effective porosity and connectivity of rhyolites in the Hailar Basin.
LithologySample NumberEffective Porosity, FIA (%)Connectivity, FIATexture
MinMedianMaxMean
Phenocryst-rich lava84.711.729.814.3Fairly goodPorphyritic
Perlitic lava62.99.331.910.9ModeratePerlitic
Spherulitic rhyolite I104.611.019.711.2Fairly goodSpherulitic and perlitic
Spherulitic rhyolite II104.815.728.516.8GoodSpherulitic and perlitic
Note: the effective porosity for individual samples was calculated as the arithmetic average of effective porosities measured from six fluorescence images by the CIAS-2004 color image analysis system. The connectivity levels were visually estimated by the distribution of various crude oil components in fluorescence images based on their corresponding fluorescent colors.

