Abstract
As the dominant manganese oxide mineral phase in terrestrial and aquatic environments, birnessite plays an important role in many biogeochemical processes. The coexistence of birnessite with aqueous Mn2+ is commonly found in the subsurface environments undergoing Mn redox cycling. This study investigates the change in Mn average oxidation state (AOS) of birnessite after reaction with 0.1–0.4 mM Mn2+ at pH 4.5–6.5, under conditions in which phase transformation of birnessite by Mn2+ was not detectable. The amount of Mn2+ uptake by birnessite and the equilibrium concentration of Mn(III) proportionally increased with the initial concentration of Mn2+. The Mn AOS of birnessite particles became 3.87, 3.75, 3.64, and 3.53, respectively, after reaction with 0.1, 0.2, 0.3, and 0.4 mM Mn2+ at pH 5.5. Oxidation potentials (Eh) of birnessite with different AOS values were estimated using the equilibrium concentrations of hydroquinone oxidized by the birnessite samples, indicating that Eh was linearly proportional to AOS. The oxidation kinetics of bisphenol A (BPA), a model organic pollutant, by birnessite suggest that the logarithms of surface area-normalized pseudo-first-order initial rate constants (log kSA) for BPA degradation by birnessite were linearly correlated with the Eh or AOS values of birnessite with AOS greater than 3.64.
1. Introduction
Birnessite (δ-MnO2) is a dominant Mn(III,IV)-oxide mineral, widely found in a variety of environmental settings, such as soils, sediments, marine Mn nodules, and desert varnishes [1]. The birnessite structure consists of stacked sheets of edge-sharing MnO6 octahedra with water molecules or cations in the interlayer regions. The layers of naturally occurring birnessite commonly contain varying contents of Mn(IV) vacancies and/or Mn(III) substitutions, due to abiotic/biotic Mn(IV) reduction or Mn(II) oxidation [2,3,4]. Many studies have shown that Mn(III) on birnessite surface can be the active sites for metal sorption, contaminant oxidation, and topotactic structure transformation [2,5,6,7]. Average oxidation states (AOS) of Mn are extensively used to indicate the content of Mn(III) or vacancies in the birnessite structure. AOS of birnessite-group minerals is typically in the range of 3.0–4.0 [8,9], and can be affected by many factors, including growth conditions, solution pH, light, and redox reactions [10,11,12,13,14,15]. Moreover, naturally occurring birnessite is mainly formed via biotic oxidation of Mn(II) or from subsequent transformation of biogenic minerals, which is much faster than abiotic Mn(II) oxidation at circumneutral pH [3,16,17]. As a result, natural birnessite particles typically have poor crystallinity, large specific surface area, and varying AOS values. These unique structural and physiochemical properties endow birnessite with excellent performance and high reactivity in metal sequestration, degradation of organic pollutants, and microbial respiration in anaerobic environments.
Birnessite commonly coexists with aqueous Mn(II) as a result of various biogeochemical redox processes, such as biotic/abiotic reduction of birnessite or the biologically catalyzed oxidation of aqueous Mn(II)(Mn2+) [4,17,18]. Previous studies of interaction between birnessite and Mn2+ mainly focused on the effects of Mn2+ on the sorption capability of birnessite for heavy metals or on Mn(II)-induced phase transformation of birnessite under anoxic conditions [4,15,19,20]. However, the transformation studies of birnessite in the presence of Mn2+ were mostly conducted at pH ≥ 7, because no detectable secondary phases have been observed at lower pH values [15,20] or within a couple of days [21]. Nevertheless, it is likely that electron transfer between birnessite and sorbed Mn2+ impacts Mn AOS and oxidative reactivity of birnessite under mildly acidic conditions. Our recent studies showed that electron injection from sorbed Fe(II) to magnetite (Fe3O4) can change the structural Fe(II)/Fe(III) ratio and the reduction potential of magnetite without the formation of secondary mineral phases, the extent of which depends on solution pH, magnetite loading, and initial concentrations of aqueous Fe(II) and redox-active organic molecules [22,23]. Similarly, the interfacial electron transfer between birnessite and Mn2+ may induce electron injection and delocalization in Mn octahedral layers of birnessite, even though no detectable secondary phases are formed. However, how the Mn(II)-birnessite interaction impacts the AOS and redox potential of birnessite, without mineral phase transformation, under mildly acidic conditions remains unclear.
Although oxidative reactivity of birnessite-group minerals has been extensively studied using many model organic compounds or contaminants, such as phenols, anilines, and low molecular weight organic acids, most of these studies focused on how the chemical properties of the organic compounds or products, as well as solution conditions, affect the oxidation rates [8,24,25]. Relatively few studies have investigated the relationship between mineralogical properties of birnessite minerals and the oxidation rates of organic compounds. Several attempts have been made to study the effect of Mn AOS or the redox potential of manganese oxides on their oxidative reactivities with model organic compounds, such as phenolic compounds and sulfadiazine, but different manganese oxide phases (including birnessite, buserite, manganite, feitnkechtite, and cryptomelane) with different AOS values were used [7,26,27,28]. Although increasing oxidation rates of organic compounds with the increase in Mn AOS and redox potential were observed in some of these studies, the different mineral phases or synthesis methods may also affect many other properties of the manganese oxides, such as crystallinity and specific surface area, resulting in different oxidative reactivities for organic compounds. Moreover, Mn(III) center availability has been considered as an important factor controlling the oxidation rates of many organic compounds by birnessite, so birnessite with a lower Mn AOS may have more surface Mn(III) sites and correspondingly present the higher oxidative reactivities [2,7,28]. Mn AOS values of birnessite minerals can dynamically change in response to redox potential fluctuations in surrounding environments or induced by redox biogeochemical processes. It is important to study how Mn2+-birnessite interaction affects Mn AOS and oxidative reactivity for understanding the role of birnessite in a variety of biogeochemical processes and for developing the applications of birnessite in environmental remediation.
Here, the quantitative relationship among Mn AOS, redox potential, and oxidative reactivity of birnessite after reaction with Mn2+ at different concentrations under mildly acidic conditions were investigated. Under the experimental conditions of this study, the interaction of Mn2+ with birnessite only changed Mn AOS, without inducing phase transformation of birnessite. Hydroquinone (HQ) has been used as a chemical redox probe (CRP) to estimate the oxidation potential (Eh) of birnessite minerals after reaction with Mn2+ of different concentrations. The results reveal a linear relationship between AOS values of birnessite and the logarithms of the surface-area-normalized rate constants and extents of HQ oxidation. The enhanced Eh or oxidation reactivity of birnessite with the increase in AOS was tested using the oxidation experiments with a model organic pollutant, bisphenol A (BPA). The findings of this study show the tunable AOS and redox potential of birnessite by reaction with Mn2+ at different concentrations, as well as the quantitative correlation between oxidation rates and extents of organic compounds and AOS/Eh of birnessite.
2. Materials and Methods
2.1. Synthesis and Characterization of Birnessite
Hexagonal birnessite, i.e., c-disordered H+-birnessite, was synthesized according to the method previously reported by Mckenzie [29]. In brief, 32.7 mL of concentrated HCl was added dropwise to 500 mL 0.4 M boiling KMnO4 solution using a peristaltic pump at a flow rate of 0.7 mL/min, while the suspension was vigorously stirred and heated at ~100 ℃. After the HCl solution was completely added, the suspension was heated at ~100 ℃ for 30 more minutes and then cooled to room temperature. The solid products in the suspension were collected by centrifugation and then washed with Milli-Q water three times. The resulting suspension was stored at 4 °C in the dark.
The crystal phase of the synthesized particles was identified by a PANalytical X-ray powder diffractometer (XRD, PANalytical, Almelo, The Netherlands) equipped a Cu Kα radiation (λ = 0.15406 nm). Particles after freeze-drying of the stock suspension were amounted on zero-background quartz sample holders. Diffraction patterns were scanned in the 2θ range of 5°–75° at a step rate of 0.02° 2θ·s−1. The morphology and particle size of the synthesized particles were observed using a JSM-IT300 scanning electron microscope (SEM, JEOL, Tokyo, Japan) operated at an accelerating voltage of 5 kV in secondary electron mode. Specific surface area (SSA) of the synthetic particles was determined via the Brunauer-Emmett-Teller (BET) method. Measurements were carried out on an ASAP 2020 Surface Area and Porosity Analyzer (Micromeritics, Norcross, GA, USA) from Micrometer by determining the nitrogen adsorption-desorption isotherms at 77 K. X-ray photoelectron spectroscopy (XPS) measurements were carried out with the AXIS Supra X-ray photoelectron spectrometer (Kratos Analytical Ltd., Manchester, UK) to determine the Mn oxidation states in the synthesized birnessite before and after reaction with Mn2+ by fitting the Mn3s lines, according to the previously reported method [11,30]. All XPS spectra were analyzed using CasaXPS (Casa Software Ltd., Teignmouth, UK).
2.2. Mn(II)-Birnessite Interaction Experiments
Batch experiments were conducted to measure the time-dependent concentrations of aqueous Mn(II) and Mn(III) produced during the reactions between 200 mg/L birnessite, i.e., 1.86 mM according to the formula of Na0.5Mn2O4·1.5H2O reported in previous studies [31,32], and 0.1–0.4 mM Mn2+ at pH 4.5, 5.5, and 6.5, respectively. The buffer solution at pH 4.5 or 5.5 was 200 mM acetate buffer solution (NaAc-HAc) with 10 mM NaCl, and that at pH 6.5 was 20 mM MES (2-(N-morpholino) ethanesulfonic acid) buffer solution with 10 mM NaCl. All experiments were conducted in sealed containers with continuous shaking on a rotating mixer. To measure the uptake of Mn2+ by birnessite, a certain volume of 10 mM MnCl2·4H2O stock solution into 1.86 mM birnessite suspension (50 mL), resulting in the initial Mn2+ concentration at 0.1, 0.2, 0.3, and 0.4 mM, respectively Two-milliliter aliquots were taken out at designated time intervals using 5 mL syringes and immediately filtered through 0.22 μm syringe filters. After acidification with 2% HNO3 (high purity-grade), the concentrations of Mn2+ in the filtrates were determined using inductively coupled plasma optical emission spectrometer (ICP-OES, Prodigy 7, Teledyne Leeman Labs, Mason, OH, USA). The time-dependent concentration of produced Mn(III) from the Mn(II)-birnessite interaction was measured under similar conditions, except that 50 mM sodium pyrophosphate (PP) was initially added together with MnCl2·4H2O to trap Mn(III). After sample aliquots (2 mL each) were taken and filtered through the 0.22 μm syringe filters, the concentration of PP-complexed Mn(III) (Mn(III)-PP) in the filtrate was calculated from the absorbance at λ = 254 nm (ε = 6562 L·mol−1·cm−1) [13] that was measured using a UV-vis spectrophotometer (UV-1800, Shimadzu, Kyoto, Japan). At the end of 24 h reactions, particles in the suspensions were collected by centrifugation and washed with Milli-Q water three times. After freeze-drying, the resulting particles were analyzed by XPS to determine Mn AOS.
2.3. Redox Potential Determination of Birnessite with Different AOS Values
To study the relationship between Mn AOS of birnessite and oxidation rates/extents of the chemical redox probe, hydroquinone (HQ), batch experiments were performed in 100 mL closed serum bottles with 1.82 mM HQ and 1.86 mM birnessite particles after reaction with Mn2+ at different concentrations under the conditions described above. In this process, 200 mM NaAc-HAc buffer solution with 10 mM NaCl was used to maintain the pH at 5.5. After the birnessite suspension was sonicated for 5 min, 5 mL of 9.08 mM HQ stock solution was spiked into the suspension to initiate the oxidation experiment. Sample aliquots (3 mL) were taken and filtered through 0.22 μm syringe filters. In the experimental suspensions, HQ was oxidized to benzoquinone (BQ) by birnessite according to the following Equations [24]:
The concentrations of HQ and BQ in the filtrates were determined using the UV-vis spectrophotometer according to the previously reported method [33]. Redox potential of the suspension at equilibrium (Eh) was estimated from the extent of HQ oxidation according to the following equation [34]:
where is the standard redox potential of HQ (−0.699 V) [34]; R is the gas constant; T is the temperature; F is the Faraday constant; [BQ], [HQ], and [H+] are the concentrations of benzoquinone, hydroquinone and H+, respectively. All experiments were performed at least in triplicate.
2.4. Oxidation of Model Organic Molecules by Birnessite with Different AOS Values
To further study the oxidation activity of birnessite particles with different AOS values for the degradation of organic pollutants, oxidation experiments of 131.4 μM BPA by 2.80 mM birnessite at pH 5.5 were conducted under the similar conditions of HQ oxidation. BPA concentrations were measured over the course of the reaction by sampling an aliquot (3 mL) of the suspension and filtering it through a 0.22 μm syringe filter. The absorbance at λ = 276 nm was measured using the UV-vis spectrophotometer [35,36].
3. Results
3.1. Characteristics of Synthetic Birnessite
The XRD pattern (Figure 1a) of the synthetic sample shows that only birnessite phase is present. The four diffraction peaks at 2θ = 12.4°, 24.9°, 37°, and 65.5° confirm the formation of birnessite with hexagonal layer symmetry. The representative SEM image (Figure 1b) shows that the synthetic birnessite particles present platelet morphology with a diameter of ~300–400 nm and assemble to form flower-like aggregates. The BET specific surface area of the synthetic birnessite is 45.5 m2/g, which is consistent with the small thickness of birnessite platelets. These characteristics agree well with the previously reported properties of birnessite synthesized via reductive precipitation of KMnO4 by HCl [37].
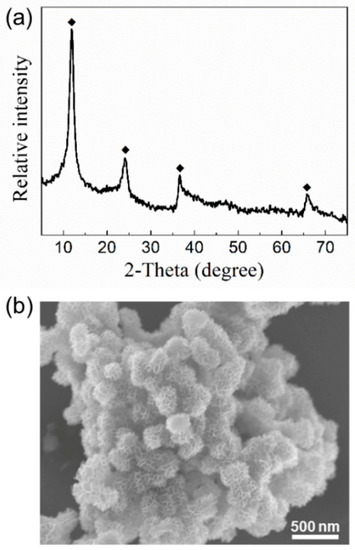
Figure 1.
(a) The XRD pattern of synthetic particles show the characteristic peaks of hexagonal birnessite (JCPDS No.43-1456); (b) representative SEM image of the synthetic birnessite.
3.2. Effect of Mn2+–Birnessite Interaction on AOS of Birnessite
3.2.1. Mn2+ Uptake and Mn(III) Formation
Figure 2a shows the uptake profiles of 0–0.4 mM aqueous Mn2+ on 1.86 mM birnessite at pH 5.5. Similar trends were observed in the profiles with different concentrations of added Mn2+, which contain spontaneous adsorption at the initial stage, followed by gradual decrease in adsorption rates, until a plateau is reached. As shown in Figure S1, the uptake profiles of 0–0.4 mM Mn2+ on 1.86 mM birnessite at pH 4.5 and pH 6.5, respectively, present the similar trend in the change in Mn2+ concentration versus time. Nearly complete uptake of 0–0.4 mM Mn2+ by birnessite was observed at pH 4.5–6.5, except that the extent of Mn2+ uptake in the experiments with 0.4 mM Mn2+ was slightly lower at the elevated solution pH (Figure 2c). Because >95% of the added Mn2+ can be rapidly sorbed onto the birnessite surface within ~2 h, it is feasible to adjust the amount of surface-associated Mn2+ and electrons injection from sorbed Mn2+ to structural Mn(IV) in birnessite via changing the initial concentration of Mn2+ in solution.
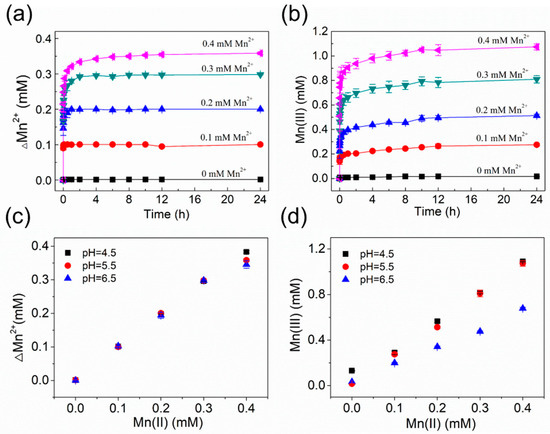
Figure 2.
Concentration changes in Mn2+ (ΔMn2+) (a) and Mn(III) production (b) as a function of time in the uptake experiments of 0–0.4 mM aqueous Mn2+ onto 1.86 mM birnessite at pH 5.5; The extent of Mn2+ uptake (c) and Mn(III) production (d) as a function of initial Mn2+ concentrations at pH 4.5–6.5. Error bars indicate standard deviation from three independent experiments.
The rapid uptake of Mn2+ by birnessite has been attributed to the high adsorption capability of the Mn(IV) vacancies in birnessite structure to divalent metals [38], autocatalytic oxidation of surface-associated Mn(II) by O2 [39], or electron injection from sorbed Mn(II) to structural Mn(IV) [4]. The extent of structural changes in birnessite from the Mn2+–birnessite interaction is highly dependent on experimental conditions, such as solution pH, initial Mn2+ concentration, and reaction time. We measured the time-dependent concentration of Mn(III) throughout the reaction of 1.86 mM birnessite with 0–0.4 mM aqueous Mn2+ at pH 4.5–6.5 using the Mn(III)-pyrophosphate colorimetric method. As shown in Figure 2b and S1, Mn(III) rapidly formed upon spiking the Mn2+ stock solution into the birnessite suspension, and the Mn(III) concentration gradually increased over time until reaching a steady plateau state. The trend in the profiles of Mn(III) production was very similar to that of Mn(II) uptake, indicating that the formation of Mn(III) over time was closely related to Mn(II) uptake by birnessite. Moreover, the equilibrium Mn(III) concentration linearly increased as the initial Mn2+ concentration increased (Figure 2d). Pyrophosphate can complex with both structural Mn(III) in birnessite and Mn(III) released from birnessite or associated with birnessite surface. In order to check whether the increase in measured Mn(III) concentration was due to the increased content of structural Mn(III), Mn AOS values of end-products after 24 h interaction between birnessite and aqueous Mn2+ were measured using the XPS Mn 3s peak separation values. The XPS results will be presented and discussed in detail below.
It is worth mentioning that, although the amounts of Mn2+ uptake by birnessite at pH 4.5–6.5 were similar at a fixed initial Mn2+ concentration, the concentration of Mn(III) produced at pH 6.5 was obviously lower than the corresponding values at pH 4.5 and 5.5. The results suggest that the change in solution pH within the range of this study would not significantly affect Mn2+ uptake by birnessite but probably influence the formation of Mn(III) from electron injection from sorbed Mn2+ to structural Mn(IV) in birnessite. Moreover, when pH (pH = 4.5 or 5.5) and initial Mn2+ concentration were fixed, the concentration of produced Mn(III) was about two times that of Mn2+ uptake by birnessite at steady state. The ratio is consistent with the theoretical expectation of charge balance, i.e., one mole of Mn(II) reacting with one mole of Mn(IV) leads to the production of two moles of Mn(III).
3.2.2. AOS of Birnessite after Reaction with Aqueous Mn(II)
Although Mn AOS of birnessite has been extensively measured using redox titration or X-ray absorption near-edge spectroscopy (XANES) [40], XPS can provide information about AOS changes specifically on the surface or in the near-surface region of birnessite after reaction with aqueous Mn2+ at a lower concentration range. Figure 3a shows the survey scan of the as-synthesized birnessite. In addition to the strong signals of Mn and O, the weak signals of C and K can be assigned to very small amounts of surface contaminants, probably resulting from the exposure to ambient air and residual KMnO4. Compared to the intensities of Mn and O peaks, the signals of C and K are much weaker, so the interference of the surface contaminants on the Mn2+–birnessite interaction is negligible.
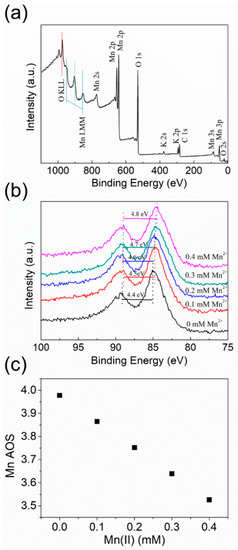
Figure 3.
(a) XPS survey scan for the as-synthesized birnessite particles; (b) Mn 3s spectra of birnessite before (black) and after reaction with 0.1 mM (red), 0.2 mM (blue), 0.3 mM (green), and 0.4 mM (purple) Mn2+, respectively, at pH 5.5; (c) Mn average oxidation state (AOS) of birnessite after reaction with 0–0.4 mM Mn2+ at pH 5.5.
The Mn 3s peaks of birnessite before and after reaction with 0–0.4 mM Mn2+ at pH 5.5 are compared in Figure 3b. This peak consists of two, multiplet split components that are caused by the coupling of non-ionized 3s electron with 3d valence-band electrons. Due to the relatively low proportions of Mn(II) and Mn(III) in birnessite, deconvolution of Mn 3s curve was not employed to determine Mn AOS in this study. According to the previously reported linear correlation between the Mn AOS of birnessite and the multiplet splitting of the Mn 3s line [30,41], the Mn AOS of birnessite can be estimated from the magnitude of the peak splitting according to the following Equation [42,43]:
where ΔEs represents the multiplet spitting of the Mn 3s line, which is the energy difference between the main peak and its satellite.
AOS = 8.95 − 1.13ΔEs(eV)
As shown in Figure 3c, the birnessite particles after reaction with 0.1, 0.2, 0.3, and 0.4 mM Mn2+, respectively, have the corresponding AOS = 3.87, 3.75, 3.64, and 3.53. The more Mn2+ added leads to a lower AOS value in birnessite. The results confirm that Mn2+ sorbed on the birnessite surface injected electrons into structural Mn(IV) and decreased Mn AOS. Moreover, the linear correlation between the concentration of added Mn2+ and AOS value or the concentration of produced Mn(III) suggests that the AOS or Mn(III) content of birnessite can be adjusted via the reaction with aqueous Mn2+ at different concentrations under mildly acidic conditions.
3.3. Eh of Birnessite with Different AOS Values Determined from HQ Oxidation
To explore the quantitative correlation between AOS values and oxidation rates of organic compounds by birnessite, we conducted the oxidation experiments of 1.82 mM HQ with 1.86 mM birnessite with different AOS values at pH 5.5. Figure 4 shows that, in all experiments, the HQ concentration exponentially decreased over time, whereas the corresponding BQ concentration rapidly increased as a function of time. After about 20 h, the concentration of both HQ and BQ reached a plateau. Moreover, the spontaneous formation of BQ was observed along with the rapid decrease in HQ. The nearly synchronous changes in the concentrations of HQ and BQ with time indicate that HQ adsorption on birnessite surface could not significantly contribute to the removal of HQ by birnessite under the conditions of this study. Moreover, the negligible sorption of HQ to birnessite and the rapid redox reaction between them make HQ an appropriate thermodynamic and kinetic chemical reactivity probes (CRPs) for birnessite with different AOS values [44].
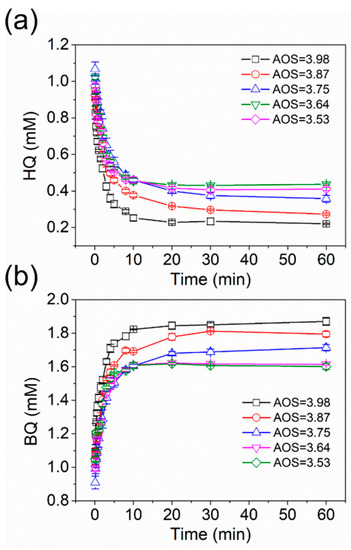
Figure 4.
Time-dependent concentrations of hydroquinone (HQ) (a) and benzoquinone (BQ) (b) in the oxidation experiments of 1.82 mM HQ by 1.86 mM birnessite with AOS = 3.98 (black), 3.87 (red), 3.75 (blue), 3.64 (purple), and 3.53 (green), respectively, at pH 5.5. Error bars indicate standard deviation from three independent experiments.
In order to quantify the correlation between AOS values and redox potentials of birnessite, the oxidation experiments of 2.73 mM HQ by 1.86 mM birnessite with different AOS values were conducted at pH 5.5. As shown in Figure S2, the extent of HQ oxidation highly depends on Mn AOS of birnessite at the same initial HQ concentration and birnessite loading. At pH 5.5, as the Mn AOS of birnessite decreased from 3.98 to 3.53, the concentration of HQ at equilibrium increased from 1.25 ± 0.01 to 1.39 ± 0.03 mM, but that of BQ decreased from 1.88 ± 0.01 to 1.73 ± 0.00 (Figure S2). A similar trend was observed at pH 4.5 and 6.5 (Figure S2). Moreover, with the increase in pH from 4.5 to 6.5, the extents of HQ oxidation and BQ production decreased significantly. The black color of particle suspension at equilibrium suggests that birnessite was not completely reduced by HQ at equilibrium, and thus the oxidation potential (Eh) of birnessite can be estimated from the concentrations of HQ and BQ at equilibrium, according to the method described in Section 2.3. As shown in Figure 5a and Figure S3, the calculated Eh of birnessite is linearly proportional to its Mn AOS at pH 4.5–6.5. Moreover, the Eh value of birnessite at pH 5.5 determined from the thermodynamic data of HQ oxidation in this study was 376–379 mV, which falls into the Eh range of birnessite previously reported [45]. For birnessite with a fixed AOS value, the observed Eh value obviously increased with the decrease in pH, suggesting an increasing oxidative reactivity of birnessite under acidic conditions. This pH dependence has been widely observed in oxidation of nearly all model compounds by manganese oxides, which can be attributed to the promoted sorption and electron injection of organic molecule to the birnessite surface [46,47].
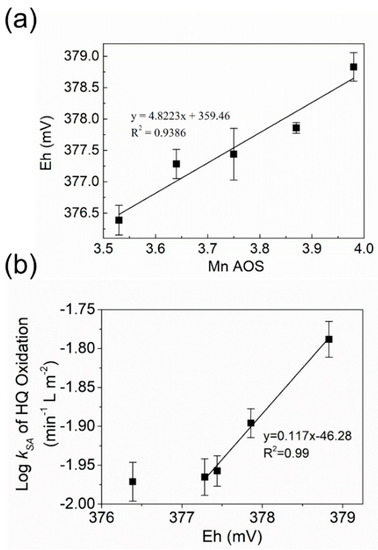
Figure 5.
(a) Oxidation potentials (Eh) of birnessite, determined from the concentrations of HQ and BQ at equilibrium, as a function of Mn AOS of birnessite; (b) logarithms of surface area-normalized pseudo-first-order initial rate constants (log kSA) for HQ oxidation by birnessite versus the calculated Eh values shown in Figure 5a. Error bars indicate standard deviation from three independent experiments.
The oxidation rates for HQ follow pseudo-first order kinetics at the initial stage of the reactions, when the properties of birnessite surface dominates reaction rates. As the reaction proceeds, accumulation of products on birnessite surface or changes in the structure or reactive site density of the birnessite surface would lead to different reaction orders or decreasing oxidation rates. To study the relationship between Mn AOS of birnessite and rates of HQ oxidation, we fitted the kinetic data during the first 13.3% of the reaction using a pseudo-first-order kinetic model to obtain surface-area normalized oxidation rate constants (kSA) of HQ by birnessite with different AOS values (Figure 5b). As AOS increased from 3.53 to 3.98, kSA proportionally increased from 0.011 to 0.016 min−1 L m−2 (Figure S4). Moreover, a linear relationship between the logarithms of kSA and Eh values has been observed (Figure 5b), suggesting that the rate-limiting step is electron transfer from HQ to birnessite. The decreased AOS by Mn2+–birnessite interaction can significantly lower Eh and interfacial electron transfer capability of birnessite, leading to the decreased extent and reaction rates of HQ oxidation by birnessite.
3.4. Degredation of BPA by Birnessite with Different AOS Values
One promising application of birnessite is to remove organic contaminants in natural environments [8]. Understanding how the Mn2+–birnessite interactions affect the oxidative reactivity of birnessite for contaminant degradation is critical to predict the long-term efficiency of birnessite for contaminants. Here, BPA was selected as a model contaminant to investigate the relationship between Mn AOS of birnessite and its capability in BPA attenuation. Figure 6a shows the kinetic profiles of BPA degradation (the initial BPA concentration = 131.4 μM) by 2.80 mM birnessite with different AOS values at pH 5.5. In all experiments, the BPA concentration rapidly decreased at the initial stage, and then the removal rate gradually decreased with time. A good linear correlation between the logarithm of the surface area-normalized pseudo-first-order initial rate constants (log kSA) of BPA oxidation and birnessite AOS was observed (Figure 6b). As AOS decreased from 3.98 to 3.53, the corresponding log kSA decreased from −1.845 to −2.973 min−1 L m−2.
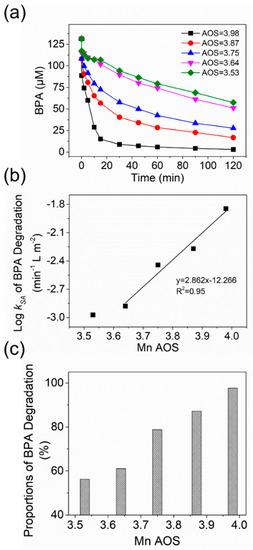
Figure 6.
(a) Time-dependent concentrations of BPA in the oxidation experiments of 131.4 μM BPA by 2.80 mM birnessite with different AOS values at pH 5.5; (b) surface area-normalized pseudo-first-order initial rate constants (log kSA) of BPA oxidation as a function of Mn AOS of birnessite; (c) percentages of BPA removal by birnessite versus its Mn AOS at the end of the 2 h reactions.
Different from HQ, BPA can be oxidized by birnessite into multiple intermediates and products [48], so the estimation of Eh from thermodynamic data is not applicable for the oxidation experiments with BPA. Instead, we compared removal efficiency of BPA at the end of two-hour reactions with different birnessite samples (Figure 6c). As the AOS value of birnessite decreased from 3.98 to 3.53, the percentage of BPA removal by birnessite decreased from 98% to 56%, suggesting that the efficiency of BPA removal also highly depends on Mn AOS of birnessite. The similar inhibited capacity of birnessite for BPA removal was observed in the previous study of BPA oxidation by birnessite with Mn2+ as a coexisting metal ion [48]. However, in the experiments with both Mn2+ and birnessite, the competitive binding of Mn2+ onto birnessite surface could also suppress complexation of BPA with reactive surface sites on birnessite, in addition to the decreased Eh of birnessite. In this study, after the reactions with Mn2+ at different concentrations, birnessite particles were collected and repeatedly washed to remove excess Mn2+ sorbed on the mineral surface. The observed changes in kSA and efficiency of BPA removal are mainly related to the inhibited oxidative reactivity of birnessite, not the competitive binding effect of Mn2+.
4. Discussion
4.1. Tunable Mn AOS and Eh of Birnessite by Reaction with Aqueous Mn2+
It has been well recognized that Mn2+–birnessite interaction may induce birnessite transformation into different secondary mineral phases, but the kinetics and extent of the transformation highly depend on pH and the ratio of Mn2+ to birnessite [4,49]. In this study, no peaks of secondary mineral phases were observed in the XRD pattern of 1.86 mM birnessite after the 24 h-reaction with 0.4 mM Mn2+ at pH 5.5 (data not shown). The representative SEM images of birnessite after reactions with 0.1–0.4 mM Mn2+ at pH 5.5 (Figure S5) show that the particle size and morphology remain similar under all experimental conditions. These results imply that no mineralogical transformation of birnessite after reaction with aqueous Mn2+ under the conditions of this study occurs. It agrees well with the results previously reported by Lefkowitz et al. and Hinkle et al. that no phase transformation of birnessite was induced by aqueous Mn2+ at pH < 7 [21,41]. Generally, high ratios of aqueous Mn(II) to structural Mn(IV) in birnessite are needed to induce extensive Mn(IV) reduction and phase transformation of birnessite [4]. As the concentration of aqueous Mn(II) decreased, the time required to form new mineral phases from Mn(II)–birnessite interaction significantly increased [4,49]. The added Mn2+ in this study was at a low concentration range, which might only increase the content of structural Mn(III) to a certain extent and disrupt the stacking order of birnessite. Correspondingly, the bulk birnessite structure probably remained intact during the course of the reactions [19].
Although no detectable secondary mineral phases were formed, the interaction of 1.86 mM birnessite with 0.1–0.4 mM Mn2+ at pH 4.5–6.5 obviously decreased Mn AOS of birnessite. It can be attributed to Mn(II) incorporation into vacant sites or electron transfer between sorbed Mn(II) and structural Mn(IV) in birnessite, resulting in increased contents of Mn(III) and decreased Mn AOS [21]. The increasing concentration of Mn(III) upon exposure of birnessite to Mn2+ (Figure 2b) also confirmed the production of Mn(III) from Mn(II)-Mn(IV) comproportionation reaction. Moreover, the equilibrium concentration of Mn(III) and AOS value proportional increased with the increase in the initial Mn2+ concentration (Figure 2). Adding more Mn2+ resulted in more sorbed Mn(II) on birnessite surface (Figure 2c) and promoted the reduction of structural Mn(IV). On the other hand, increasing the initial concentration of aqueous Mn2+ lowered reduction potential of the solution and promoted electron injection from the solution to the solid. These results indicate that the Mn AOS of birnessite can be changed as the concentration of coexisting Mn2+ increases in surrounding environments.
However, it is worth mentioning that the AOS values tuned by the Mn2+–birnessite interaction is within a range. Mn2+ at high concentrations may induce phase transformation of birnessite. In that case, the change in Mn AOS is dependent not only on electron transfer at the Mn2+–birnessite interface but also on the crystal structure of secondary mineral phases. Moreover, as AOS decreased, redox potential of birnessite correspondingly decreased. When the AOS value is sufficiently low, the difference in the redox potentials across the solid–solution interface can be not enough to drive electron injection from sorbed Mn(II) to birnessite, leading to the limited AOS range adjusted by aqueous Mn2+.
4.2. A Linear Correlation between Rate Constants/Eh and AOS of Birnessite
Figure 5b shows that the Eh values of birnessite estimated from the equilibrium concentrations of HQ/BQ are linearly proportional to the Mn AOS values of birnessite. Although many attempts have been made to investigate how the Mn AOS values of manganese oxide minerals impact their oxidative reactivity or adsorption capability to heavy metals, different MnO2 mineral phases or the particles prepared via different synthetic methods were used to obtain MnO2 particles with a range of AOS values [27]. In addition to different AOS values, these minerals may also have distinct physicochemical properties that are likely to affect their oxidative reactivity. Thus, no quantitative correlations between AOS and Eh have been reported in the previous studies. In this study, only the AOS values were changed by the reactions of birnessite with aqueous Mn2+ of different concentrations at pH 4.5–6.5, and the particle size and morphology remained similar (Figure S5). Based on the thermodynamic data of HQ oxidation by birnessite samples with different AOS values, we developed a linear correlation between AOS and Eh, which provides a facile way to estimate Eh of birnessite via measuring its Mn AOS. On the other hand, coexistence of birnessite with aqueous Mn2+ in low concentrations is ubiquitous in various environmental settings with active manganese cycling [4,21,50]. The linear correlation between the concentration of coexisting Mn2+ and AOS/Eh of birnessite allows us to estimate Eh or oxidative reactivity of birnessite from the Mn2+ concentration in natural environment.
Figure 5 and Figure 6b show that logkSA is linearly proportional to Eh/AOS in the oxidation experiments of either HQ or BPA by the birnessite samples with AOS = 3.64–3.98. The linear correlation between logkSA and Eh/AOS suggests that the rate-determining step of HQ or BPA oxidation by birnessite is electron transfer from organic cmpounds to birnssite, not the diffusion of organic compounds into the boundary layer to form a surface complex. At the initial stage, the Eh/AOS value of birnessite controls the rate of interfacial electron transfer between sorbed Mn(II) and birnessite, so logkSA was positively proportional to the Eh/AOS value of birnessite. This observed trend agrees well with the results that the presence of aqueous Mn2+ suppresses the efficiency of manganese oxide in removing BPA [48]. However, Huang et al. reported that the pseudo-first-order rate constants (k) for BPA oxidation by a range of manganese oxide, including δ-MnO2, hollandite (α-MnO2), pyrolusite (β-MnO2), ramsdellite (γ-MnO2), and manganite (γ-MnOOH), is proportional to surface Mn(III) content but negatively correlated with Mn AOS values [7]. The opposite trend of k vs. AOS, compared to our findings, might be attributed to the different specific surface area, crystal structure, or surface Mn(III) density of the different manganese oxide mineral phases. It is worth mentioning that logkSA of birnessite with the lowest AOS (3.53) and Eh (376.4 mV) was similar to that of the sample with AOS = 3.64 in the experiments with either HQ or BPA, suggesting logkSA did not decrease further with the decrease in AOS or Eh in this case (Figure 5b and Figure 6b). The non-linear correlation at the lowest AOS/Eh can be attributed to a change in the rate-limiting step or reaching a minimal rate constant. These findings quantitatively describe the range of AOS and Eh of birnessite adjusted by the Mn2+–birnessite interaction, as well as the correlation between the AOS/Eh values of birnessite and oxidation rate constants of model organic compounds by birnessite.
5. Conclusions
This study presents that the average Mn oxidation state (AOS) of birnessite can be tuned by changing the concentration of coexisting Mn2+, without detectable mineral phase transformation, under mildly acidic environments. The higher Mn2+ concentration and lower solution pH facilitates to lower the Mn AOS of birnessite. Using the well-defined chemical redox probe, HQ, we revealed that the oxidation potential (Eh) of birnessite is proportion to its Mn AOS. A good linear correlation between the logarithms of the surface area-normalized pseudo-first-order initial rate constants (log kSA) of BPA oxidation and AOS values of birnessite suggests that the degradation rate of BPA at the initial stage is determined by the capability of birnessite to transfer electrons with surface-complexed organic compounds. The findings of this study suggest that the AOS and oxidative reactivity of birnessite in natural environments may vary in a range, when it is exposed to aqueous Mn2+ resulting from many geochemical processes, such as upward diffusion of Mn(II) across oxic/anoxic interfaces in sediments and water columns [51,52]. The quantitative correlations among Mn2+/birnessite ratio, Mn AOS, Eh of birnessite, and oxidation rates/extents of organic contaminants by birnessite that are developed in this study can be helpful to predict the efficiency of manganese oxide for contaminant degradation and to develop its applications for environmental treatments.
Supplementary Materials
The following are available online at https://www.mdpi.com/2075-163X/10/8/690/s1. Figure S1: Concentration of Mn2+ uptake and Mn(III) production; Figure S2: Concentrations of HQ and BQ at equilibrium; Figure S3: Relationship between Eh and Mn AOS; Figure S4: Relationship between kSA and Mn AOS; Figure S5: SEM images of birnessite particles.
Author Contributions
Conceptualization, J.L.; methodology, Q.G. and A.S.; validation, J.L., B.Z. and Q.G.; formal analysis, Q.G., Y.Z. and A.S.; investigation, Q.G. and A.S.; resources, J.L. and B.Z.; data curation, Q.G.; writing—original draft preparation, J.L., Y.Z. and A.S.; writing—review and editing, J.L. and A.S.; supervision, J.L. and B.Z.; project administration, J.L. and B.Z.; funding acquisition, J.L. All authors have read and agreed to the published version of the manuscript.
Funding
This research was funded by National Natural Science Foundation of China, grant number 91751105, 41820104003, and 41972318.
Acknowledgments
We acknowledge the support from National Natural Science Foundation of China (91751105, 41820104003, and 41972318) and the use of facilities within Beijing Key Laboratory of Mineral Environmental Function and The Key Laboratory of Water and Sediment Sciences at Peking University.
Conflicts of Interest
The authors declare no conflict of interest.
References
- Post, J.E. Manganese oxide minerals: Crystal structures and economic and environmental significance. Proc. Natl. Acad. Sci. USA 1999, 96, 3447–3454. [Google Scholar] [CrossRef] [PubMed]
- Nico, P.S.; Zasoski, R.J. Importance of Mn(III) availability on the rate of Cr(III) oxidation on delta-MnO2. Environ. Sci. Technol. 2000, 34, 3363–3367. [Google Scholar] [CrossRef]
- Villalobos, M.; Toner, B.; Bargar, J.; Sposito, G. Characterization of the manganese oxide produced by pseudomonas putida strain MnB1. Geochim. Cosmochim. Acta 2003, 67, 2649–2662. [Google Scholar] [CrossRef]
- Elzinga, E.J. Reductive transformation of birnessite by aqueous Mn(II). Environ. Sci. Technol. 2011, 45, 6366–6372. [Google Scholar] [CrossRef]
- Weaver, R.M.; Hochella, M.F. The reactivity of seven Mn-oxides with Cr3+aq: A comparative analysis of a complex, environmentally important redox reaction. Am. Mineral. 2003, 88, 2016–2027. [Google Scholar] [CrossRef]
- Peng, H.; McKendry, I.G.; Ding, R.; Thenuwara, A.C.; Kang, Q.; Shumlas, S.L.; Strongin, D.R.; Zdilla, M.J.; Perdew, J.P.; Energy Frontier Research Centers. Center for the Computational Design of Functional Layered, M. Redox properties of birnessite from a defect perspective. Proc. Natl. Acad. Sci. USA 2017, 114, 9523–9528. [Google Scholar] [CrossRef]
- Huang, J.; Zhong, S.; Dai, Y.; Liu, C.-C.; Zhang, H. Effect of MnO2 Phase Structure on the Oxidative Reactivity toward Bisphenol A Degradation. Environ. Sci. Technol. 2018, 52, 11309–11318. [Google Scholar] [CrossRef]
- Remucal, C.K.; Ginder-Vogel, M. A critical review of the reactivity of manganese oxides with organic contaminants. Environ. Sci. Process. Impacts 2014, 16, 1247–1266. [Google Scholar] [CrossRef]
- Zhu, M. Structure and Reactivity Study of Biotic and Abiotic Poorly Crystalline Manganese Oxides. Ph.D. Thesis, University of Delaware, Newark, DE, USA, 2010. [Google Scholar]
- Feng, X.H.; Zhai, L.M.; Tan, W.F.; Liu, F.; He, J.Z. Adsorption and redox reactions of heavy metals on synthesized Mn oxide minerals. Environ. Pollut. 2007, 147, 366–373. [Google Scholar] [CrossRef]
- McKendry, I.G.; Kondaveeti, S.K.; Shumlas, S.L.; Strongin, D.R.; Zdilla, M.J. Decoration of the layered manganese oxide birnessite with Mn(II/III) gives a new water oxidation catalyst with fifty-fold turnover number enhancement. Dalton Trans. 2015, 44, 12981–12984. [Google Scholar] [CrossRef]
- Mulvaney, P.; Cooper, R.; Grieser, F.; Meisel, D. Kinetics of reductive dissolution of colloidal manganese-dioxide. J. Phys. Chem. 1990, 94, 8339–8345. [Google Scholar] [CrossRef]
- Marafatto, F.F.; Strader, M.L.; Gonzalez-Holguera, J.; Schwartzberg, A.; Gilbert, B.; Pena, J. Rate and mechanism of the photoreduction of birnessite (MnO2) nanosheets. Proc. Natl. Acad. Sci. USA 2015, 112, 4600–4605. [Google Scholar] [CrossRef] [PubMed]
- Zhao, W.; Cui, H.; Liu, F.; Tan, W.; Feng, X. Relathionship between Pb2+ adsorption and average Mn oxidation state in synthetic birnessites. Clays Clay Miner. 2009, 57, 513–520. [Google Scholar] [CrossRef]
- Zhao, H.; Zhu, M.; Li, W.; Elzinga, E.J.; Villalobos, M.; Liu, F.; Zhang, J.; Feng, X.; Sparks, D.L. Redox reactions between Mn(II) and hexagonal birnessite change its layer symmetry. Environ. Sci. Technol. 2016, 50, 1750–1758. [Google Scholar] [CrossRef]
- Learman, D.R.; Voelker, B.M.; Vazquez-Rodriguez, A.I.; Hansel, C.M. Formation of manganese oxides by bacterially generated superoxide. Nat. Geosci. 2011, 4, 95–98. [Google Scholar] [CrossRef]
- Bargar, J.R.; Tebo, B.M.; Bergmann, U.; Webb, S.M.; Glatzel, P.; Chiu, V.Q.; Villalobos, M. Biotic and abiotic products of Mn(II) oxidation by spores of the marine Bacillus sp. strain SG-1. Am. Mineral. 2005, 90, 143–154. [Google Scholar] [CrossRef]
- Learman, D.R.; Wankel, S.D.; Webb, S.M.; Martinez, N.; Madden, A.S.; Hansel, C.M. Coupled biotic–abiotic Mn(II) oxidation pathway mediates the formation and structural evolution of biogenic Mn oxides. Geochim. Cosmochim. Acta 2011, 75, 6048–6063. [Google Scholar] [CrossRef]
- Lefkowitz, J.P.; Elzinga, E.J. Impacts of aqueous Mn(II) on the sorption of Zn(II) by hexagonal birnessite. Environ. Sci. Technol. 2015, 49, 4886–4893. [Google Scholar] [CrossRef]
- Lefkowitz, J.P.; Rouff, A.A.; Elzinga, E.J.; Brookhaven National, L. Influence of pH on the reductive transformation of birnessite by aqueous Mn(II). Environ. Sci. Technol. 2013, 47, 10364–10371. [Google Scholar] [CrossRef]
- Hinkle, M.A.G.; Flynn, E.D.; Catalano, J.G. Structural response of phyllomanganates to wet aging and aqueous Mn(II). Geochim. Cosmochim. Acta 2016, 192, 220–234. [Google Scholar] [CrossRef]
- Peng, H.; Pearce, C.I.; N’Diaye, A.T.; Zhu, Z.; Ni, J.; Rosso, K.M.; Liu, J. Redistribution of electron equivalents between magnetite and aqueous Fe2+ induced by a model quinone compound AQDS. Environ. Sci. Technol. 2019, 53, 1863–1873. [Google Scholar] [CrossRef] [PubMed]
- Peng, H.; Pearce, C.I.; Huang, W.F.; Zhu, Z.L.; N’Diaye, A.T.; Rosso, K.M.; Liu, J. Reversible Fe(II) uptake/release by magnetite nanoparticles. Environ. Sci. Nano 2018, 5, 1545–1555. [Google Scholar] [CrossRef]
- Stone, A.T.; Morgan, J.J. Reduction and dissolution of manganese(III) and manganese(IV) oxides by organics. 1. reaction with hydroquinone. Environ. Sci. Technol. 1984, 18, 450–456. [Google Scholar] [CrossRef] [PubMed]
- Klausen, J.; Haderlein, S.B.; Schwarzenbach, R.P. Oxidation of substituted anilines by aqueous MnO2: Effect of co-solutes on initial and quasi-steady-state kinetics. Environ. Sci. Technol. 1997, 31, 2642–2649. [Google Scholar] [CrossRef]
- Ukrainczyk, L.; McBride, M.B. Oxidation of phenol in acidic aqueous suspensions of manganese oxides. Clays Clay Miner. 1992, 40, 157–166. [Google Scholar] [CrossRef]
- Liu, C.S.; Zhang, L.J.; Feng, C.H.; Wu, C.A.; Li, F.B.; Li, X.Z. Relationship between oxidative degradation of 2-mercaptobenzothiazole and physicochemical properties of manganese (hydro)oxides. Environ. Chem. 2009, 6, 83–92. [Google Scholar] [CrossRef]
- Nico, P.S.; Zasoski, R.J. Mn(III) center availability as a rate controlling factor in the oxidation of phenol and sulfide on delta-MnO2. Environ. Sci. Technol. 2001, 35, 3338–3343. [Google Scholar] [CrossRef]
- Mckenzie, R.M. The synthesis of birnessite, cryptomelane, and some other oxides and hydroxides of manganese. Mineral. Mag. 1971, 38, 493–502. [Google Scholar] [CrossRef]
- Ilton, E.S.; Post, J.E.; Heaney, P.J.; Ling, F.T.; Kerisit, S.N. XPS determination of Mn oxidation states in Mn (hydr)oxides. Appl. Surf. Sci. 2016, 366, 475–485. [Google Scholar] [CrossRef]
- Drits, V.A.; Silvester, E.; Gorshkov, A.I.; Manceau, A. Structure of synthetic monoclinic Na-rich birnessite and hexagonal birnessite: 1. Results from X-ray diffraction and selected-area electron diffraction. Am. Mineral. 1997, 82, 946–961. [Google Scholar] [CrossRef]
- Golden, D.C.; Dixon, J.B.; Chen, C.C. Ion exchange, thermal transformations, and oxidizing properties of birnessite. Clays Clay Miner. 1986, 34, 511–520. [Google Scholar] [CrossRef]
- Uddin, S.; Rauf, A.; Kazi, T.G.; Afridi, H.I.; Lutfullah, G. Highly sensitive spectrometric method for determination of hydroquinone in skin lightening creams: Application in cosmetics: Highly sensitive spectrometric method for determination of hydroquinone in skin. Int. J. Cosmet. Sci. 2011, 33, 132–137. [Google Scholar] [CrossRef] [PubMed]
- Kung, K.H.; McBride, M.B. Electron transfer processes between hydroquinone and iron oxides. Clays Clay Miner. 1988, 36, 303–309. [Google Scholar] [CrossRef]
- Zhou, D.; Wu, F.; Deng, N.; Xiang, W. Photooxidation of bisphenol A (BPA) in water in the presence of ferric and carboxylate salts. Water Res. 2004, 38, 4107–4116. [Google Scholar] [CrossRef] [PubMed]
- Govindaraj, M.; Rathinam, R.; Sukumar, C.; Uthayasankar, M.; Pattabhi, S. Electrochemical oxidation of bisphenol-A from aqueous solution using graphite electrodes. Environ. Technol. 2013, 34, 503–511. [Google Scholar] [CrossRef] [PubMed]
- Villalobos, M.; Bargar, J.; Sposito, G. Mechanisms of Pb(II) sorption on a biogenic manganese oxide. Environ. Sci. Technol. 2005, 39, 569–576. [Google Scholar] [CrossRef]
- Lanson, B.; Drits, V.A.; Silvester, E.; Manceau, A. Structure of H-exchanged hexagonal birnessite and its mechanism of formation from Na-rich monoclinic buserite at low pH. Am. Mineral. 2000, 85, 826–838. [Google Scholar] [CrossRef]
- Morgan, J.J. Kinetics of reaction between O2 and Mn(II) species in aqueous solutions. Geochim. Cosmochim. Acta 2005, 69, 35–48. [Google Scholar] [CrossRef]
- Zhu, Y.; Liang, X.; Zhao, H.; Yin, H.; Liu, M.; Liu, F.; Feng, X. Rapid determination of the Mn average oxidation state of Mn oxides with a novel two-step colorimetric method. Anal. Methods 2016, 9, 13–19. [Google Scholar] [CrossRef]
- Lefkowitz, J.P.; Elzinga, E.J. Structural alteration of hexagonal birnessite by aqueous Mn(II): Impacts on Ni(II) sorption. Chem. Geol. 2017, 466, 524–532. [Google Scholar] [CrossRef]
- Mao, M.; Li, Y.; Hou, J.; Zeng, M.; Zhao, X. Extremely efficient full solar spectrum light driven thermocatalytic activity for the oxidation of VOCs on OMS-2 nanorod catalyst. Appl. Catal. B Environ. 2015, 174, 496–503. [Google Scholar] [CrossRef]
- Santos, V.P.; Soares, O.S.G.P.; Bakker, J.J.W.; Pereira, M.F.R.; Órfão, J.J.M.; Gascon, J.; Kapteijn, F.; Figueiredo, J.L. Structural and chemical disorder of cryptomelane promoted by alkali doping: Influence on catalytic properties. J. Catal. 2012, 293, 165–174. [Google Scholar] [CrossRef]
- Fan, D.; Bradley, M.J.; Hinkle, A.W.; Johnson, R.L.; Tratnyek, P.G. Chemical reactivity probes for assessing abiotic natural attenuation by reducing iron minerals. Environ. Sci. Technol. 2016, 50, 1868–1876. [Google Scholar] [CrossRef] [PubMed]
- Liu, C.; Zhang, L.; Li, F.; Wang, Y.; Gao, Y.; Li, X.; Cao, W.; Feng, C.; Dong, J.; Sun, L. Dependence of sulfadiazine oxidative degradation on physicochemical properties of manganese dioxides. Ind. Eng. Chem. Res. 2009, 48, 10408–10413. [Google Scholar] [CrossRef]
- Manning, B.A.; Fendorf, S.E.; Bostick, B.; Suarez, D.L. Arsenic(III) Oxidation and Arsenic(V) Adsorption Reactions on Synthetic Birnessite. Environ. Sci. Technol. 2002, 36, 976–981. [Google Scholar] [CrossRef]
- Scott, M.J.; Morgan, J.J. Reactions at oxide surfaces. 1. oxidation of As(III) by synthetic birnessite. Environ. Sci. Technol. 1995, 29, 1898–1905. [Google Scholar] [CrossRef]
- Lin, K.; Liu, W.; Gan, J. Oxidative removal of bisphenol A by manganese dioxide: Efficacy, products, and pathways. Environ. Sci. Technol. 2009, 43, 3860–3864. [Google Scholar] [CrossRef]
- Shihua Tu, T.; Tu, S.; Racz, G.J.; Racz, G.J.; Tee Boon Goh, B.G.; Goh, T.B. Transformations of synthetic birnessite as affected by pH and manganese concentration. Clays Clay Miner. 1994, 42, 321–330. [Google Scholar] [CrossRef]
- Frierdich, A.J.; Spicuzza, M.J.; Scherer, M.M. Oxygen isotope evidence for Mn(II)-catalyzed recrystallization of Manganite (γ-MnOOH). Environ. Sci. Technol. 2016, 50, 6374–6380. [Google Scholar] [CrossRef]
- Tebo, B.M.; Bargar, J.R.; Clement, B.G.; Dick, G.J.; Murray, K.J.; Parker, D.; Verity, R.; Webb, S.M. Biogenic manganese oxides: Properties and mechanisms of formation. Annu. Rev. Earth Planet. Sci. 2004, 32, 287–328. [Google Scholar] [CrossRef]
- Van Cappellen, P.; Viollier, E.; Roychoudhury, A.; Clark, L.; Ingall, E.; Lowe, K.; Dichristina, T. Biogeochemical cycles of manganese and Iion at the oxic−anoxic transition of a Stratified Sarine Sasin (Orca Basin, Gulf of Mexico). Environ. Sci. Technol. 1998, 32, 2931–2939. [Google Scholar] [CrossRef]
© 2020 by the authors. Licensee MDPI, Basel, Switzerland. This article is an open access article distributed under the terms and conditions of the Creative Commons Attribution (CC BY) license (http://creativecommons.org/licenses/by/4.0/).