Abstract
This work reports the results of the archaeometrical investigation performed on twenty glass tesserae collected in 2018, during the restoration of the Four Seasons mosaic, which dates between the second and the third century AD, in the archaeological area of the S. Aloe quarter in Vibo Valentia (Calabria, Italy). The coloured glass tesserae were analysed through a micro-analytical approach using an Electron Probe Micro Analyser with Wavelength-Dispersive Spectroscopy (EPMA-WDS) and Laser Ablation with Inductively Coupled Plasma Mass Spectrometry (LA-ICP-MS). The aims of the study were (1) the determination of the chemical composition and the technology of glass mosaic tesserae production; (2) the individuation of colouring and opacifying agents used for the production of the glass tesserae. The glasses show the typical soda–lime–silica composition. EPMA-WDS results prove the use of Sn–Pb antimonates to create yellow glass, and of cuprite to obtain the red colour. Copper and cobalt were employed in both green and blue glasses to produce different shades of colour (grey, tints of green, dark and light blue).
1. Introduction
The Calabrian city of Vibo Valentia lays on an ample hilly plateau dominating the Lamezia gulf, the Poro upland and the valley where the Mesima river flows (Figure 1). The Vibo Valentia area has been continuously inhabited since the Prehistoric period thanks to its strategic geographic position.
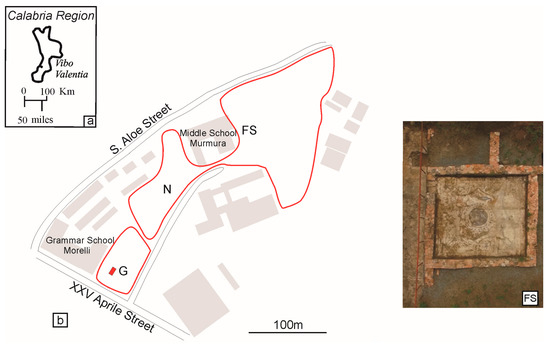
Figure 1.
(a) Vibo Valentia, Calabria (Italy); (b) Map of S. Aloe archaeological site; FS: Four Seasons mosaic aerial photograph. G: Geometric mosaic; N: Nereid mosaic; D: Domus XXV Aprile street.
Originally, Vibo Valentia was a Greek colony, founded by the Locri people at the end of the VII century B.C. on the Tyrrhenian shore of Calabria. It then became a Roman colony in 192 B.C. [1]. The city saw its golden age during the Roman Empire, especially in the III century A.D.
S. Aloe was one of the most developed Vibo Valentia districts. People lived there until the end of the VI century A.D. [2]. This archaeological quarter expands for about thirty thousand square meters, at about 470 m above sea level. Nowadays, it is sited in an area between the Grammar School “Morelli” and the middle school “Murmura” [3]. In the S. Aloe quarter, three polychrome mosaics have been found (Figure 1). They differ in their iconography, the period in which they were realized and their executive techniques [2]. The stone and glass tesserae of two of them—the Nereid and Geometric mosaics—have been previously studied [4] defining the raw materials and their production techniques. For example, the employment of precious marble of Greek provenance testified to the greatness of the archaeological site. Moreover, the typical manufacture of the Roman glassmakers has been recognized in the realization of the glass tesserae [4].
This paper is aimed at studying and chemically characterizing the third mosaic named Four Seasons and discovered in the thermal baths area of the S. Aloe quarter. The Four Seasons mosaic covers a square area of 4.80 m × 5.10 m (Figure 1 and Figure 2) and it dates between the end of the II and the beginning of the III century A.D. [2]. It is richly decorated and its compositional scheme is rather complex. The Four Seasons mosaic has a circle at its core and a laurel wreath trimming it. Inside the core circle, there are a sea bream, a sea brass, a goatfish and a squid on a dark blue background. At the four floor angles, there are female figures symbolizing the four seasons. Winter wears a cloak and there is a cane behind her, Summer wears a straw hat, Spring has a flower crown over her dark curls and Autumn has vine leaves over her temples [5]. The mosaic is enriched with several plant-related elements such as pear tree branches and fruits, rose shoots, olive tree branches and aquatic plants. There are also plenty of animal-related details such as peacocks, partridges, ducks and a pheasant.
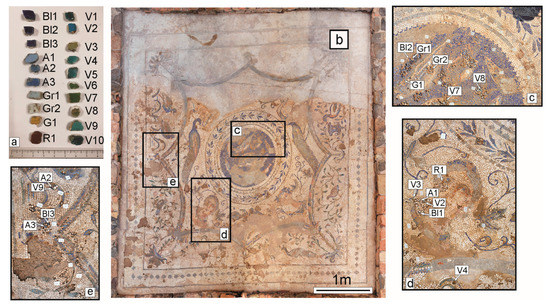
Figure 2.
(a) Glass tesserae studied, grouped by colour. (b) Four Seasons mosaic. (c–e) Details of sampling.
The Four Seasons mosaic has been realized with coloured vitreous and stone tesserae on a white background made of calcareous tesserae. The vitreous tesserae are in bright colours such as grey, blue, yellow, green and red, all used to enhance the mosaic’s most luminous parts. Different kinds of marbles and other stones have been used for its opaque areas instead. Whoever realized the mosaic did that skilfully, with the aim of pleasing aesthetically those who were looking at this luxurious paving.
The Four Seasons mosaic’s colouring and executional skill indicate that a wealthy man commissioned it and a skilled “maestro” realized it.
Several authors have dealt with studies about the chemical composition and the technology of glass tesserae production [4,6,7,8,9,10,11,12]. They all argue that the glass of the Roman imperial age was generally silica–soda–lime made and it was obtained by a mixture of beach siliceous–feldspar–calcareous sand and natron as flux; only in a few cases, a plant ash component richer in magnesia and potash was added [12,13,14,15,16,17,18,19,20,21].
Chemical studies led to the formulation of a model explaining how the production and trade of glass worked in Roman times. The hypothesis was that the glass production was limited to a small number of primary glass making centres, mainly in coastal areas of Egypt and in the Near East. The slab glasses were broken into chunks and distributed to secondary fabrication workshops to be re-melted and shaped [14,15].
Freestone [13], in a pioneering paper, identifies a relatively limited number of glass categories throughout the areas of the Mediterranean and Europe during the first millennium of the Christian era. His thesis substantially confirms the idea of just a few centres for the primary production of a transparent and colourless glass. In detail, he distinguishes five natron-type glasses: Levantine I, Levantine II (produced using coastal sand of the Siryo–Palestinian region), Roman blue-green, HIMT (High Iron, Manganese, Titanium) and Egyptian. Recent studies [22,23,24,25,26] allowed the separation of the main glass groups proposed by Freestone [13] into numerous sub-types, considering the different chemical characteristics, the age and the site of glass production. According to the different contents of the two decolourants Sb and Mn, the glasses of the period of interest (I–III century A.D.) were divided into: Roman-Sb, Roman-Mn, Roman mixed Sb-Mn. This last was probably obtained from the recycling of the two end members, and unintentionally coloured glass [16,17,24,26].
Although numerous literature data are available for opaque coloured glass [6,7,9,10,12], their interpretation is complex, since the element concentrations of base glass are modified by the addition of opacifiers or colourants. Indeed, the primary transparent base glass was coloured by adding colourants and opacifiers into secondary workshops [9,10].
This research on the composition of the Four Seasons mosaic tesserae aims at clarifying the way glass production technology worked on them. Similarities and/or differences among tesserae in different shades of colour are examined to allow the individuation of colouring and opacifying agents used for their production.
2. Material and Methods
A representative sampling of glass tesserae from the Four Seasons mosaic was carried out in summer 2018, before the whole archaeological site of S. Aloe quarter was put to restoration. The sampling was executed with the aim of gathering all the various colours of glasses (Figure 2a). Thus, they were collected during the excavation phase, from parts detached from the flooring, but certainly pertaining to the mosaic (Figure 2b–e). The samples consist of six blue tesserae (three light and three dark), ten of different shades of green, two grey, one red and one yellow (Table 1; Figure 2a). For a more objective color classification, this subdivision was also checked by measuring the colorimetric coordinates of all tesserae by a Konica Minolta CM-2600D spectrophotometer (Chiyoda, Tokyo, Japan (Giappone)), through the determination of L*, a*, and b* colorimetric coordinates of the CIELAB (Commission Internationale de l’éclairage L = L*, A = a*, and B = b* colorimetric coordinates) space.

Table 1.
List of the glass tesserae collected in the Four Seasons mosaic in the S. Aloe quarter, Vibo Valentia with relative information about colour and colorimetric coordinates.
Before any chemical analyses, glass tesserae were observed using a stereomicroscope and were polished with diamond clothes. Samples were then fixed on slides, with the fresh side facing upward. Due to their small size, two or three samples were positioned on each slide.
Chemical analyses were carried out using two different micro-analytical techniques: EPMA-WDS (Electron Probe Micro Analyser with Wavelength-Dispersive Spectroscopy) and LA-ICP-MS (Laser Ablation with Inductively Coupled Plasma Mass Spectrometry). To determine major element concentrations, EPMA analyses were carried out using a JEOL-JXA 8230 (JEOL Ltd., Tokyo, Japan), equipped with 5 Spectrometers WDS: LDE (artificial Layered Dispersive Element), TAP (Thallium Acid Phthalate), PET (PEnTaerythritol), LiF (Lithium Fluoride), crystals. The EPMA-WDS was used under the following operating conditions for the image acquisition: 15 kV, Probe current at 10–20 nA and Solid State Detector (SSD), Everhart Thornley detector (Secondary Electron detector); for chemical analyses: acceleration voltage 15 kV, probe current 10 nA, a defocused beam of 10 µm to avoid the loss of alkali. Furthermore, an acquisition time of 15 s was selected to avoid the loss of Na and ensure the correct determination of other element concentrations. The detection limits for most elements were about 0.2 wt.%. The reliability of the results was verified by measuring the SRM610 500 ppm by NIST (National Institute of Standards and Technology) and the BCR 2G (Columbia River Basalt) by USGS (United States Geological Survey) glass reference materials.
The analyses of micrometric crystals (ranging in size from 5 to 20 μm and sometimes dispersed within the glasses) were executed in spot manner with a beam of 1 µm.
The LA-ICP-MS was used to determine the trace element compositions. The LA-ICP-MS equipment consists of an Elan DRCe (Perkin Elmer, Waltham, MA, USA), connected to a New Wave UP213 solid-state Nd-YAG laser probe (213 nm). Samples were ablated by laser beam in a cell, and the vaporised material was then flushed [27] to the ICP for quantification. Each ablation crater was generally 50 μm in diameter and 80 μm in depth. The procedures for data acquisition were those normally used in the Mass Spectroscopy Laboratory of the Department of Biology, Ecology and Earth Sciences of University of Calabria [4,6,28,29].
Only two/three point analyses were carried out on each sample. Calibration was performed on glass reference material SRM612–50 ppm by NIST (National Institute of Standards and Technology) in conjunction with internal standardisation, applying SiO2 concentrations [30] from EPMA-WDS analyses. In order to evaluate possible errors within each analytical sequence, determinations were also made on the SRM610–500 ppm by NIST and on BCR 2G by USGS glass reference materials as unknown samples, and element concentrations were compared with reference values from the literature [31]. Accuracy, as the relative difference from reference values, was always better than 10%, and most elements plotted in the range of ±5% [32].
3. Results and Discussion
3.1. Major Element Concentrations
Table 2 lists the composition of major element concentrations in wt.% of oxides determined by EPMA-WDS. Each datum represents the mean value of three analyses.
Table 2.
Major element concentrations in wt.% of oxides determined by Electron Probe Micro Analyser with Wavelength-Dispersive Spectroscopy (EPMA-WDS).
The samples are characterised by a SiO2 content ≈ 65–70 wt.% (except for the yellow and red tesserae containing, respectively, 60.18 wt.% and 58.3 wt.%), Na2O content ≈ 15–20 wt.%, (the yellow tesserae shows Na2O = 10 wt.%), CaO ≈ 5–7.5 wt.%, low Al2O3 (≈ 2–3 wt.%). The K2O and MgO contents are below 1.50 wt.%, which are coherent with the glassmaking tradition of natron-fluxed glass (Figure 3) [15,17,19,20,21,33].
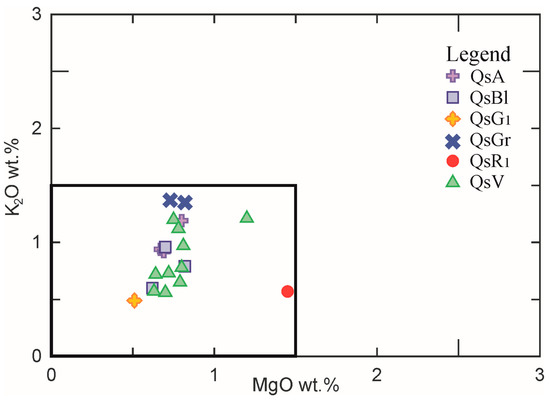
Figure 3.
Binary diagram of MgO vs. K2O. The square area encloses the composition of natron glass.
The samples analysed contain lead in variable concentrations, indeed, PbO contents vary from negligible to up to 17.49 wt.% (Table 2). The highest lead contents are detected in the yellow and red samples, showing, respectively PbO = 17.49 wt.% and 9.22 wt.%, and remarkable concentrations are also identified in some green tesserae (PbO varying from 1.12 to 6.91 wt.%). These results show how the presence of lead is linked to the production of specific colours, such as red, green and yellow. A further and deeper discussion is reported in the sub-paragraph “colouring and opacifying agents”.
A so-called reduced composition of the glassy matrix has been calculated, in order to determine the type of base glass used for the tesserae of the Four Seasons mosaic. In particular, the content of Pb, Cu, Sn, Sb and Mn was subtracted from the composition of the tesserae and the remaining oxides were normalised to 100% (Table 3) [4,12,16,34]. Indeed, the reduced composition reflects the variations in the feldspars, heavy minerals and carbonates content of the glassmaking sands and it is also indicative of the fluxing agent.
Table 3.
Composition of base glass in wt.% of oxides normalized to 100% without MnO, PbO, CuO, Sb2O5, SnO2, P2O5, Cl.
As stated above, the glasses dominating the Roman period between I and III century A.D. have been subdivided into four compositional groups: Sb-colourless, Sb/Mn-colourless, Mn-colourless and unintentionally coloured glass, this last generally included in the Mn-glass group [17,18,24,26]. Their reduced compositions have been plotted in the diagrams SiO2 vs. Na2O and CaO vs. Al2O3 (Figure 4a,b), with the aim of individuating the compositional group of the Four Seasons mosaic glass tesserae. In the two diagrams, the limits of the key contents of SiO2, Na2O, CaO and Al2O3 proposed by Maltoni & Silvestri [17] to separate the Sb, Mn and Sb/Mn glasses have been drawn.
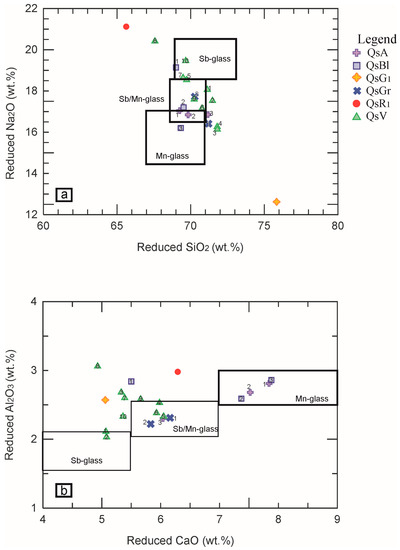
Figure 4.
Binary diagrams (a) reduced-SiO2 vs. reduced-Na2O; (b) reduced-Al2O3 vs. reduced-CaO. The coloured symbols in the legend refer to the various types of tesserae, while the numbers inside the symbols in the diagrams are associated with the individual sample analysed.
The majority of the samples, despite the great geochemical variability, plots near the area of Sb/Mn glass, except for four samples QsA1, QsA2, QsBl2 and QsBl3, which match the Mn-glass. Green sample QsV8, yellow QsG1 and red QsR1 do not fit the Roman compositional groups. Indeed, the yellow tessera in the reduced composition shows a very low content of Na2O (= 12.62 wt.%) and a high content of SiO2 (around 76 wt.%) (Table 3). On the contrary, the green QsV8 and the QsR1 red glasses display higher alumina and soda and lower silica contents. As concerns the yellow tessera (QsG1), the chemical characteristics (Table 3) make it possible to hypothesise that the sample is influenced by a superficial alteration with a consequent de-alkalinisation [35,36,37]. Anyhow, as for the yellow and red samples, it is not possible to establish whether these differences are due to the base glass or they are influenced by the colouring and opacifying techniques.
To confirm our attribution, the reduced compositions of the Four Seasons mosaic glass tesserae are compared against the literature data for the Roman period of interest (I–III century A.D.) [10,17,26] using two diagrams: Na2O/CaO vs. TiO2/Al2O3 and Al2O3 vs. Mn/(MnO + Sb2O5) (Figure 5).
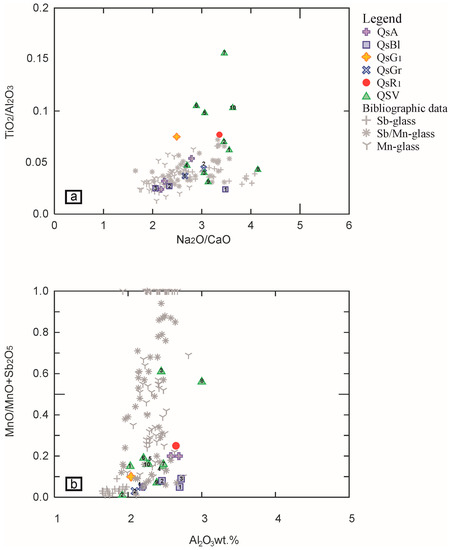
Figure 5.
Binary diagrams (a) Na2O/CaO vs. TiO2/Al2O3; (b) Al2O3 vs. MnO/(MnO + Sb2O5). In these two diagrams, the samples analysed in the framework of the paper have been compared with the data of Roman I–III century A.D. glasses’ bibliographic data [10,17,26]. The coloured symbols in the legend refer to the various types of tesserae, while the numbers inside the symbols in the diagrams are associated with the individual sample analysed.
The comparison allows the grouping of the glasses according to their compositional basis. In particular, the Na2O/CaO vs. TiO2/Al2O3 diagram (Figure 5a) suggests how the majority of the Four Seasons Mosaic tesserae overlaps Sb/Mn glass, while four green samples (QsV5, QsV6, QsV7, QsV10) achieve higher TiO2/Al2O3 and the other green QsV8 tessera plot near the Sb-glass. The four samples QsA1, QsA2, QsBl2, QsBl3, reaching higher CaO (around 7 wt.%) and lower TiO2 (around 0.07 wt.%), plot near the Mn-glass. The diagram Al2O3 vs. Mn/(MnO + Sb2O5) (Figure 5b) indicates that most tesserae, including the yellow and red ones, plot in the area of the Sb/Mn glass, except the QsV8 green sample, confirming that it can be considered an outlier. In the Figure 5b, the light blue and blue tesserae (QsBlx and QsAx) samples, despite their high content of Sb2O5 (varying from 3 to 3.7 wt.%), plot in the area where the Sb/Mn and the Mn-glasses overlap. In particular, the QsA1 and QsA2 samples plot very near to the yellow tessera n.64 collected from West Clacton Reservoir, Essex, UK, classified as Sb/Mn glass [10], but also near to the azure opaque tessera TN AZ1 collected from the decoration of a Roman bath recovered under the main church of Santa Maria Maggiore in Trento (Italy) classified as Mn-glass opacified by Ca-antimonates [17]. QsBl2 and QsBl3 plot near the pale blue opaque tessera TNCE1, and turquoise/pale green TN VCH140, both collected in Trento (Italy) and the turquoise PN TU2 coming from the Roman villa of Torre in Pordenone (Italy), all classified as Sb/Mn glass by [17]. Similarly, QsBl2 and QsBl3 are also near the tesserae blue opaque PN BO1, pale blue PN CE1 (from Pordenone, Italy) [17] and pale grey-blue n.69 (from West Clacton Reservoir, Essex, UK) [10] classified as Mn glass. Considering the chemical characteristics defined in the tesserae studied (Na2O ≈ 16 wt.%, CaO ≈ 7–7.5 wt.%, Al2O3 ≈ 2.5 wt.%), it is possible to hypothesize that they are Mn-glasses opacified with antimony (see paragraph: Colouring and opacifying agents).
3.2. Trace Element Concentrations
The concentrations of twenty-four trace elements, including REE, were obtained by the LA-ICP-MS method. Results are listed in Table 4 and Table 5. Each datum represents the mean value of three analyses.
Table 4.
Trace element concentrations in ppm determined by LA-CP-MS.
Table 5.
Rare Earth Element concentrations in ppm determined by LA-CP-MS.
As established by previous studies [15,18,38], variations in trace elements help to attain information on the characteristics of sands used for glass production. Generally, a low content of trace elements reflects the use of mineralogically mature sand [15]. All glass tesserae studied here have low levels of trace elements.
The diagram (Figure 6) shows that all glasses are depleted in most trace elements, indicating the use of a sand rich in quartz. Sr behaves differently, though, as Srglass/Srcrust values range from 1 to 1.3 (Figure 6). The abovementioned pattern is common in many ancient glasses [14,15]. The enrichment of Sr and the depletion of the other elements are both consistent with the use of sands with high amounts of quartz and that are poor in heavy and clay minerals, which are likely to host elements such as zirconium, thorium and the rare earth elements (REE) [15].
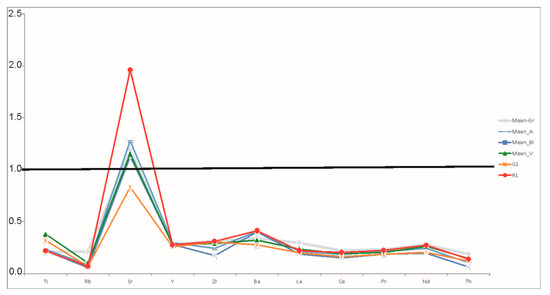
Figure 6.
Concentrations of trace elements in glass, normalized to the mean continental upper crust [39]. The mean values of trace element concentrations have been calculated, grouping tesserae by colours: grey, light blue, dark blue, green. Yellow QsG1 and red QsR1 tesserae have been plotted individually.
Considering that strontium is generally similar to calcium in its geochemical behaviour, it enters in the structure of feldspars and carbonate particles as a calcium vicariant. Therefore, the Sr enrichment can be related either to the presence of different amounts of feldspars in the sand or to the lime component used in the glass production, such as crushed shell or calcareous sand.
Colouring and Opacifying Agents
The glass samples are in different colours: grey, light blue, dark blue, shades of green, red and yellow (Figure 2; Table 1). The colouring is produced, in many cases, by the introduction of transition metals into the glassy matrix. They sometimes combine with each other in various concentrations and oxidation states of metal ions [7]. Common colourants consist of cobalt oxide (CoO) for dark blue, manganese oxide (MnO) for purple, iron oxide (FeO) for green, blue or amber and copper oxide (CuO) for turquoise, blue or green [9]. In addition, cuprite (Cu2O) crystals were used in red glasses [40].
In the green and blue tesserae studied here, copper and cobalt are the two main colouring elements identified.
In the light and dark blue glasses (QsAx and QsBlx), cobalt is the main metal responsible for the shades of blue. The Co content varies from a minimum of 190 ppm in the QsA1 tessera to a maximum of 1007 ppm in the QsBl2 one. In addition, the blue tesserae show CuO contents that can be put into correlation with the SnO2 contents.
Grey tesserae (QsGr1 and QsGr2) contain smaller amounts of copper and cobalt, when compared to the light blue tesserae (QsA1, QsA2, QsA3), which, similarly, contain smaller amounts of copper and cobalt compared to the dark blue ones (Table 4). Copper is the main colouring agent in green samples, with increasing content from the minimum value of the tessera QsV3 (CuO = 0.64 wt.%) to the maximum value (CuO = 2.48 wt.%) measured in the QsV9 sample. Therefore, the green and blue colours are probably related to the presence of copper in the glass network [35].
Considering the relationship between Cu and Sn concentrations observed in the green and blue tesserae (see the diagram CuO vs. SnO2 in Figure 7), they were probably introduced in the batch by the addition of bronze or bronze scraps during glass production, as also suggested by the copper/tin relative percentages of 98–87%: 2–13%.
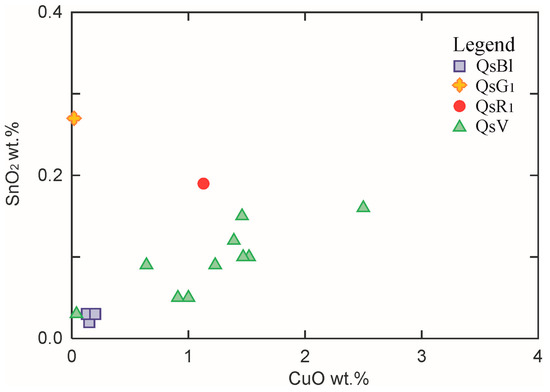
Figure 7.
Binary diagram CuO vs. Sn2O.
As for the glass opacity, all tesserae show high contents of antimony and lead that act as opacifiers. The PbO content peaks the value of 17.49 wt.% in the yellow tessera QsG1, which also shows high Sb (Sb2O5 = 2.59 wt.%) and Sn (SnO2 = 0.27 wt.%) values. The concentrations of lead, tin and antimony in the QsG1 sample are related to the presence of lead and tin antimonate microcrystals (Pb2Sb2–xSnxO7–x/2) that vary in size and shape and are homogenously distributed into the glass as detected by EPMA-WDS analyses performed on the crystalline phases dispersed into the yellow QsG1 tessera (Figure 8). Lead and antimony act not only as opacifiers but also as colourants. Lead antimonates (Pb2Sb2O7) are indeed responsible for the yellow colour [6,17,40]. During the re-melting of primary glasses, many authors have hypothesized the addition of a glass mass or corpo, containing lead antimonate as yellow opacifier to the base glass [7,9,41]. Basso et al., [7] assert that the melting of the homogeneous mixture of corpo and base glass was applied to prevent the deterioration of the pigment, the dissolution of lead oxide (PbO) and the crystallization of calcium antimonate (Ca2Sb2O7 or CaSb2O6) instead of lead antimonate (Pb2Sb2O7). As stated above, the presence of tin in green glass has been attributed to the use of bronze as a colourant. However, the very low copper quantity detected in the yellow tessera makes it possible to affirm that the process is unlikely to have happened in the QsG1 sample. Therefore, the addition of tin in the yellow tessera is not intentional but its presence can be related to the gangue of minerals used as raw materials for the preparation of the corpo [9,41].
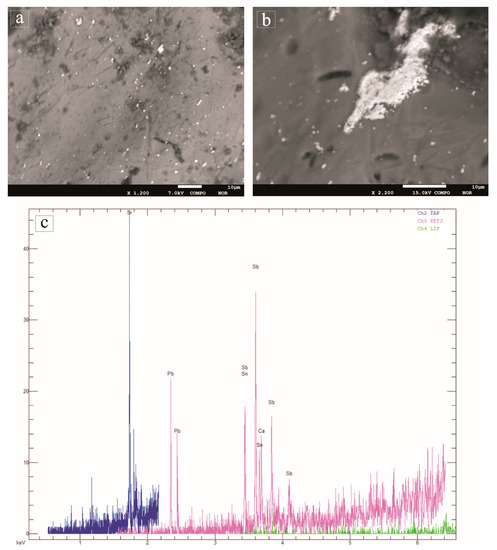
Figure 8.
(a) Backscattered electron image showing micrometric crystals of Pb-Sn-antimonate embedded in the glass matrix of the yellow QsG1 tessera; (b) detail of a Pb-Sn-antimonate micro-crystal; (c) Spectrum of Pb-Sn-antimonate by EPMA-WDS qualitative analysis.
The red tessera (QsR1) contains a considerable quantity of lead oxide (9.22 wt.%) and a copper content of 1.13 wt.%. Previous studies demonstrated that red tesserae generally contain higher levels of lead and copper, which are responsible for the colour and its opacity. Red glasses are usually coloured largely by crystals of cuprite (Cu2O), formed under reducing conditions [9,40]. Tessera QsR1 appears homogenous in its composition, except for its little copper-rich phases (Figure 9a), including copper sulphide (Figure 9b).

Figure 9.
(a) Backscattered electron image showing a micrometric crystal of copper sulphide embedded in the homogeneous glass matrix of the red QsR1 tessera; (b) Spectrum of copper sulphide by EPMA-WDS qualitative analysis.
As suggested by Paynter and Kearns [9], the mineral inclusions in the red tesserae are most likely to be the remains of gangue that was associated with the metallic ores used to produce red colour for this glass. This explanation is also confirmed by the elevated levels of titanium (TiO2 = 0.2 wt.%), lead (PbO = 9.22 wt.%), tin (SnO2 = 0.19 wt.%) and zinc (Zn = 709 ppm) measured in the QsR1 red tessera (see Table 2 and Table 4).
4. Conclusions
The chemical study of archaeological glasses provides important information about their production techniques and the raw materials used in their preparation. The results obtained studying the Four Seasons mosaic tesserae by two micro-analytical methods, EPMA-WDS and LA-ICP-MS, show that precious coloured glasses were used in the mosaic making, thus confirming the importance of the S. Aloe quarter as an archaeological area. This study allowed the collection of data about the glass tesserae production technology, both clarifying how they were coloured and increasing the information available on the glass tesserae from the S. Aloe quarter [4].
The glass samples are made of soda–lime–silica glass, produced with natron as a flux. As concerns the compositional attribution, the glass tesserae have been subdivided into two groups and an outlier. Most samples including grey, green, red and two blue and light blue tesserae show a typical Sb/Mn composition, except for the QsV8 green sample, which can be considered an outlier. On the contrary, four samples (two light blue QsA1 and QsA2, and two blue tesserae QsBl2 and QsBl3) show a base glass with chemical characteristics similar to the Mn-type, despite the high content of antimony suggesting its use as an opacifier. This result is coherent with the mosaic age, dating back between the end of the II and the beginning of the III century AD [2].
The levels of trace elements indicate the use of mature sand, rich in quartz and poor in heavy metals and clay minerals, for the production of the tesserae studied.
As concerns the colours of glass, the two main colouring elements identified during the analysis are cobalt and copper, introduced in the blue and green samples as bronze scrap. The colour of the red (QsR1) is due to the use of cuprite.
Opacifiers are all antimony-based with different natures according to their chemical compositions and colours. The microcrystals of Pb-Sn-antimonates have been detected in the yellow tesserae, testifying that they are responsible for QsG1′s typical colour [17].
Although the chemical study allowed the detection of the raw materials used to produce Roman glass tesserae employed in the Four Seasons mosaic, it has not been possible to locate the secondary production workshops where the tesserae have been coloured and opacified. Indeed, previous studies [13,14] demonstrate that, during the Roman age, glass production was limited to a small number of primary glass making centres. Then, the slab glasses were broken into chunks and distributed to secondary fabrication workshops to be re-melted, coloured and shaped. In Calabria, traces of producing leftovers and fusion attempts are the only remaining signs of a furnace in Parghelia, near Vibo Valentia, during the VI–VII century A.D. [42,43]. Therefore, it can be hypothesized that the S. Aloe glass tesserae (1) were produced in the secondary fabrication workshop of Parghelia (V.V.) operating since the I century A.D.; or (2) they were imported as exogenous material.
In both cases, these new data increase the information about the S. Aloe quarter and more generally on the Calabrian archaeological context.
Author Contributions
Data curation, N.R., M.M. and A.T.G.; Formal analysis, E.F. and N.R.; Investigation, E.F.; Resources, M.D. and F.S.; Supervision, D.B.; Writing—original draft, N.R.; Writing—review & editing, D.B. All authors have read and agreed to the published version of the manuscript.
Funding
This research received no external funding
Conflicts of Interest
The authors declare no conflict of interest.
References
- Palomba, D.; Vibo, V.B. Storia della ricerca archeologica. In BTCGI, XXI; Scuola Normale Superiore, Pisa-Ecole Francaise de Rome, Roma–Centre J. Bernard: Naples, Italy, 2012; pp. 889–900. [Google Scholar]
- Rotella, A.M. L’indagine archeologica nel quartiere romano di S. Aloe. In Hipponion Vibo Valentia Monsleonis. I Volti Della Città; Iannelli, M.T., Ed.; Laruffa: Reggio Calabria, Italy, 2014; pp. 117–134. [Google Scholar]
- Arslan, E.A. Scavi e scoperte a Vibo Valentia. In Magna Graecia, Rassegna di archeologia, Storia, Arte, Attualità; Anno VII; Pellegrini: Cosenza, Italy, 1972; n.3-4, marzo-aprile, 13. [Google Scholar]
- Barca, D.; Fiorenza, E.; D’Andrea, M.; Le Pera, E.; Musella, M.; Sudano, F.; Taliano Grasso, A. Chemical and Petrographic Characterization of Stone and Glass Tesserae in the Nereid and Geometric Mosaics from the S. Aloe Quarter in Vibo Valentia–Calabria, Italy. Minerals 2019, 9, 729. [Google Scholar] [CrossRef]
- Faedo, L. Aspetti della cultura figurativa in età romana. In Storia Della Calabria Antica. Età Italica e Romana; Settis, S., Ed.; Gangemi: Roma, Italy, 1994; p. 604. [Google Scholar]
- Barca, D.; Basso, E.; Bersani, D.; Galli, G.; Invernizzi, C.; La Russa, M.F.; Lottici, P.P.; Malagodi, M.; Ruffolo, S.A. Vitreous tesserae from the calidarium mosaics of the Villa dei Quintili, Rome. Chemical composition and production technology. Microchem. J. 2016, 124, 726–735. [Google Scholar] [CrossRef]
- Basso, E.; Invernizzi, C.; Malagodi, M.; La Russa, M.F.; Bersani, D.; Lottici, P.P. Characterization of colorants and opacifiers in roman glass mosaic tesserae through spectroscopic and spectrometric techniques. J. Raman Spectrosc. 2014, 45, 238–245. [Google Scholar] [CrossRef]
- Licenziati, F.; Calligaro, T. Study of mosaic glass tesserae from Delos, Greece using a combination of portable m-Raman and X-ray fluorescence spectrometry. J. Archaeol. Sci. Rep. 2016, 7, 640–648. [Google Scholar] [CrossRef]
- Paynter, S.; Kearns, T. West Clacton Reservoir, Great Benteley, Essex: Analysis of glass tesserae. Res. Dep. Rep. Ser. 2011, 44, 1. [Google Scholar]
- Paynter, S.; Kearns, T.; Cool, H.; Chenery, S. Roman coloured glass in the Western provinces: The glass cake and tesserae from West Clacton in England. J. Archaeol. Sci. Rep. 2015, 62, 66–81. [Google Scholar] [CrossRef]
- Tesser, E.; Verità, M.; Lazzarini, L.; Falcone, R.; Saguì, L.; Antonelli, F. Glass in imitation of exotic marbles: An analytical investigation of 2nd century AD Roman sectilia from the Gorga collection. J. Cult. Herit. 2019, 42, 202–212. [Google Scholar] [CrossRef]
- Verità, M.; Lazzarini, L.; Tesser, E.; Antonelli, F. Villa del Casale (Piazza Armerina, Sicily): Stone and glass tesserae in the baths floor mosaics. Archaeol. Anthrop. Sci. 2017, 11, 373–385. [Google Scholar] [CrossRef]
- Freestone, I.C. The Provenance of Ancient Glass through Compositional Analysis. Mater. Res. Soc. Symp. Proc. 2005, 852, OO8.1.1–OO8.1.14. [Google Scholar] [CrossRef]
- Freestone, I.C.; Gorin, R.Y.; Hughes, M.J. Primary glass from Israel and the production of glass in Late Antiquity and the Early Islamic period. In La Route Du Verre; Nenna, M.D., Ed.; MOM: Lyon, France, 2000; Volume 33, pp. 65–83. [Google Scholar]
- Freestone, I.C.; Ponting, M.; Hughes, M.J. The origins of byzantine glass from Maroni Petrera, Cyprus. Archaeometry 2002, 44, 257–272. [Google Scholar] [CrossRef]
- Maltoni, S.; Silvestri, A. Innovation and tradition in the fourth century mosaic of the Casa delle Bestie Ferite in Aquileia, Italy: Archaeometric characterisation of the glass tesserae. Archaeol. Anthrop. Sci. 2018, 10, 415–429. [Google Scholar] [CrossRef]
- Maltoni, S.; Silvestri, A. A mosaic of colors: Investigating production technologies of Roman Glass Tesserae from northeastern Italy. Minerals 2018, 8, 255. [Google Scholar] [CrossRef]
- Schibille, N.; Boschetti, C.; Valero, T.M.A.; Veron, E.; de Juan, A.J. The color palette of the mosaics in the Roman villa of Noheda (Spain). Minerals 2020, 10, 272. [Google Scholar] [CrossRef]
- Silvestri, A. The coloured glass of Iulia Felix. J. Archaeol. Sci. 2008, 35, 1489–1501. [Google Scholar] [CrossRef]
- Silvestri, A.; Molin, G.; Salviulo, G. Roman and Medieval glass from the Italian area: Bulk characterisation and relationships with production technology. Archaeometry 2005, 47, 797–816. [Google Scholar] [CrossRef]
- Silvestri, A.; Molin, G.; Salviulo, G. The colourless glass of Iulia Felix. J. Archaeol. Sci. 2008, 35, 331–341. [Google Scholar] [CrossRef]
- Brems, D.; Freestone, I.C.; Gorin-Rosen, Y.; Scott, R.; Devulder, V.; Vanhaecke, F.; Degryse, P. Characterisation of Byzantine and early Islamic primary tank furnace glass. J. Archaeol. Sci. Rep. 2018, 20, 722–735. [Google Scholar] [CrossRef]
- Gliozzo, E.; Braschi, E.; Giannetti, F.; Langone, A.; Turchiaro, M. New geochemical and isotopic insights into the Late Antique Apulian glass and the HIMT1 and HIMT2 glass productions—The glass vessels from San Giusto (Foggia, Italy) and the diagrams for provenance studies. Archaeol. Anthrop. Sci. 2019, 11, 141–170. [Google Scholar] [CrossRef]
- Jackson, C.M.; Paynter, S.A. Great big melting pot: Exploring patterns of glass supply, consumption and recycling in Roman Coppergate, York. Archaeometry 2016, 58, 68–95. [Google Scholar] [CrossRef]
- Phelps, M.; Freestone, I.; Gorin-Rosen, Y.; Gratuze, B. Natron glass production and supply in the late antique and early medieval Near East: The effect of the Byzantine-Islamic transition. J. Archaeol. Sci. 2016, 75, 57–71. [Google Scholar] [CrossRef]
- Schibille, N.; Sterrett-Krause, A.; Freestone, I.C. Glass groups, glass supply and recycling in late Roman Carthage. Archaeol. Anthrop. Sci. 2017, 9, 1223–1241. [Google Scholar] [CrossRef]
- Gunther, D.; Heinrich, C.A. Enhanced sensitivity in laser ablation-ICP mass spectrometry using helium-argon mixtures as aerosol carrier. J. Anal. At. Spectrom. 1999, 14, 1363–1368. [Google Scholar] [CrossRef]
- Barca, D.; Abate, M.; Crisci, G.M.; De Presbiteris, D. Post-Medieval glass from the castle of Cosenza, Italy: Chemical characterization by LA-ICP-MS and SEM-EDS. Per. Min. 2009, 78, 49–64, ISSN: 0369-8963. [Google Scholar] [CrossRef]
- Barca, D.; Lucarini, G.; Fedele, F. Provenance of obsidian artefacts from the WāDī ATH- THAYYILAH 3 Neolithic site (eastern Yemen plateau) by LA-ICP-MS. Archaeometry 2012, 54, 603–622. [Google Scholar] [CrossRef]
- Fryer, B.J.; Jackson, S.E.; Longerich, H.P. The design, operation and role of the laser-ablation microprobe coupled with an inductively coupled plasma-mass spectrometer (LAM-ICP-MS) in the Earth sciences. Can. Mineral. 1995, 33, 303–312. [Google Scholar]
- Gao, S.; Liu, X.; Yuan, H.; Hattendorf, B.; Gunther, D.; Chen, L.; Hu, S. Determination of forty-two major and trace elements in USGS and NIST SRM glasses by laser ablation-inductively coupled plasma mass spectrometry. Geostandards Newsl: J. Geostandards Geoanalysis 2002, 26, 181–196. [Google Scholar] [CrossRef]
- Barca, D.; Papparella, F.C. Chemical characterization of vitreous finds from Cosenza cathedral (Calabria–Italy) by the combined use of analytical techniques. Open Archaeol. 2020, 6, 63–85. [Google Scholar] [CrossRef]
- Lilyquist, C.; Brill, R.H. Studies in Early Egyptian Glass; Metropolitan Museum of Art: New York, NY, USA, 1993; ISBN 978-0300200195. [Google Scholar]
- Silvestri, A.; Tonietto, S.; Molin, G.; Guerriero, P. The paleo-Christian glass mosaic of St. Prosdocimus (Padova, Italy): Archaeometric characterisation of tesserae with copper–or tin-based opacifiers. J. Archaeol. Sci. 2014, 42, 51–67. [Google Scholar] [CrossRef]
- Barbera, G.; Barone, G.; Crupi, V.; Longo, F.; Majolino, D.; Mazzoleni, P.; Venuti, V. Study of Late Roman and Byzantine glass by the combined use of analytical techniques. J. Non-Cryst. Solids 2012, 358, 1554–1561. [Google Scholar] [CrossRef]
- Huisman, D.J.; Pols, S.; Joosten, I.; van Os, B.J.H.; Smit, A. Degradation processes in colourless Roman glass: Cases from the Bocholtz burial. J. Archaeol. Sci 2008, 35, 398–411. [Google Scholar] [CrossRef]
- Silvestri, A.; Molin, G.; Salviulo, G. Archaeological glass alteration products in marine and land-based environments: Morphological, chemical and microtextural characterization. J. Non-Cryst. Solids 2005, 351, 1338–1349. [Google Scholar] [CrossRef]
- Hellemans, K.; Cagno, S.; Bogana, L.; Janssens, K.; Mendera, M. LA-ICP-MS labels early medieval Tuscan finds from Siena and Donoratico s late natron glass. J. Archaeol. Sci. Rep. 2019, 23, 844–853. [Google Scholar] [CrossRef]
- McLennan, S.M. Relationships between the trace element composition of sedimentary rocks and upper continental crust. Geochem. Geophys. Geosyst. 2001, 2000GC000109, 1525–2027. [Google Scholar] [CrossRef]
- Van der Werf, I.; Mangone, A.; Giannossa, L.C.; Traini, A.; Laviano, R.; Coralini, A.; Sabbatini, L. Archaeometric investigation of Roman tesserae from Herculaneum (Italy) by the combined use of complementary micro-destructive analytical techniques. J. Archaeol. Sci. 2009, 36, 2625–2634. [Google Scholar] [CrossRef]
- Lahlil, S.; Biron, I.; Galoisy, L.; Morin, G. Rediscovering ancient glass technologies through the examination of opacifier crystals. Appl. Phys. A Mater. 2008, 92, 109–116. [Google Scholar] [CrossRef]
- Bruno, G.A. Contrada Crivo di Parghelia (VV): Indizi di produzione vetraria. In II Vetro in Calabria Contributo per Una Carta di Distribuzione in Italia; Coscarella, A., Ed.; Rubettino: Soveria Mannelli (CZ), Italy, 2003; Volume I, pp. 257–270. [Google Scholar]
- Fiorillo, R. Le vetrate dipinte della Santissima Tinità de Mileto Vecchia (VV) in Calabria: Tradizione romano-bizantina o innovazione normanna. In II Vetro in Calabria Contributo Per Una Carta di Distribuzione in Italia; Coscarella, A., Ed.; Rubettino: Soveria Mannelli (CZ), Italy, 2003; Volume I, pp. 245–256. [Google Scholar]
© 2020 by the authors. Licensee MDPI, Basel, Switzerland. This article is an open access article distributed under the terms and conditions of the Creative Commons Attribution (CC BY) license (http://creativecommons.org/licenses/by/4.0/).