Next Article in Journal
Geochemical Data and Fluid Inclusion Study of the Middle Miocene Halite from Deep Borehole Huwniki-1, Situated in the Inner Zone of the Carpathian Foredeep in Poland
Next Article in Special Issue
Evolution of Pyrite Compositions at the Sizhuang Gold Deposit, Jiaodong Peninsula, Eastern China: Implications for the Genesis of Jiaodong-Type Orogenic Gold Mineralization
Previous Article in Journal
A Framework for Evaluating Variation in (U-Th)/He Datasets
 
 
Erratum published on 20 May 2021, see Minerals 2021, 11(5), 543.
Article

Ore Mineralogy, Trace Element Geochemistry and Geochronological Constraints at the Mollehuaca and San Juan de Chorunga Au-Ag Vein Deposits in the Nazca-Ocoña Metallogenic Belt, Arequipa, Peru

1
Department of Mining Engineering, Colorado School of Mines, Golden, CO 80401, USA
2
Department of Geology and Geological Engineering, Colorado School of Mines, Golden, CO 80401, USA
3
Department of Geology, Geophysics and Mining, Universidad Nacional de San Agustín, Av. Independencia and Paucarpata Street S/N, Arequipa 04001, Peru
4
Faculty of Process Engineering, Department of Metallurgical Engineering, Universidad Nacional de San Agustín, Av. Independencia S/N, Arequipa 04001, Peru
*
Author to whom correspondence should be addressed.
Minerals 2020, 10(12), 1112; https://doi.org/10.3390/min10121112
Submission received: 29 October 2020 / Revised: 1 December 2020 / Accepted: 8 December 2020 / Published: 11 December 2020

Abstract

:
The Mollehuaca and San Juan de Chorunga deposits are hosted in the poorly explored gold and copper trends of the Nazca-Ocoña metallogenic belt in Arequipa, Perú, which extends from Trujillo (9 °S) to Nazca-Ocoña (14 °S). The aim of this study is to characterize the age, occurrence, and distribution of quartz vein-hosted Au-Ag mineralization and associated trace elements (e.g., Hg, Pb, Cu, Zn, and Bi) in these deposits. Here, we present geological mapping, geochemical whole rock inductively coupled plasma (ICP)-MS data of the veins, petrographic observations, backscattered electron images, quantitative SEM-based automated mineralogy, and electron microprobe analyses (EMPA). Despite the fact that there are numerous small-scale gold mines in the Nazca-Ocoña metallogenic belt, there have been few studies that document the origin and geological evolution of these deposits or the implications for decision-making in exploration, metallurgical processing, and environmental management. In this research, we document the host rock age of the mineralized veins (129.2 ± 1.0 Ma; U-Pb in zircon), the mineralization age (95.86 ± 0.05 Ma; 40Ar/39Ar in secondary biotite), the occurrence and distribution of Au-Ag in the veins, the mineral zonation present in the vein system, and the zircon geochemistry, in order to provide tools for natural resource management in the metallogenic belt.

1. Introduction

The Nazca-Ocoña metallogenic belt of southwestern Perú hosts numerous gold deposits, many of which are mostly exploited by small-scale methods, but little has been published on the characteristics of the deposits or the host rocks.
Artisanal and small-scale gold mining is widespread in Peru where more than 200,000 people rely directly or indirectly on this activity [1]. In Arequipa, small-scale mining activities occur in several areas, where miners and communities are exposed to adverse environmental and safety conditions due to the current mining and mineral processing techniques [2,3]. Artisanal miners follow the ore-bearing veins, adjusting their mining and processing techniques based on their findings. There are few publications available that describe on the origin and occurrence of the mineral deposits in the Nazca-Ocoña belt in southern Peru [4,5,6], although small-scale gold mining is the main economic activity there.
This contribution presents case study data from two deposits in the Arequipa region, Mollehuaca (Virucha Capitana, Zorritos-Sacred Heart of Jesus, Zorritos-San Juan, and Virucha-San Aurelio sectors) and San Juan de Chorunga (Mercedes and San Juan veins) (Figure 1). The goals of this study are to (I) define the ages of the host rocks and alteration, and (II) characterize the occurrence and distribution of mineralization and associated trace element geochemistry. We conducted U-Pb dating of zircon in the host rock, zircon geochemistry, 40Ar/39Ar dating of biotite alteration, whole rock geochemistry of the veins, petrography of the ore and gangue minerals, as well as scanning electron microscopy (SEM) and electron microprobe (EMP) analyses of gold, electrum, and sulfides (e.g., pyrite, chalcopyrite, galena, and sphalerite) in the veins. These data are of fundamental importance to the development of more effective strategies for exploration, mineral processing, and environmental management of these sites, as well as metallogenic belts hosting similar deposits elsewhere in the world. Moreover, this information is of fundamental importance to determine the geometallurgical characteristics of the ore.

2. Geological Setting

Previous regional studies reported that the Mollehuaca and San Juan de Chorunga deposits are part of a metallogenic belt hosting a number of Au-Pb-Zn-Cu-Ag deposits spatially related to Cretaceous intrusive rocks, extending from Trujillo (9 °S) to Nazca-Ocoña (14 °S) [4,5,6]. In the Nazca-Ocoña corridor, mineralized structures are controlled by faults with NW-SE, N-S, and W-E orientations, [6]. San Juan de Chorunga is one of the larger known mineral deposits in this belt with approximately 1 Moz in reserves [7].
The basement in the region is composed of the Late Paleozoic to Jurassic rocks of the Yamayo Group and the Yura Group [8]. The Yamayo Group consists of a sedimentary succession of thickness varying from 0 to 2 km, which is 402 to 216 Ma in age (U-Pb detrital zircon; [8]). The overlying Yura Group consists of a lower, 1 to 6 km thick volcanic and volcaniclastic unit called the Chocolate Formation, which is ~215 to 125 Ma (U-Pb zircon; [8]), and an overlying 1 to 2 km thick sedimentary succession. The magmatic history of the Peruvian margin has been widely discussed by Boekhout et al. (2013) and references therein.
The intrusive rocks form an elongated belt that extends throughout the coastal region of Perú [9]. The coastal batholith is 1600 km from north to south and averages over 65 km across [10], with zircon U-Pb ages ranging from 138 to 37 Ma [11]. The Nazca-Ocoña belt belongs to the Coastal Batholith of the Arequipa segment, which is constituted by five super units [12]. The batholith was divided into three major segments [12]: the Trujillo segment in the north, the central Lima segment, and the southern Arequipa segment. In the Arequipa segment, the intrusive rocks are predominantly granodiorite and monzonite, with some gabbro [13]. Prior to our study, the ore deposits in the region were thought to be restricted to intrusions of Late Cretaceous age [5,6]. Within the intrusions, gold occurs in NW-SE, N-S, and W-E trending quartz-calcite veins, which are 10 to 80 cm wide.
The Nazca-Ocoña belt has a large number of deposits that have been recognized. Among them, Misky, San Cristobal, Chaparra, San Luis, and Santa Filomena have been studied by Alfonso et al. (2019) (Figure 1). This study was performed in two mine sites from the Arequipa region, Mollehuaca and San Juan de Chorunga.
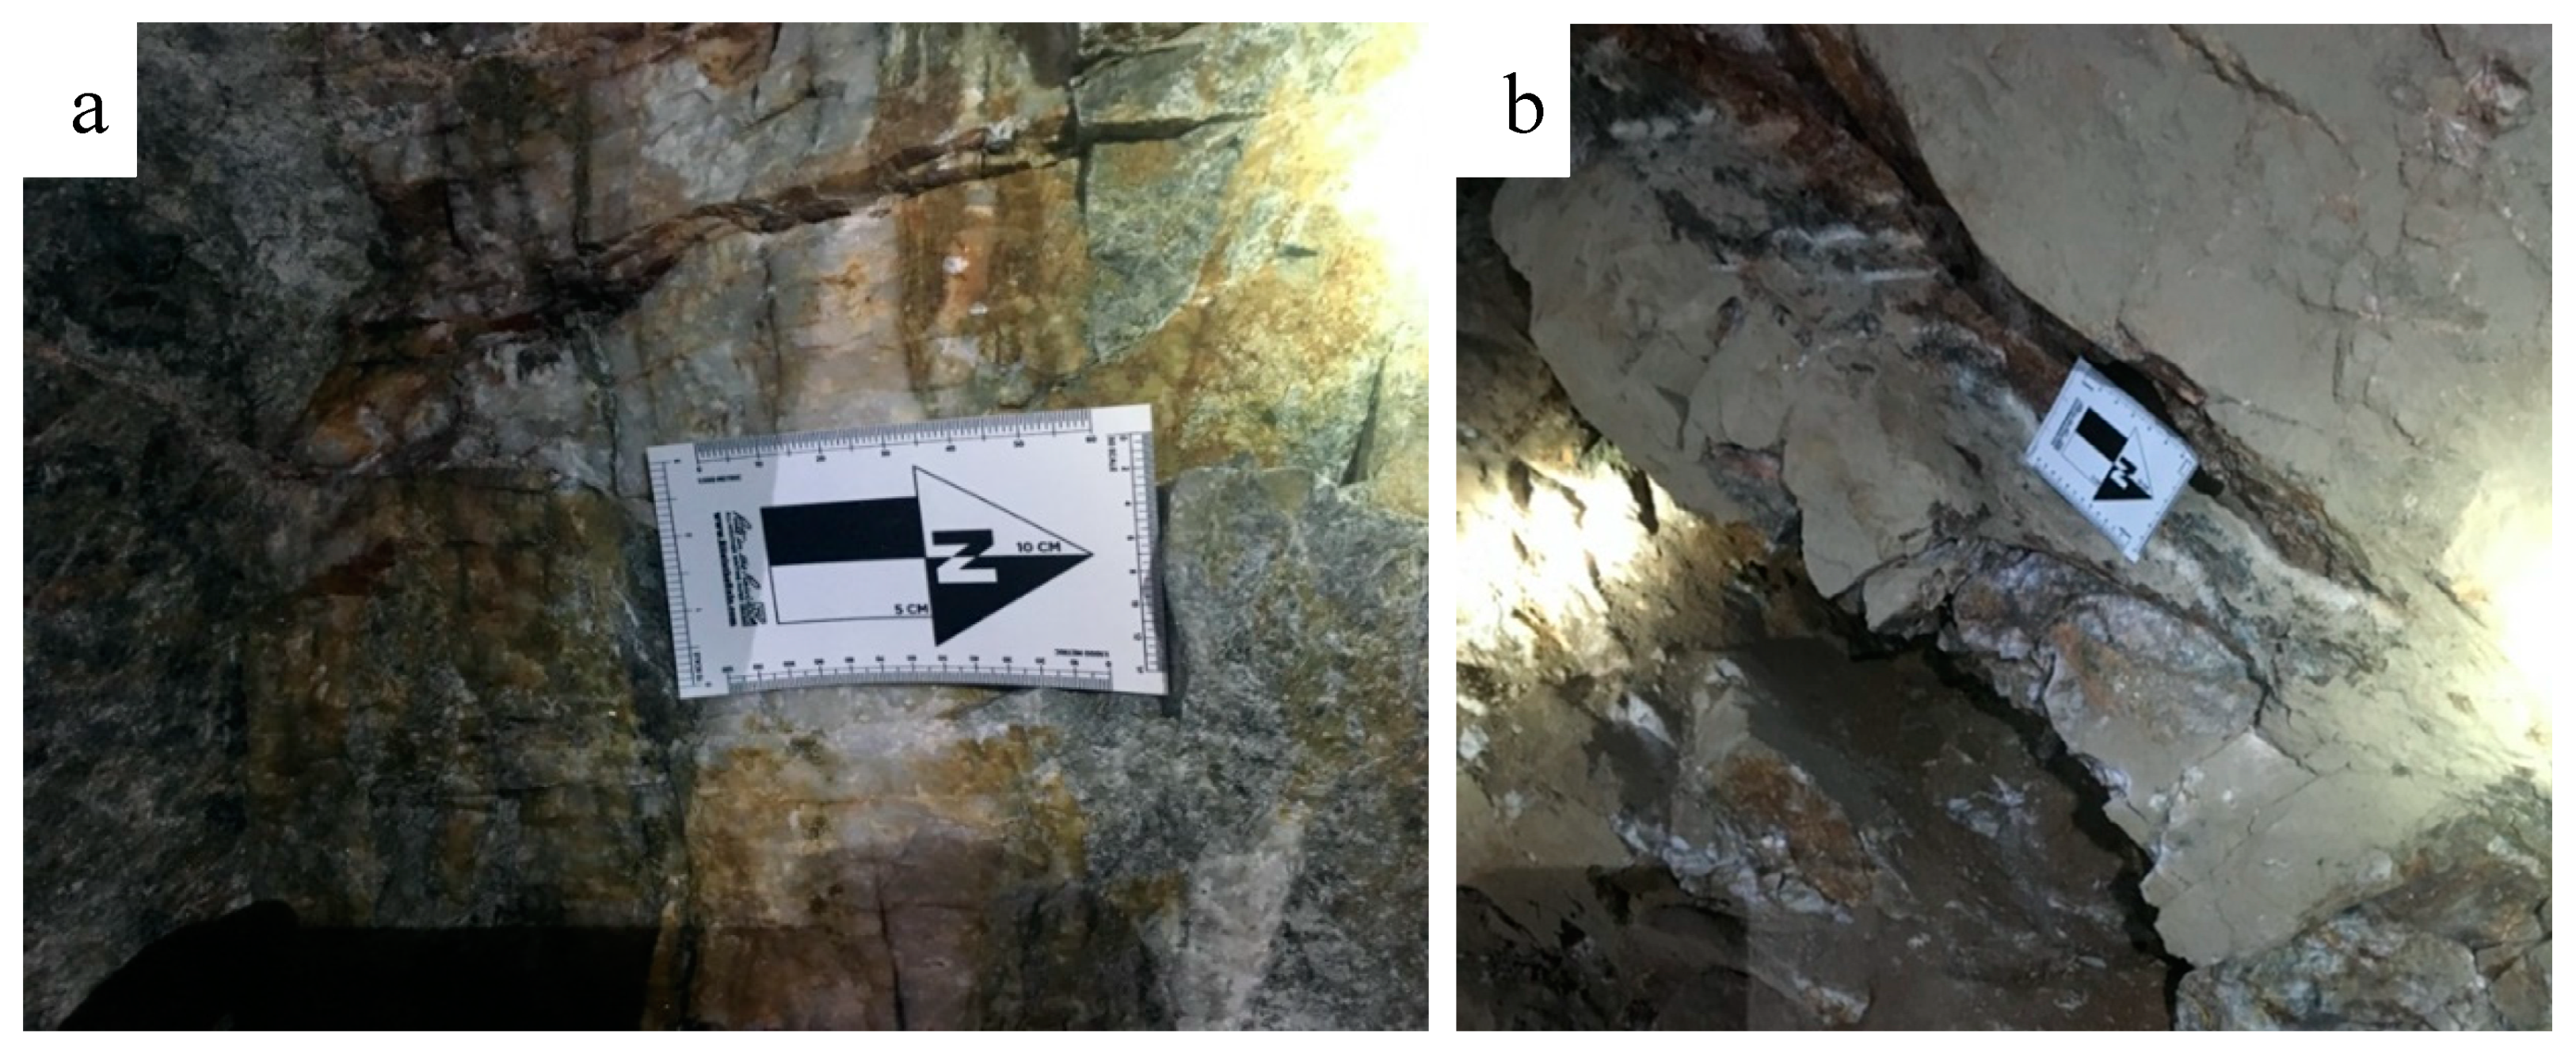
San Juan de Chorunga is located in the Rio Grande district, Condesuyo province, Arequipa department (Figure 1), where the Mercedes and San Juan veins are exploited by Century Mining Company Perú SAC. The veins are hosted by intrusions of granodioritic to dioritic composition (Figure 2A), which have themselves been intruded by andesitic dikes. The andesitic dikes range from 8 to 12 m thickness and are spatially associated with mineralization. In San Juan de Chorunga, there are three main emplacement orientations of the veins: NW-SE, NE-SW, and EW, all with a dip of 65 to 80° N dip. In San Juan de Chorunga, the Mercedes and San Juan veins are exploited by underground mining activities, using drill and blast methods, with extraction levels every 50 m, and ventilation shafts every 60 m from level to level. The mineral extraction is carried out with winches to the chute where the mineral is then extracted with a locomotive, then taken to the sites destined for its lifting by the main shaft. The gold recovery begins by crushing the mineralized material, followed by gravimetric concentration to obtain free gold. The material that does not contain free gold passes to the flotation concentration system, and then to a cyanidation process by stirring with charcoal in the pulp. Finally, the carbon with gold content passes through an electrolytic cell where Au and Ag cement is recovered, which is filtered and dried to later go to the smelting process.
Mollehuaca is located in the Huanu-Huanu district, Caravelí province in the Arequipa region, and is being mined at the Virucha, Capitana, Sagrado Corazón de Jesús, San Juan, and San Aurelio operations (Figure 1). The deposit is hosted in the coastal batholith, within a granodiorite of previously unknown age. The mineralized structures have an N40° E orientation and a 70° NW dip. The veins are 10 to 70 cm wide with extremely variable Au grades (Figure 2B). The mining activities in Mollehuaca are characteristic of small-scale mining in Perú, including mine development using conventional drill and blast methods, followed by transportation to a processing facility. Gold recovery is accomplished via crushing, mercury amalgamation, and separation of the mercury from gold through volatilization.

3. Samples and Methods

In order to define the characteristics of the mineralization and its associated trace element geochemistry at Mollehuaca and San Juan de Chorunga, we conducted geologic mapping of the veins and host rocks (from the surface and at 500 m depth). We sampled the quartz-calcite veins and wall rock at a range of depths for Mollehuaca from 2240 to 1712 m a.s.l., and San Juan de Chorunga from 974 to 480 m a.s.l. A total of 19 rock samples were collected, 11 from Mollehuaca and 8 from San Juan de Chorunga. Chip sampling of the veins was conducted to ensure representativity of the vein material.
From these samples, a total of thirteen polished thin sections (30 µm) were prepared for mineralogical characterization using polarized and reflected-light microscopy, field emission-scanning electron microscopy (FE-SEM), and quantitative mineralogical analysis using the SEM-based TESCAN integrated mineral analyzer (TIMA). The chemical composition of selected Au-bearing minerals and sulfides were determined by electron microprobe (EMP) analysis. Two samples were collected in Mollehuaca for geochronology, one for U-Pb dating of the wall rock, and one for 40Ar/39Ar dating of biotite alteration in the vein.
In the following paragraphs, we summarize the analytical methods.

3.1. Petrography

Mineralogical characterization was performed in the optical microscopy laboratory in the Department of Mining Engineering at the Colorado School of Mines, using an optical ZEISS-AXI0 microscope. Images were obtained using the software ZEN lite.

3.2. Whole-Rock Geochemistry of the Veins and Statistical Analysis

Four samples from Mollehuaca and two samples from San Juan de Chorunga were sent to Actlabs laboratories in Canada. Gold, platinum, and palladium were analyzed by fire assay ICP-OES, and the rest of the elements were analyzed by Aqua Regia digestion ICP-MS ultratrace 1 analysis.
The statistical analysis was performed using the ioGASTM 6.2 software.

3.3. Scanning Electron Microscopy

Au-bearing minerals and sulfides (pyrite, chalcopyrite, arsenopyrite, galena, sphalerite, and Bi-bearing minerals) were inspected using a combination of conventional and field–emission scanning electron microscopy techniques. A scanning electron microscope was utilized to identify Au occurrences, their characteristics, and associations with other minerals and elements. The FE-SEM observations were carried out in the Mineral and Materials Characterization Facility in the Department of Geology and Geological Engineering, Colorado School of Mines, using a TESCAN MIRA3 LMH Schottky field emission-scanning electron microscope equipped with a secondary electron (SE), backscattered electron (BSE), and a Bruker XFlash® 6/30 silicon drift detector for energy-dispersive spectrometry (EDS).
The analyses were carried out with an accelerating voltage of 15 or 20 kV, respectively, an absorption current of 268 pA, a working distance of 10 mm, and a spot size of 52 nm. Semi-quantitative EDS spot analysis was used to perform a preliminary chemical assessment of mineral phases and inclusions.

3.4. Electron Microprobe Analysis

Au-bearing minerals, as well as its possible host minerals (pyrite, arsenopyrite, galena, sphalerite, chalcopyrite, and bismuth-bearing minerals), were analyzed using an electron microprobe (EMP) to determine the contents of the major, minor, and trace elements.
Major and minor element were determined using a JEOL 8900 Superprobe at the Denver Microbeam Laboratory at the United States Geological Survey (USGS). The JEOL superprobe 8900 has 5 automated wavelength dispersive spectrometers. The operating accelerating voltage was 20 kV, with a beam current of 50 nA. The beam diameter was ~1 µm.
Operating conditions included an accelerating voltage of 20 kV, a beam current of 50 nA, and a beam diameter of ~1 µm. Counting time was 60 s for Mn, Fe, Co, Ni, Cu, Zn, As, Se, In, Sn, Sb, S, Cd, Te, Bi, Ag, Hg, Tl, Pb, and 120 s for Au. The arrangement of the crystals and the elements were LIF (Mn, Fe, Co, Ni), TAP (Cu, Zn, As, Se), PETH (In, Sn, Sb, Au), and PETJ (S, Cd, Te, Bi, Ag, Hg, Tl, Pb). Standard specimens used for calibration were Mn0 (for Mn), CuFeS2 (for Cu, Fe and S), Co0 (for Co), Ni0 (for Ni), ZnS (for Zn), GaAs (for As), Se0 (for Se), InP (for In), Tin (for Sn), Au 73 and 94 (for Au), CdS (for Cd), HgTe (for Te), Bi0 (for Bi), Au 73 (for Ag), HgS (for Hg), TlBr (for Tl), and PbS (Pb). Wavelength-dispersive spectrometry (WDS) X-ray maps were acquired using the calibration set up described above.

3.5. Geochronological Analysis

One sample from the wall rock at Mollehuaca was selected for zircon U-Pb geochronology, which was conducted at the Isotopic Geology Laboratory at Boise State University, Idaho. Zircon grains were separated from rocks using standard techniques, annealed at 900 °C for 60 h in a muffle furnace, and mounted in epoxy and polished until their centers were exposed. Cathodoluminescence (CL) images were obtained with a JEOL JSM-300 scanning electron microscope and Gatan MiniCL. Zircon was analyzed by laser ablation inductively coupled plasma mass spectrometry (LA-ICPMS) using a ThermoElectron X-Series II quadrupole ICPMS and New Wave Research UP-213 Nd:YAG UV (213 nm) laser ablation system. In-house analytical protocols, standard materials, and data reduction software were used for the acquisition and calibration of U-Pb dates and a suite of high field strength elements (HFSE) and rare earth elements (REE). Zircon was ablated with a laser spot of 25 µm wide using fluence and pulse rates of 5 J/cm2 and 5 Hz, respectively, during a 45 s analysis (15 s gas blank, 30 s ablation) that excavated a pit ~25 µm deep. Ablated material was carried by a 1.2 L/min He gas stream to the nebulizer flow of the plasma. Dwell times were 5 ms for Si and Zr, 200 ms for 49Ti and 207Pb, 80 ms for 206Pb, 40 ms for 202Hg, 204Pb, 208Pb, 232Th, and 238U and 10 ms for all other HFSE and REE. Background count rates for each analysis were obtained prior to each spot analysis and subtracted from the raw count rate for each analysis. Ablations pits that appear to have intersected glass or mineral inclusions were identified based on Ti and P. U-Pb dates from these analyses are considered valid if the U-Pb ratios appear to have been unaffected by the inclusions. Analyses that appear contaminated by common Pb were rejected based on 204Pb being above the baseline. For concentration calculations, background-subtracted count rates for each analysis were internally normalized to 29Si and calibrated with respect to NIST SRM-610 and -612 glasses as the primary standards. The temperature was calculated from the Ti-in-zircon thermometer [14]. Because there are no constraints on the activity of TiO2, an average value in crustal rocks of 0.8 was used.
One representative sample of secondary biotite was selected from the wall rock hosting the Mollehuaca quartz vein. The biotite sample was dated using 40Ar/39Ar geochronology at the New Mexico Bureau of Geology and Mineral Resources, New Mexico [15].
Biotite for 40Ar/39Ar analysis were concentrate with a magnetic separator followed by heavy liquids. Final biotite was handpicked for maximum purity. The sample was irradiated at the Nuclear Science Center reactor at Texas A&M University for around 7 to 14 h [15]. The New Mexico Geological Resource Laboratory (NMGRL) argon extraction line has both a double vacuum Molybdenum resistance furnace and a CO2 laser to heat samples. Biotite was heated in a molybdenum resistance furnace. Extracted gases were purified with SAES GP-50 getters. Argon was analyzed with a Mass Analyzer Products (MAP) model 215-50 mass spectrometer operated in static mode. 40Ar/39Ar ages were determined by the age spectrum (plateau).

4. Petrography

4.1. Host Rock

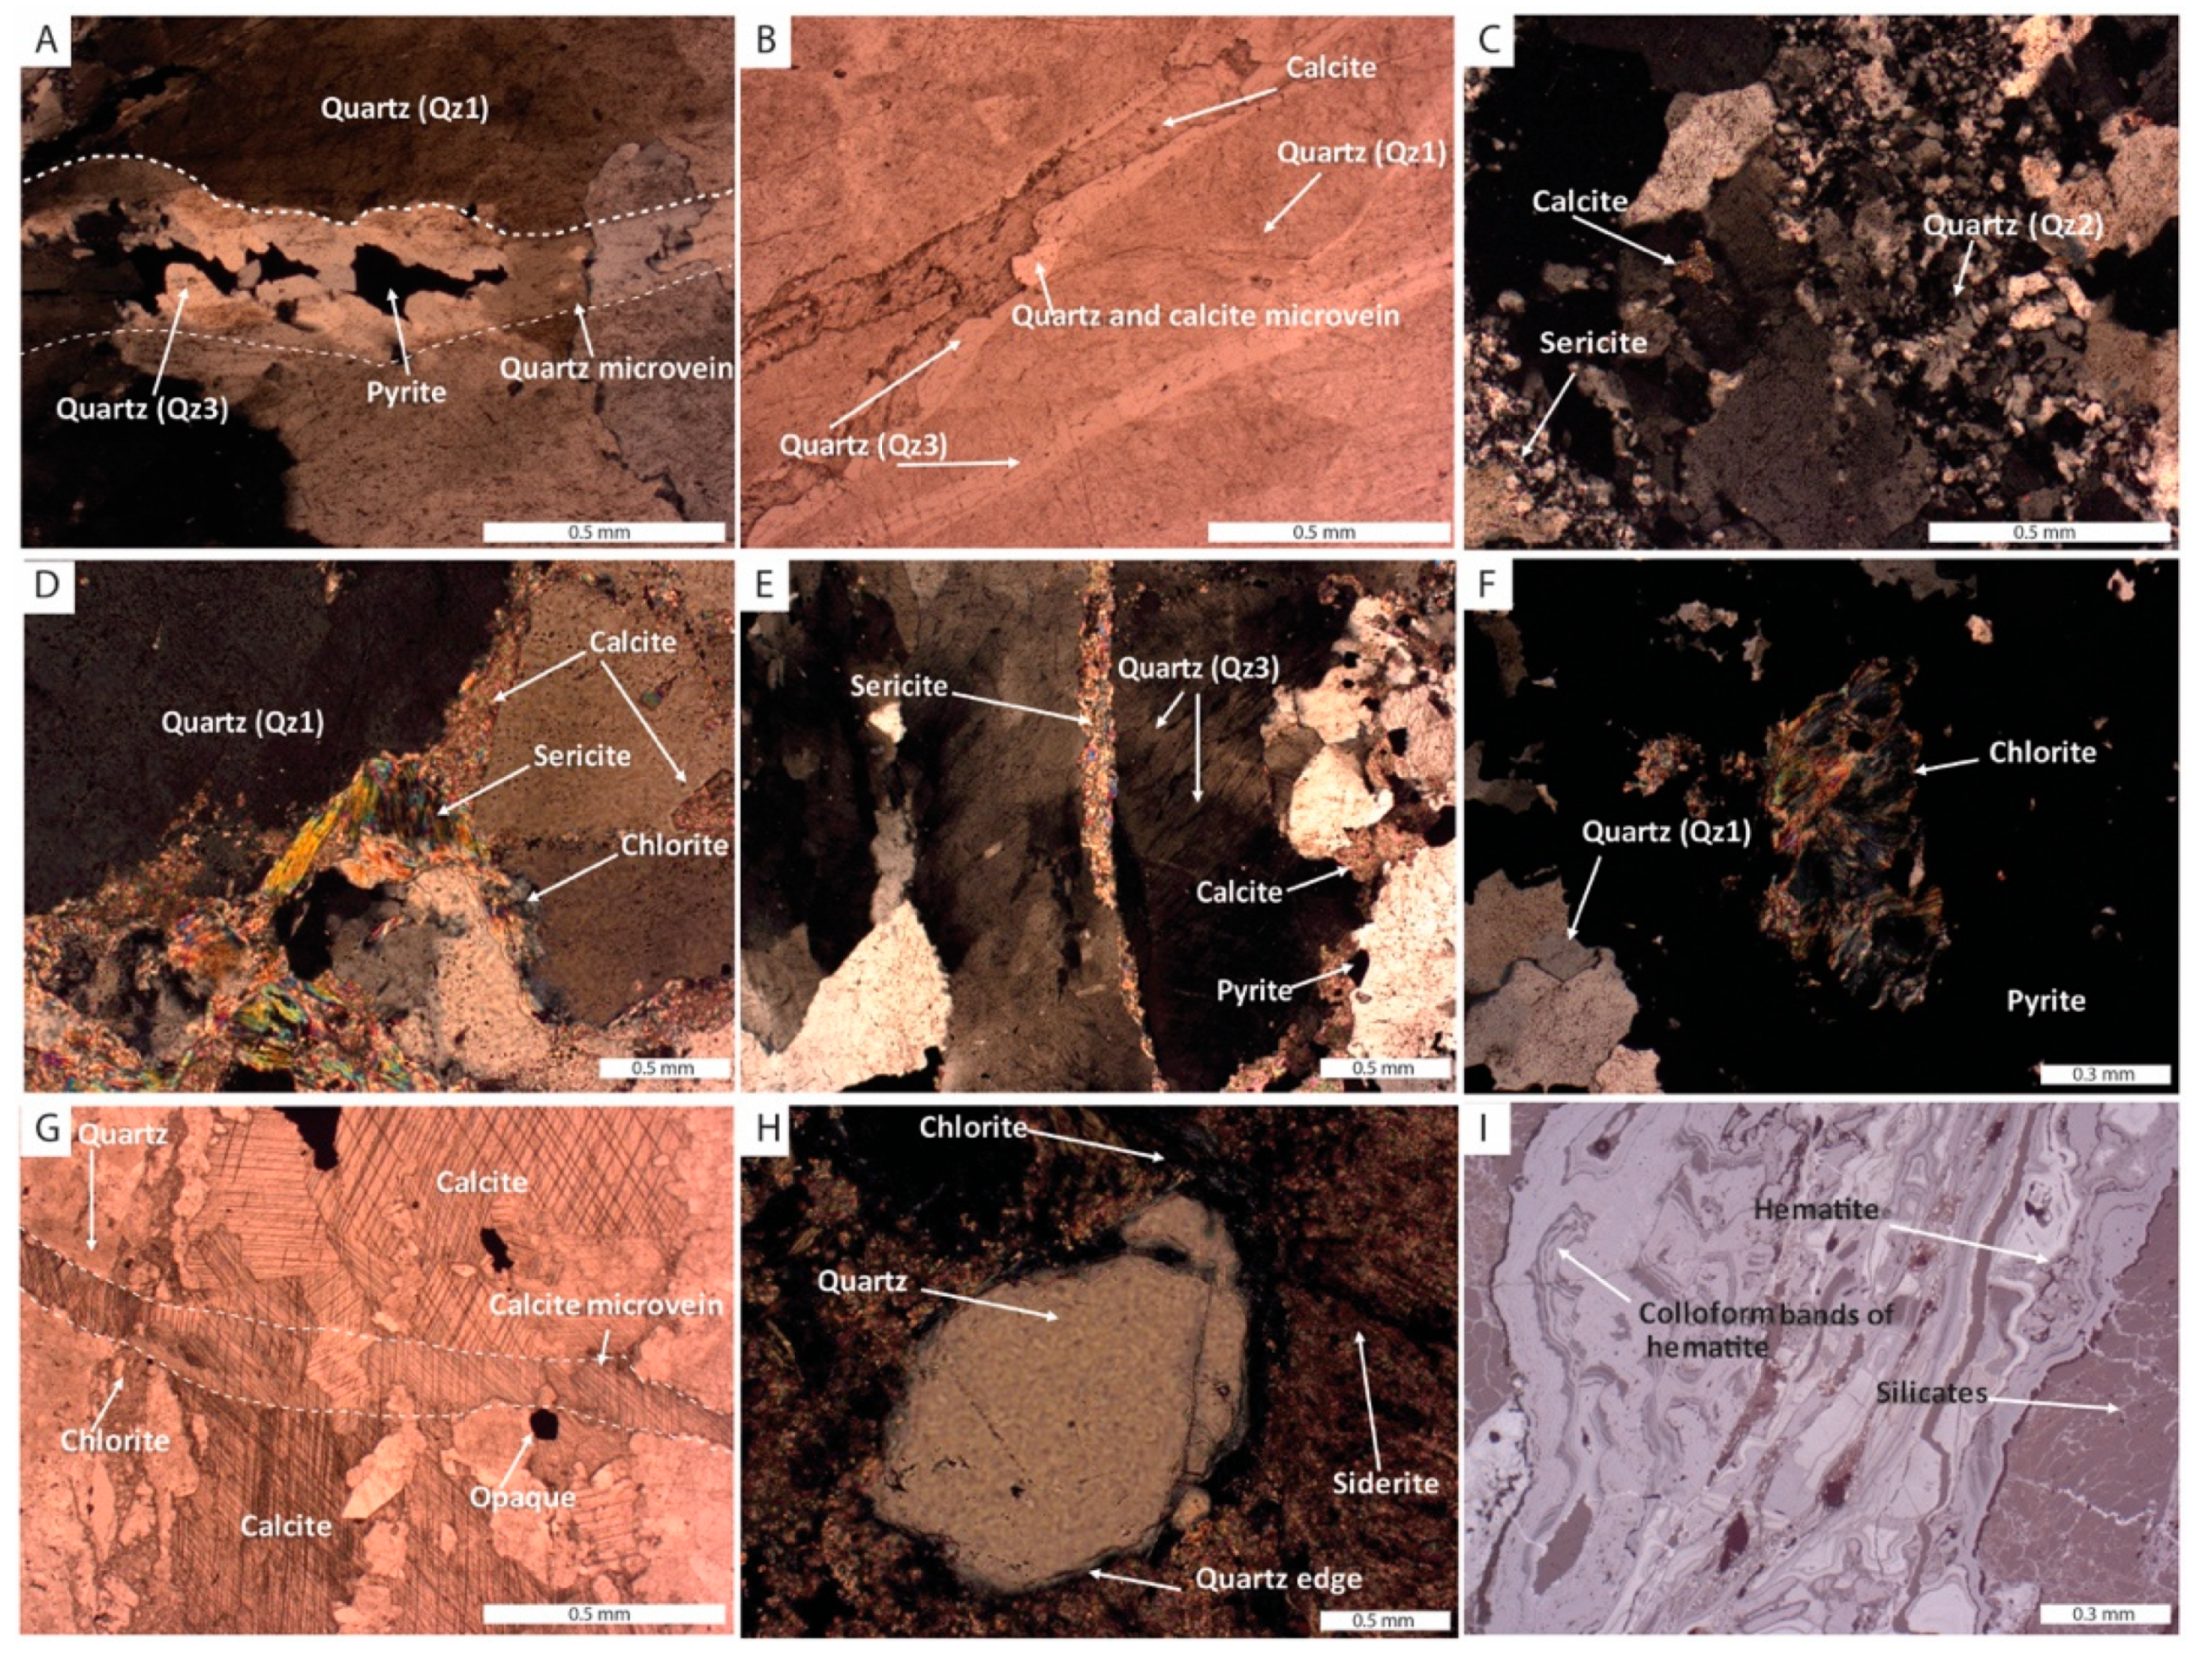
At both deposits, the veins are hosted in granodiorite with a phaneritic texture (Figure 3A), which is mainly composed of anhedral plagioclase, quartz, biotite, and scarce amphiboles (Figure 3B). Opaque minerals are magnetite (the rocks are mildly to moderately magnetic), ilmenite, and chalcopyrite, which are spatially associated with biotite and amphibole.
In the wall rock up to 10 cm from the vein margins, plagioclase is weakly to moderately sericitically altered. Sericite size is less than 150 µm and it is present as subhedral to anhedral crystals, some with elongated tabular shapes. It occurs in microveins and in the alteration halos of calcite microveins (Figure 4C–E). In some instances, the sericite fills fractures in opaque minerals.
Mafic minerals such as amphiboles and biotite in the contact zone between the quartz veins and the wall rock are chloritized; the chlorite crystals are smaller than 350 µm. Chlorite is present as anhedral crystals, as well as in the alteration halos of calcite microveins (Figure 4D), and filling fractures in opaque minerals (pyrite) (Figure 4F).
Primary biotite from the wall rock in the contact between the vein was altered to secondary biotite. Secondary biotite presents elongated tabular crystals, with sizes smaller than 100 µm. The secondary biotite occurs in association with quartz, where micro- to nano-particles of free Au were identified within the quartz grains. Secondary biotite occurs as filling of microveins at grain boundaries between feldspar and quartz.

4.2. Quartz Veins

Through optical microscopy observations, we determined that the veins are composed of quartz, calcite, chlorite, sericite, and sulfide minerals. The sulfide minerals are dominantly pyrite, with lesser galena, sphalerite, chalcopyrite, and Bi-bearing minerals (see Section 4.2).
Calcite is one of the dominant gangue minerals in the shallower portions of the veins, from 50 to 100 m below surface in San Juan de Chorunga, and from 40 to 150 m below surface in Mollehuaca. Calcite occurs as subhedral to anhedral crystals less than 2.6 mm. It is found filling cracks in the late quartz, as well as massively in rhombic texture (Figure 4B–E,G). Some narrow ~700 µm thick calcite veins are found crosscutting the main vein (Figure 4B,G). Calcite, chlorite, and sericite can also be found filling open spaces between quartz grains (Figure 4D).
In the deeper portions of the veins, 100 m below surface, quartz is the dominant gangue mineral. Three different types of quartz occur in the veins, distinguishable by their texture, grain size, occurrence and mineral association (Figure 4A–C,E,H). Quartz has bull quartz (quartz type 1) (Figure 4A,B,D,F,G), granular (quartz type 2) (Figure 4C), and crustiform textures (quartz type 3) (Figure 4A,B,E). Bull quartz occurs as subhedral to euhedral crystals and is the main mineral forming of the vein, with sizes greater than 4 mm. Granular quartz crystals are smaller than 2.5 mm and occur in unmineralized portions of the veins. Crustiform quartz crystals are less than 1.5 mm and occur in the walls of the late quartz microveins, and have sulfide central suture (Figure 4A). Late quartz microveins cut the two types of quartz above (Figure 4A,B) and are spatially related with calcite in the mineralized portions of the veins. In the oxide zone, quartz shows dissolution at the grain boundary and colloform bands of hematite (Figure 4H,I). Sulfide minerals are mainly pyrite, with lesser galena, sphalerite, chalcopyrite, and Bi-bearing minerals.
At both localities, rocks from the oxide zone are strongly altered, as indicated by the presence of iron oxyhydroxides (hematite, limonite), as well as oxidized copper ores (malachite and azurite). The iron oxyhydroxides display a variety of textures including colloform, breccia, replacement, and globular (Figure 4I). The depths of the oxidation zone vary from the surface to 150–200 m below surface.

4.3. Ore Minerals

4.3.1. Au-Ag Bearing Minerals

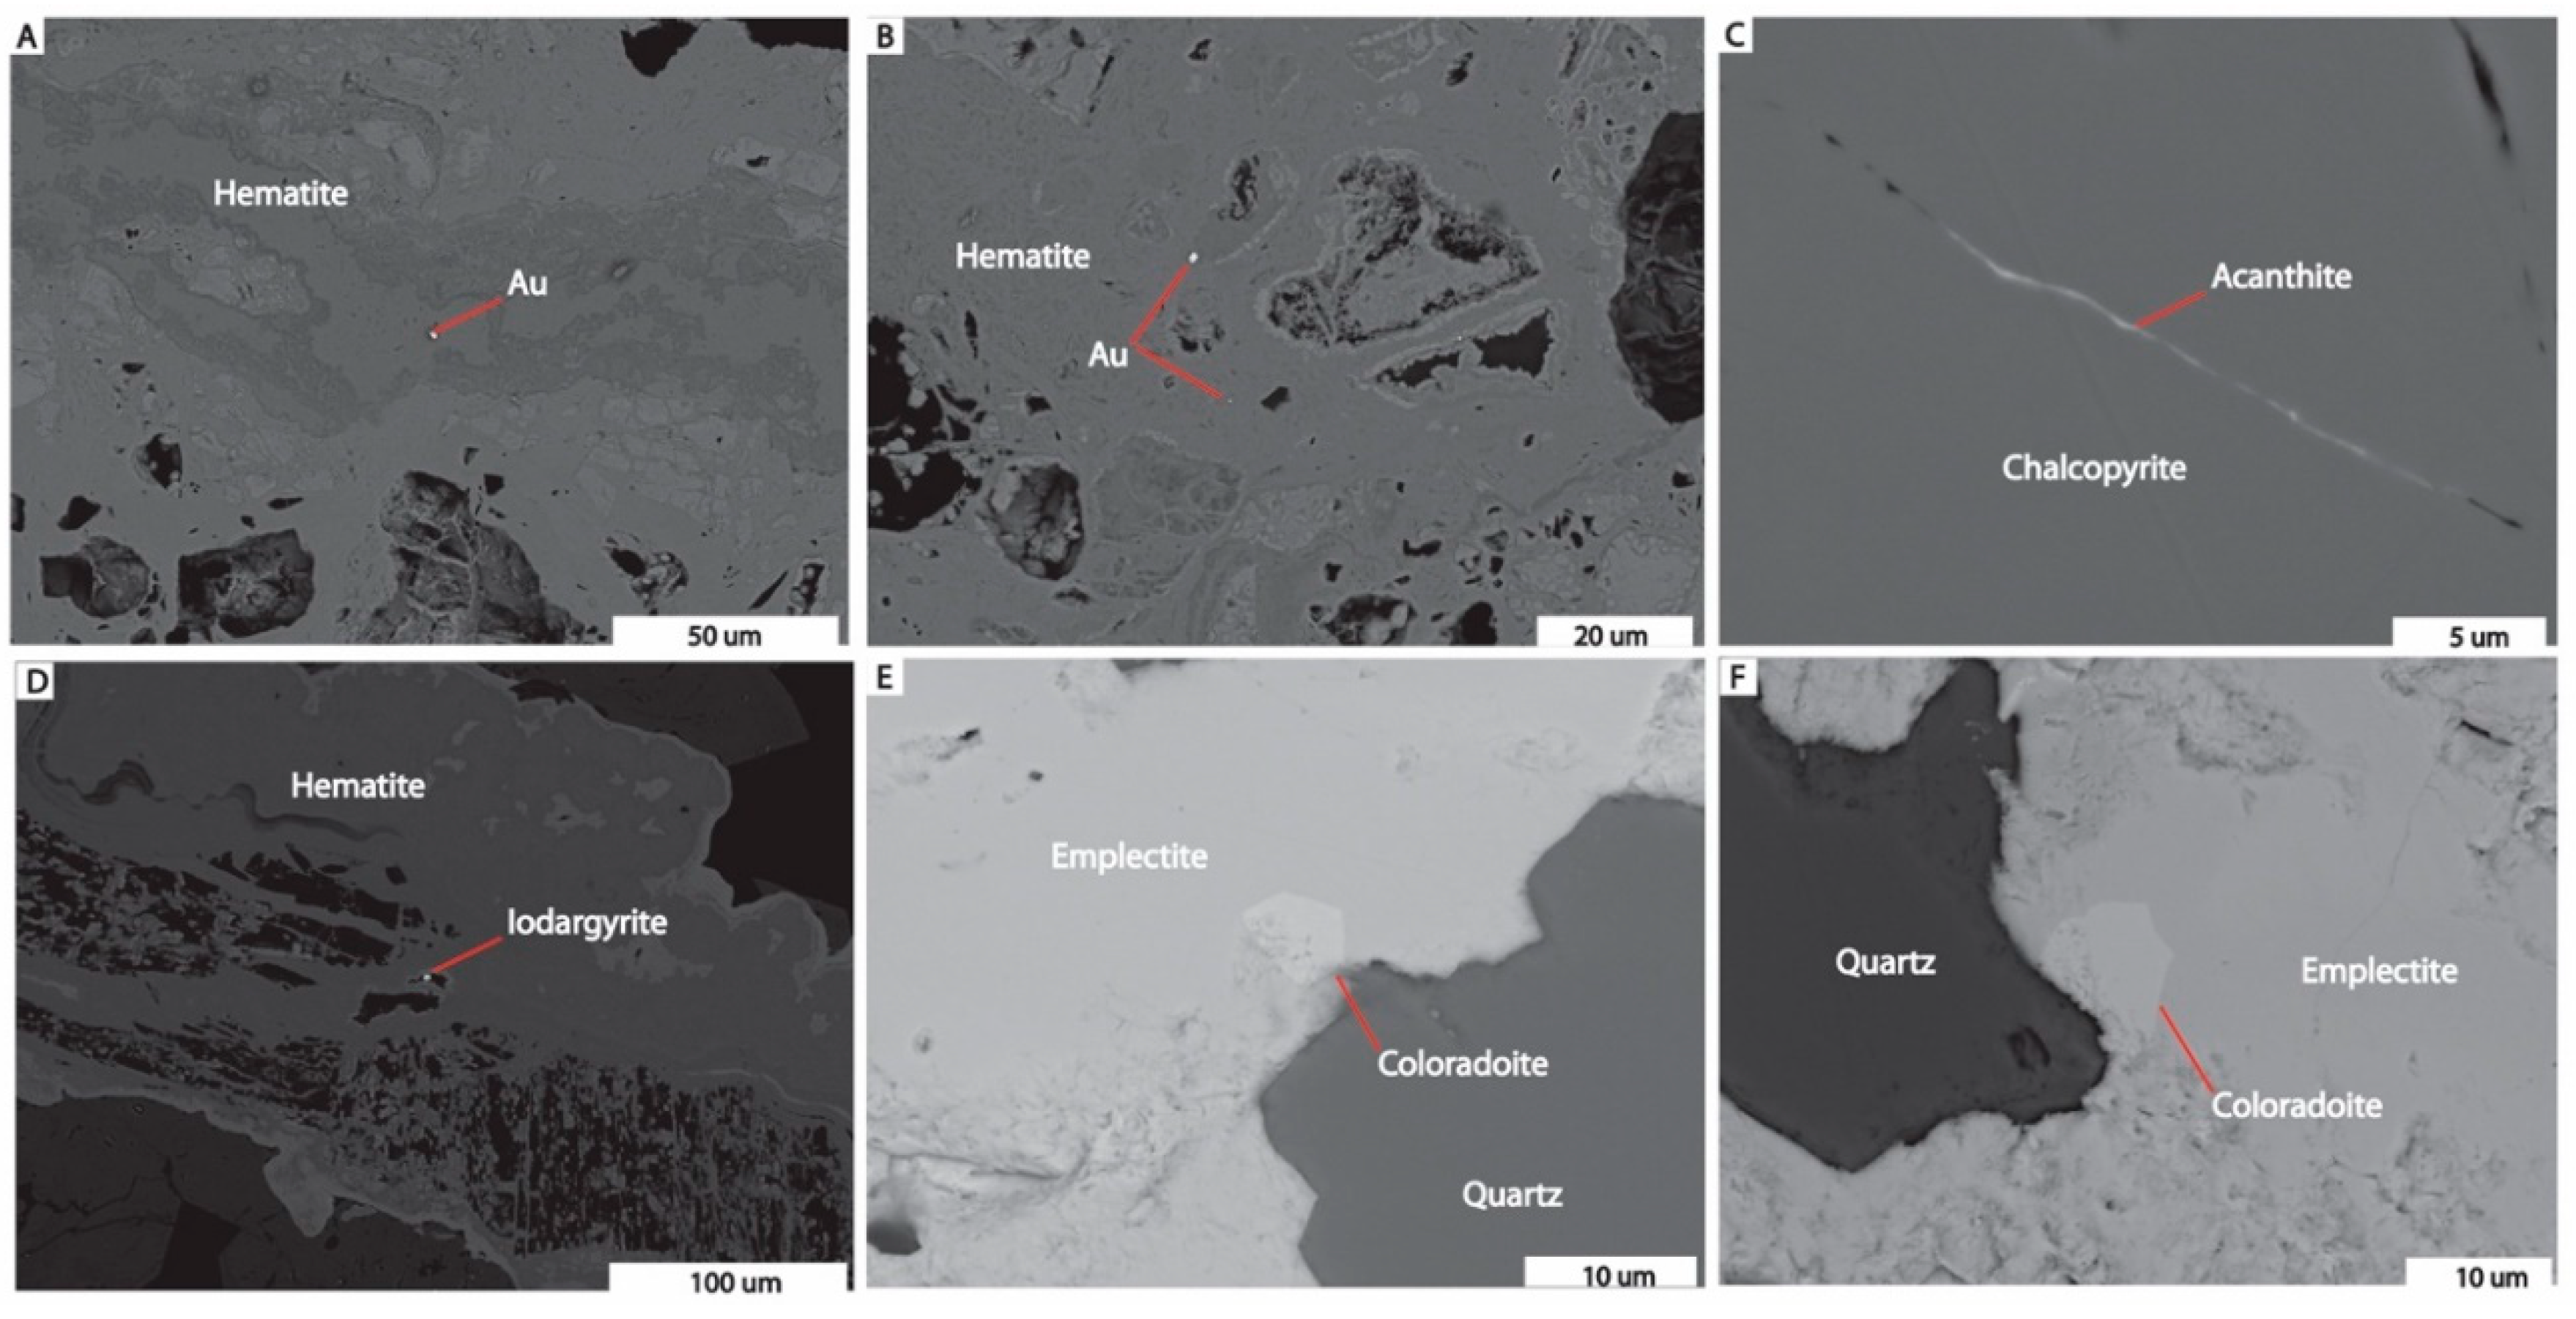
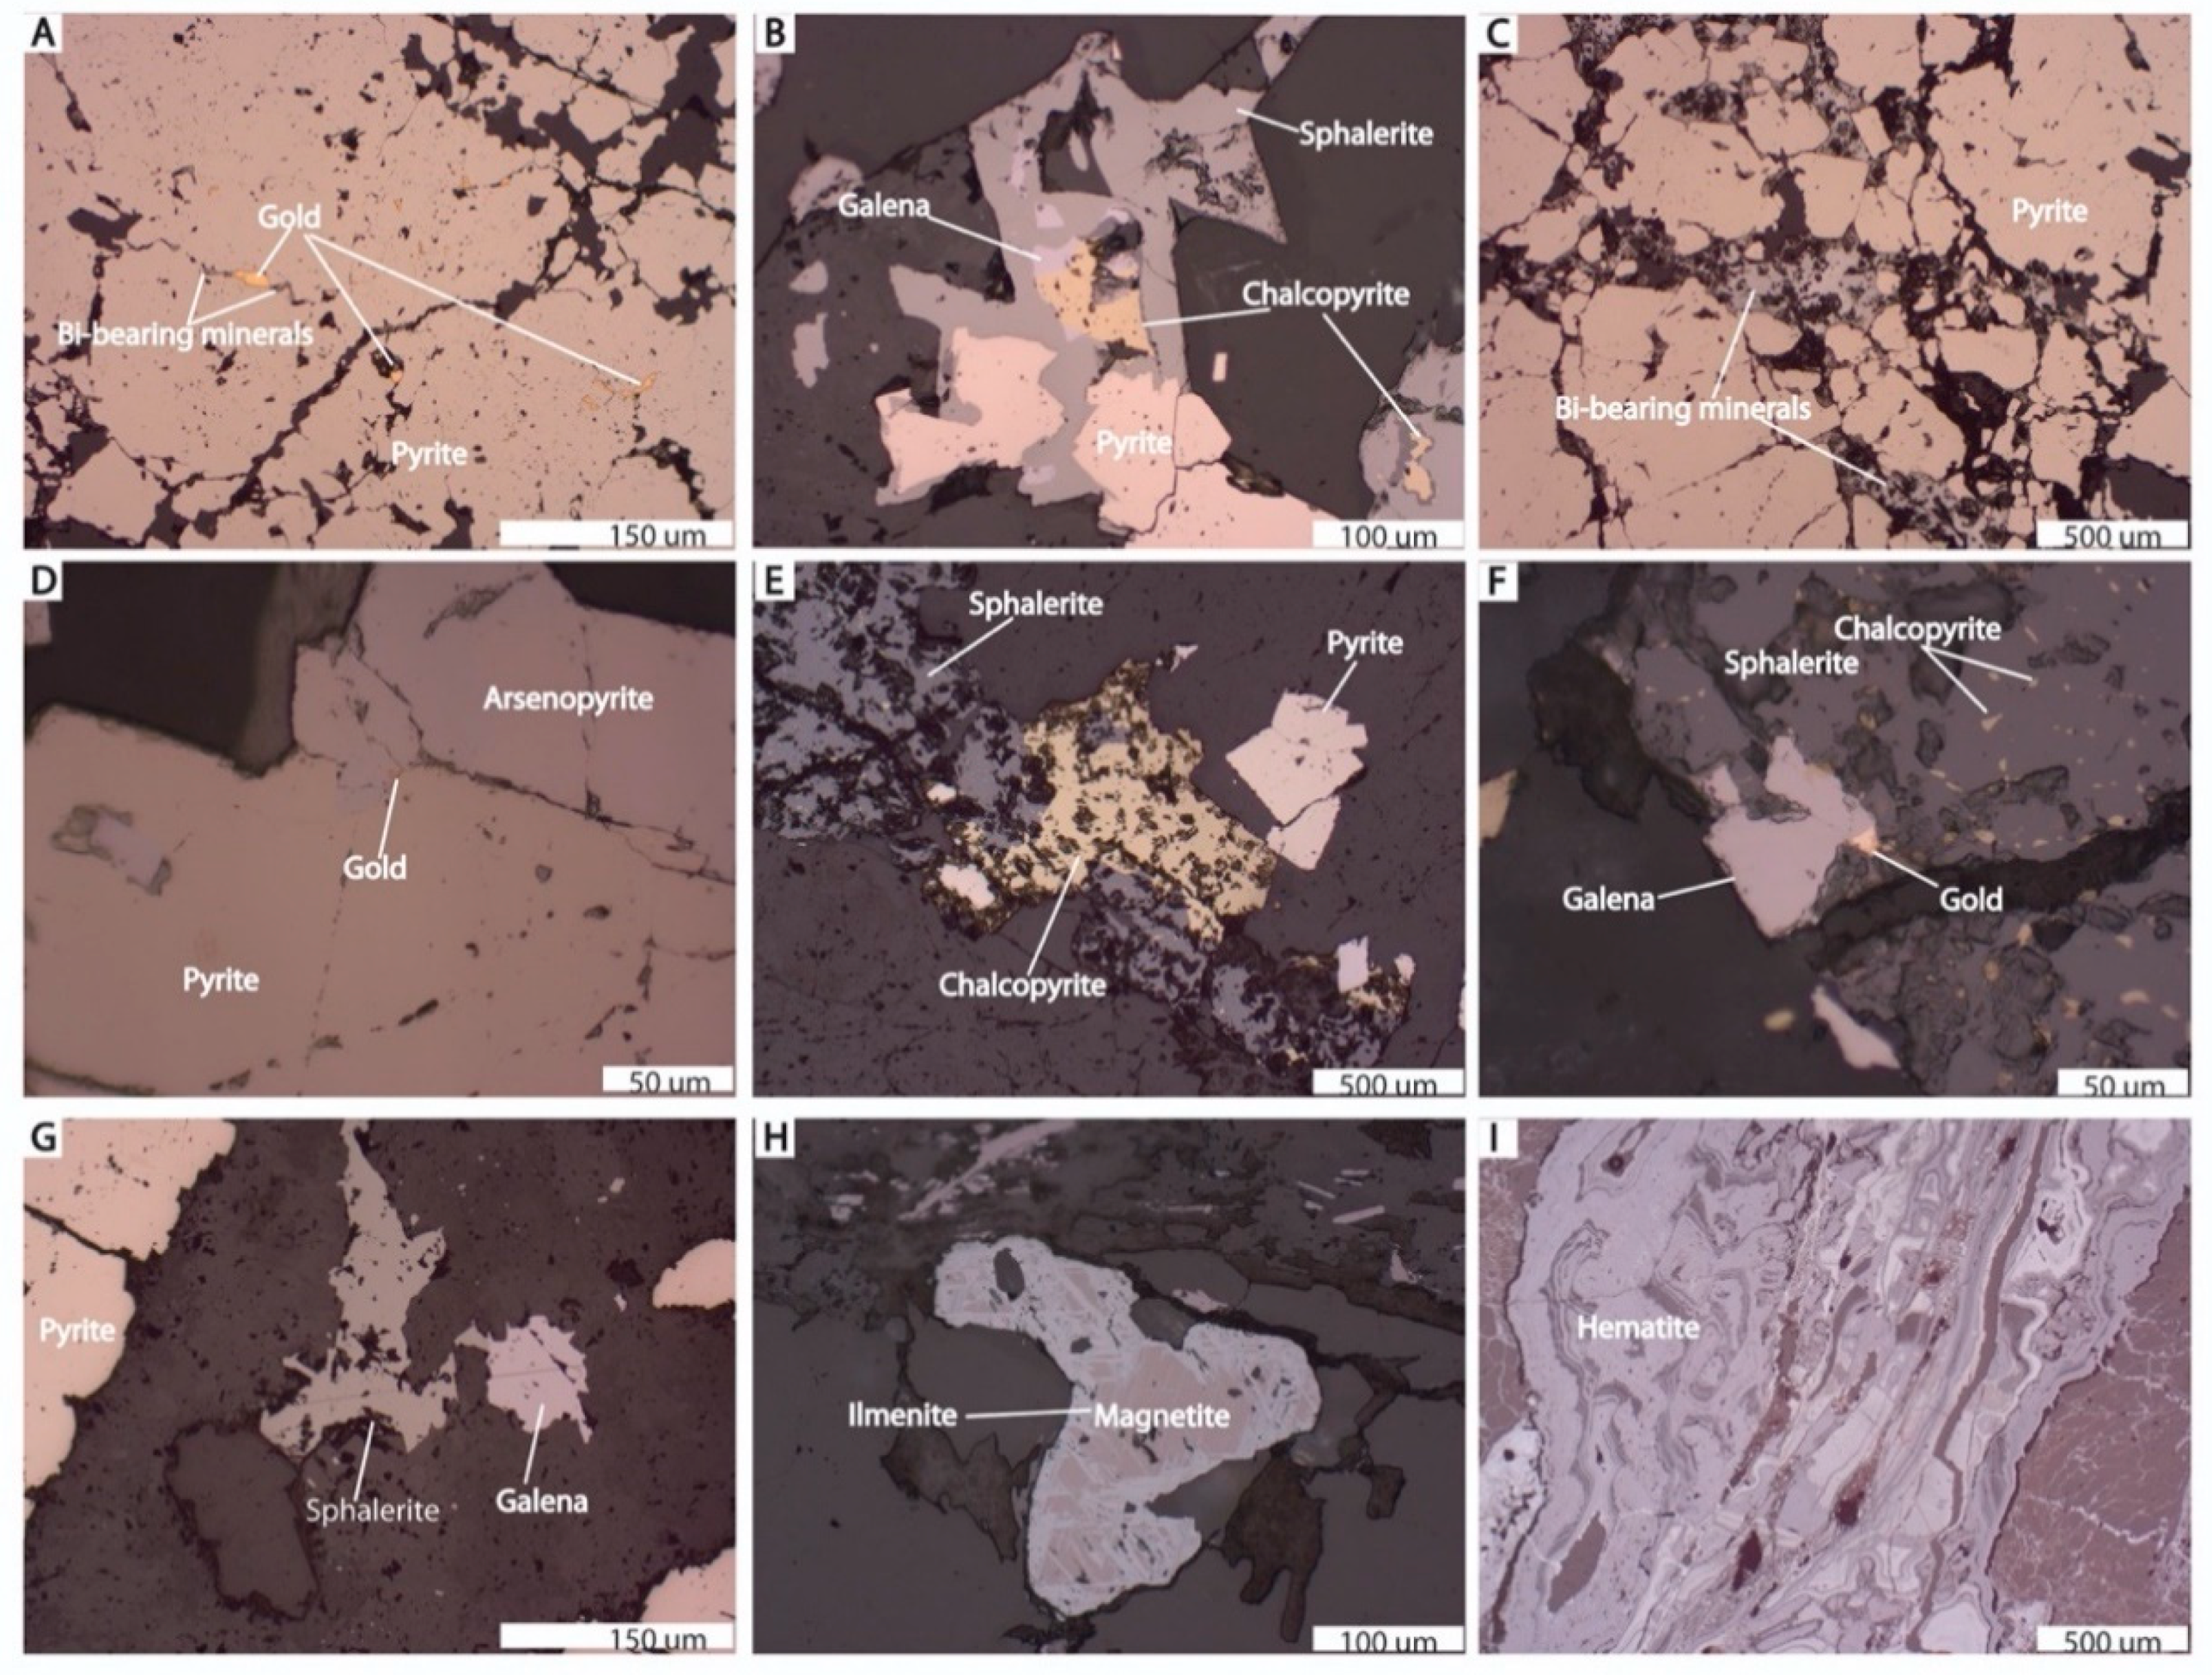
Native gold (Figure 5) occur as anhedral crystals disseminated in quartz veins (Figure 5A–C) and quartz-calcite micro-veins (Figure 5F), filling cavities and fractures in pyrite (Figure 5D,E), as well as micro- to nano inclusions in pyrite (Figure 5B), and chalcopyrite and along grain boundaries between pyrite and arsenopyrite (Figure 6D).
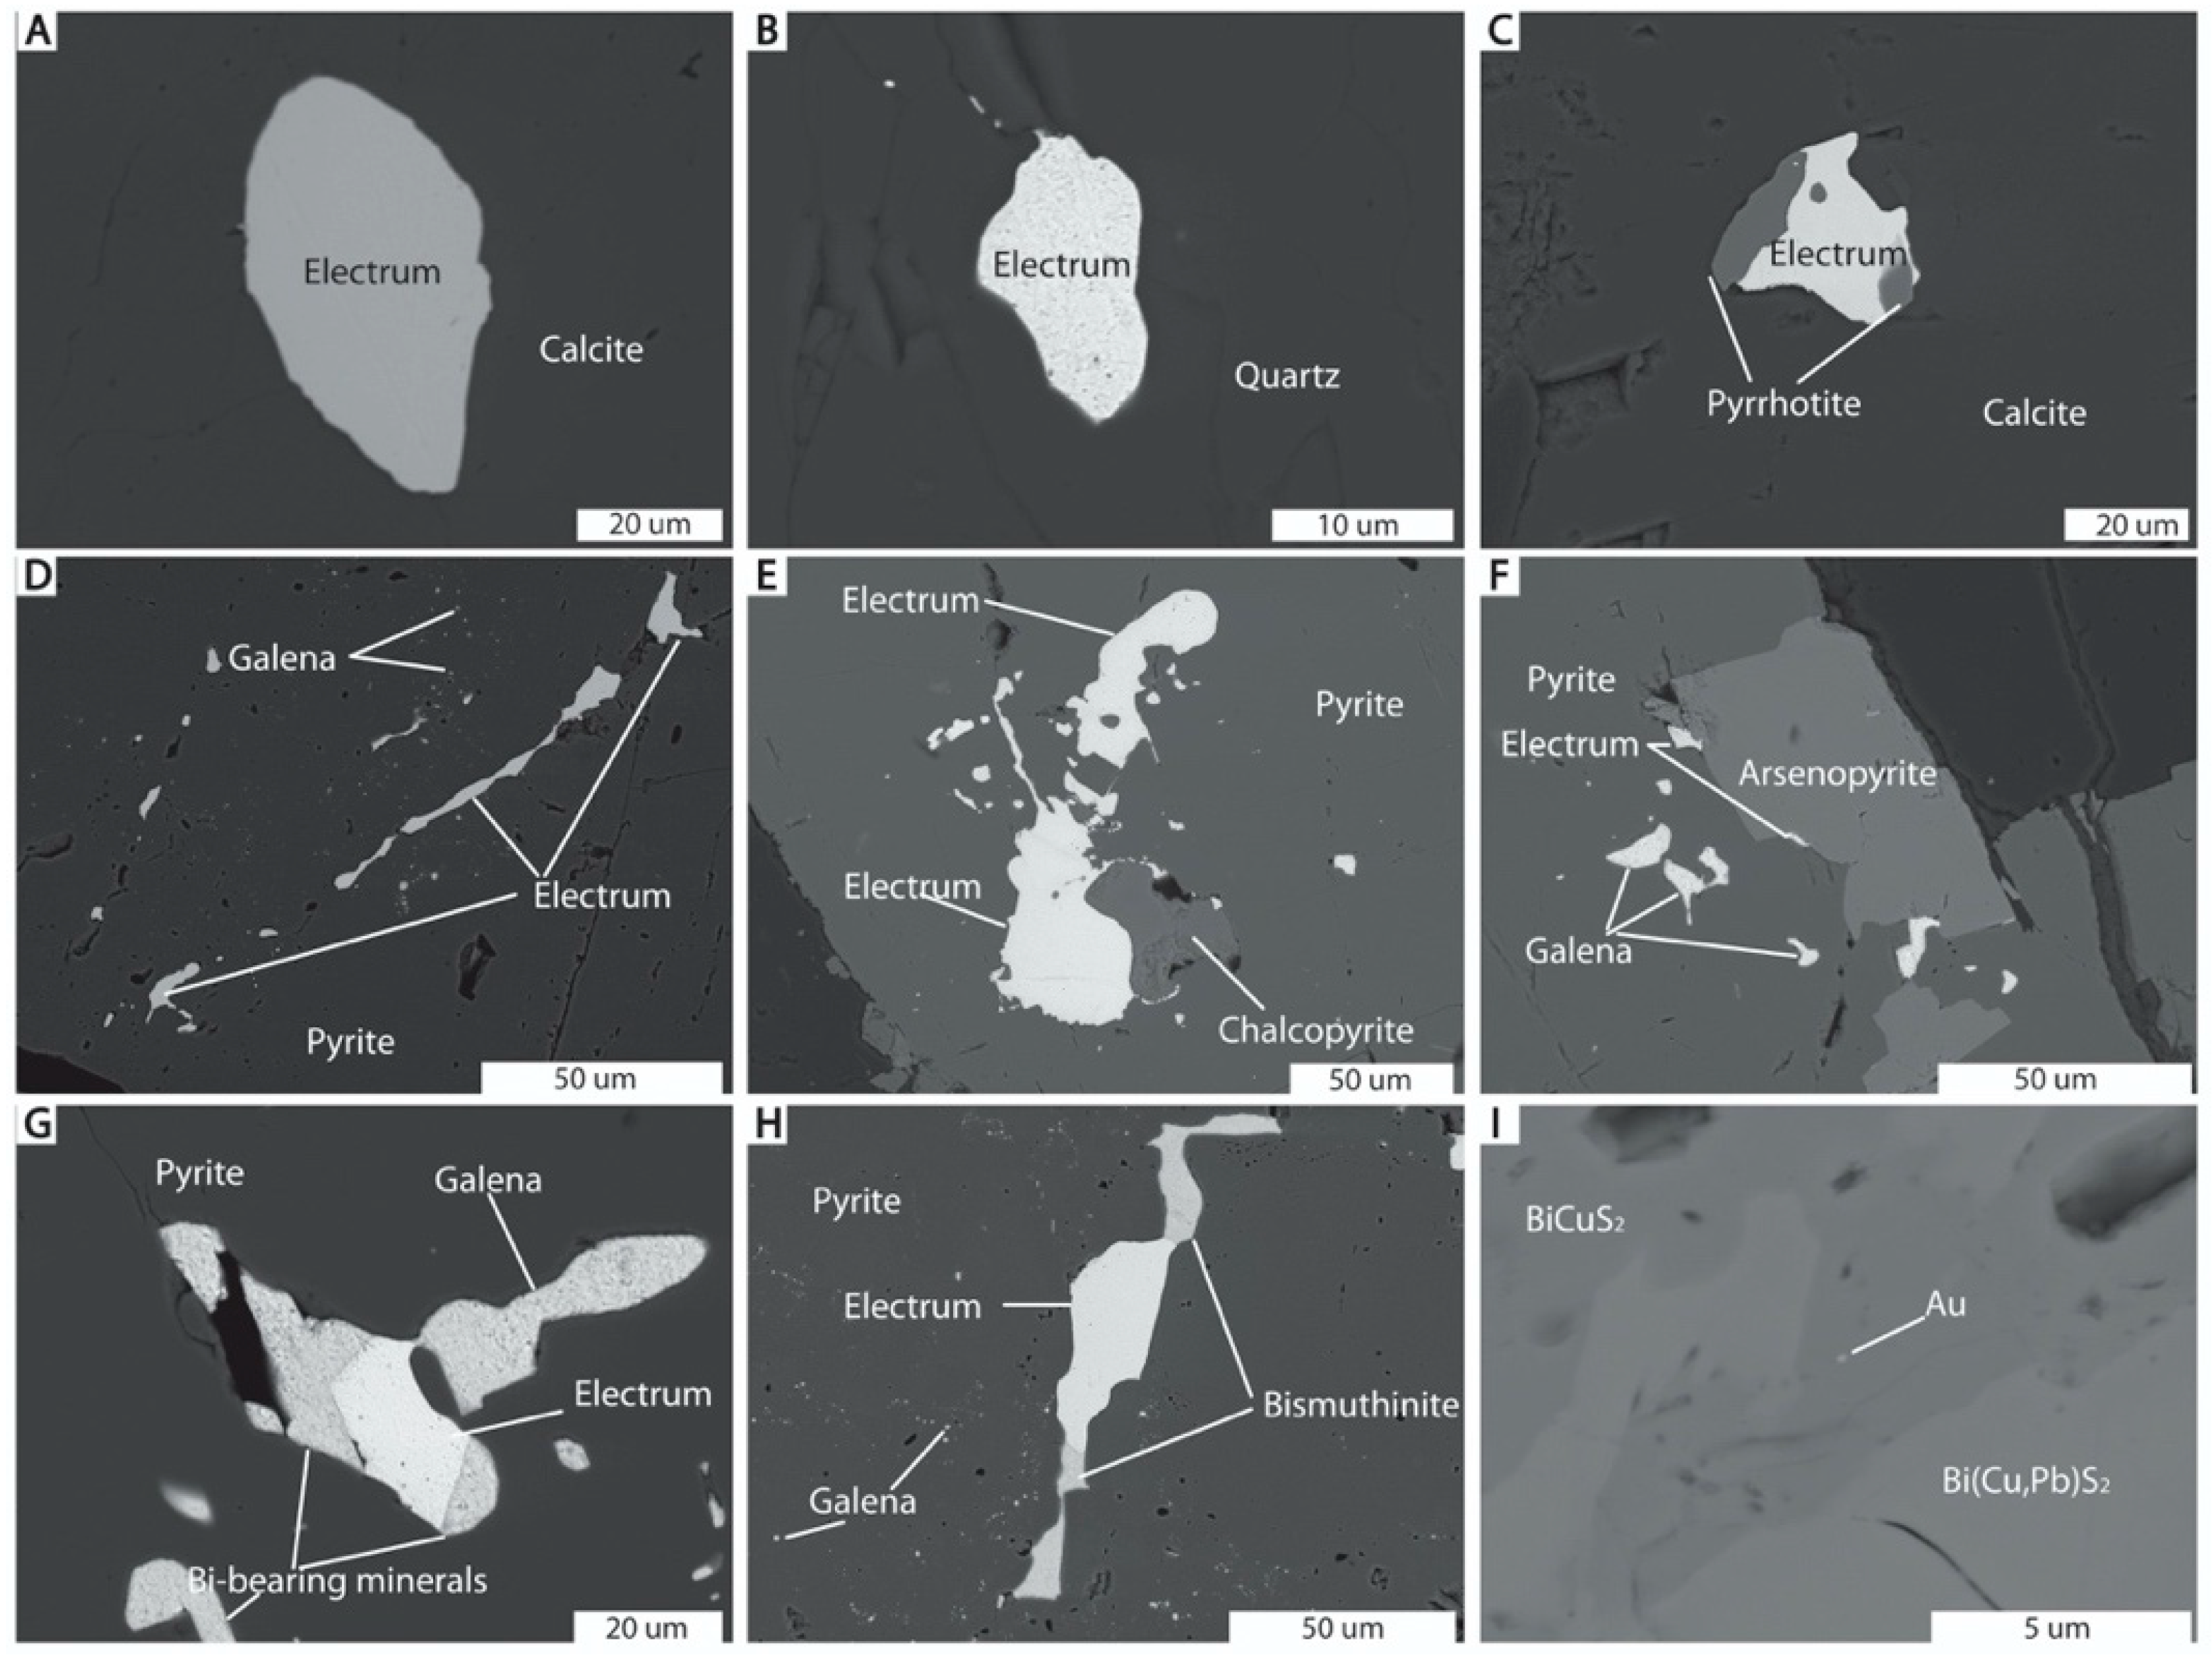
Native gold and electrum form anhedral crystals ranging between ~50 nm and 260 µm, occurring as free electrum in quartz-calcite microveins (Figure 6A,B). Electrum can also occur intergrown with pyrrhotite (Figure 6C), and native gold occurs as micron-scale inclusions in pyrite, chalcopyrite and Bi-bearing minerals, and hematite (Figure 7A,B). Electrum characteristically occurs as cavity and fracture fill in pyrite (Figure 6D), as well as in grain boundaries between pyrite and arsenopyrite (Figure 6F), or between pyrite and chalcopyrite (Figure 6E), respectively. In addition, electrum can be intergrown with bismuthinite, as well as microinclusions in emplectite (Figure 6G–I).
In the sulfide zone in the Mollehuaca veins, acanthite was observed filling micro-fractures (<1 µm) in chalcopyrite (Figure 7C). In the oxidation zone, iodargyrite and naumannite as well as silver selenide were found filling cavities in iron oxyhydroxides (Figure 7D). Electron probe microanalyses were not performed on these silver-bearing minerals.
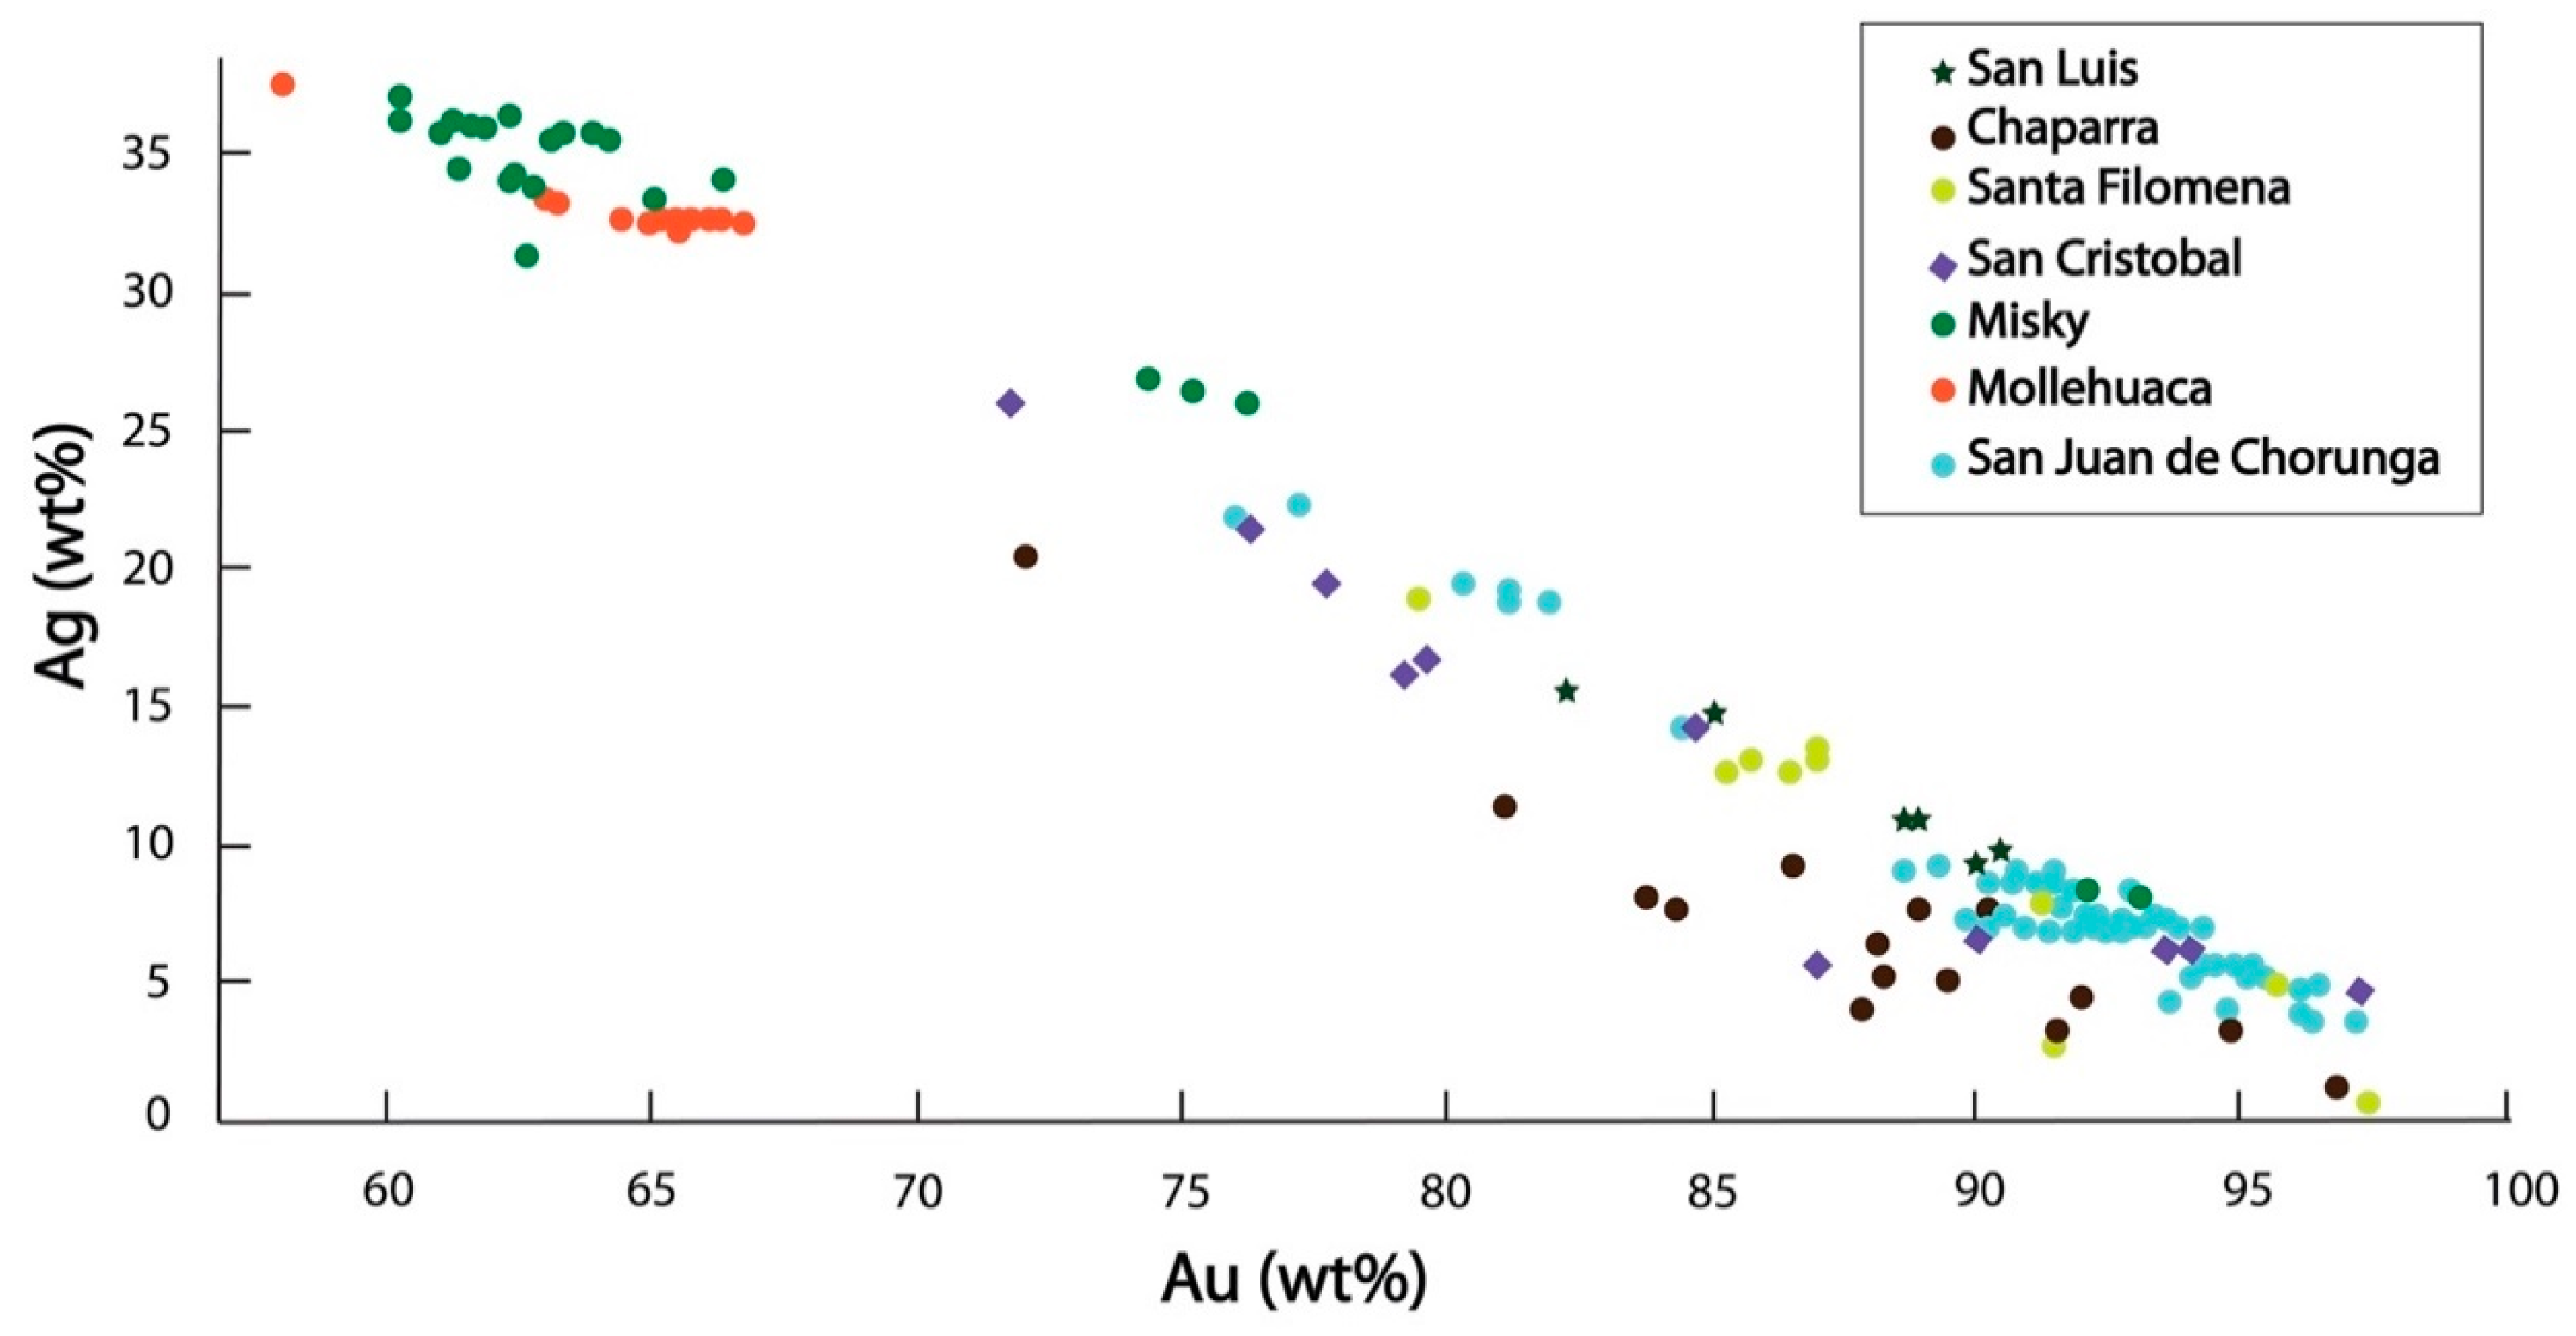
The summary of EMP analyses of native gold and electrum grains are shown in Table 1. Electrum from Mollehuaca is more Ag-rich, while electrum from San Juan de Chorunga is more Ag-poor (Figure 8).
Figure 8 also includes EMP analyses of electrum grains from the Misky, Santa Filomena, San Cristóbal, Cháparra, and San Luis deposits [16]. Similar to these deposits, we observed that electrum from Mollehuaca and San Juan de Chorunga maintained a negative linear trend in Ag vs. Au content. The San Cristóbal veins are located close to San Juan de Chorunga and have similar Au and Ag contents.

4.3.2. Pyrite

Pyrite is the dominant sulfide mineral in the veins at both sites (Figure 9A–E,G). Pyrite occurs as subhedral to anhedral crystals. It occurs disseminated in the vein, as well as in cavity fillings in quartz and calcite microveins. In some veins, pyrite is also presented as 300 µm to 1 cm aggregates of smaller pyrite grains (Figure 9A). Pyrite fractures are filled with sphalerite, galena, gold-electrum, calcite, sericite, and Bi-bearing minerals (Figure 9B,C). Pyrite has micro- to nano inclusions of galena, chalcopyrite, and gold. Pyrite is more abundant in the sulfide zone. Pyrite from the transitional and oxide zone demonstrates grain-edge dissolution and is spatially associated with hematite.
Pyrite contains 51.9 to 54.6 wt% S, with iron contents ranging from 45.6 to 47.9 wt% (Supplementary File S1). The most abundant trace elements in pyrite are As, Sb, and In with average values of <0.5 wt%. No mineral inclusions containing Au or Ag were identified by EMP analysis.

4.3.3. Chalcopyrite

Chalcopyrite occurs as disseminations and cavity fillings in quartz-calcite micro-veins. The crystals are anhedral, ranging from 100 µm to 2 mm. Chalcopyrite is spatially associated with pyrite, sphalerite, and galena (Figure 9B,E). Chalcopyrite also occurs as an exsolution texture in sphalerite (Figure 9F), as well as micro-inclusions and cavity filling in pyrite (Figure 9E). Chalcopyrite grains have major element concentrations ranging from 35.1 to 36.4 wt% S, 29.2 to 30.9 wt% Fe, and 34 to 35.1 wt% Cu, based on EMPA (Supplementary File S1). The most important trace elements in chalcopyrite are Pb, Tl, Sb, and In with average contents < 0.1 wt%.

4.3.4. Sphalerite

Sphalerite occurs as anhedral crystals from 110 µm to 2.5 mm. Sphalerite is intergrown with pyrite, chalcopyrite, and galena (Figure 9B,E–G), or occurs as exsolution texture in chalcopyrite (Figure 9F). The major elements in sphalerite range from 55.3 to 57 wt% Zn, 33.3 to 33.8 wt% S, and 7.6 to 9 wt% Fe as identified by EMP analysis (Supplementary File S1). Trace elements in sphalerite are Cd, Tl Pb, Mn, Sb, and In with concentrations averaging < 2 wt%.

4.3.5. Arsenopyrite

Arsenopyrite occurs as subhedral to euhedral crystals ranging from 100 to 500 µm, intergrown with pyrite (Figure 9D). The arsenopyrite contains 39.6 to 42.4 wt% As, with Fe concentrations from 31.5 to 36.3 wt%, and S contains from 21.2 to 22.5 wt% (Supplementary File S1). Trace elements in arsenopyrite are Sb, Pb, Tl, Te, In; all with average concentrations of < 0.3 wt%. One mineral inclusion containing Au in arsenopyrite was identified with a value of 0.1 wt%.

4.3.6. Galena

Galena occurs as anhedral crystals ranging from 100 µm to 1 mm, spatially associated with pyrite, sphalerite, chalcopyrite, and gold (Figure 9B,E–G). It infills cavities and fractures in pyrite and occurs intergrown with chalcopyrite and pyrite. The major elements in galena range from 86.9 to 87.6 wt% Pb, and 13.4 to 13.6 wt% S (Supplementary File S1). Trace elements in galena are Fe, Tl, Bi, Sb, Te, each with an average value below 0.3 wt%.

4.3.7. Bismuth-Bearing Minerals

Three different Bi-bearing minerals were identified in San Juan de Chorunga veins; bismuthinite, emplectite, and tetradymite (Supplementary File S1). Among these, bismuthinite is the most abundant. Major elements concentrations in bismuthinite range from 51.5 to 75.5 wt% Bi, 18.6 to 21.1 wt% S, 1.7 to 21.5 wt% Pb, and 0.5 to 6.7 wt% Cu. The most abundant trace elements in bismuthinite are Fe, Sb, Tl, Se, and In, with average values of < 0.8 wt%. Emplectite major and minor element concentrations are shown in Supplementary File S1.

4.3.8. Coloradoite

Coloradoite occurs intergrown with emplectite (Figure 7E,F), with sizes ranging from 5 to 10 µm in the sulfide mineralization zone. The major and minor element concentrations of the coloradoite are shown in Supplementary File S1.

4.3.9. Iron Oxyhydroxides

Magnetite occurs as anhedral to subhedral 200 µm to 2.5 mm crystals disseminated in the wall rock associated with secondary biotite microveins. Ilmenite occurs in exsolution texture within magnetite, as well as in the contact zone between the wall rock and the veins, associated with secondary biotite. Ilmenite occurs as anhedral crystals less than 1 mm (Figure 9H,I).
Some hematite grains occur along the grain boundaries of pyrite and magnetite and are related to chlorite-sericite alteration. EMP analyses were not performed on iron oxyhydroxides mineral grains.

4.4. Paragenetic Sequence

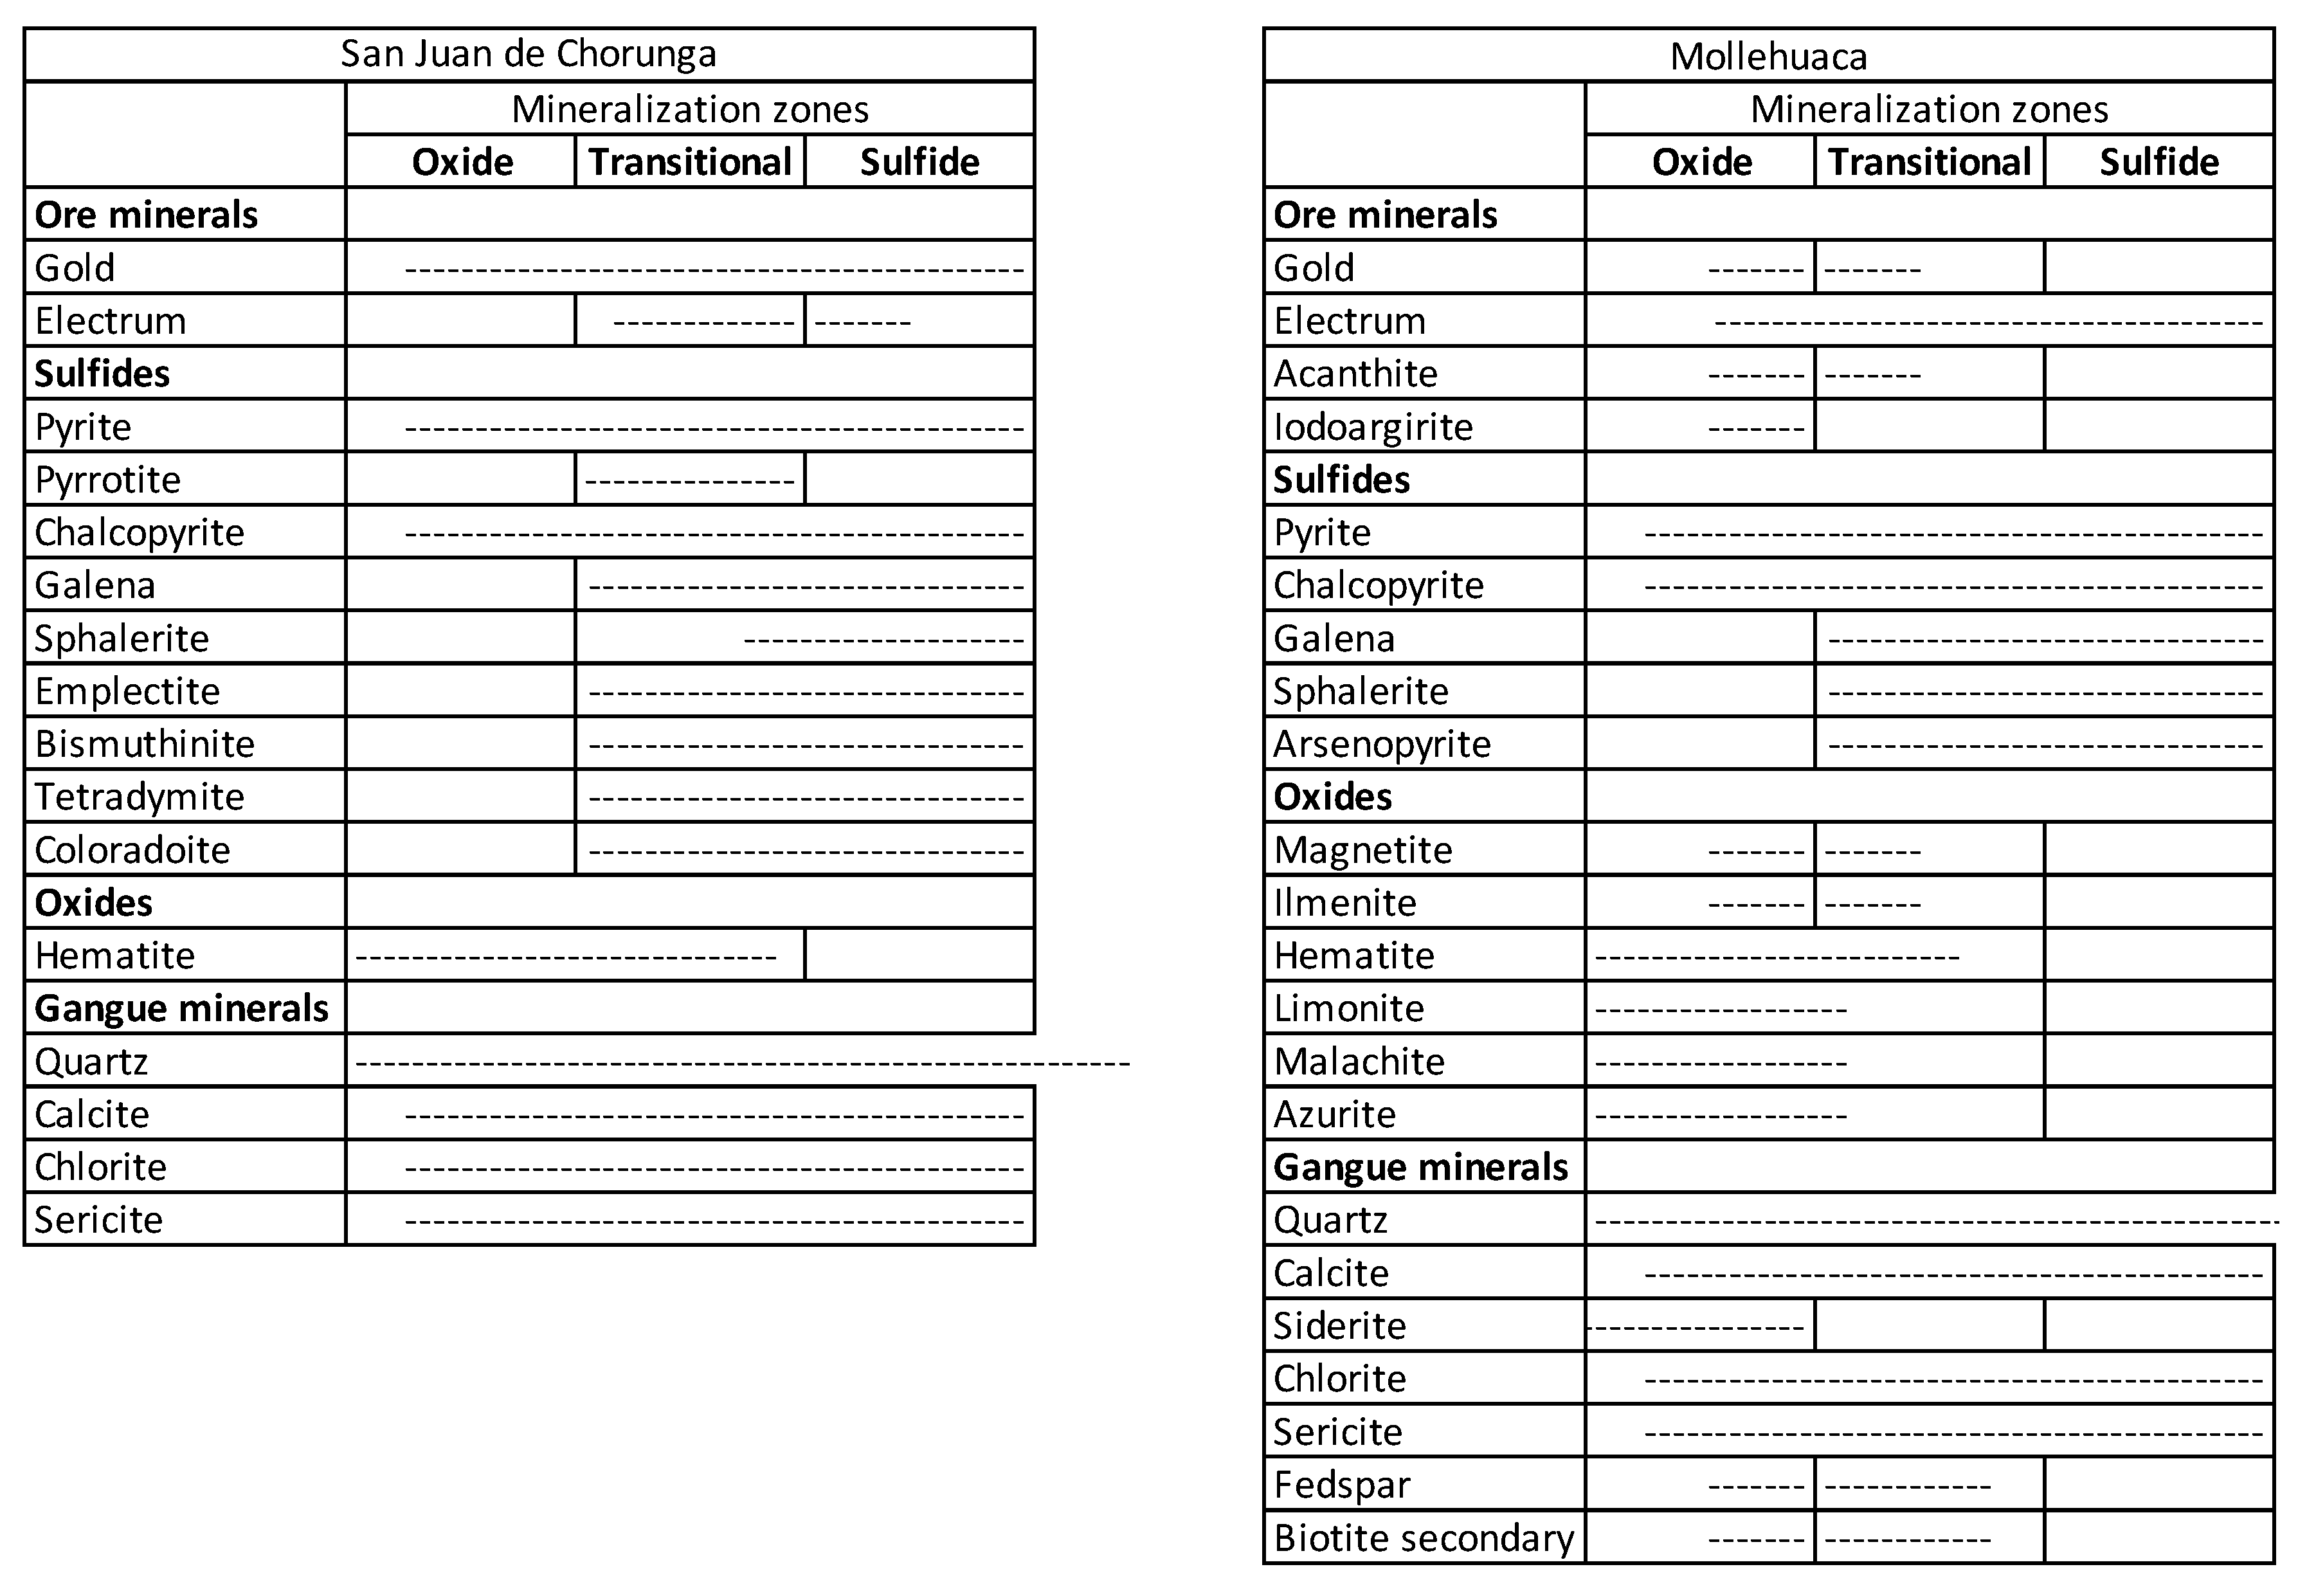
At Mollehuaca, hypogene mineralization was characterized by electrum with pyrite, arsenopyrite, galena, sphalerite, and chalcopyrite, as indicated by the data from the sulfide mineralized zone. In the transitional zone, the oxidation event is represented by the presence of gold, electrum, acanthite, and iodargyrite spatially related with pyrite, chalcopyrite, and lesser galena, sphalerite, and arsenopyrite. In the supergene zone, the oxidation is characterized by the presence of copper and iron oxyhydroxides with free gold and traces of electrum. In this case, Au is associated with iron oxyhydroxides such as hematite, limonite, and ilmenite (Figure 10).
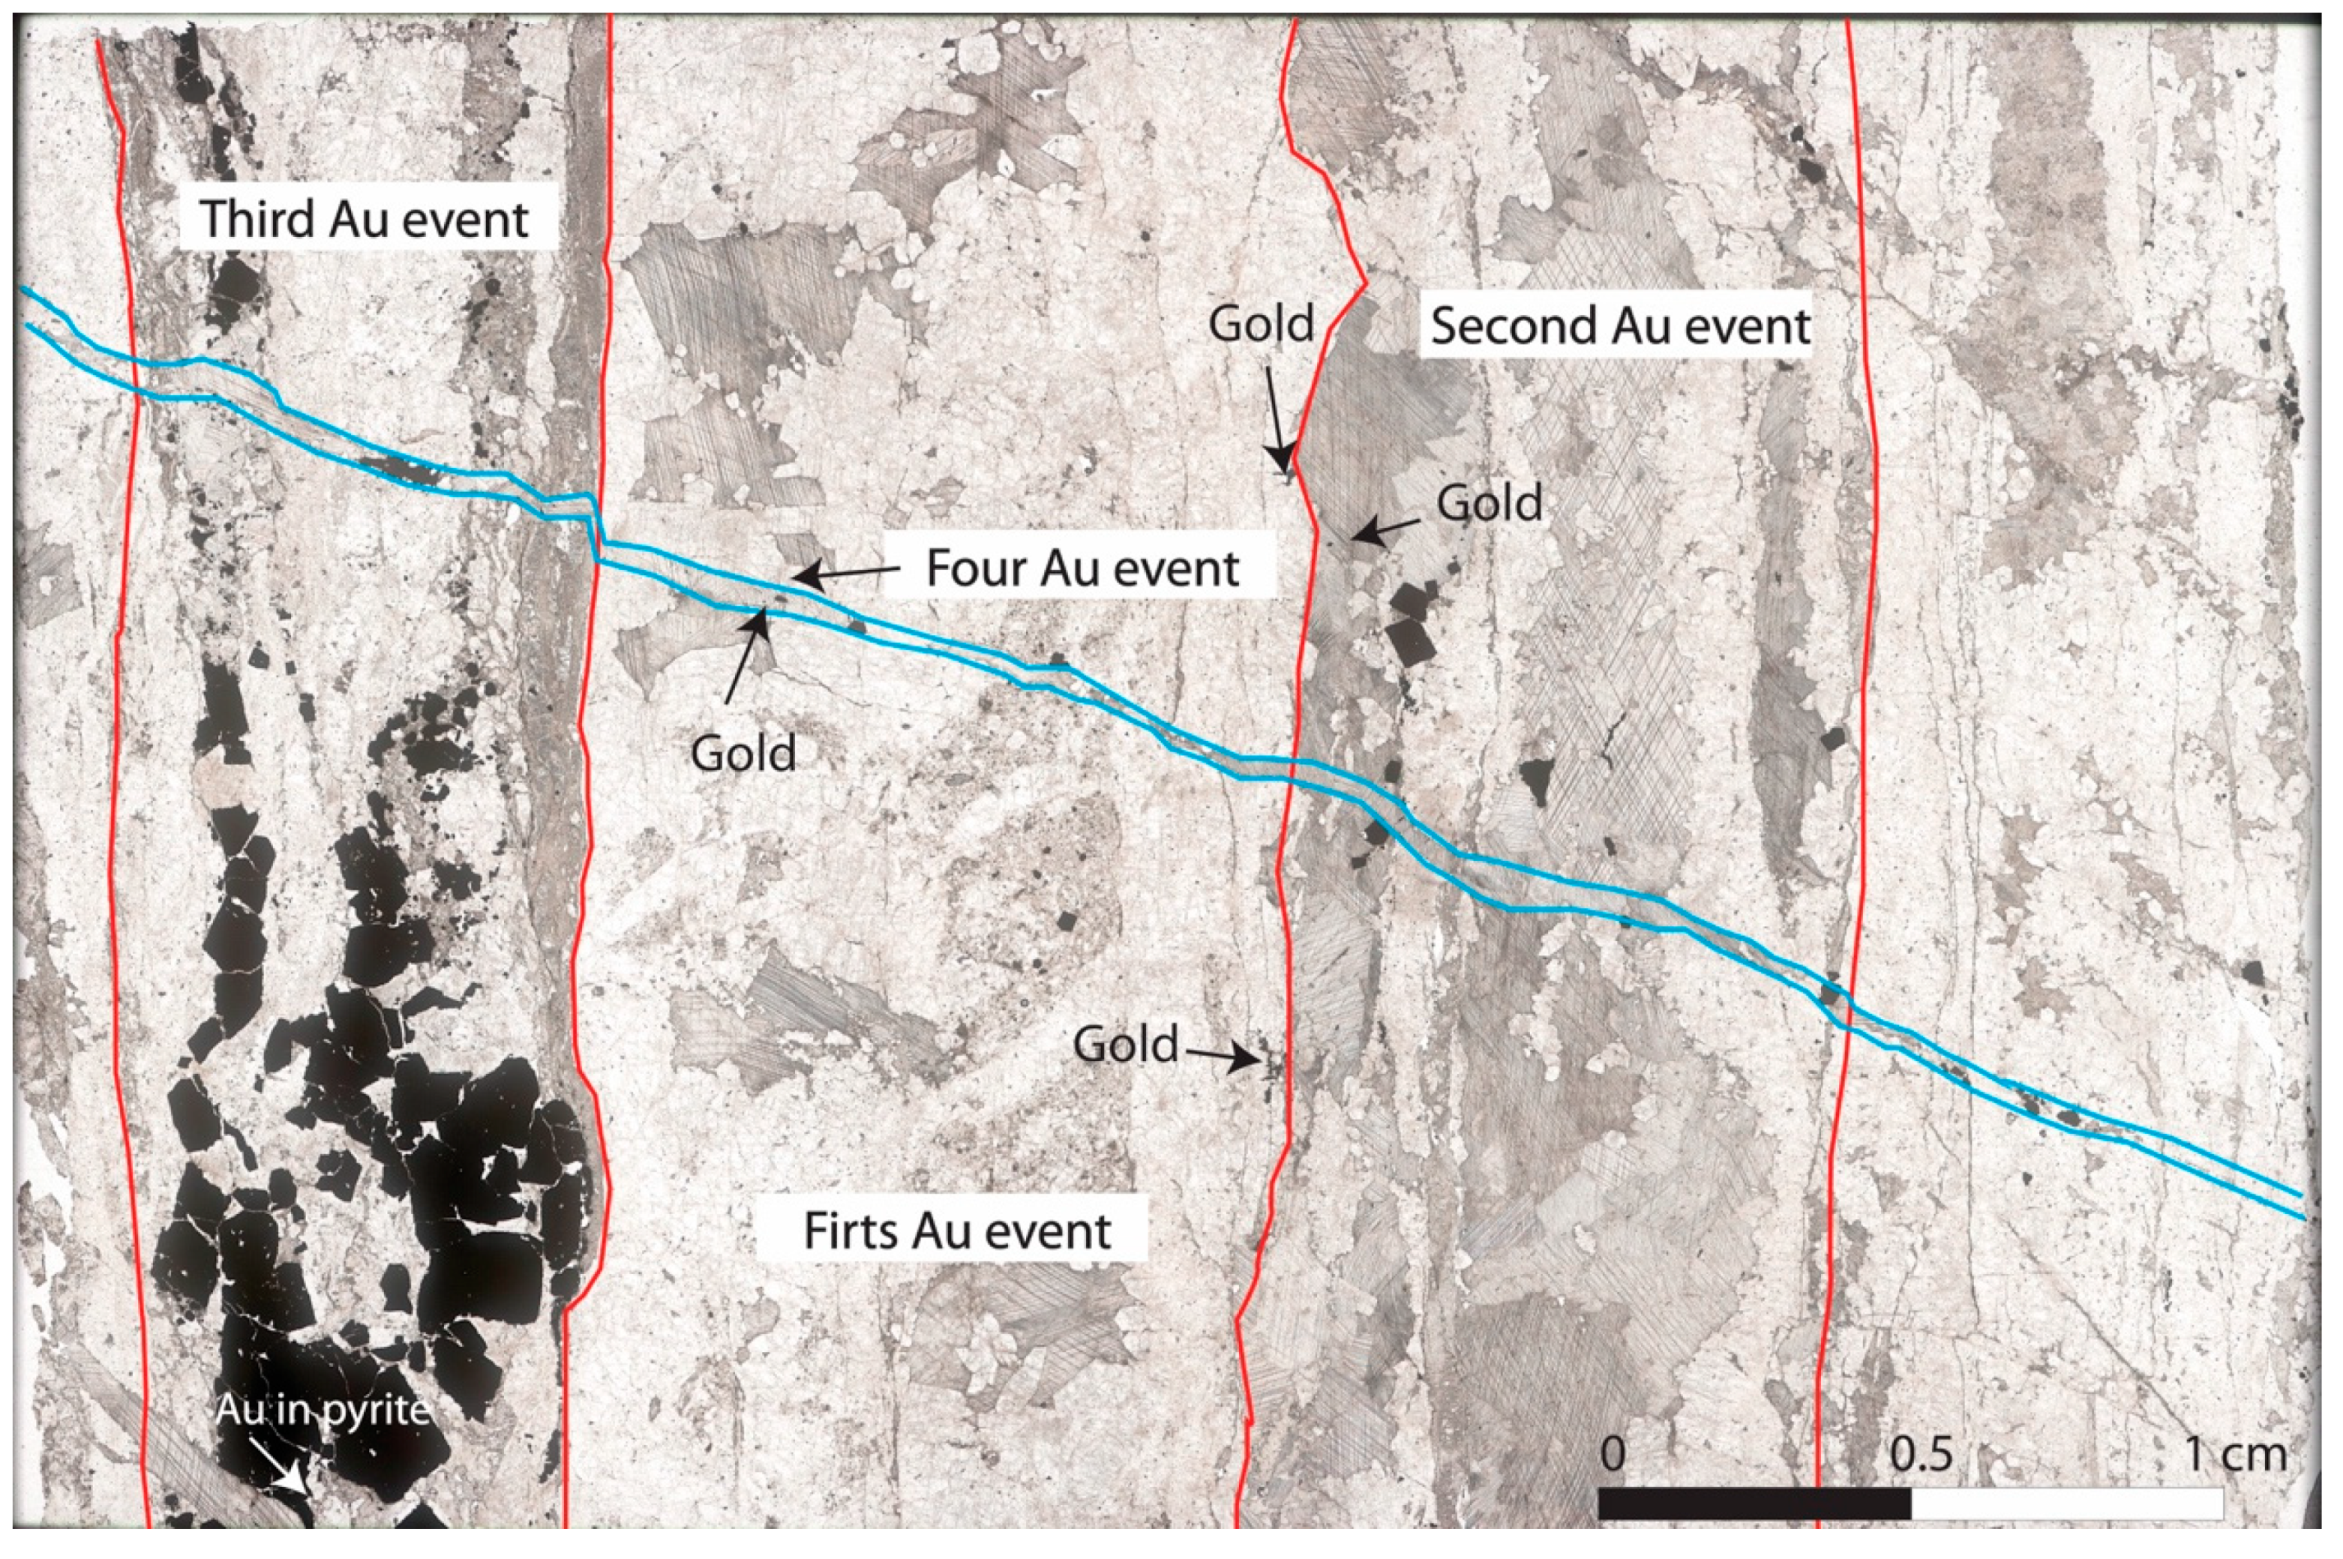
At San Juan de Chorunga, we identified four discrete hypogene mineralization events in the sulfide zone of the deposit (Figure 11). The first event is related to the deposition of Au-bearing mineral inclusions in quartz grains (Figure 6B); the second, most abundant event is represented by free gold in calcite micro-veins and gold in pyrite as micro- to nano inclusions (Figure 6A). The third event is represented by electrum fractures filling and cavity filling in pre-existing pyrite, arsenopyrite, and chalcopyrite (Figure 5D and Figure 6D–H). The last gold mineralizing event is related to calcite micro-veins crosscutting the quartz and calcite- white mica-sulfide micro-veins, where free gold occurs in association with pyrrhotite (Figure 5F). The hypogene mineralization was overprinted by oxidation. In the transition zone in San Juan de Chorunga, this oxidation is represented by free Au and electrum related to pyrite, pyrrhotite, and chalcopyrite. In the supergene zone, the oxidation is represented by free Au associated with minor amounts of pyrite and chalcopyrite and major hematite (Figure 10).

4.5. Whole Vein Geochemistry

A correlation matrix was produced using all of the geochemical data from the veins in order to identify correlations between Au and other elements. The correlation matrix combined the geochemical database of the two field sites due to the similarity of the mineralogical characteristics observed by optical microscopy of both ore and gangue minerals from the mineralized veins. Table 2 shows the highest positive correlation between the following pairs of elements Au-Bi (r = 1), Au-S (r = 1), Au-Hg (r = 0.9), Au-Ag (r = 0.9), Au-Sb (r = 0.9), Au-Cd (r = 0.9), Au-Pb (r = 0.9), Au-Zn (r = 0.8), and Au-Te (r = 0.7). These relationships are discussed in Section 7.
Gold concentrations by ICP-MS analyses are extremely variable (Table 3). Besides Au, the most abundant trace elements are Ag, Hg, As, Cu, Pb, Co, Zn, Sb, Bi, and Mo (Table 3).

5. Trace Elements Geochemistry and Texture of Zircon

The texture and geochemistry of zircon have been used in other studies as tools to discriminate between fertile and infertile plutons related to porphyry copper deposits [17,18]. In this study, we apply the method to determine whether the criteria are diagnostic in other deposit styles. Cathodoluminescence images were used to determine the textural characteristics of the zircon grains.
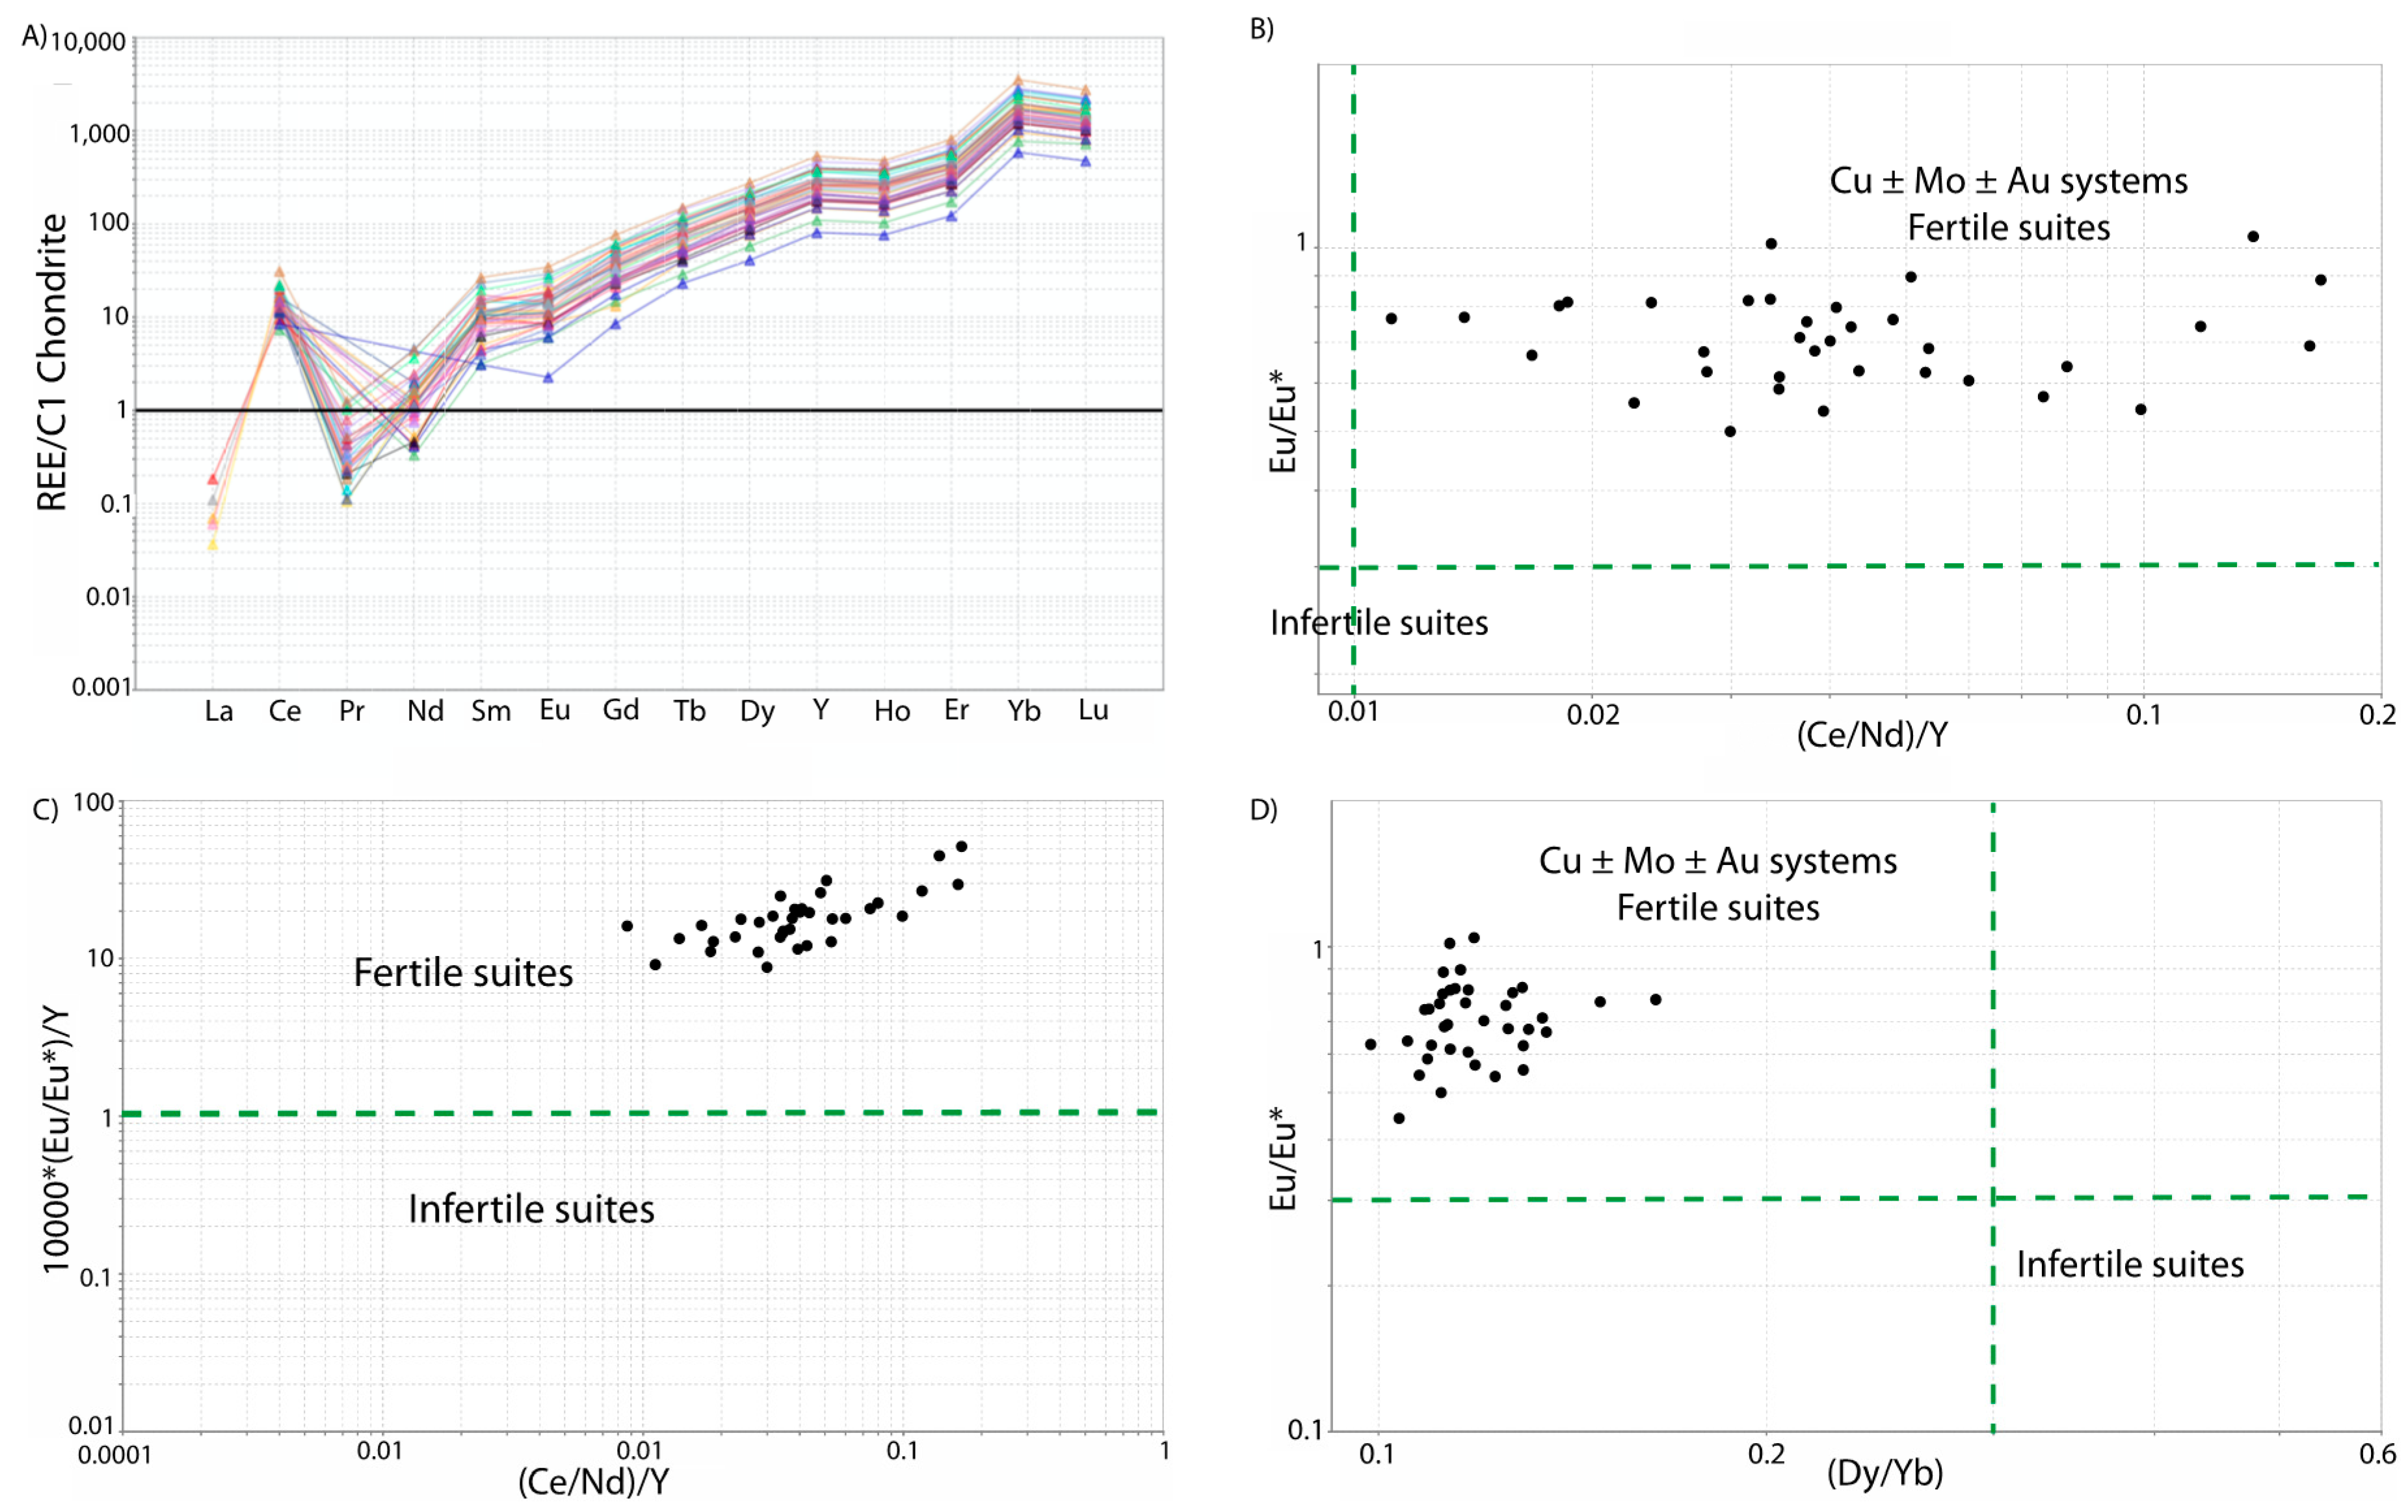
The LA-ICP-MS trace element concentrations are reported in Supplementary File S2. Our LA-ICP-MS analyses of zircon were interpreted excluding contamination by mineral inclusions following the criteria of Lu et al. (2016). Our results in the rare earth elements (REE) show a minimal Eu anomaly in all zircon analyses (Figure 12A). Elemental ratios calculated from the zircon data are Eu/Eu* (>0.44), 10,000 * (Eu/Eu*)/Y (>1.4), (Ce/Nd)/Y (>0.01), and Dy/Yb (<0.23) (Supplementary File S2, Figure 12B–D), similar to fertile suites hosting porphyry copper deposits [18].
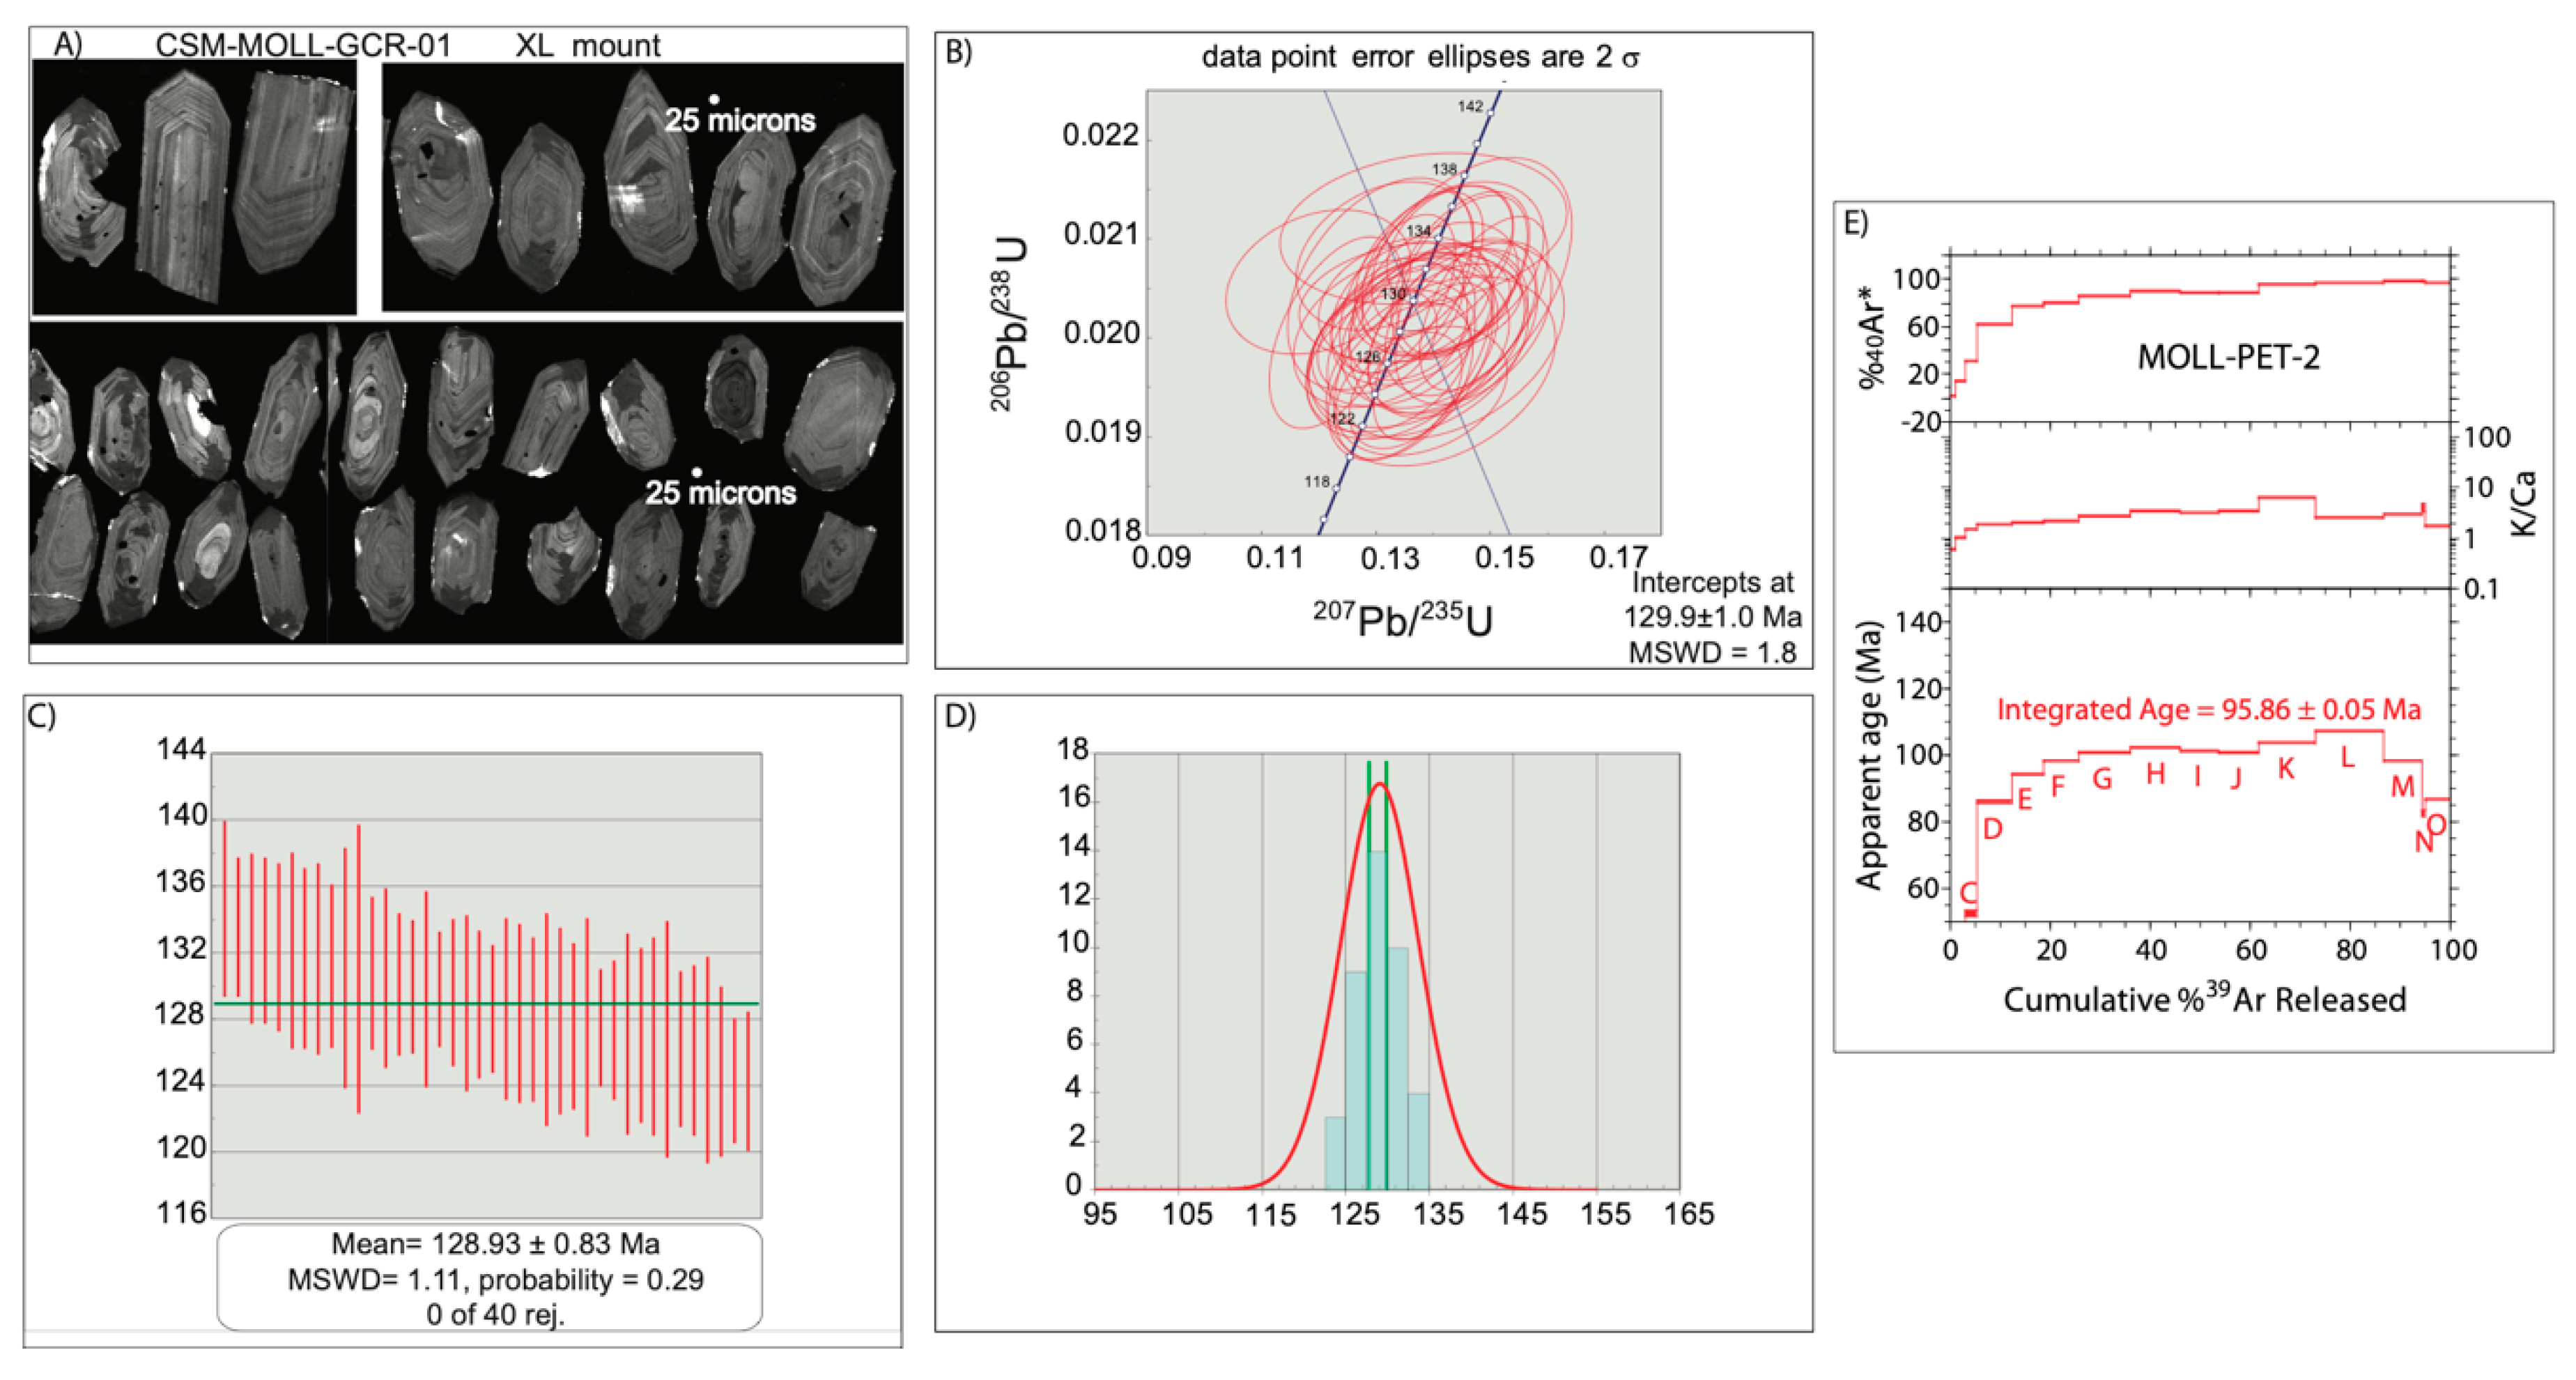
Zircon presents a tabular shape with tabular oscillatory zoning, with fine oscillatory bands <5 microns around the core (Figure 13A).

6. Geochronological Data

Forty LA-ICP-MS spot analyses were performed on zircon from the granodiorite which constitutes the wall rock hosting the veins at Mollehuaca. Thirty-seven analyses yield dates with a weighted mean of 129.2 ± 1.0 Ma (MSWD = 1.18, probability of fit = 0.12) (Supplementary File S2). The weighted mean of 129.2 ± 1.0 Ma is the interpreted igneous crystallization age of the granodiorite. A coherent population with nearly unimodal distribution indicates a weighted average age of 128.93 ± 0.83 Ma (MSWD = 1.11; probability of fit 0.29; all errors reported at 2σ) (Figure 13). Apparent temperatures for zircon crystallization were calculated using the Ti- in-zircon thermometer [14]. The average crystallization temperature of the granodiorite is 694 °C (Supplementary File S2).
The secondary biotite sample from Mollehuaca dated gave an 40Ar/39Ar total gas date of 95.86 ± 0.05 Ma (error reported at 2σ; Figure 13E). No reliable plateau age was obtained.

7. Discussion

7.1. Ore mineralization

Previous studies suggested that in the Nazca-Ocoña belt the quartz veins were intrusion-related gold deposits [19], whereas other authors have proposed an orogenic or mesothermal origin [20,21,22,23]. The observed ore and gangue minerals, textures, compositions, and the field relationships with host rock, structure, and alteration at San Juan de Chorunga and Mollehuaca are consistent with these possible genetic models but do not distinguish among them.
Alfonso et al. (2019) published a brief description of five gold deposits in the Nazca-Ocoña belt. Similar to these deposits, the mineralization at Mollehuaca and San Juan de Chorunga occurs as electrum and native gold, although those studies also documented calaverite, sylvanite, and petzite, which were not identified at Mollehuaca or San Juan de Chorunga. In the Misky and San Cristóbal deposits, the ore minerals are sulfides, dominated by pyrite followed by chalcopyrite, sphalerite, galena, and arsenopyrite. The gold-bearing minerals are native gold and electrum [16]. Previous studies [24] showed that in Misky, native gold occurs as inclusions in pyrite with sizes less than 80µm, while electrum fills fractures in pyrites. Based on the information above and our observations, we suggest that San Juan de Chorunga, Misky, and San Cristóbal deposits have the same ore mineralogy and occurrence in the veins. Previous studies in Cháparra deposit showed that gold mineralization occurs in quartz veins related to a high quantity of iron oxyhydroxides and sulfides, mainly pyrite [16]. Our microscopy observations suggest that Cháparra and Mollehuaca deposits have similar vein mineralogy.
The Pataz district in northern Perú is the closest well-studied district with geological characteristics similar to our case study sites in the Nazca-Ocoña belt. Indeed, previous studies have attributed the Pataz deposits to either an orogenic or an intrusion-related origin [19,25,26], and the alteration, mineralization, and trace metal contents are generally consistent with our observations from Mollehuaca and San Juan de Chorunga. Although the gold-quartz veins in Pataz are hosted in intrusions that are much older than in the Nazca-Ocoña belt, the host rock has undergone similar quartz, sericite, chlorite, and calcite alteration [25,27]. In Pataz, gold and electrum are related with pyrite and scarcely present with quartz, and at the vein scale, the pyrite-rich bodies control the economic ore zones, which were the best sites of Au deposition. The Au occurs as electrum associated with base metal sulfides filling fractures within pyrite [25,27]. In deposits such as La Lima, El Tingo, Pataz, Parcoy, and Builbuyo, gold showed a content of 4 to 14 wt% Ag, and electrum has a content of 24 to 34 wt% Ag [25].
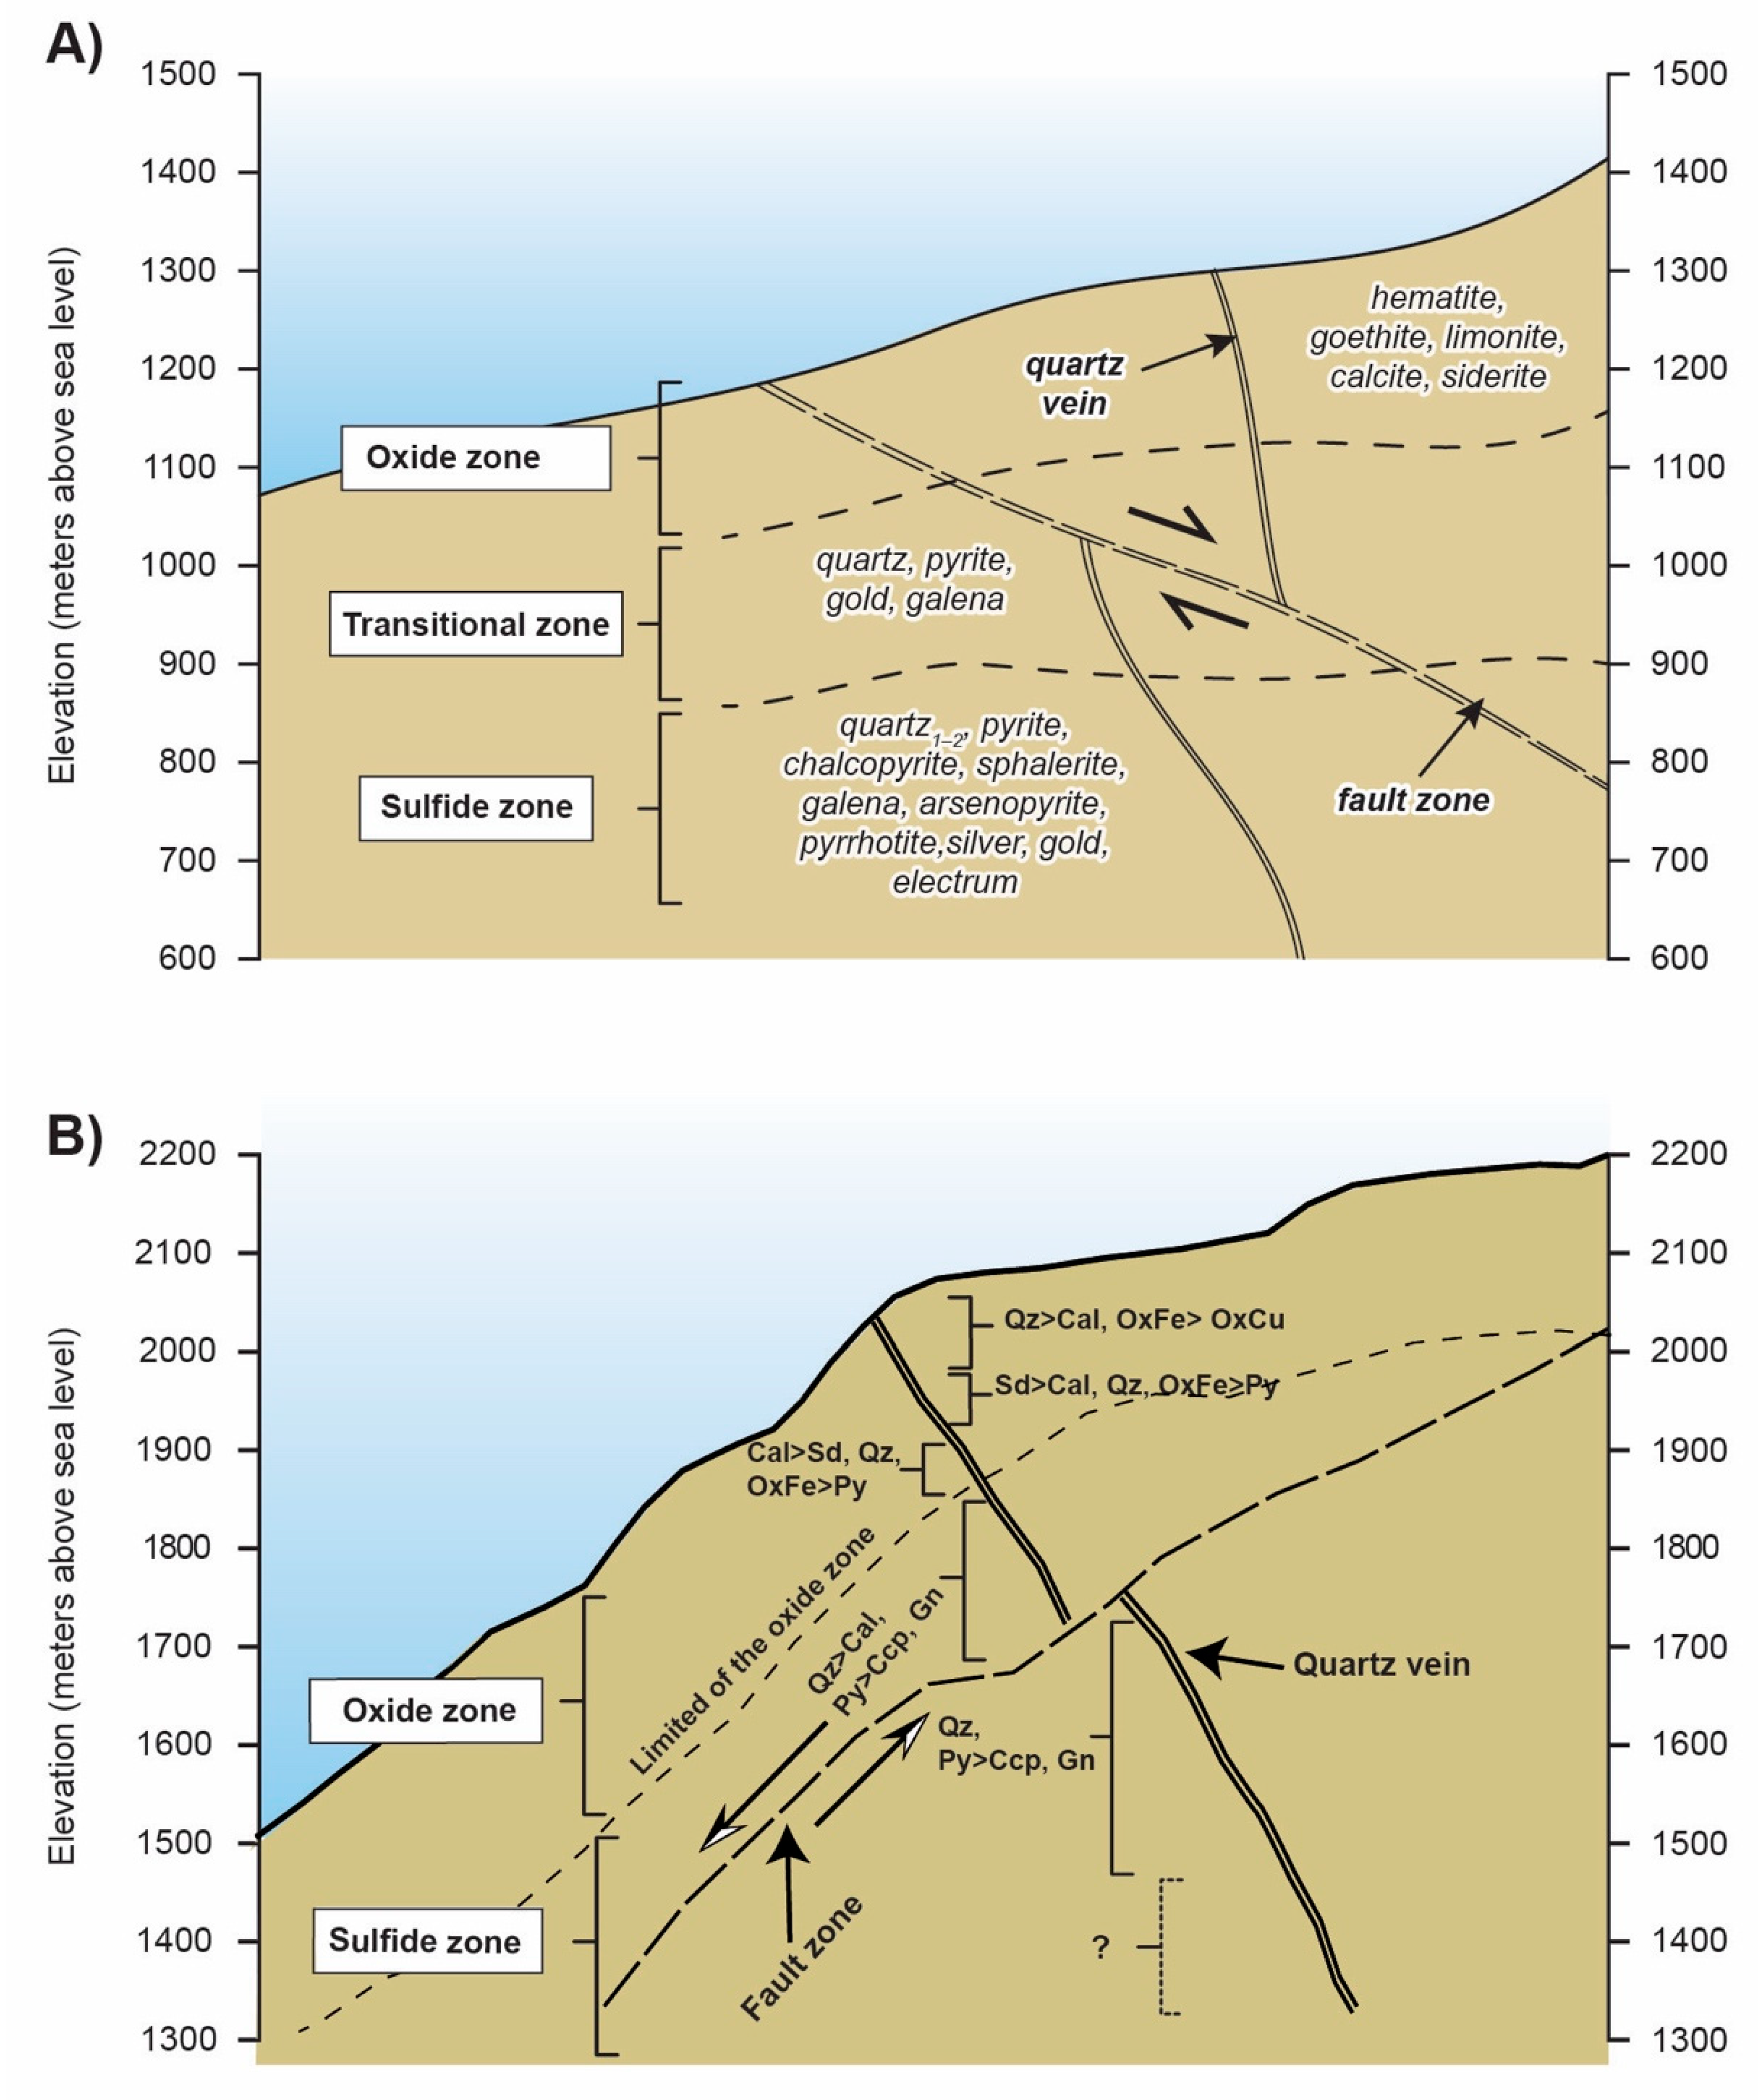
The quartz-calcite-sulfide vein systems at the two deposits exhibit hypogene and supergene vertical zonation in the ore mineralogy and metal ratios (Figure 14). Near surface, the oxide zone is characterized by the presence of invisible gold in the carbonate-dominated veins. At intermediate depths from 200 to 250 m below surface, a transition zone is characterized by pyrite, galena, and electrum and to a lesser extent of iron oxyhydroxides in the quartz-dominated gangue. Finally, at depths below 250 to 450 m, the veins exhibit a greater quantity of sulfides (pyrite, galena, chalcopyrite, arsenopyrite, sphalerite, Bi-bearing minerals), and electrum is visible in some veins. At Mollehuaca, the oxidation zone is much more pervasive than in San Juan de Chorunga. At Mollehuaca, the characteristics of the hypogene minerals in the veins are totally or partially obliterated. At Mollehuaca there is a greater abundance of both copper and iron oxyhydroxides, while in San Juan de Chorunga there is a predominance of iron oxyhydroxides and a lesser quantity of copper oxides.
The highest grades of gold occur in the sulfide and transitional mineralization zones. At depth, the gold grade increases with increasing sulfide abundance. Our whole-rock geochemistry of the veins reflects this relationship as evidenced by the positive correlations among Au, S, Bi, Hg, Ag, Cd, Sb, Pb, and Zn (Table 2). We infer that the positive correlation between Au and Ag, Bi, Hg, Pb, S, and Zn represents the observed relationship between sulfide mineral abundance and Au grade. Below the redox boundary, is high in samples with abundant sulfides. In the oxide zone, the sulfide minerals have been destroyed, and the Au is associated with Fe-Cu oxides. In the sulfide zone at these deposits, micro-scale electrum and gold grains are visible and occur disseminated in quartz and calcite grains, and also filling fractures and cavities in pyrite, as well as micro- to nano inclusions in pyrite (Figure 5). Although the EMP analyses in sulfides did not show gold contents above detection limits, we cannot rule out the possibility that minor gold also occurs in solid solution with pyrite. The hypogene zoning in the veins has been overprinted by oxidation, resulting in shallow zones of electrum, amenable to small-scale exploitation and traditional methods of mineral processing.
Our data demonstrate the presence of significant amounts of silver in this metallogenic belt, which has not been previously recognized. The EPM analyses show between 14 and 37 wt% Ag in electrum grains and between 3.7 and 9.2 wt% Ag in native gold grains (Table 1). Electrum and native gold are the main silver-bearing minerals in the vein systems in Mollehuaca and San Juan de Chorunga, respectively. Furthermore, we identified other Ag-bearing minerals, such as acanthite in the sulfide zone and iodargyrite and naumannite in the oxide zone in Mollehuaca. The presence of high Ag contents related to electrum and Ag-bearing minerals has important implications for the economy of the region, as well as specifically the geometallurgical processes used in small-scale mining.

7.2. Zircon Texture and Geochemistry

The vein systems at our study sites are variable in shape and grade, and the ore zones commonly are not exposed. These characteristics make them elusive to find and a challenge to explore [28,29]. Zircon geochemistry has been used to examine magma fertility in locations hosting porphyry Cu ± Mo ± Au [18], but the tool has not been previously applied to intrusions hosting mesothermal or intrusion-related deposits.
Zircon from magmatic rocks closely associated with porphyry Cu ± Mo ± Au mineralization has been shown to have high values of Ce4+/Ce3+ and Eu/Eu *, with moderately elevated Ce/Ce⁎. These characteristics of fertile magmas are ascribed by most authors to oxidizing conditions at the time of crystallization [30]. In porphyry Cu ± Mo ± Au deposits, the best fertility indicators are zircon Eu/Eu* and (Eu/Eu*)/Y ratios. In particular, fertile magmatic suites have collectively higher zircon Eu/Eu * (>0.3), 10,000*(Eu/Eu *)/Y (>1), (Ce/Nd)/Y (>0.01), and lower Dy/Yb (<0.3) ratios than infertile suites [18]. The REE patterns for fertile suites are characterized by positive Ce anomalies and depletion of light rare earth elements (LREE). However, the infertile suites have conspicuous negative Eu anomalies, whereas the fertile suites hosting porphyry Cu ± Mo ± Au deposits have only minimal negative Eu anomalies [18].
We observed that the REE patterns from Mollehuaca are similar to the patterns that Lu et al. (2016) associated with fertile magmas, characterized by positive Ce anomalies and minimal negative Eu anomalies (Figure 12A). We demonstrated that the zircon analyzed from the Mollehuaca sample is within the field of fertile suites for Cu ± Mo ± Au systems (Figure 12B).
Furthermore, on the Eu/Eu * versus Dy/Yb plot [18], the fertile suites mostly have lower Dy/Yb (<0.3) and higher Eu/Eu * (>0.3) ratios than infertile suites, consistent with amphibole fractionation and suppression of plagioclase crystallization in the fertile suites [18].
Previous studies on the zircon texture [17] suggest that there is a correlation between a specific zircon texture and trace element chemistry. Bouzari et al. (2019) showed that zircon grains with oscillatory zoning are a key diagnostic feature in the exploration of porphyry-fertile plutons. In our study, the principal zircon texture is oscillatory zoning, similar to shown by Bouzari et al. (2019).
Our data suggest that zircon geochemistry and zircon texture may be indicators of magma fertility for intrusions hosting mesothermal or other deposit types. We suggest that additional case studies should examine whether the observed zircon signatures are consistent across a greater range of deposit types than previously recognized, in which case zircon geochemistry may become a valuable tool to discriminate fertile from infertile plutons in a variety of geological settings.

7.3. Nazca-Ocoña Belt Age

Previous studies [4,5,6] mentioned that Mollehuaca and San Juan de Chorunga deposits are part of a Late Cretaceous (younger than 100.5 Ma) metallogenic belt hosting a number of Au-Pb-Zn-Cu deposits emplaced into granitoids belonging to the Coastal Batholith in Arequipa-Perú.
Our U-Pb dating conducted on zircon from the wall rock on the mineralized veins at Mollehuaca suggest that veins are hosted in Early Cretaceous intrusive rocks (129.2 ± 1.0 Ma; U-Pb in zircon) (Supplementary File S2; Figure 13). Our interpreted age is younger than a previously published age of 140.5 ± 0.87 Ma for an intrusion at Mollehuaca (U-Pb in zircon; granodiorite; [31]). In the vicinity of San Juan de Chorunga, the ages of other dated intrusive rocks are 135 ± 1 Ma (U-Pb in zircon; tonalite; [31]), 136 ± 1 Ma (Ar-Ar in biotite; granodiorite; [32]) and 137 ± 1.8 Ma (Ar-Ar in biotite; granodiorite; [32]).
Our secondary biotite 40Ar/39Ar date (95.86 ± 0.05 Ma) suggests that gold mineralization in Mollehuaca occurred in the Late Cretaceous, significantly after the igneous crystallization of the Early Cretaceous granodiorite. Our data and the previously published geochronological information leave open the possibility of redefining the important ages in the metallogenic belt, motivating further studies in the Nazca-Ocoña zone.

7.4. Environmental Considerations

Artisanal and small-scale gold mining is widespread in Perú, where approximately 30,000 direct workers and 180,000 dependents are involved in this activity [1]. In Arequipa, small-scale mining activities occur in several areas, where miners and communities are exposed to adverse environmental conditions due to the current mining and mineral processing techniques.
Gold and silver in the vein systems are found with highly variable amounts of base metals sulfides (sphalerite, galena, and chalcopyrite). In the Nazca-Ocoña belt, the processing of gold ores is conducted by traditional methods, using amalgamation, cyanidation, or a combination of both methods [15,33,34,35,36]. We identified coloradoite in the sulfide zone of the veins (Figure 7E,F), as well as As, Bi, Cd, Pb, Sb, and Zn. Trace element geochemistry of the ore exerts an important control on the environmental signature of small-scale mining, requiring careful management [37,38].
Coloradoite could be a natural source of mercury contamination if released through natural processes or mining activity. Furthermore, EMP analyses in gold and electrum grains show mercury contents ranging from 0.1 to 3.4 wt% Hg (Table 1); this represents a natural source of Hg contamination. This is important to consider in the context of reclamation and regulation of small-scale mining since not all the mercury contamination at these sites is anthropogenic.

8. Conclusions

The Mollehuaca and San Juan de Chorunga deposits appear to be characteristic of the Nazca-Ocoña metallogenic belt, where ore is hosted in vein systems mostly composed of quartz, electrum (AuAg), gold, and sulfides (pyrite, galena, sphalerite, chalcopyrite, and pyrrhotite). The gold content in this vein system is highly variable. Thus, the production and economic values of small-scale mining are also variable from day to day, and from location to location, which may potentially impact the management of small-scale mining in the region.
The zircon geochemical database of LA-ICP-MS analyses from the Mollehuaca intrusion gives ratios of Eu/Eu * (>0.44), 10,000 * (Eu/Eu *)/Y (>1.4), (Ce/Nd)/Y (>0.009), and Dy/Yb (<0.23), and the oscillatory textural characteristic in zircon indicate that the granodiorite wall rock belongs to a series of fertile suites for Cu ± Mo ± Au systems (Supplementary File S2, Figure 12).
Our U-Pb dating of zircon from the granodiorite hosting the veins in Mollehuaca shows that the intrusion is of Early Cretaceous age (129.2 ± 1.0 Ma). The timing of the gold mineralization in Mollehuaca is constrained to the Late Cretaceous by our 40Ar/39Ar dating of secondary biotite in the vein (95.86 ± 0.05 Ma).
Artisanal small-scale miners in the Nazca-Ocoña belt used amalgamation, cyanidation, or a mixing of both methods during gold ore processing. Our SEM-based observations show the presence of mercury tellurides, and EMP analyses in gold and electrum minerals showed significant Hg contents with an average value of 1 wt% in its chemical composition (Table 1). These Hg-bearing minerals could be a natural source of mercury pollution if released during mining activity. Our results indicate that not all the mercury in the associated environmental contamination is anthropogenic; some is natural.
The data obtained in this study will be used to develop predictive models for the exploration, metallogeny, geometallurgy, and environmental geochemistry of the sites and the region. These models will be used to identify alternative practices that will improve the sustainability of the mining activities throughout the mining lifecycle.

Supplementary Materials

The following are available online at https://www.mdpi.com/2075-163X/10/12/1112/s1.

Author Contributions

J.C., R.H., and M.G. performed the fieldwork and collected the samples. J.C. studied the samples using optical microscopy, FE-SEM, and EMPA. All authors (J.C., E.H., K.P., M.G., and R.H.) discussed the results and evaluated the data. J.C., E.H., and K.P. wrote, organized, reviewed, and edited the original draft paper. All authors have read and agreed to the published version of the manuscript.

Funding

This study was funded by the Center for Mining Sustainability (Universidad Nacional de San Agustín, Arequipa, Perú and Colorado School of Mines).

Acknowledgments

The authors would like to thank “The Center for Mining Sustainability”, Universidad Nacional San Agustín, Arequipa, Perú, Colorado School of Mines for providing the funds to perform this study. We thank Century Mining Company and the Small-Scale Miners of Mollehuaca for providing access to the mine sites. We thank Jim Crowley from the Isotopic Ge-ology Laboratory at Boise State University for performing the geochronological analysis and Heather Lowers at the United States Geological Survey Center for Geology, Geophysics and Ge-ochemistry for assistance with electron microprobe analyses. We thank Richard Palin in drafting Figure 11 and Figure 14.

Conflicts of Interest

The authors declare no conflict of interest.

References

  1. Hilson, G.; Maconachie, R. Formalising artisanal and small-scale mining: Insights, contestations and clarifications. Area 2017, 49, 443–451. [Google Scholar] [CrossRef]
  2. Sousa, R.N.; Veiga, M.M.; Klein, B.; Telmer, K.; Gunson, A.J.; Bernaudat, L. Strategies for reducing the environmental impact of reprocessing mercury-contaminated tailings in the artisanal and small-scale gold mining sector: Insights from Tapajos River Basin, Brazil. J. Clean. Prod. 2010, 18, 1757–1766. [Google Scholar] [CrossRef]
  3. Stocklin-Weinberg, R.; Veiga, M.M.; Marshall, B.G. Training artisanal miners: A proposed framework with performance evaluation indicators. Sci. Total Environ. 2019, 660, 1533–1541. [Google Scholar] [CrossRef] [PubMed]
  4. Acosta, J. Características metalogenéticas de los yacimientos asociados a los arcos magmáticos mesozoicos y cenozoicos del sur del Perú. In Informe Técnico Interno DGEPM; INGEMMET: Lima, Peru, 2006; pp. 20–26. [Google Scholar]
  5. Acosta, J.; Quispe, J.; Santiesteban, A.; Acosta, H. Épocas metalogenéticas y tipos de yacimientos metálicos en la margen occidental del Sur del Perú: Latitudes 14° S–18° S. In Proceedings of the Resúmenes Extendidos XIV Congreso Peruano de Geología, Lima, Peru, 20 Septiembre–3 October 2008. [Google Scholar]
  6. Acosta, J.; Rivera, R.; Valencia, M.; Chirif, H.; Huancacuni, D.; Rodriguex, I.; Villareal, E.; Paico, D.; Santiesteban, A. Mapa Metalogenético del Perú 2009. Informe Técnico; INGEMMET: Lima, Peru, 2009. [Google Scholar]
  7. Acosta, J.; Santiesteban, A.; Huanacuni, D.; Valencia, M.; Villareal, E. Producción de Oro y Plata en el Perú: Pasado, Presente y Futuro. In Proceedings of the 11th Simposium del Oro y la Plata, Lima, Peru, 20–23 May 2014. [Google Scholar]
  8. Boekhout, F.; Sempéré, T.; Spikings, R.; Schaltegger, U. Late Paleozoic to Jurassic chronostratigraphy of coastal southern Perú: Temporal evolution of sedimentation along an active margin. J. S. Am. Earth Sci. 2013, 47, 179–200. [Google Scholar] [CrossRef]
  9. Agar, R. Copper mineralization and magmatic hydrothermal brines in the Rio Pisco section of the Peruvian Coastal Batholith. Econ. Geol. 1981, 76, 677–693. [Google Scholar] [CrossRef]
  10. Pitcher, W. The anatomy of a batholith. Geol. Soc. Lond. J. 1978, 135, 157–180. [Google Scholar] [CrossRef]
  11. Mukasa, S.B. Zircon U-Pb ages of super-units in the Coastal batholith, Perú: Implications for magmatic and tectonic processes. Geol. Soc. Am. Bull. 1986, 97, 241–254. [Google Scholar] [CrossRef]
  12. Cobbing, E.J.; Ozard, J.M.; Snelling, N.J. Reconnaissance geochronology of the crystalline basement rocks of the Coastal Cordillera of southern Perú. Geol. Soc. Am. Bull. 1977, 88, 241–246. [Google Scholar] [CrossRef]
  13. Pitcher, W.; Atherton, M.; Cobbing, E.; Beckinsale, R. Magmatismo en el borde de una placa, Los Andes Peruanos. Brit. Geol. Surv. 1985, 359. [Google Scholar]
  14. Watson, E.B.; Wark, D.A.; Thomas, J.B. Crystallization thermometers for zircon and rutile. Contrib. Miner. Petr. 2006, 151, 413. [Google Scholar] [CrossRef]
  15. McIntosh, W.C.; Heizler, M.; Peters, L.; Esser, R. 40Ar/39Ar geochronology at the New Mexico Bureau of Geology and Mineral Resources; New Mexico Bureau of Geology: Socorro, New Mexico, 2003; Open File Report OF-AR-1; p. 10. [Google Scholar]
  16. Alfonso, P.; Anticoi, H.; Yubero, T.; Bascompta, M.; Henao, L.; Garcia-Valles, M.; Yáñez, J. The importance of mineralogical knowledge in the sustainability of artisanal gold mining: A mid-south Perú case. Minerals 2019, 9, 345. [Google Scholar] [CrossRef] [Green Version]
  17. Bouzari, F.; Hart, C.J.R. Assessing British Columbia porphyry fertility using zircons. In Geoscience BCSummary of Activities; Report 2019-1; Minerals and Mining, Geoscience BC: Vancouver, BC, USA, 2018. [Google Scholar]
  18. Lu, Y.J.; Loucks, R.R.; Fiorentini, M.L.; McCuaig, T.C.; Evans, N.J.; Yang, Z.M.; Hou, Z.Q.; Kirkland, C.L.; Parra-Avila, L.A.; Kobussen, A. Zircon compositions as a pathfinder for porphyry Cu ± Mo ± Au mineral deposits. Econ. Geol. 2016, 19, 329–347. [Google Scholar]
  19. Sillitoe, R.H.; Thompson, J.F. Intrusion–Related Vein Gold Deposits: Types, Tectono-Magmatic Settings and Difficulties of Distinction from Orogenic Gold Deposits. Resour. Geol. 1998, 48, 237–250. [Google Scholar] [CrossRef]
  20. De Montreuil, L. Ocurrencia de oro y sus asociaciones mineralógicas en la faja aurífera Nazca-Ocoña. In Programa Científico Cultural; INGEMMET: Lima, Peru, 1979; pp. 25–48. [Google Scholar]
  21. De Montreuil, L. Mineralogía de los yacimientos auríferos en el Perú. Resumen extendido. In Proceedings of the II Simposium Internacional del Oro, Lima, Peru, 7–10 May 1996; pp. 307–343. [Google Scholar]
  22. Cardozo, M.; Cedillo, E. Geologic-metallogenetic evolution of the Peruvian Andes. In Stratabound ore Deposits in the Andes; Springer: Berlin/Heidelberg, Germany, 1990; pp. 37–60. [Google Scholar]
  23. Acosta, J.; Quispe, J.; Rivera, R.; Valencia, M.; Chirif, H.; Huanacuni, D.; Rodríguez, I.; Villarreal, E.; Paico, D.; Santisteban, A. Mapa Metalogenético del Oro en el Perú; INGEMET: Lima, Peru, 2010. [Google Scholar]
  24. Palacios, S.; Alfonso, P.; Mata-Perello, J.M. Caracterización del Yacimiento de Oro de Misky, Sur del Perú. Macla 2011, 15, 159–160. [Google Scholar]
  25. Schreiber, D.W.; Amstutz, G.C.; Fontboté, L. The formation of auriferous quartz-sulfide veins in the Pataz region, northern Peru: A synthesis of geological, mineralogical, and geochemical data. Miner. Depos. 1990, 25, 136–140. [Google Scholar] [CrossRef] [Green Version]
  26. Haeberlin, Y.; Moritz, R.; Fontboté, L.; Cosca, M. Carboniferous orogenic gold deposits at Pataz, Eastern Andean Cordillera, Peru: Geological and structural framework, paragenesis, alteration, and 40Ar/39Ar geochronology. Econ. Geol. 2004, 99, 73–112. [Google Scholar] [CrossRef] [Green Version]
  27. Voute, F.; Hagemann, S.G.; Evans, N.J. Sulfur isotopes, trace element, and textural analyses of pyrite, arsenopyrite and base metal sulfides associated with gold mineralization in the Pataz-Parcoy district, Peru: Implication for paragenesis, fluid source, and gold deposition mechanisms. Miner. Depos. 2019, 54, 1077–1100. [Google Scholar] [CrossRef]
  28. Sillitoe, R.H. Exploration and discovery of base and precious metal deposits in the circum Pacific region during the last 25 years. Resour. Geol. Spec. Issue 1995, 19, 119. [Google Scholar]
  29. Sillitoe, R.H. Exploration and discovery of base and precious metal deposits in the circum Pacific region a late 1990s update. Resour. Geol. 2000, 21, 65. [Google Scholar]
  30. Loader, M.A.; Wilkinson, J.J.; Armstrong, R.N. The effect of titanite crystallization on Eu and Ce anomalies in zircon and its implications for the assessment of porphyry Cu deposit fertility. Earth Planet. Sci. Lett. 2017, 472, 107–119. [Google Scholar] [CrossRef] [Green Version]
  31. Geocatmin-Ingemmet Database. Available online: https://geocatmin.ingemmet.gob.pe/geocatmin/ (accessed on 3 August 2020).
  32. Schildgen, T.F.; Ehlers, T.A.; Whipp, D.M.; Van Soest, M.C.; Whipple, K.X.; Hodges, K.V. Quantifying canyon incision and Andean Plateau surface uplift, southwest Perú: A thermochronometer and numerical modeling approach. J. Geophys. Res. Earth 2009, 114, F4. [Google Scholar] [CrossRef] [Green Version]
  33. Loredo, J.; Soto, J.; Ordonez, A.; Alvarez, R. Mercury and arsenic pollution associated to artisanal gold mining in Huanca (Ayacucho Department, Perú). Fresen. Environ. Bull. 2009, 18, 391–398. [Google Scholar]
  34. Gibb, H.; O’Leary, K.G. Mercury exposure and health impacts among individuals in the artisanal and small-scale gold mining community: A comprehensive review. Environ. Health Persp. 2014, 122, 667–672. [Google Scholar] [CrossRef]
  35. Esdaile, L.; Chalker, J.M. The Mercury Problem in Artisanal and Small-Scale Gold Mining. Chem. Eur. J. 2018, 24, 6905–6916. [Google Scholar] [CrossRef] [PubMed] [Green Version]
  36. Plumlee, G.S. The environmental geology of mineral deposits. The environmental geochemistry of mineral deposits. Part A: Processes, techniques and health issues. Econ. Geol. 1999, 6A, 71–116. [Google Scholar]
  37. Lottermoser, B.G. Sulfidic mine wastes. In Mine Wastes; Springer: Berlin/Heidelberg, Germany, 2010; pp. 43–117. [Google Scholar]
  38. Plumlee, G.S.; Smith, K.S.; Montour, M.R.; Ficklin, W.H.; Mosier, E.L. Geologic controls on the composition of natural waters and mine waters draining diverse mineral-deposit types. The environmental geochemistry of mineral deposits. Econ. Geol. 1999, 6, 373–432. [Google Scholar]
Figure 1. Geological regional map of Arequipa-Perú. Modified after INGEMMET Regional Map of Peru scale 1:100,000.
Minerals 10 01112 g001
Figure 2. Quartz-calcite veins. (A) San Juan vein located in the sulfide zone in San Juan de Chorunga deposit; (B) Virucha vein located in the oxide zone in Mollehuaca deposit.
Minerals 10 01112 g002
Figure 3. Host rock mineralogy and alteration. (A) Granodiorite with phaneritic texture; (B) Transmitted light microscopy image from granodiorite, biotite present chlorite-epidote alteration, and plagioclase present weak sericitic alteration.
Minerals 10 01112 g003
Figure 4. Reflected and transmitted light microscopy images of the alteration minerals assembly in the veins from Mollehuaca and San Juan de Chorunga, Arequipa-Perú. (A) Quartz vein-type 3 cutting quartz 1, the vein is filled with pyrite; (B) Quartz types 1, 3, and calcite; (C) Quartz-sericite-calcite mineral association; (D) Quartz-calcite-chlorite-sericite mineral association; (E) Calcite, sericite, quartz 3, and pyrite; (F) Chlorite cavity filling in pyrite and quartz 1; (G) Calcite microvein is cutting rhombic calcite; (H) Quartz-chlorite-siderite mineral association; (I) Colloform bands of hematite in supergene zone.
Minerals 10 01112 g004
Figure 5. Reflected light microscopy images of gold in quartz veins from Mollehuaca and San Juan de Chorunga, Arequipa-Perú. (A) Free gold filling fractures in quartz-calcite microvein; (B) Gold microinclusions in pyrite; (C) Free gold on the edge of quartz and calcite grains; (D,E) Fractures and cavities filled with gold; (F) Inclusion of gold in calcite microvein, associated with pyrrhotite.
Minerals 10 01112 g005
Figure 6. FE-SEM images of micro to nano-sized inclusions in quartz-calcite veins; (A) Anhedral micro inclusion of electrum in calcite microvein; (B) Anhedral micro inclusion of electrum in quartz vein; (C) Electrum in intergrown texture with pyrrhotite in calcite microvein; (D) Electrum filling fracture in pyrite, associated with galena; (E) Electrum along grain boundaries between pyrite and chalcopyrite; (F) Electrum along grain boundaries between pyrite and arsenopyrite, in association with galena; (G,H) Electrum and Bi-bearing minerals along grain boundaries in pyrite; (I) nano inclusion of Au in Bi-bearing mineral.
Minerals 10 01112 g006
Figure 7. FE-SEM images of Au nano-sized inclusions, Ag-bearing minerals, and coloradoite; (A) and (B) nano inclusions of Au in iron oxyhydroxides; sample from the supergene zone; (C) Acanthite filling fracture in chalcopyrite; sample from the sulfide zone; (D) Iodargyrite filling cavities in iron oxyhydroxides; sample from the oxide mineralization zone; (E,F) Coloradoite in intergrown texture with emplectite along grain boundary with quartz; sample from the sulfide zone.
Minerals 10 01112 g007
Figure 8. Gold and silver concentrations scatterplot for gold and electrum (EMPA data) from deposits in the Arequipa region. Data are plotted in weight per cent (wt%). Mollehuaca and San Juan de Chorunga data set in this study. Misky, Santa Filomena, San Cristóbal, Cháparra, and San Luis data set are from Alfonso et al., 2019.
Minerals 10 01112 g008
Figure 9. Reflected light microscopy images of sulfides from the veins. (A) Bi-bearing minerals and gold are filling fractures in pyrite; (B) Pyrite has an intergrown texture with galena, chalcopyrite, and sphalerite; (C) Bi-bearing minerals are filling cavity in pyrite; (D) Native gold occurs in the grain boundaries between pyrite and arsenopyrite; (E) Sphalerite, chalcopyrite, and pyrite; (F) Chalcopyrite in exsolution texture in sphalerite; (G) Pyrite, sphalerite, and galena; (H) Magnetite and ilmenite in transitional zone; (I) Hematite in oxide zone.
Minerals 10 01112 g009
Figure 10. Paragenetic ore and gangue mineral associations from Mollehuaca and San Juan de Chorunga vein systems.
Minerals 10 01112 g010
Figure 11. Paragenetic events in the sulfide zone in San Juan de Chorunga vein system (sample SNJ-PET-05).
Minerals 10 01112 g011
Figure 12. Zircon geochemistry. (A) C1 chondrite-normalized rare earth elements (REE) patterns of zircon from Mollehuaca; normalization values of Sun and McDonough (1989); (B) Zircon Eu/Eu * vs. (Ce/Nd)/Y plot. Mollehuaca zircon Eu/Eu * values (>0.44) and (Ce/Nd)/Y ratios (>0.01); (C) Zircon 10,000*(Eu/Eu *)/Y vs. (Ce/Nd)/Y plot; (D) Zircon Eu/Eu * vs. Dy/Yb plot, showing that the fertile suites from Mollehuaca have low Dy/Yb (<0.23) ratios.
Minerals 10 01112 g012
Figure 13. Geochronology. U-Pb age determination in zircon from wall rock hosting veins at Mollehuaca and 40Ar/39Ar age of secondary biotite alteration. (A) Cathodoluminescence microscopy images; (B) Tera-Wasserburg plot; (C) Frequency histogram; (D) Probability density plot and (E) Incremental 40Ar/39Ar release patterns of secondary biotite sample. In all panels, errors are considered at 2σ level. rej.: rejected.
Minerals 10 01112 g013
Figure 14. Cross section of mineralization zones. (A) San Juan de Chorunga sector (San Juan vein), (B) Mollehuaca sector (Virucha Capitana vein). Qz = quartz; Cal = calcite; OxFe = iron oxyhydroxides; OxCu = copper oxides; Sd = siderite; Py = pyrite; Gn = galena; Ccp = chalcopyrite.
Minerals 10 01112 g014
Table 1. Summary of statistical electron microprobe (EMP) analyses (wt%) from native gold and electrum from Mollehuaca and San Juan de Chorunga, Arequipa-Peru. (nAu = 87; nelectrum = 20).
Electrum
Au (wt%)Ag (wt%)Hg (wt%)Fe (wt%)S (wt%)In (wt%)Sn (wt%)
Minimum58.0414.330.490.050.040.040.03
Maximum84.4137.431.921.360.460.090.07
Median65.9432.361.060.200.120.060.05
Average70.1228.121.050.320.170.060.05
Native Gold
Au (wt%)Ag (wt%)Hg (wt%)Fe (wt%)S (wt%)In (wt%)Sn (wt%)
Minimum88.663.670.080.050.030.030.03
Maximum97.149.163.401.862.020.100.07
Median92.327.010.770.430.140.050.04
Average92.636.941.050.520.250.050.05
Table 2. Correlation matrix between Au, Bi, S, Hg, Ag, Sb, Cd, Pb, Zn, Te, Cu, Ni, In, Fe, As, and Mo from quartz veins from Mollehuaca and San Juan de Chorunga, Arequipa-Perú (n = 6).
CorrelationAuBiSHgAgSbCdPbZnTeCuNiInFeAsMo
Au1.0
Bi1.01.0
S1.01.01.0
Hg1.01.01.01.0
Ag1.01.01.01.01.0
Sb1.01.01.01.01.01.0
Cd1.01.01.01.01.01.01.0
Pb1.01.00.91.01.00.81.01.0
Zn0.80.80.70.80.91.00.91.01.0
Te0.80.81.00.80.80.80.70.70.51.0
Cu0.50.50.90.60.60.60.60.50.40.91.0
Ni0.30.2−0.10.20.30.20.40.40.60.10.41.0
In0.20.21.00.30.30.30.20.10.00.70.9−0.31.0
Fe0.10.11.00.10.10.20.10.10.00.50.5−0.20.71.0
As−0.2−0.3−0.6−0.2−0.2−0.2−0.10.00.3−0.4−0.10.6−0.40.11.0
Mo−0.3−0.3−0.7−0.2−0.2−0.2−0.3−0.3−0.30.20.3−0.30.60.90.11.0
Table 3. Whole-vein summary statistical analysis of Au, Hg, As, Cu, Pb, Co, Zn, Sb, Bi, Ag, Fe, S, Mo, Ni, Se, Li, Pd, Te, Cd, Pt, In, and Re from quartz veins from Mollehuaca and San Juan de Chorunga, Arequipa-Perú (n = 6).
ElementAuHgAsCuPbCoZnSbBiAgFeSMoNiSeLiPdTeCd
Unitppbppbppmppmppmppmppmppmppmppmpctpctppmppmppmppmppbppmppm
Count6666666666636646666
Average292,84177656382017949.184.887.530.019.09.56.313.52.51.91.30.70.99.3
Median798015011184027.838.49.65.11.83.05.04.03.12.52.10.60.60.90.2
Min21.010.073.415.90.719.52.30.80.10.90.43.01.61.10.40.40.20.10.0
Max136,00010,00022201720789122303500155100301265.54.22.93.51.42.247.2
Publisher’s Note: MDPI stays neutral with regard to jurisdictional claims in published maps and institutional affiliations.