Article

Effects of Hydraulic Gradient and Clay Type on Permeability of Clay Mineral Materials

Faculty of Engineering, Tottori University, 4-101, Koyama-Minami, Tottori 680-8552, Japan
Minerals 2020, 10(12), 1064; https://doi.org/10.3390/min10121064
Submission received: 30 October 2020 / Revised: 25 November 2020 / Accepted: 26 November 2020 / Published: 27 November 2020
(This article belongs to the Special Issue Clays, Clay Minerals and Geology)

Abstract

:
Considering the relevance of clay mineral-bearing geomaterials in landslide/mass movement hazard assessment, various engineering projects for resource development, and stability evaluation of underground space utilization, it is important to understand the permeability of these clay mineral-based geomaterials. However, only a few quantitative data have been reported to date regarding the effects of the clay mineral type and hydraulic gradient on the permeability of clay mineral materials. This study was conducted to investigate the permeability of clay mineral materials based on the clay mineral type, under different hydraulic gradient conditions, through a constant-pressure permeability test. Comparative tests have revealed that the difference in the types of clay mineral influences the swelling pressure and hydraulic conductivity. In addition, it has been found that the difference in water pressure (hydraulic gradient) affects the hydraulic conductivity of clay mineral materials. The hydraulic conductivity has been found to be closely associated with the specific surface area of the clay mineral material. Furthermore, the hydraulic conductivity value measured is almost consistent with the value calculated theoretically using the Kozeny–Carman equation. Moreover, the hydraulic conductivity is also found to be closely associated with the hydrogen energy, calculated from the consistency index of clay. This result suggests that the hydraulic conductivity of clay mineral materials can be estimated based on the specific surface area and void ratio, or consistency index of clay.

1. Introduction

Clay mineral materials have various industrial applications owing to their unique properties, such as plasticity, expansion, swelling, ion exchange, dispersion, flocculation, and adsorption [1,2,3]. Clay mineral-based geomaterials have low strength and undergo mechanical and chemical degradation of texture to a large extent owing to the effect of clay mineral content. Owing to these degradations, the presence of clay minerals (particularly smectite) is listed as one of the main factors that cause landslides, heaving, and the collapse of construction work. Because the engineered barriers and backfill for the geological disposal of radioactive wastes require ultra-long-term stabilization, the use of compacted sodium-type bentonite for this purpose is gaining considerable attention. In the geotechnical field, many researchers/engineers have studied the mechanical properties of montmorillonite-bearing materials [4,5,6,7,8,9,10,11] and the swelling characteristics and permeability of montmorillonite [12,13,14,15,16,17,18,19,20]. Montmorillonite is a type of smectite and is a swelling clay mineral. In the field of clay mineralogy, there is a plethora of literature on the permeability of clay minerals [21,22,23,24]. For instance, Pusch [21] studied the swelling pressure and hydraulic conductivity of various clay minerals, such as kaolinite, smectite, and palygorskite. Sellin and Leupin [22] reviewed most of the results (over the past 35 years) on the safety-relevant properties of clay that were applied to the engineered barriers for the geological disposal of radioactive waste. Kato et al. [23] reported the permeability of mica clay mineral samples using a transient pulse method. Kohno et al. [24] reported the results of a permeability test (conducted under constant pressure) on the samples containing only one specific type of clay mineral (kaolinite, 1.0 nm halloysite, talc, mica, or chlorite) and clarified the influence of clay mineralogy on hydraulic conductivity.
Furthermore, the alteration by volcanic hydrothermal systems and the formation of crushing and weathering zones over geological time have occurred widely throughout the Pacific region and worldwide. As a result of these geological phenomena, a wide variety of clay minerals can be found in the Earth’s crust [25,26,27,28,29,30,31,32,33]. In the study conducted by Nishimoto and Yoshida [27], a fractured rock filled with clay was found at a depth of 200 m by drilling through the Toki granite in Gifu, Central Japan, using a core drill core. This phenomenon can also be observed in the fractures in granites found at depths of 300 m and 500 m below the ground level at the Mizunami Underground Research Laboratory in Central Japan. The rock fractures are filled with clay due to the infiltration of groundwater through the damaged zone [30,34]. The physical and mechanical properties of clay fault gouge and clay mineral transformations within fault gouges have been intensively studied by many researchers [26,31,35,36,37,38,39,40,41]. In general, the clay layer is a weak layer and has low permeability. In the case of a rock mass with a macro-fracture filled with clay minerals, the clay layer will have a significant effect on the mechanical and hydraulic behaviors of the rock mass. Therefore, while mining natural resources (e.g., geothermal energy, petroleum gas, shale gas, methane hydrate), care must be taken regarding the presence of clay minerals, in addition to discontinuity. Furthermore, it is generally considered that the physical and mechanical properties, including the permeability of rock materials intercalating clay minerals, vary significantly based on the clay mineral type, as evidenced by their structures and chemical compositions. Therefore, it is vital to note the clay mineral type to evaluate the mechanical properties of clay mineral-bearing geomaterials. As mentioned above, in natural resource mining, it is important to understand the permeability of rock mass, including macro-fractures filled with clay minerals. Many studies have been conducted on the permeability of macro-fractured rock filled with clay minerals [34,40,42]. Wang et al. [40] measured the permeability of macro-fractured basalt samples, unfilled as well as infilled with gouge. The results showed that the permeability decreased with increasing effective pressure; however, the unfilled fractures exhibited a greater decrease in permeability than the gouge-filled fractures. Pérez-Flores et al. [42] measured the permeability of macro-fractured Seljadalur basalt with an infilled layer of gouge. They demonstrated that filling the fractures with a synthetic fault gouge decreased the permeability. Nara et al. [34] investigated the permeabilities of granite samples, including a macro-fractured sample filled with clay and a mineral vein. They reported that the permeability of granite increased owing to the existence of fractures; however, it decreased upon filling the fractures with fine-grained minerals. However, in these studies, the type of clay mineral filling has not been adequately focused on. Furthermore, in the case of clay minerals with low permeability, it is known that the hydraulic gradient affects the permeability [43,44]. The effects of hydraulic gradient on the permeability were first described by Hansbo [44]. As mentioned above, although some studies have considered the swelling characteristics and permeability of various clay minerals [21,22,24], very few studies have attempted to actually determine the swelling characteristics and permeability of the various clay minerals under different hydraulic gradient conditions.
This study aims to investigate the permeability of compacted clays based on the clay mineral type, under different hydraulic gradient conditions, through a constant-pressure permeability test. Furthermore, this study estimates the hydraulic conductivity of compacted clays through the Kozeny–Carman equation [45,46] using the parameters of specific surface area, void ratio of compacted clays, and hydrogen energy obtained from the consistency index of clay minerals. It is essential to evaluate the swelling characteristics and water permeability of clay samples, considering various rock engineering projects for underground space utilization for geological disposal, liquefied petroleum gas stockpiling, and carbon dioxide capture and storage.

2. Materials and Methods

2.1. Sample of Clay Mineral Materials

One-dimensional swelling-pressure and constant-pressure permeability tests were conducted to clarify the influence of the clay mineral type or water pressure on the swelling pressure and hydraulic conductivity in compacted clays containing only one specific type of clay mineral. The constant-pressure permeability test is widely used in the evaluation of compacted bentonite-based materials and also has the advantage of a short experimentation time. The schematic crystal structure of the layer silicates is illustrated in Figure 1 (Shirozu [47]). Layer silicate clay minerals primarily consist of tetrahedral silicate sheets and octahedral hydroxide sheets. By stacking these sheets continuously, clay minerals can be classified into 1:1- and 2:1-layered structures. Furthermore, these are subdivided by differences in composition caused by cation isomorphic substitution. Figure 1 is representative of all the eight types of clay samples used in this study, except for serpentine. The clay mineral samples were mainly composed of kaolinite, 1.0 nm halloysite, pyrophyllite, talc, mica, chlorite, and smectite or vermiculite, respectively. These samples were commercially available as clay powder samples, except for the 1.0 nm halloysite. The samples passed through a 75 µm mesh sieve.
The particle density and specific surface area (Shimadzu Micromeritics Gemini 2375, BET Method, N2 adsorption, 150–200 °C/60 min) of the clay mineral powder samples are presented in Table 1, and the X-ray diffraction patterns (Rigaku Ultima IV diffractometer, CuKα, 40 kV, 20 mA, 0.15 mm receiving slit, 0.5° divergence slit, 2° scattering slit) of the clay mineral powder samples are depicted in Figure 2. The specific surface area was highest for the smectite (swelling clay minerals) powder sample, followed by the 1.0 nm halloysite (swelling clay minerals) and kaolinite powder samples. The specific surface areas of the other clay samples were single-digit values. The consistency limits (liquid limit and plastic limit) and plastic index of the clay mineral powder samples are also presented in Table 1, and the plasticity chart of the clay mineral powder samples is shown in Figure 3. The consistency limits were evaluated in accordance with the test method for liquid limit and plastic limit of soil (JIS A 1205:2009, JGS 0141-2009) [48]. In the plasticity chart of the clay mineral powder samples, the marker of the smectite sample is located above line A (Figure 3), and it is therefore considered to be a sample with low permeability, high dry strength, and high toughness. In contrast, the other samples have a liquid limit wL in the range of 35.98–118.35% and a plastic index Ip in the range of 2.06–41.32; this is considerably smaller than that of the smectite sample (wL = 455.02%, Ip = 396.93). Mica, chlorite, and pyrophyllite on the left side of line B (Figure 3) are considered to be the samples having lower compressibility than those of the 1.0 nm halloysite, kaolinite, talc, and vermiculite samples.

2.2. Experimental Procedure

The sample used for the one-dimensional swelling-pressure and constant-pressure permeability tests had a diameter of 50 mm and a height of 10 mm. Each dried clay mineral material was statically compacted to ensure a void ratio of 0.95. The void ratio (e = ρs/ρd − 1) was calculated by the relationship between particle density (ρs, Table 1) and dry density (i.e., specimen volume). All the specimens had a void ratio of 0.95 ± 0.003. For the swelling clay minerals, the void ratio may change (increase in basal spacing from 1 nm to 1.5 nm) during the experiment. This problem should be addressed in the future. The compacted samples were produced using an apparatus composed of a cylindrical mold, pistons, and an oil pressure jack. The tests were performed at 22 ± 1 °C in a temperature-controlled room using equipment with sufficient rigidity.

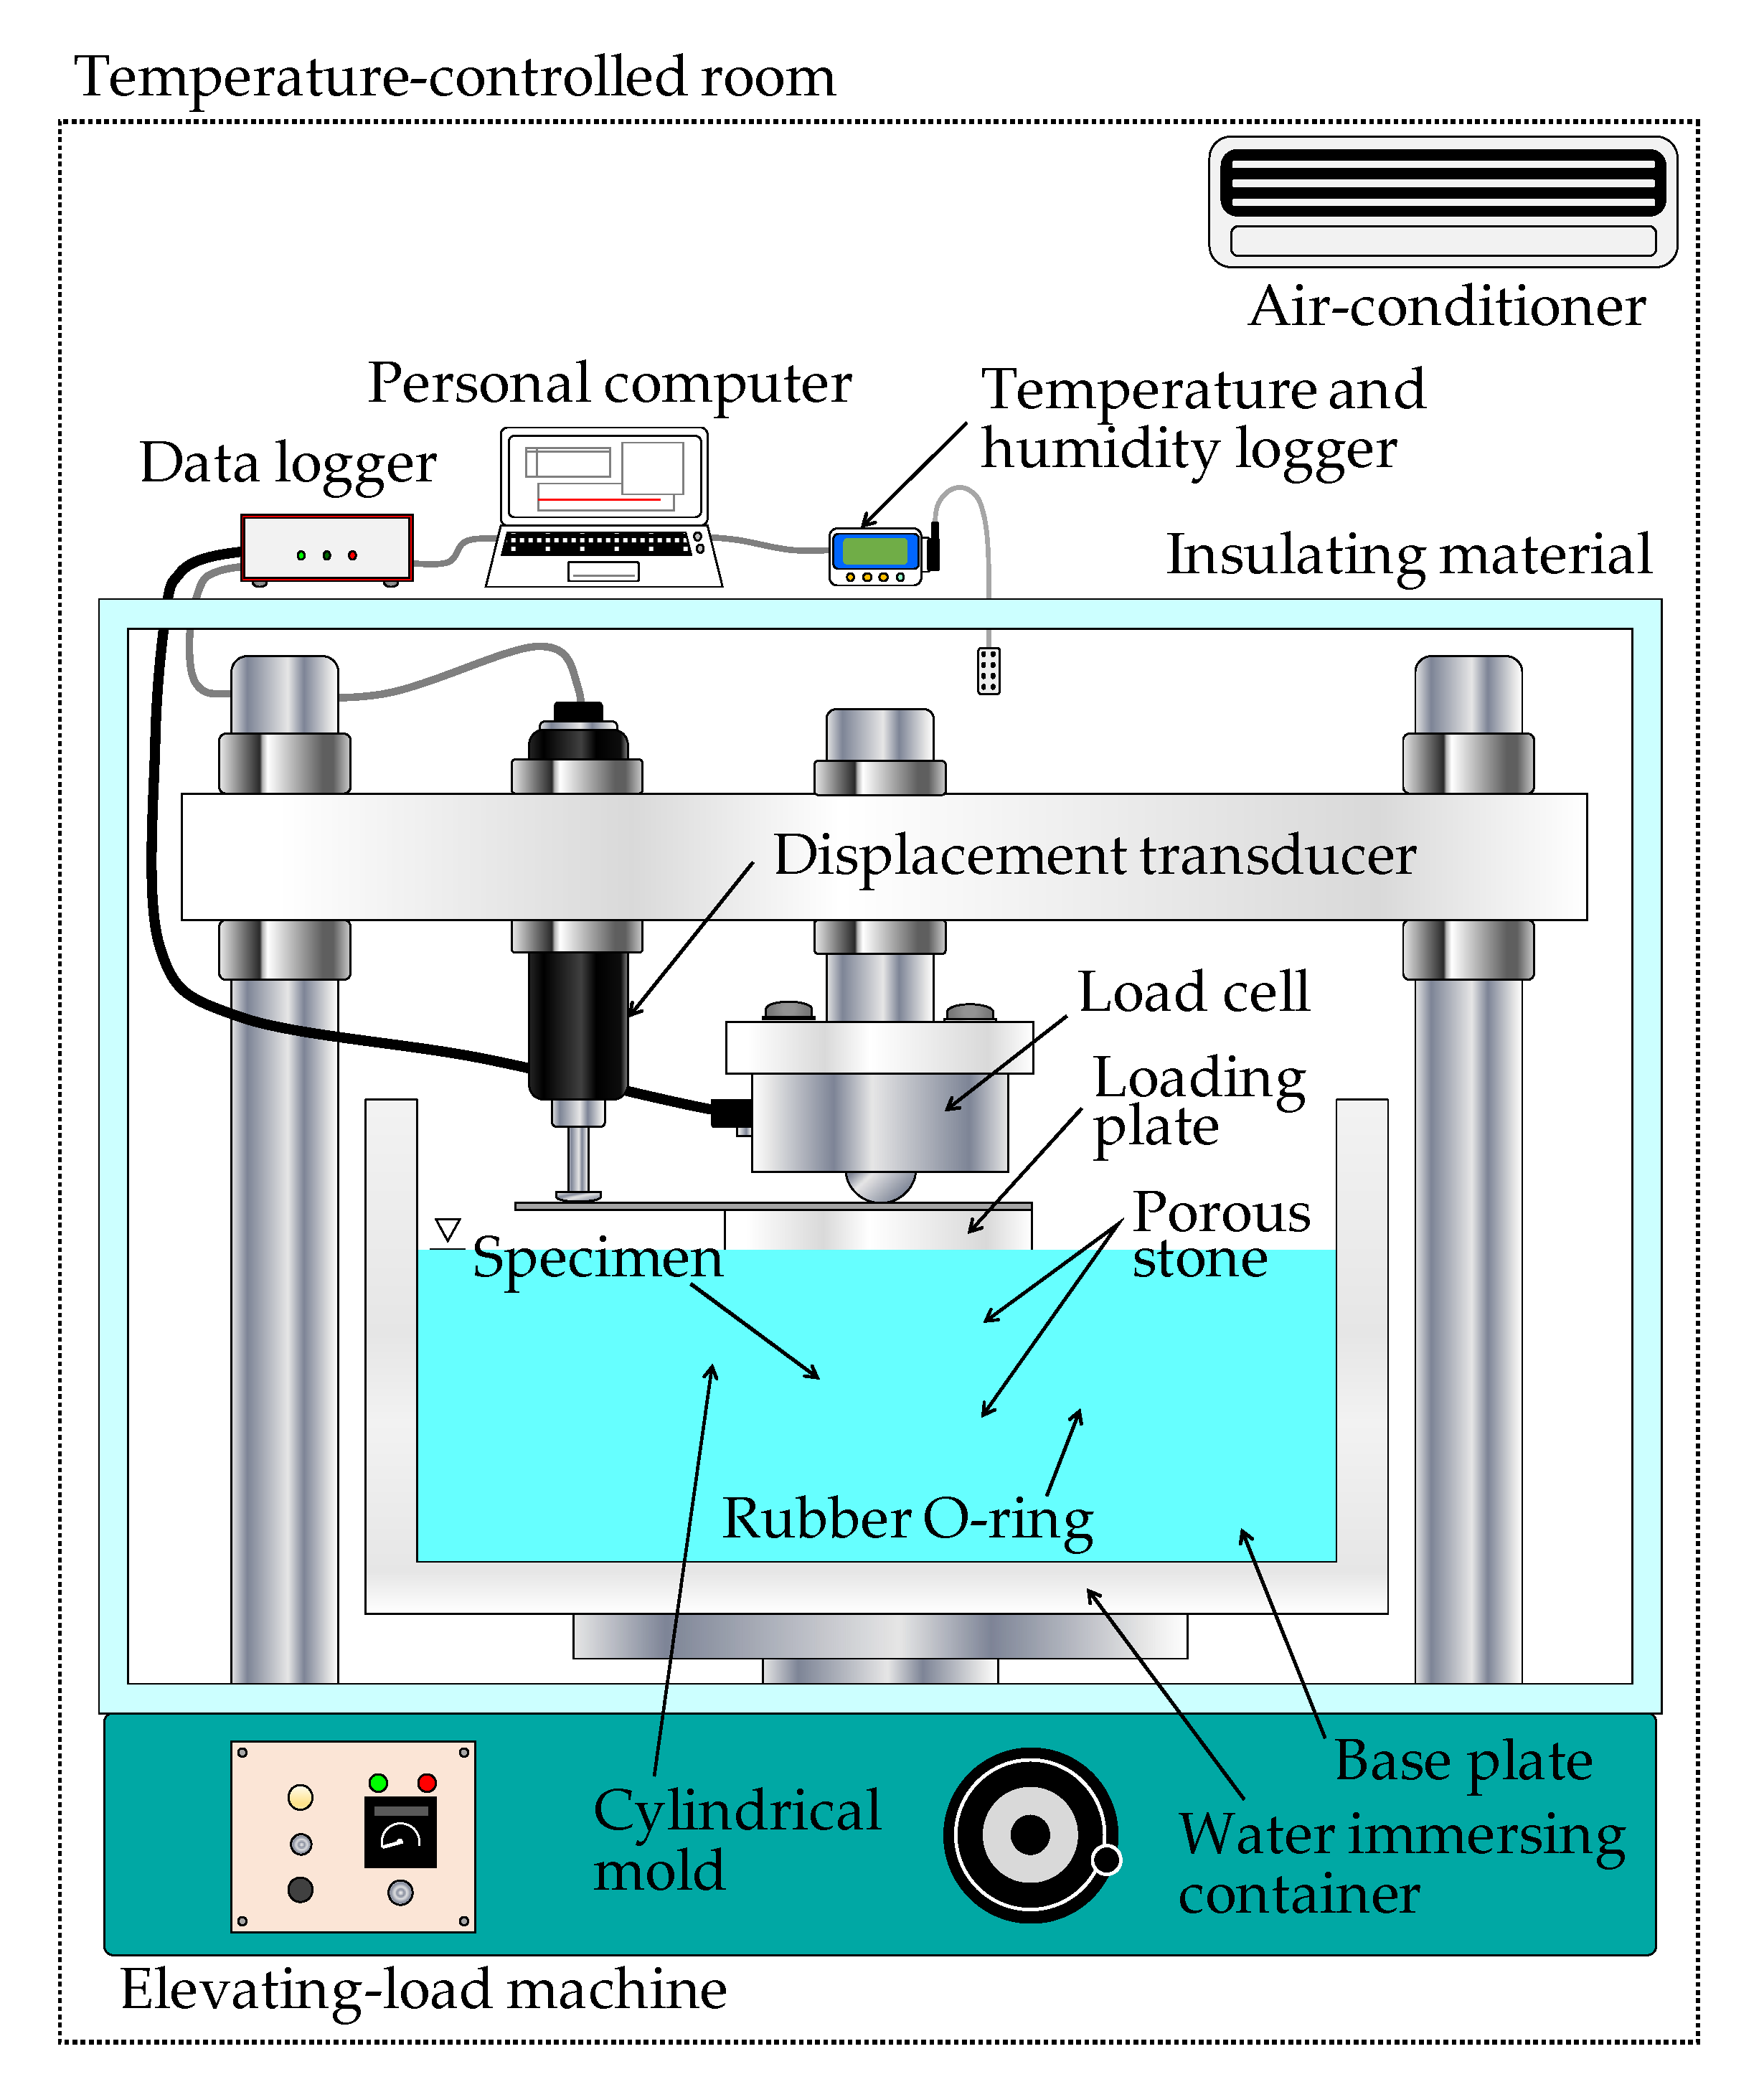
2.2.1. One-Dimensional Swelling-Pressure Test

Figure 4 depicts the experimental configuration (modified version of the experimental setup in the study by Kohno et al. [24]) of the one-dimensional swelling-pressure test. The testing system consists of an elevating-load machine, cylindrical mold (acrylic resin ring), base plate, loading plate, load cell, porous stone, water-immersion container, and displacement transducer.
The test was performed under a constant-volume condition. A sample was placed in the cylindrical mold with a base plate; the assembly was inserted into the water-immersion container, and the container was filled with distilled water. A 0.003 kN load was thereafter applied to ensure a constant height of the sample, and the axial swelling pressure was determined from the vertical force applied during that time. A displacement transducer was used to measure the displacement of the sample throughout the test. The maximum displacement value was 0.01 mm. The swelling pressure is given by:
P s = F A
where Ps is the swelling pressure, F is the vertical force, and A is the cross-sectional area of the sample. A data logger was used to measure the vertical force at intervals of 1 s. The test was conducted for at least 7 days. After the test was completed, the stainless-steel upper base plate was placed on the sample, and the test sample was immersed for 2 days in a water-filled decompression container and further immersed in atmospheric pressure for 2 days. Subsequently, a constant-pressure permeability test was conducted.

2.2.2. Constant Pressure Permeability Test

Figure 5 shows the experimental configuration [24] of the constant-pressure permeability test. The testing system consists of a compressor, water pressure tank, pressure regulator, pressure gauge, water pipe, permeability cylindrical mold (stainless steel), filters (paper and porous stone), rubber O-ring, and electronic balance. The pipe and cylinder are made of stainless steel. An electronic balance (0.1 mg accuracy) was used to measure the amount of water discharge, taking into consideration the effect of evaporation. The runoff volume was measured at intervals of 1 min, and the data were transmitted from the balance to a personal computer. The degree of saturation Sr (=s/w) of the specimens after permeability test was in the range of 109 to 148%, which were exceeding 100%. Therefore, the samples used were ensured to be water-saturated. It has been reported [17,50] that the degree of saturation of bentonite after the permeability test exceeded 100%. Komine et al. [17,50] explain that the causes are the water adheres to the specimen due to the influence of surface tension when measuring the water content and increased density of water molecules around montmorillonite [51,52,53]. Therefore, the samples used were ensured to be water-saturated. Distilled water was passed through the sample under a constant water pressure using a compressor and pressure water tank. Measurements were obtained over 24 h, after the first confirmation of water runoff. The water pressure was set to 0.01, 0.025, 0.05, 0.075, 0.1, 0.2, 0.3, 0.4, and 0.5 MPa. As an exception, the water pressure of the smectite sample was 0.1, 0.2, 0.3, 0.4, and 0.5 MPa. The hydraulic conductivity of clay mineral materials was calculated using Darcy’s law:
k = Q L h A t
where k is the hydraulic conductivity, Q is the runoff volume, L is the height of the sample, h is the difference in water level, A is the cross-sectional area of the sample, and t is time; h is calculated according to the pressure in the water pressure tank, for example, at the water pressure of 0.1 MPa, h is 1020.4 cm.

3. Results and Discussion

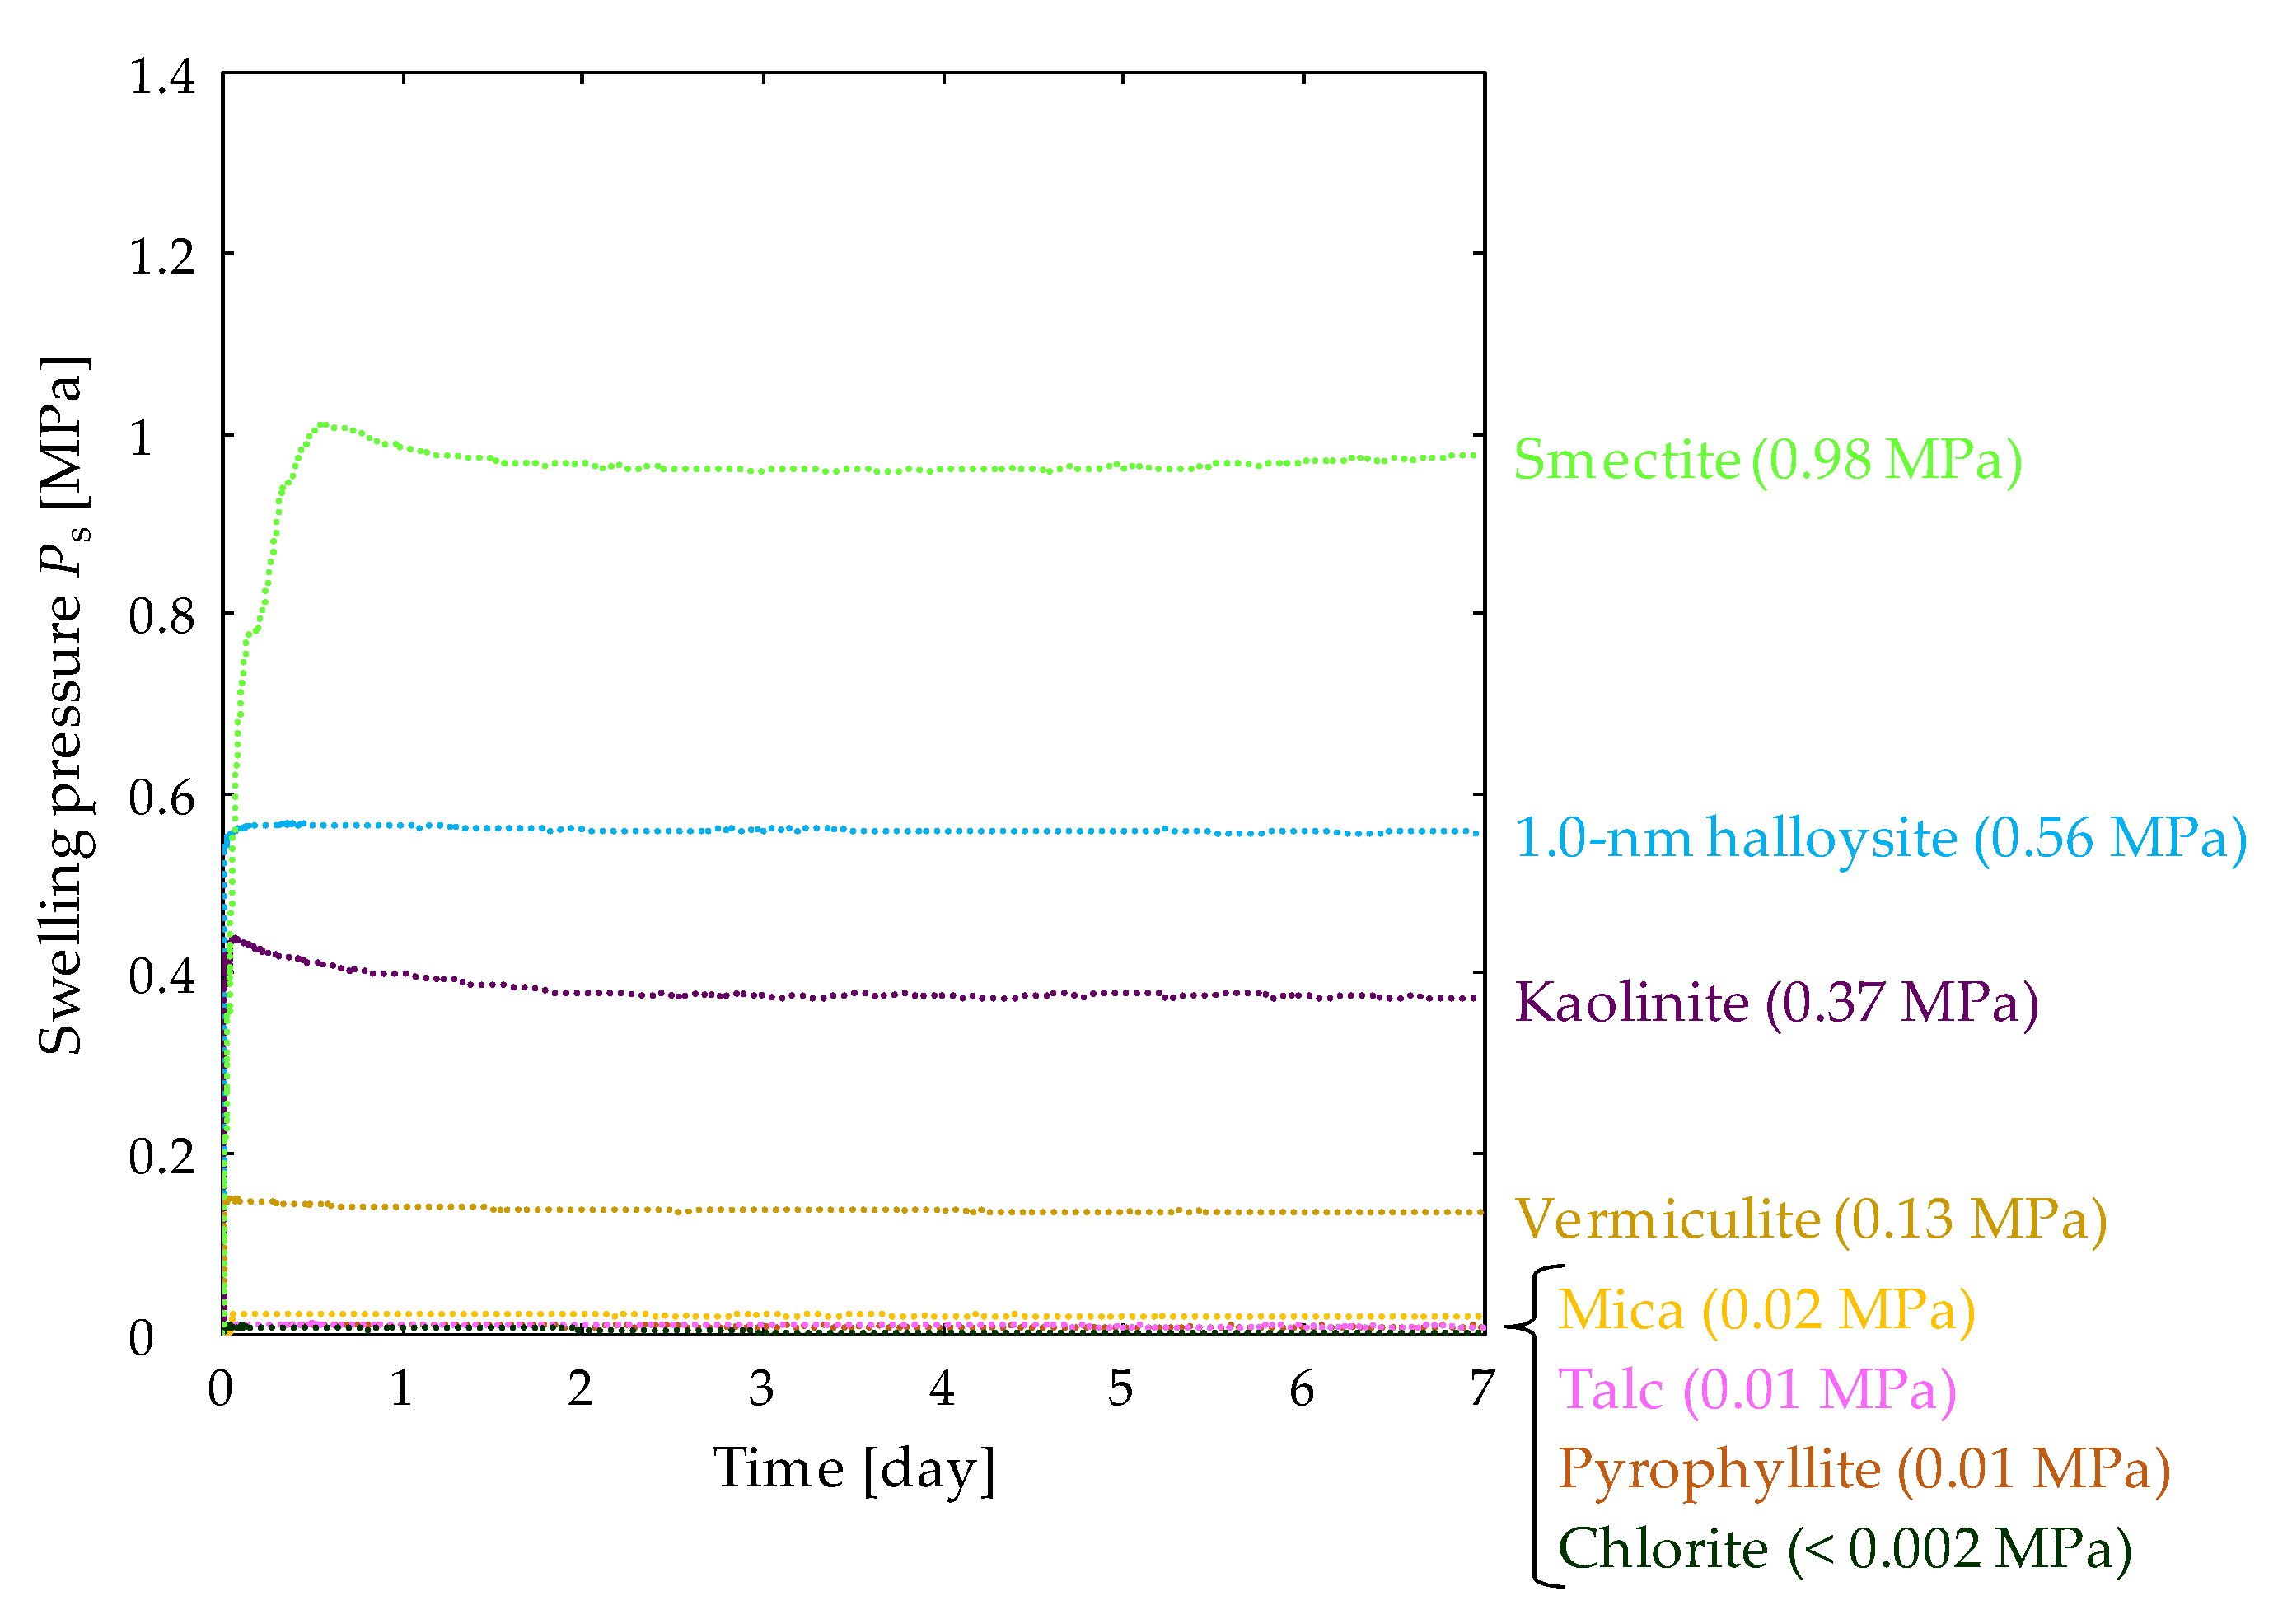
3.1. Swelling Pressure and Hydraulic Conductivity of Clay Mineral Materials

The results of the one-dimensional swelling-pressure test are presented in Table 2 and Figure 6. The swelling pressure is largest for the smectite sample (Ps = 0.98 MPa), followed by the 1.0 nm halloysite (Ps = 0.56 MPa). In contrast, the swelling pressure of the mica, pyrophyllite, talc, and chlorite samples is 0.02 MPa or less; this is an extremely small value indeed. Therefore, it may be concluded that the swelling pressure of the compacted clay varies depending on the clay mineral type.
As can be observed from the schematic crystal structure (Figure 1) of the clay minerals, smectite and 1.0 nm halloysite samples (swelling clay minerals) absorb a large amount of water between the layers when immersed in water. It is considered that this increases the distance between the unit layers and increases the swelling pressure of both the samples. This is well known from many previous studies. However, the swelling clay mineral, vermiculite sample, does not swell at room temperature [2]; therefore, it is considered that it does not exhibit a large swelling pressure. Furthermore, the other non-swelling clay mineral samples do not show the slightest swelling pressure. This does not imply that water is absorbed between the unit layers resulting in swelling; however, it can be considered that the apparent swelling pressure is mainly due to the generation of pore water pressure in the interparticle void due to water immersion. However, the large swelling pressure of the non-swelling clay mineral, kaolinite sample, is considered to be due to the size of the specific surface area (Table 1). In other words, the specific surface area of the kaolinite sample is larger than that of the other non-swelling clay mineral samples. Therefore, it is considered that as the amount of water adsorbed due to surface tension increases, the pore water pressure acting on the interparticle void increases accordingly, and as a result, the swelling pressure becomes larger in the kaolinite sample in comparison with the corresponding values in the other clay samples.
The results of the constant-pressure permeability test are shown in Table 2 and Figure 7. The hydraulic conductivity shown here is the average of the experimental values of 2–9 samples for each type of clay mineral. The average hydraulic conductivity of the clay samples ranges from 10−8 to 10−13 m/s. Hydraulic conductivity is lowest for the smectite sample (k = 3.7 × 10⁻¹³ m/s), followed by the 1.0 nm halloysite and kaolinite samples (k = 10−10 to 10−11 m/s). In contrast, the hydraulic conductivities of the other samples are in the range of 10−8 to 10−9 m/s. Therefore, similar to the result of the swelling-pressure test, the swelling pressure of the compacted clay varies depending on the clay mineral type. Smectite is a swelling clay mineral containing water and cations between the layers; a significantly larger electric double layer [2] is formed in smectite relative to the other clay minerals. It is considered that the formation of an immobile water film due to the electric double layer and the physicochemical phenomenon [54,55] in swelling clay minerals significantly contribute to the hydraulic conductivity of the smectite sample. Similar to the results of the swelling pressure test, the low hydraulic conductivity of the 1.0 nm halloysite and kaolinite samples are considered to be closely related to the size of the specific surface area in comparison with the other clay samples. As mentioned above, when the specific surface area is large, the swelling pressure increases; however, the permeability is also considered to decrease because of the presence of interparticle voids. Furthermore, when the specific surface area is large, the amount of adsorbed water due to surface tension increases; however, this adsorbed water is generally highly viscous [2], which is also one of the factors that reduce the hydraulic conductivity. The effects of surface tension were first described by Terzaghi [56], who reported that the thin layers of water (i.e., adsorbed water) have viscosity.
Figure 7 shows the relationship between the swelling pressure and hydraulic conductivity of the clay mineral samples. The hydraulic conductivity of the clay mineral material decreases with increasing swelling pressure, and the analysis reveals a very strong correlation (correlation coefficient: 0.99) between the two aforementioned parameters. From this result, it is considered that the clay sample with a large swelling pressure tends to exhibit the ability to fill voids and accordingly, the hydraulic conductivity value is small. Furthermore, it has been suggested that the hydraulic conductivity can be estimated only from the swelling pressure without performing the permeability test, or the swelling pressure can be estimated from the hydraulic conductivity without performing the swelling-pressure test.
The above experimental results indicate that when evaluating the permeability of rocks comprising clay minerals, the permeability may differ depending on the type of the clay minerals. Therefore, it is important to note the type of the clay mineral. In the case of ultra-low-permeability materials such as smectite, when the smectite in the material alters into other clay minerals, it causes an increase in the hydraulic conductivity and eventually changes the physical properties of the material.

3.2. Effect of Water Pressure on Hydraulic Conductivity of Clay Mineral Materials

The hydraulic conductivity of clay mineral materials under different water pressure (hydraulic gradient) conditions is shown in Table 3. When the water pressure was gradually increased, water paths were generated in the 1.0 nm halloysite, pyrophyllite, talc, and chlorite samples, as shown in Figure 8. Therefore, the permeability test of these samples could not be performed beyond the water pressure of 0.4 MPa (1.0 nm halloysite), 0.075 MPa (pyrophyllite), 0.2 MPa (talc), and 0.05 MPa (chlorite). Further, multiple craters and very minute water paths were confirmed in the chlorite sample (Figure 8). The presence of the water paths in the pyrophyllite (Ps = 0.01 MPa), talc (Ps = 0.01 MPa), and chlorite (Ps < 0.002 MPa) samples can be attributed to the effect of the water pressure being larger than the swelling pressure. Although the halloysite sample had a water pressure (Pw = 0.4 MPa) smaller than the swelling pressure (0.56 MPa), a water path was generated in this sample. In addition, the kaolinite (Ps = 0.37 MPa) and vermiculite (Ps = 0.13 MPa) samples did not generate any water path, although the water pressure was higher than the swelling pressure. In the water permeability test of the bentonite-based materials, the water pressure must be set below the swelling pressure to avoid shrinkage of the sample [57,58]. In addition, Pusch [59] also states that the setting of water pressure is significant, and it is recommended that the water pressure should be 50% (or less) of the swelling pressure. Therefore, it is necessary to set an appropriate permeability pressure when conducting the hydraulic conductivity test on clay samples because the constituent clay minerals generate water paths that have a significant effect on permeability.
Figure 9 shows the relationship between the water pressure and hydraulic conductivity of clay mineral samples. The hydraulic conductivities of chlorite, talc, vermiculite, and 1.0 nm halloysite samples tend to decrease slightly when the water pressure is 0.1 MPa or less. This is consistent with the phenomenon of the change in hydraulic conductivity in very small hydraulic gradient areas [44]. Except for the vermiculite sample, all the other samples exhibit water paths as a result of the gradual increase in water pressure. The vermiculite in this study is mainly composed of vermiculite with very small amounts of mica, as shown in Figure 2h. Thus, this sample is a possibility with a high layer charge and behave closely like a mica [2,47,60]. The effect of the layer charge in clay minerals on hydraulic conductivity will be clarified in future studies. The following explanation may be attributed to the aforementioned observation: the sample is compressed or compacted because the water pressure exceeds the swelling pressure, while the hydraulic conductivity decreases and the hydraulic gradient increases to reach the limit, leading to the generation of water paths. With further increase in water pressure, water paths may be generated in the vermiculite sample. However, no clear difference is observed in the hydraulic conductivity when the water pressure is 0.1 MPa or higher. Accordingly, it is suggested that the hydraulic gradient should be neither too large nor too small while conducting the permeability test on the clay mineral samples, and it is important to carefully set the hydraulic gradient at the optimal value.

3.3. Estimation of Hydraulic Conductivity Using Kozeny–Carman Equation

Among all the existing models representing the hydraulic conductivity of porous media, the Kozeny–Carman equation [45,46] in particular uses the specific surface area, shown in the following equation:
k KC = C · ρ w g η · 1 S m 2 ρ s 2 · e 3 1 + e
where kKC (m/s) is the hydraulic conductivity, C is a dimensionless shape constant with an approximate value of 0.2 [46], ρw (= 997.770 kg/m3) is the density of water at 22 °C, g is the gravitational acceleration (= 9.8 m/s2), η (= 0.000958 Pa·s) is the coefficient of viscosity at 22 °C, Sm (m2/kg) is the specific surface area per unit mass of particles, ρs (kg/m3) is the particle density, and e (= 0.95) is the void ratio. As this equation incorporates both macroparameters (such as void ratio) as well as microparameters (such as specific surface area), it is often used to evaluate the hydraulic conductivity of low-permeable materials, such as bentonite (Ren et al. [61]; Kobayashi et al. [62]). In this study, we estimated the hydraulic conductivity of compacted clays using the Kozeny–Carman equation [45,46], using the specific surface area and void ratio of compacted clays and compared them with the experimental values obtained.
Figure 10 shows the relationship between the void ratio and hydraulic conductivity of clay mineral samples calculated using the Kozeny–Carman equation. The markers in Figure 10 represent the experimental values (e = 0.95). For all the clay samples, the hydraulic conductivity k obtained through experimentation was larger than the hydraulic conductivity kKC calculated using the Kozeny–Carman equation. The specific surface area used in Equation (3) may vary depending on the pretreatment time and temperature of the sample during measurement [2]. Therefore, the difference between k and kKC is probable. However, the difference between k and kKC is found to be within approximately one order of magnitude for all the clay samples. Further, the Kozeny–Carman equation may be an effective means for evaluating the permeability of compacted clay samples. However, when estimating the hydraulic conductivity using the values of the specific surface area and pore ratio, a slight difference in the obtained values is expected.

3.4. Relationship between Hydrogen Energy and Hydraulic Conductivity of Clay Mineral Materials

The distance of the markers from line A in the plasticity chart (Figure 3) indicates the toughness and dry strength of the corresponding sample. According to Mizuno et al. [63], the consistency index is expressed as ICE when the natural water content is zero, and ICE is defined as the hydrogen energy (water retention capacity), as shown in the following equation:
I CE = w L I p
In this study, we compared the hydraulic conductivity of compacted clays with the reciprocal of hydrogen energy, using the consistency index of the clay mineral samples. Figure 11 shows the relationship between the reciprocal of hydrogen energy based on the consistency index and the hydraulic conductivity of the clay mineral samples. It can be seen that the range of 1/ICE is 0.04–0.87 and it differs depending on the type of the clay mineral. The smectite sample has a large specific surface area, and the corresponding 1/ICE value is 0.87; this is approximately equal to 1. In particular, smectite has a large specific surface area; therefore, the amount of adsorbed water due to surface tension increases. It is considered that this adsorbed water is generally highly viscous [2] and has a large hydrogen energy; therefore, smectite has a strong tendency to retain water in the interparticle void. As a result, the hydraulic conductivity of the smectite sample is considered to be much smaller than those of the other samples. The hydraulic conductivity tends to decrease as the hydrogen energy increases, and a strong correlation (correlation coefficient: 0.87) is therefore observed between the two parameters. Therefore, the results of this experiment suggest that it is possible to easily estimate the hydraulic conductivity in the future only by conducting a consistency test.

4. Conclusions

To clarify the effect of the different types of clay minerals and water pressure (hydraulic gradient) on the permeability of compacted clay mineral materials, a constant-pressure permeability test was conducted.
The swelling pressure and hydraulic conductivity of the compacted clays differed depending on the clay mineral type. The swelling pressure and hydraulic conductivity were found to be closely associated with the specific surface area of the clays. In addition, it was found that the difference in water pressure (hydraulic gradient) affected the hydraulic conductivity of the clay mineral materials. We concluded that when conducting the hydraulic conductivity test using a clay sample, it is necessary to set an appropriate permeability pressure because the constituent clay minerals generate water paths that have a significant effect on permeability. Furthermore, the measured hydraulic conductivity was almost consistent with the value calculated using the Kozeny–Carman equation. In addition, the hydraulic conductivity was closely associated with the hydrogen energy calculated using the consistency index of clay. This result suggests that the hydraulic conductivity of clay mineral materials can be estimated based on the specific surface area, void ratio, or consistency index of clays.

Funding

This work was partly supported by Grants-in-Aid for Scientific Research “KAKENHI” (grant number 19K15489) of the Japanese Society for the Promotion of Sciences (JSPS).

Acknowledgments

The author thank two reviewers for their helpful comments and advice.

Conflicts of Interest

The author declares no conflict of interest.

References

  1. Velde, B. Introduction to Clay Minerals: Chemistry, Origins, Uses and Environmental Significance; Springer Science & Business Media: Berlin/Heidelberg, Germany, 1992; pp. 1–198. [Google Scholar]
  2. The Clay Science Society of Japan. Handbook of Clays and Clay Minerals, 3rd ed.; Gihodo Shuppan: Tokyo, Japan, 2009; pp. 1–990. (In Japanese) [Google Scholar]
  3. Bergaya, F.; Lagaly, G. (Eds.) Developments in Clay Science—Volume 5A, Handbook of Clay Science, 2nd ed.; Elsevier: Amsterdam, The Netherlands, 2013; pp. 1–874. [Google Scholar]
  4. Ishida, R.; Tsutsumi, S. Physical properties of smectite bearing soft rocks (Part 2): Texture and swelling pressure. J. Clay Sci. Soc. Jpn. 1994, 34, 22–34. (In Japanese) [Google Scholar]
  5. Kohno, M.; Maeda, H. Relationship between cylinder (longitudinal) point load strength and uniaxial compression strength for smectite-bearing fine tuffs in a soft and semi-hard rock boundary area: Example of the Upper Miocene Ikutawara Formation from the Ikutahara-Minami landslide area. J. Jpn. Landslide Soc. 2010, 47, 17–25. (In Japanese) [Google Scholar]
  6. Kohno, M.; Maeda, H.; Kage, I.; Kotake, J.; Nii, M. Method of axial point load strength test for smectite-bearing rocks. JSCE J. Geotech. Geoenviron. Eng. (Doboku Gakkai Ronbunshuu C) 2010, 66, 859–868. (In Japanese) [Google Scholar] [CrossRef]
  7. Kohno, M.; Maeda, H. Relationship between point load strength index and uniaxial compressive strength of hydrothermally altered rocks. Int. J. Rock Mech. Min. Sci. 2012, 50, 147–157. [Google Scholar] [CrossRef]
  8. Kahraman, S.; Aloglu, A.S.; Aydin, B.; Saygin, E. The effect of clay content on the strength of clay-bearing rocks. In Proceedings of the 9th Asian Rock Mechanics Symposium, Bali, Indonesia, 18–20 October 2016. [Google Scholar]
  9. Kohno, M.; Maeda, H. Estimate of uniaxial compressive strength of hydrothermally altered soft rocks based on strength index tests. Geomaterials 2018, 8, 147–157. [Google Scholar] [CrossRef] [Green Version]
  10. Kohno, M.; Maeda, H. Correlations between point load strength index and physical properties of hydrothermally altered rocks. Int. J. Min. Eng. Miner. Process. 2018, 7, 1–13. [Google Scholar]
  11. Kohno, M.; Nishimura, T. Effect of clay mineral type on the physical and mechanical properties of rock materials. In Proceedings of the 2019 ISRM Specialized Conference, the 5th ISRM Young Scholars’ Symposium on Rock Mechanics and International Symposium on Rock Engineering for Innovative Future (YSRM2019 & REIF2019), Okinawa, Japan, 1–4 December 2019. [Google Scholar]
  12. Komine, H.; Ogata, N. Experimental study on swelling characteristics of compacted bentonite. Can. Geotech. J. 1994, 31, 478–490. [Google Scholar] [CrossRef]
  13. Mollins, L.H.; Stewart, D.I.; Cousens, T.W. Predicting the properties of bentonite–sand mixtures. Clay Miner. 1996, 31, 243–252. [Google Scholar] [CrossRef]
  14. Komine, H.; Ogata, N. Experimental study on swelling characteristics of sand–bentonite mixture for nuclear waste disposal. Soils Found. 1999, 39, 83–97. [Google Scholar] [CrossRef] [Green Version]
  15. Cho, W.J.; Lee, J.O.; Chun, K.S. The temperature effects on hydraulic conductivity of compacted bentonite. Appl. Clay Sci. 1999, 14, 47–58. [Google Scholar] [CrossRef]
  16. Sivapullaiah, P.V.; Sridharan, A.; Stalin, V.K. Hydraulic conductivity of bentonite–sand mixtures. Can. Geotech. J. 2000, 37, 406–413. [Google Scholar] [CrossRef]
  17. Komine, H.; Ohashi, R.; Yasuhara, K.; Murakami, S. Thermal influences on swelling-pressure and swelling-deformation of bentonites and its factors. JSCE J. Geotech. Geoenviron. Eng. (Doboku Gakkai Ronbunshuu C) 2007, 63, 731–741. (In Japanese) [Google Scholar] [CrossRef]
  18. Shirazi, S.M.; Kazama, H.; Salman, F.A.; Othman, F.; Akib, S. Permeability and swelling characteristics of bentonite. Int. J. Phys. Sci. 2010, 5, 1647–1659. [Google Scholar]
  19. Suzuki, K.; Asano, H.; Yahagi, R.; Kobayashi, I.; Sellin, P.; Svemar, C.; Holmqvist, M. Experimental investigations of piping phenomena in bentonite-based buffer materials for an HLW repository. Clay Miner. 2013, 48, 363–382. [Google Scholar] [CrossRef]
  20. Okubo, S.; Takahashi, K.; Nakashima, H. The relationship between the expandability of clay mineral and the permeability of Takinoue pyroclastic layer “T1 member” in Yufutsu Oil and Gas Field, Hokkaido, Japan. J. Jpn. Assoc. Pet. Technol. 2011, 76, 209–218. [Google Scholar] [CrossRef] [Green Version]
  21. Pusch, R. Is Montmorillonite-Rich Clay of MX-80 Type the Ideal Buffer for Isolation of HLW? SKB Technical Report SKB-TR-99-33; Swedish Nuclear Fuel and Waste Management Co.: Stockholm, Sweden, 1999; pp. 1–67.
  22. Sellin, P.; Leupin, O.X. The use of clay as an engineered barrier in radioactive-waste management a review. Clays Clay Miner. 2013, 61, 477–498. [Google Scholar] [CrossRef]
  23. Kato, M.; Nara, Y.; Okazaki, Y.; Kohno, M.; Sato, T.; Sato, T.; Takahashi, M. Application of the transient pulse method to measure clay permeability. Mater. Trans. 2018, 59, 1427–1432. [Google Scholar] [CrossRef] [Green Version]
  24. Kohno, M.; Nara, Y.; Kato, M.; Nishimura, T. Effects of clay-mineral type and content on the hydraulic conductivity of bentonite-sand mixtures made of Kunigel bentonite from Japan. Clay Miner. 2018, 53, 721–732. [Google Scholar] [CrossRef] [Green Version]
  25. Kitagawa, R.; Nishido, H. Orientation analysis and formation ages of fractures filled with clay minerals (clay veins) in Hiroshima and Shimane Prefectures, southwest Japan. J. Jpn. Soc. Eng. Geol. 1994, 35, 60–68. [Google Scholar] [CrossRef] [Green Version]
  26. Ikari, M.J.; Saffer, D.M.; Marone, C. Frictional and hydrologic properties of clay-rich fault gouge. J. Geophys. Res. 2009, 114, B05409. [Google Scholar] [CrossRef] [Green Version]
  27. Nishimoto, S.; Yoshida, H. Hydrothermal alteration of deep fractured granite: Effects of dissolution and precipitation. Lithos 2010, 115, 153–162. [Google Scholar] [CrossRef]
  28. Maeda, H.; Fukushima, Y.; Naya, H.; Yamamoto, Y.; Kohno, M. A palygorskite vein found in conglomerate of the Upper Eocene-Lower Origocene Rikubetsu Formatiion in northeastern Hokkaido, Japan. Clay Sci. 2012, 16, 15–18. [Google Scholar]
  29. Maeda, H.; Kohno, M. An interstratified illite/smectite mineral vein found in chaotic rock from the Nikoro Group in the accretionary Tokoro Belt, northeastern Hokkaido, Japan. Clay Sci. 2015, 19, 5–9. [Google Scholar]
  30. Ishibashi, M.; Yoshida, H.; Sasao, E.; Yuguchi, T. Long term behavior of hydrogeological structures associated with faulting: An example from the deep crystalline rock in the Mizunami URL, Central Japan. Eng. Geol. 2016, 208, 114–127. [Google Scholar] [CrossRef]
  31. Niwa, M.; Shimada, K.; Tamura, H.; Shibata, K.; Sueoka, S.; Yasue, K.; Ishimaru, T.; Umeda, K. Thermal constraints on clay growth in fault gouge and their relationship with fault-zone evolution and hydrothermal alteration: Case study of gouges in the Kojaku granite, central Japan. Clays Clay Miner. 2016, 64, 86–107. [Google Scholar] [CrossRef]
  32. Ueki, T.; Tanabe, H.; Niwa, M.; Ishimaru, T.; Shimada, K. Observed and Analyzed Data for Clay Veins in Granite; Japan Atomic Energy Agency Report JAEA-Data/Code 2016-010; Japan Atomic Energy Agency: Ibaraki, Japan, 2016; pp. 1–292. (In Japanese) [Google Scholar]
  33. Maciel, I.B.; Dettori, A.; Balsamo, F.; Bezerra, F.H.R.; Vieira, M.M.; Nogueira, F.C.C.; Salvioli-Mariani, E.; Sousa, J.A.B. Structural control on clay mineral authigenesis in faulted arkosic sandstone of the Rio do Peixe basin, Brazil. Minerals 2018, 8, 408. [Google Scholar] [CrossRef] [Green Version]
  34. Nara, Y.; Kato, M.; Niri, R.; Kohno, M.; Sato, T.; Fukuda, D.; Sato, T.; Takahashi, M. Permeability of granite including macro-fracture naturally filled with fine-grained minerals. Pure Appl. Geophys. 2018, 175, 917–927. [Google Scholar] [CrossRef] [Green Version]
  35. Warr, L.N.; Cox, S. Clay mineral transformations and weakening mechanisms along the Alpine Fault, New Zealand. Geol. Soc. Lond. Spec. Publ. 2001, 186, 85–101. [Google Scholar] [CrossRef]
  36. Haines, S.H.; van der Pluijm, B.A.; Ikari, M.J.; Saffer, D.M.; Marone, C. Clay fabric intensity in natural and artificial fault gouges: Implications for brittle fault zone processes and sedimentary basin clay fabric evolution. J. Geophys. Res. 2009, 114, B05406. [Google Scholar] [CrossRef] [Green Version]
  37. Haines, S.H.; van der Pluijm, B.A. Patterns of mineral transformations in clay gouge, with examples from low-angle normal fault rocks in the western USA. J. Struct. Geol. 2012, 43, 2–32. [Google Scholar] [CrossRef]
  38. Haines, S.H.; Kaproth, B.; Marone, C.; Saffer, D.; van der Pluijm, B. Shear zones in clay-rich fault gouge: A laboratory study of fabric development and evolution. J. Struct. Geol. 2013, 51, 206–225. [Google Scholar] [CrossRef]
  39. Laurich, B.; Urai, J.L.; Desbois, G.; Vollmer, C.; Nussbaum, C. Microstructural evolution of an incipient fault zone in Opalinus Clay: Insights from an optical and electron microscopic study of ion-beam polished samples from the Main Fault in the Mt-Terri Underground Research Laboratory. Solid Earth 2014, 67, 107–128. [Google Scholar] [CrossRef]
  40. Wang, G.; Mitchell, T.M.; Meredith, P.G.; Nara, Y.; Wu, Z. Influence of gouge thickness on permeability of macro-fractured basalt. J. Geophys. Res. 2016, 121, 8472–8487. [Google Scholar] [CrossRef]
  41. Laurich, B.; Urai, J.L.; Vollmer, C.; Nussbaum, C. Deformation mechanisms and evolution of the microstructure of gouge in the Main Fault in Opalinus Clay in the Mont Terri rock laboratory (CH). J. Struct. Geol. 2018, 9, 1–24. [Google Scholar] [CrossRef] [Green Version]
  42. Pérez-Flores, P.; Wang, G.; Mitchell, T.M.; Meredith, P.G.; Nara, Y.; Sarkar, V.; Cembrano, J. The effect of offset on fracture permeability of rocks from the Southern Andes Volcanic Zone, Chile. J. Struct. Geol. 2017, 104, 142–158. [Google Scholar] [CrossRef]
  43. Pusch, R. Bentonite Clay: Environmental Properties and Applications; CRC Press: Boca Raton, FL, USA, 2015; pp. 1–334. [Google Scholar]
  44. Hasibo, S. Influence of mobile particles in spft clay on permeability. In Proceedings of the International Symposium of soil structure, Gothenburg, Sweden, 1–2 August 1973; pp. 132–135. [Google Scholar]
  45. Kozeny, J. Ueber kapillare Leitung des Wassers im Boden. Sitzungsber. Akad. Wiss. Wien 1927, 136, 271–306. [Google Scholar]
  46. Carman, P.C. Fluid flow through a granular bed. Trans. Inst. Chem. Eng. 1937, 15, 150–156. [Google Scholar] [CrossRef]
  47. Shirozu, H. Clay Mineralogy: The Basis of Clay Science, New ed.; Asakura Publishing: Tokyo, Japan, 2012; pp. 1–185. (In Japanese) [Google Scholar]
  48. The Japanese Geotechnical Society. Test Method for liquid limit and plastic limit of soils (JGS 0141-2009). In Japanese Geotechnical Society Standards: Laboratory Testing Standards of Geomaterials; Maruzen Publishing: Tokyo, Japan, 2015; Volume 1. [Google Scholar]
  49. Malfoy, C.; Besq, A.; Pantet, A.; Monnet, P. The physico-chemical and rheological characterizations of two industrial bentonites, 2001 A Clay Odyssey. In Proceedings of the 12th International Clay Conference, Bahia Blanca, Argentina, 22–28 July 2001; pp. 285–292. [Google Scholar]
  50. Komine, H.; Oyamada, T.; Ozaki, T.; Iso, S. Discussion on water migration and swelling of compacted powder bentonites. J JSCE Ser. C (Geosph. Eng.) 2018, 74, 63–75. (In Japanese) [Google Scholar] [CrossRef]
  51. Jacinto, A.C.; Villar, M.V.; Ledesma, A. No AccessInfluence of water density on the water-retention curve of expansive clays. Geotechnique 2012, 62, 657–667. [Google Scholar] [CrossRef]
  52. Martin, R.T. Adsorbed water on clay: A review. Clays Clay Miner. 1960, 9, 28–70. [Google Scholar] [CrossRef]
  53. Komine, H. Inductive consideration on water density between montmorillonite mineral layers on the basis of previous one-dimensional self-sealing experiments. In Proceedings of the 48th Japan National Conference on Geotechnical Engineering, Toyama, Japan, 23–25 July 2013; pp. 459–460. (In Japanese). [Google Scholar]
  54. Terzaghi, C.H. New facts about surface-friction. Phys. Rev. 1920, 16, 54–61. [Google Scholar] [CrossRef]
  55. Achari, G.; Joshi, R.C.; Bentley, L.R.; Chatterji, S. Prediction of the hydraulic conductivity of clays using the electric double layer theory. Can. Geotech. J. 1999, 36, 783–792. [Google Scholar] [CrossRef]
  56. Mitchell, J.K.; Soga, K. Fundamentals of Soil Behavior, 3rd ed.; John Wiley & Sons: Hoboken, NJ, USA, 2005; pp. 1–592. [Google Scholar]
  57. Tanai, K.; Kikuchi, H.; Nakamura, K.; Tanaka, Y.; Hironaga, M. Survey on Current Status of Laboratory Test Method and Experimental Consideration for Establishing Standardized Procedure of Material Containing Bentonite—Report of Collaboration Research Between JAEA and CRIEPI- (Joint Research); Japan Atomic Energy Agency Report JAEA-Research 2010-025; Japan Atomic Energy Agency: Ibaraki, Japan, 2010; pp. 1–186. (In Japanese)
  58. Nakamura, K.; Tanaka, Y.; Hironaga, M. Survey on Current Status of Laboratory Test Method and Experimental Consideration for Material Containing Bentonite; CRIEPI Research Report N10026; CRIEPI: Tokyo, Japan, 2011; pp. 1–37. (In Japanese) [Google Scholar]
  59. Pusch, R. The Buffer and Backfill Handbook—Part 1: Definitions, Basic Relationships, and Laboratory Methods; SKB Technical Report SKB-TR-02-20; Swedish Nuclear Fuel and Waste Management Co.: Stockholm, Sweden, 2002; pp. 1–263. [Google Scholar]
  60. Dixon, J.B.; Weed, S.B. (Eds.) Minerals in Soil Environments, 2nd ed.; Soil Science Society of America: Madison, WI, USA, 1989; pp. 635–674. [Google Scholar]
  61. Ren, X.; Zhao, Y.; Deng, Q.; Kang, J.; Li, D.; Wang, D. A relation of hydraulic conductivity-void ratio for soils based on Kozeny-Carman equation. Eng. Geol. 2016, 213, 89–97. [Google Scholar] [CrossRef]
  62. Kobayashi, I.; Owada, H.; Ishii, T.; Iizuka, A. Evaluation of specific surface area of bentonite-engineered barriers for Kozeny-Carman law. Soils Found. 2017, 57, 683–697. [Google Scholar] [CrossRef]
  63. Mizuno, K.; Endo, K.; Hongo, T.; Nishigaki, M.; Kamon, M. Evaluation of impermeability for clayey mixture soil using consistency limits. In Proceedings of the 39th Japan National Conference on Geotechnical Engineering, Niigata, Japan, 7–9 July 2004; pp. 303–304. (In Japanese). [Google Scholar]
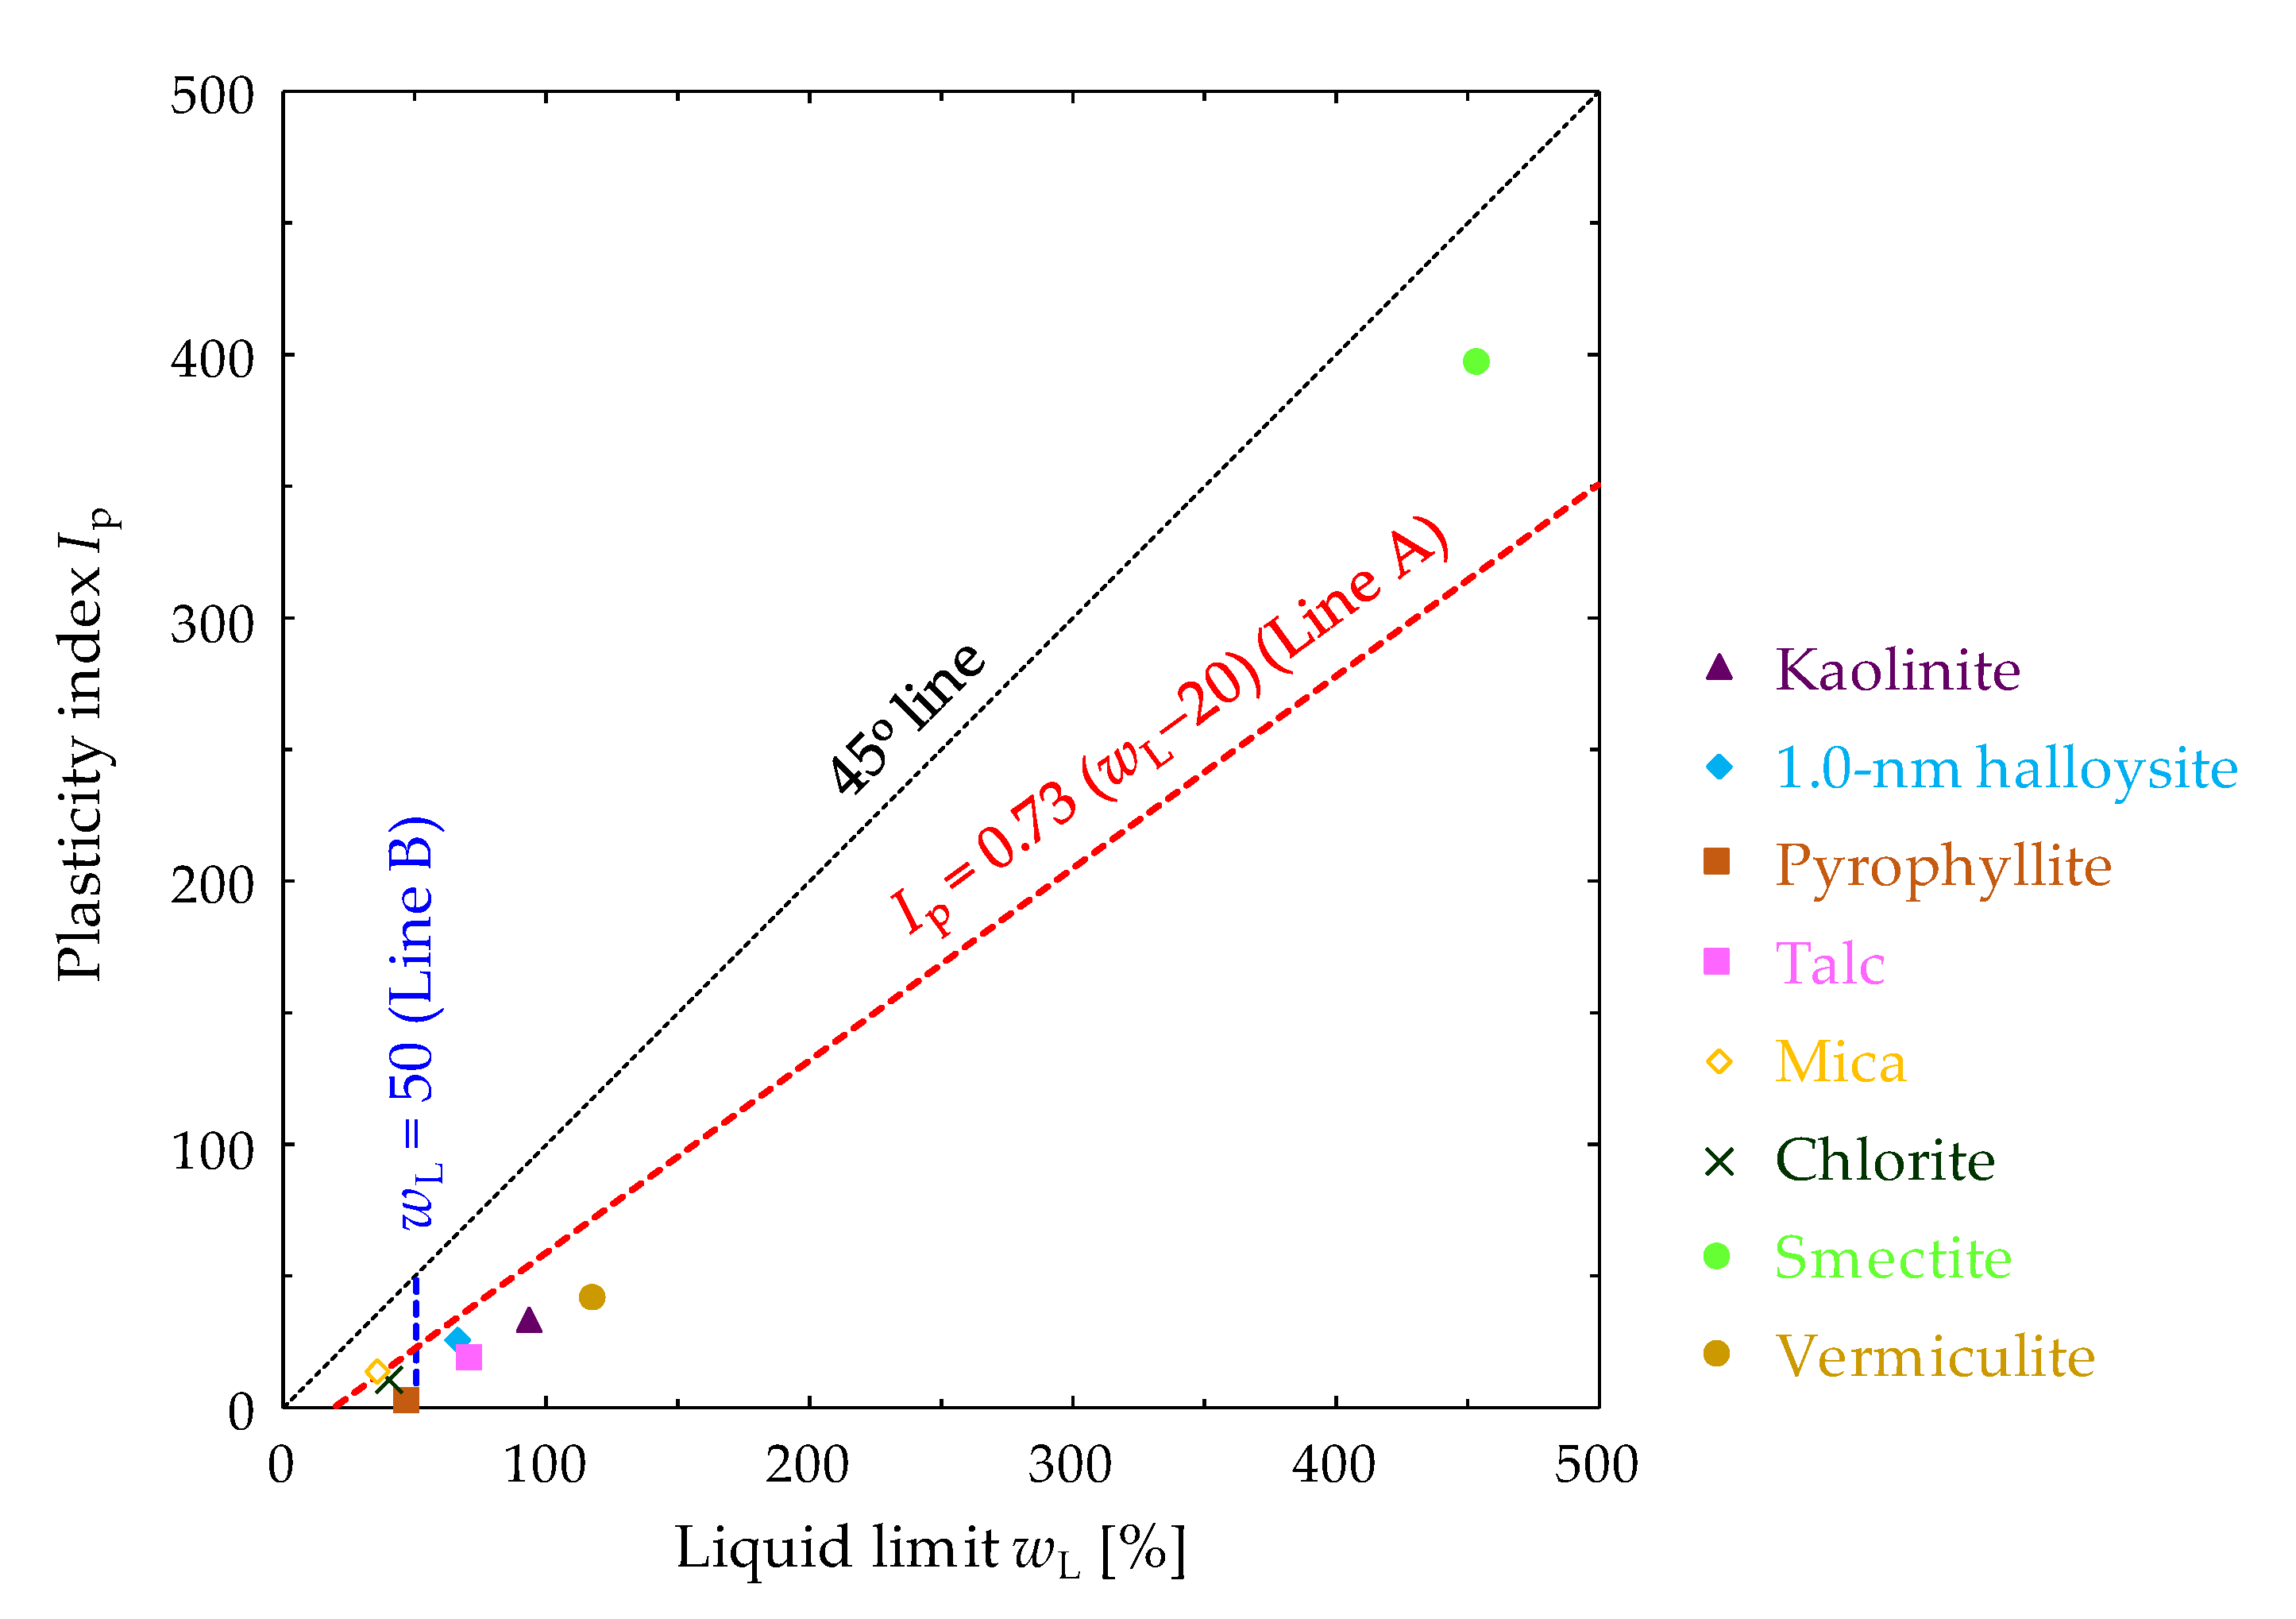
Figure 1. Schematic crystal structure of layer silicates (based on Shirozu [47]).
Minerals 10 01064 g001
Figure 2. Unoriented X-ray powder diffraction patterns of kaolinite (a), 1.0 nm halloysite (b), pyrophyllite (c), talc (d), mica (e), chlorite (f), smectite (g), and vermiculite (h) powder samples. The arrows correspond to the index minerals, and abbreviations correspond to other minerals (Cal: calcite, Chl: chlorite, Dol: dolomite, Fld: feldspars, Mi: mica, Opl: opal-CT, Qtz: quartz, Sep: sepiolite).
Minerals 10 01064 g002aMinerals 10 01064 g002b
Figure 3. Plasticity chart of clay mineral powder samples.
Minerals 10 01064 g003
Figure 4. Schematic of the experimental configuration (modified version of the experimental setup in the study by Kohno et al. [24]) for the one-dimensional swelling-pressure test of the clay mineral samples.
Minerals 10 01064 g004
Figure 5. Schematic of the experimental configuration for the constant-pressure permeability test of clay mineral samples [24].
Minerals 10 01064 g005
Figure 6. Swelling pressure of clay mineral samples (void ratio = 0.95).
Minerals 10 01064 g006
Figure 7. Relationship between swelling pressure and hydraulic conductivity of clay mineral samples (void ratio = 0.95).
Minerals 10 01064 g007
Figure 8. Observation of water path (W.P.) in the samples (downstream side) that significantly affect the hydraulic conductivity. (a) 1.0 nm halloysite, (b) pyrophyllite (c) talc, and (d) chlorite samples.
Minerals 10 01064 g008
Figure 9. Relationship between water pressure and hydraulic conductivity of clay mineral samples (void ratio = 0.95).
Minerals 10 01064 g009
Figure 10. Relationship between void ratio and hydraulic conductivity of clay mineral samples. The dotted lines correspond to the values calculated using the Kozeny–Carman equation ([38,39]; Equation (3)).
Minerals 10 01064 g010
Figure 11. Relationship between hydrogen energy and hydraulic conductivity of clay mineral samples (void ratio = 0.95).
Minerals 10 01064 g011
Table 1. Particle density (ρs), specific surface area (Sm), consistency limits (liquid limit: wL, plastic limit: wp), and plastic index (Ip) of clay mineral powder samples.
Clay Mineral Samplesρs
[g/cm3]
Sm
[m2/g]
wL
[%]
wp
[%]
Ip
Kaolinite2.57740.4292.6959.7732.92
1.0 nm halloysite2.73686.5566.2840.5025.79
Pyrophyllite2.7188.147.6045.542.06
Talc2.7864.2471.2552.8218.42
Mica2.9044.8535.9822.1713.81
Chlorite2.8415.239.5929.0510.54
Smectite2.648594.27 [49]455.0258.09396.93
Vermiculite2.6637.73118.3577.0441.32
Table 2. Swelling pressure (Ps) and average hydraulic conductivity (k) of clay mineral powder samples (void ratio = 0.95).
Clay Mineral SamplesPs
[MPa]
k [m/s]
Kaolinite0.371.8 × 10−10
1.0 nm halloysite0.565.8 × 10−11
Pyrophyllite0.012.4 × 10−8
Talc0.011.9 × 10−8
Mica0.027.7 × 10−9
Chlorite<0.0024.5 × 10−8
Smectite0.983.7 × 10−13
Vermiculite0.134.7 × 10−9
Table 3. Hydraulic conductivities [m/s] of clay mineral samples under different water pressure conditions (void ratio = 0.95). The values within parentheses in the table refer to the actual water pressure [MPa] measured, and W.P. indicates the observed water path in the sample.
Clay-Mineral SamplesWater Pressure Pw Settings [MPa]
0.010.0250.050.0750.10.20.30.40.5
Kaolinite1.5 × 10−101.8 × 10−101.9 × 10−101.9 × 10−101.7 × 10−101.8 × 10−101.7 × 10−101.8 × 10−101.7 × 10⁻¹⁰
(0.009)(0.025)(0.05)(0.074)(0.1)(0.2)(0.3)(0.4)(0.495)
1.0-nm halloysite8.1 × 10−116.5 × 10−115.8 × 10−115.6 × 10−114.9 × 10−114.9 × 10−115.0 × 10⁻¹¹W.P.
(0.01)(0.024)(0.049)(0.071)(0.1)(0.2)(0.3)(0.4)
Pyrophyllite2.3 × 10−82.5 × 10−82.0 × 10−8W.P.
(0.009)(0.025)(0.05)(0.075)
Talc2.6 × 10−82.0 × 10−81.9 × 10−81.8 × 10−81.4 × 10−8W.P.
(0.012)(0.024)(0.048)(0.072)(0.11)(0.2)
Mica6.7 × 10−97.3 × 10−98.0 × 10−98.4 × 10−97.7 × 10−97.9 × 10−97.8 × 10−97.6 × 10−97.7 × 10−9
(0.009)(0.024)(0.05)(0.074)(0.1)(0.2)(0.3)(0.4)(0.48)
Chlorite4.7 × 10−84.2 × 10⁻⁸W.P.
(0.01)(0.025)(0.05)
Smectite----4.6 × 10−132.3 × 10−133.3 × 10−133.3 × 10−135.0 × 10⁻¹³
----(0.1)(0.2)(0.3)(0.4)(0.485)
Vermiculite8.7 × 10−98.2 × 10−96.4 × 10−95.2 × 10−94.0 × 10−93.3 × 10−92.7 × 10−92.2 × 10−91.9 × 10−9
(0.009)(0.024)(0.048)(0.075)(0.095)(0.2)(0.3)(0.395)(0.5)
Publisher’s Note: MDPI stays neutral with regard to jurisdictional claims in published maps and institutional affiliations.

