Article

Tectonic History of the South Tannuol Fault Zone (Tuva Region of the Northern Central Asian Orogenic Belt, Russia): Constraints from Multi-Method Geochronology

1
Sobolev Institute of Geology and Mineralogy, Siberian Branch Russian Academy of Sciences, Koptuga ave. 3, 630090 Novosibirsk, Russia
2
Department of Geology, Ghent University, Krijgslaan 281.S8, WE13, 9000 Ghent, Belgium
3
Siberian Research Institute of Geology, Geophysics and Mineral Resources, Krasniy ave. 35, 630099 Novosibirsk, Russia
*
Author to whom correspondence should be addressed.
Minerals 2020, 10(1), 56; https://doi.org/10.3390/min10010056
Submission received: 12 November 2019 / Revised: 18 December 2019 / Accepted: 6 January 2020 / Published: 9 January 2020
(This article belongs to the Special Issue Dating Deep-Seated Tectonic Activities with Minerals)

Abstract

:
In this study, we present zircon U/Pb, plagioclase and K-feldspar 40Ar/39Ar and apatite fission track (AFT) data along the South Tannuol Fault Zone (STFZ). Integrating geochronology and multi-method thermochronology places constraints on the formation and subsequent reactivation of the STFZ. Cambrian (~510 Ma) zircon U/Pb ages obtained for felsic volcanic rocks date the final stage of STFZ basement formation. Ordovician (~460–450 Ma) zircon U/Pb ages were obtained for felsic rocks along the structure, dating their emplacement and marking post-formational local magmatic activity along the STFZ. 40Ar/39Ar stepwise heating plateau-ages (~410–400 Ma, ~365 and ~340 Ma) reveal Early Devonian and Late Devonian–Mississippian intrusion and/or post-magmatic cooling episodes of mafic rocks in the basement. Permian (~290 Ma) zircon U/Pb age of mafic rocks documents for the first time Permian magmatism in the study area creating prerequisites for revising the spread of Permian large igneous provinces of Central Asia. The AFT dating and Thermal history modeling based on the AFT data reveals two intracontinental tectonic reactivation episodes of the STFZ: (1) a period of Cretaceous–Eocene (~100–40 Ma) reactivation and (2) the late Neogene (from ~10 Ma onwards) impulse after a period of tectonic stability during the Eocene–Miocene (~40–10 Ma).

1. Introduction

The South Tannuol Fault Zone (STFZ) is situated in the Tuva Region (Russian Federation) of the Altay–Sayan Fold Belt (ASFB) in the northwestern (Siberian) part of the Central Asia Orogenic Belt (CAOB) (Figure 1). The STFZ is a sub-latitudinal system of normal faults acted in the same mode during its formation and reactivation stages. The shear component is not excluded; however, the normal fault component keeps principal. The STFZ is characterized by steep fall of the fault blocks and the vertical displacement amplitude along the largest fault segments from 300 to 3000 m. It controls the tectonic evolution of the Tannuol Mountain Range, the most prominent topographic feature with an altitude of up to 2400 m in the Tuva–Mongolia border zone (800–1000 m). The Tannuol Range is composed mainly of Paleozoic volcanic rocks of island arc affinity, intruded by various plutons of different ages and compositions (Figure 2). The volcanic rocks are deformed into intricate linear folds with sub-latitudinal strike of the fold axes, conform to the strike of the fault system. Intrusive rocks (gabbros and granitoids) often form linear bodies elongated along strike of the STFZ. This indicates the STFZ controls the emplacement of the Paleozoic igneous basement rocks of the Tannuol Range and controls their deformation during subsequent reactivation phases.
The Paleozoic igneous basement rocks exposed along the STFZ provide insights into the formation and subsequent reactivation episodes of the STFZ. It is hypothesized that in the studied part of the CAOB (e.g., Kuznetsk Alatau, West Sayan, Gorny Altay), these Paleozoic stages are associated with tectonic events at the margins of the Paleo Asian Ocean (PAO) basins [1,2,3,4]. In addition, the Paleozoic basement rocks record evidence of subsequent deformation and exhumation throughout the Mesozoic and Cenozoic. These same basement rocks also record Meso-Cenozoic deformation and exhumation events. The present mountainous morphology of the Tuva Region is considered to have formed during reactivation of inherited structures, such as the STFZ.
Despite its structural importance to the tectonic evolution of the Altay–Sayan, the STFZ remains poorly resolved by modern geochronological and thermochronological techniques. Only in the last decade modern geochronology data have been obtained for the Paleozoic rocks [5,6,7]. Previously, a general model of the Altay–Sayan fold belt formation and evolution was proposed for the Paleozoic history and tectonic events along the STFZ [1,2,3,4]. Meso-Cenozoic deformation and exhumation events in the study area were decrypted only by lithological and stratigraphic data of the Jurassic [8,9,10,11] and Cenozoic [12,13,14,15] sedimentary basins of Tuva and Mongolia. Therefore, dating accessory and rock-forming minerals from the Paleozoic igneous basement rocks along the STFZ using high-temperature and low-temperature methods is necessary to obtain new constraints on tectonic history of the STFZ. Interpretation of these data according to tectonic evolution of the study part of the CAOB allows testing and clarification of the established hypothesis.
The aim of this study is to reconstruct the chronology of formation, reactivation and deformation of the area within the STFZ. Zircon U/Pb, plagioclase 40Ar/39Ar and K-feldspar 40Ar/39Ar dating of igneous rocks along the STFZ allows identifying formation and activation stages and apatite fission track thermochronology reveals the timing of Mesozoic and Cenozoic STFZ reactivation episodes.

2. Methods

In this study, we applied the zircon U/Pb, plagioclase 40Ar/39Ar, K-feldspar 40Ar/39Ar and apatite fission-track (AFT) dating methods to eighteen of crystalline basement rocks in order to determine their geochronological and thermochronological ages. The sample locations are shown on a geological map (Figure 2a) and on a digital elevation model (Figure 2b). Table 1 presents location data, lithology and dating method for each sample. Five samples for zircon U/Pb dating in this study were acquired from felsic volcanic rocks (2218-3, 2251-1, 17002-4), leucogranites (2223-1) and gabbros (2189-1) far from the contact with granitoids. Eight samples for plagioclase and K-feldspar 40Ar/39Ar dating are from basic dikes (3621, 4583-1, 4019-1, 4018-1, 4033-4) and stocks (3619, 3624-2, 3741-2). Six samples for AFT dating were collected along a profile with altitudes from 1150 to 1500 m perpendicular to the STFZ (2223-1, 2224-1, 2225-1, 2226-1, 2227-1, 2228-1).

2.1. Zircon U/Pb Dating

Zircon U/Pb dating was carried out using a SHRIMP (Sensitive High Resolution Ion Microprobe) at the A. P. Karpinsky Russian Geological Research Institute (St. Petersburg, Russia). For each sample, at least 40 zircon grains meeting the quality standards were handpicked and mounted in epoxy and polished for U/Pb dating. The zircons were found to contain a relative high amount of inclusions and micro-fractures. Prior to U/Pb analysis, the internal structure of the zircon grains was investigated and mapped by back-scattered-electron and cathode-luminescence (CL) imaging, using a JEOL JSM-6400 SEM (Scanning Electron Microscope) at the A. P. Karpinsky Russian Geological Research Institute (St. Petersburg, Russia). Zircon U/Pb dating was performed according to the standard method [16] using the TEMORA standard with an age of 416.75 Ma [17]. Error in Standard calibration was 0.41%. Uncertainties of single analyses are given at the 1σ level, and calculated concordant ages at the 2σ level (Table 2). Concordia plots were obtained using the ISOPLOT/EX 3.00 software (Berkeley Geochronology Center Special Publication, Berkeley, CA, USA) [18].

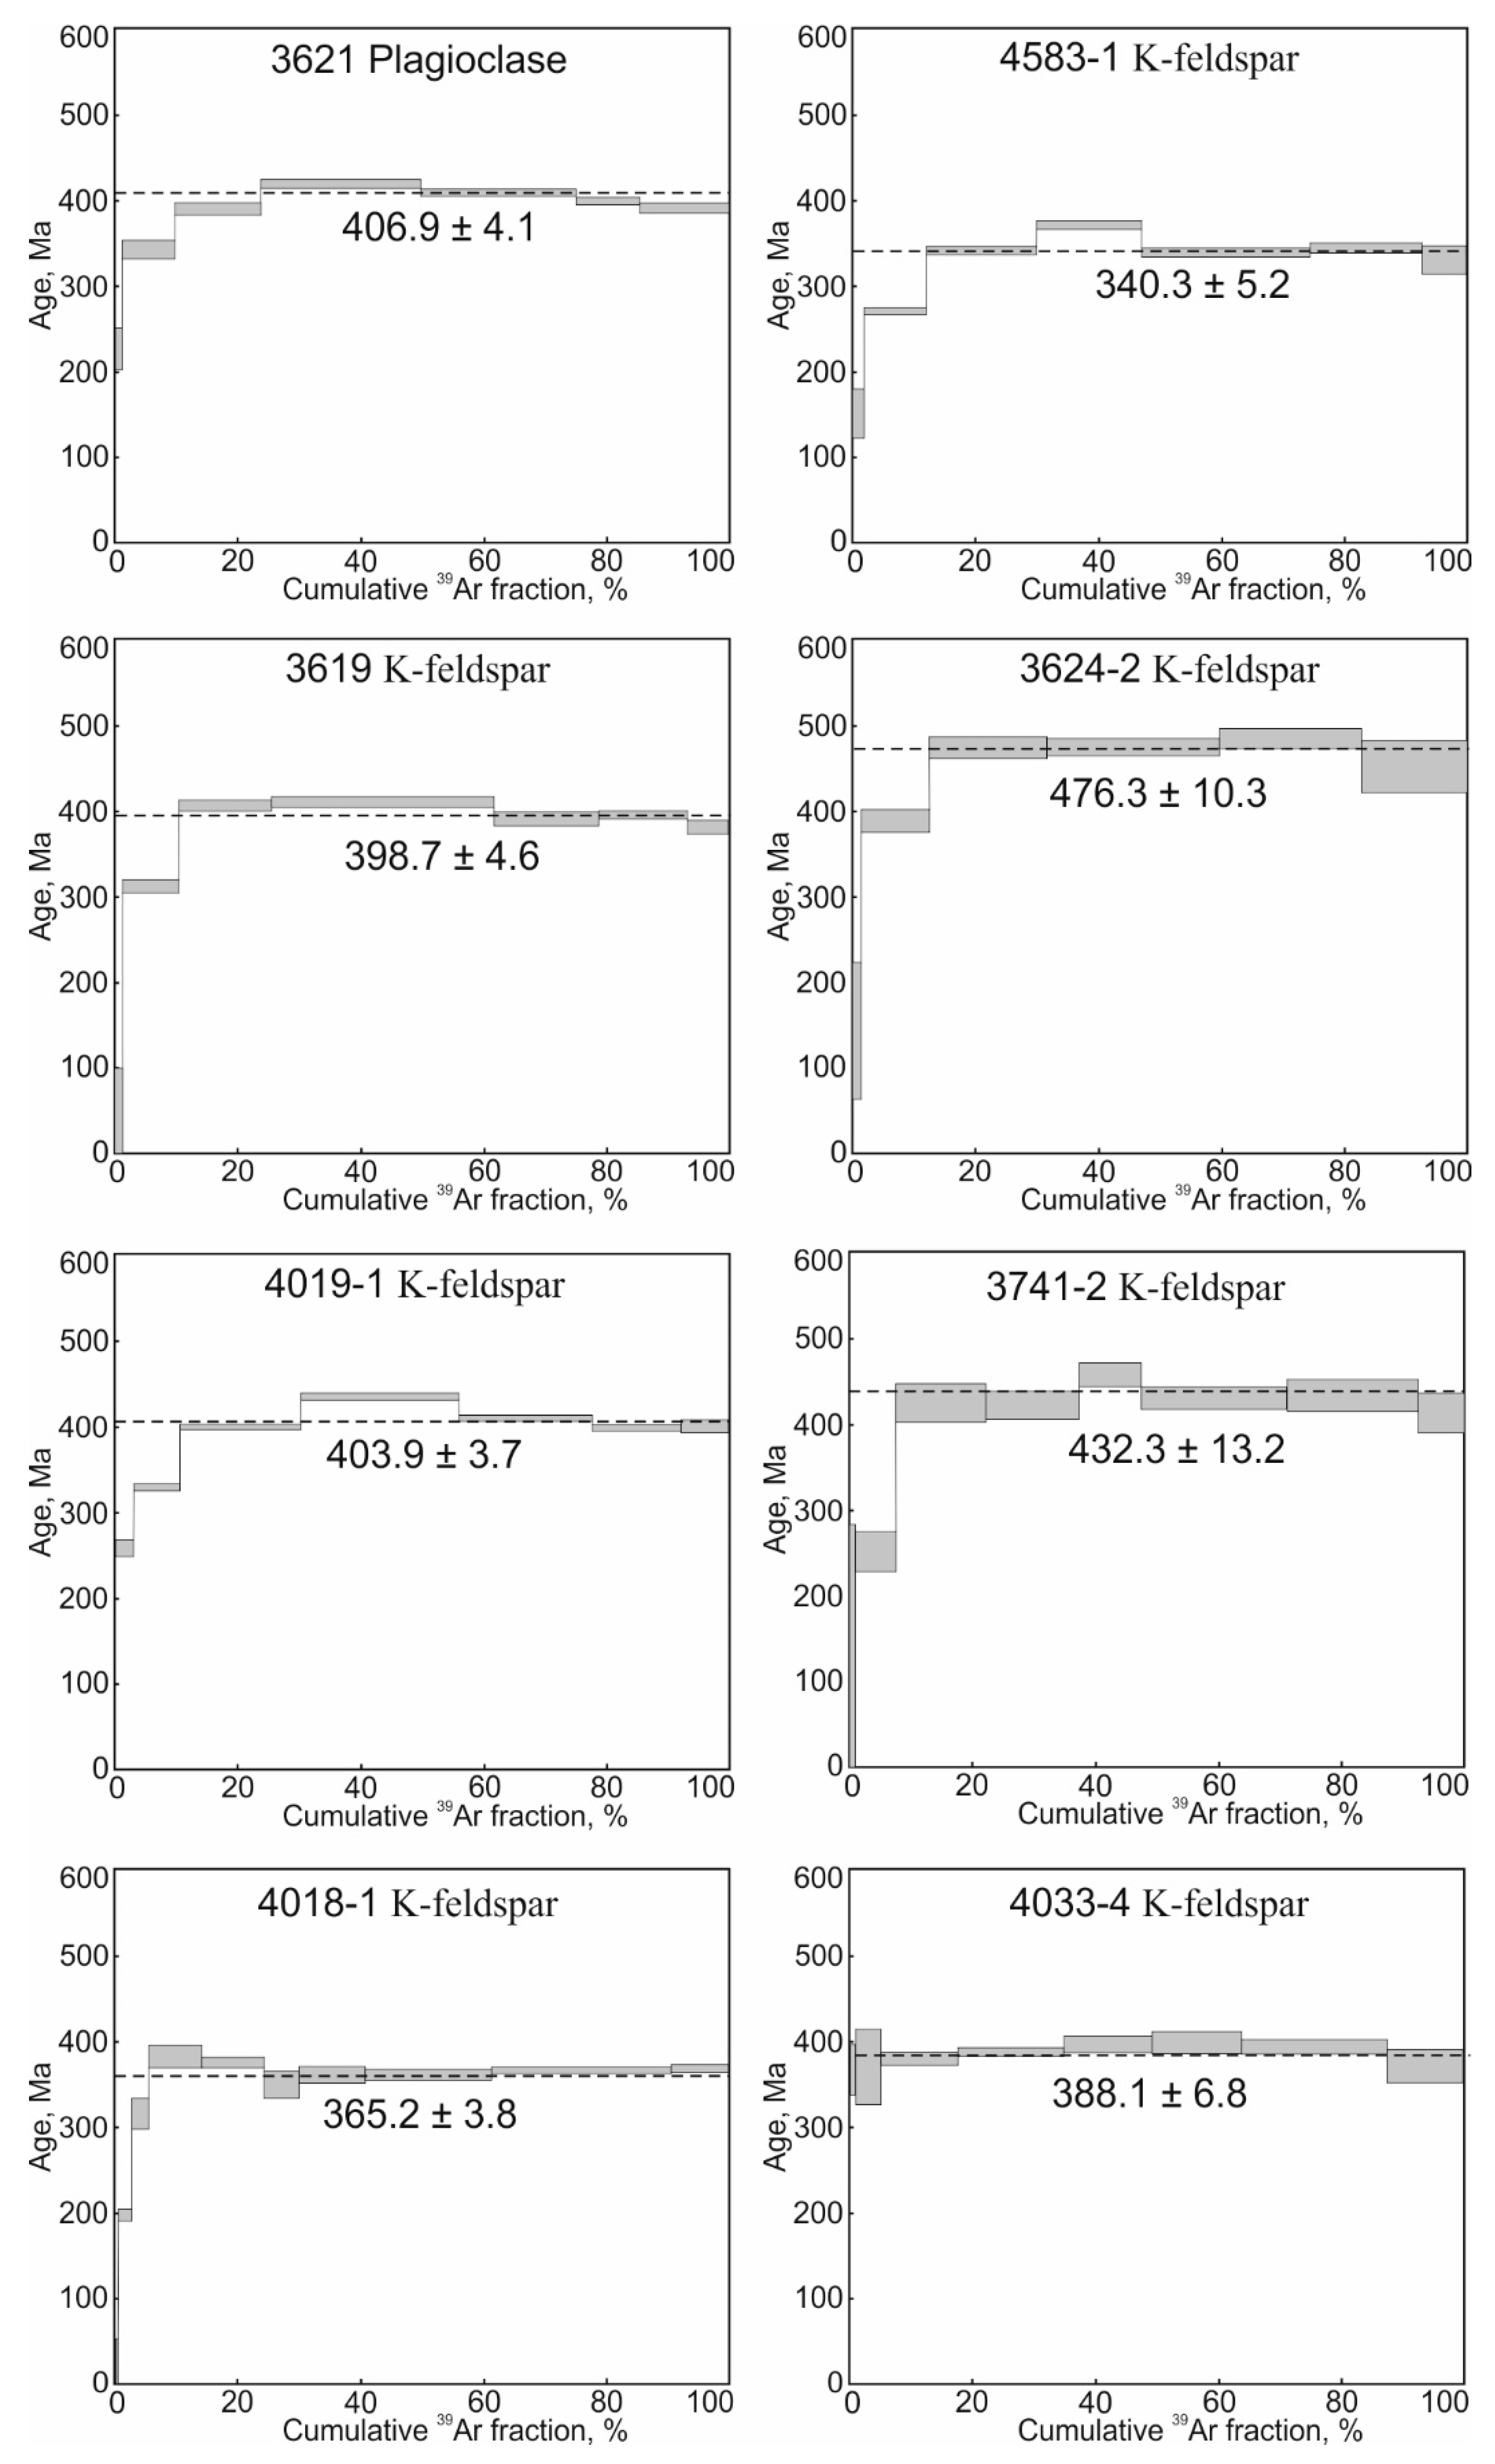
2.2. Plagioclase and K-Feldspar 40Ar/39Ar Dating

Plagioclase and K-feldspar 40Ar/39Ar analyses were performed to elucidate the post-magmatic cooling of the basic rocks. The plagioclase 40Ar/39Ar closure temperature is estimated as 225–300 °C [19], while the K-feldspar 40Ar/39Ar closure temperature is 125–185 °C for microcline and significantly higher (~315 °C) for orthoclase [20]. It is known that the grain size, its chemistry and its crystal structure will affect the closure temperature [21]. In this study, the classification of K-feldspar crystals is not always obvious, and therefore, we take the closure temperature in a wide interval between 150 and 350 °C [22].
40Ar/39Ar dating was carried out in the Institute of Geology and Mineralogy (Novosibirsk, Russia), using the step-wise heating method [23]. Samples of plagioclase and K-feldspar were handpicked, wrapped in aluminum foil, and sealed in vacuo in a quartz vial. As a standard, biotite MSA-11 with an age of 313.8 ± 9 Ma, certified using standard international samples (biotite LP-6 and muscovite Bern 4m, [24]) were used. The overall average calibration age of MSA-11 biotite in these experiments was determined as 311.0 ± 1.5 Ma. The irradiation was carried out in the cadmium channel of the research reactor of the Institute of Physics and Technology (Tomsk State University, Tomsk, Russia). Step-wise heating experiments were performed in a quartz reactor with an external heating furnace. The blank experiment for 40Ar (10 min at 1200 °C) did not exceed 5 × 10⁻¹⁰ ncm3. The argon gas was purified using ZrAl getters (SAES group, Milan, Italy) and Ar isotopic composition was measured on a “Noble Gas 5400” mass-spectrometer from Micromass (now Isotopx, Middlewich, UK). Uncertainties of measurements correspond to the 1σ interval.

2.3. Apatite Fission-Track (AFT) Dating

Apatite fission-track (AFT) dating is a low-temperature thermochronological method based on the spontaneous fission of 238U, which is incorporated as a trace element in the apatite crystal lattice. This fission process generates submicroscopic linear damage trails (fission-tracks) in the crystal lattice. Tracks are revealed by chemical etching with HNO3 (see below) for optical microscopic analysis. The AFT thermochronometer is sensitive to low temperatures: above ~120 °C, the crystal lattice is regenerated and the fission tracks are quickly annealed, while at temperatures below ~60 °C, tracks in apatite are considered stable [25]. In the temperature window of ~60–120 °C (or the apatite partial annealing zone, APAZ), the tracks both accumulate and are annealed. An AFT age indicates the time when the number of accumulated tracks is equal to the number of annealed tracks as the apatite-containing rock passed through the APAZ.
Apatite fission track thermochronology in this study were analyzed by the external detector method using thermal neutron irradiation, following the standard procedure set at Ghent University (Ghent, Belgium) [26,27,28,29,30,31]. Spontaneous tracks in apatite were etched in 5.5 M HNO3 solution for 20 s at 21 °C. Induced tracks were etched in the muscovite external detector after treatment with 40% HF (hydrofluoric acid) for 40 min at 20 °C. Irradiation was carried out at the Belgian Reactor 1 in the Belgian Nuclear Research Center in Mol, Belgium. Track densities were measured on a fully motorized Nikon Eclipse Ni-E microscope, equipped with a Nikon DS-Ri2 camera. The microscope and camera are linked to a computer with Nikon NIS Elements Advanced Research software, complemented with an in-house macro-enabled Microsoft Excel sheet (TRACKflow β) [32,33]. The AFT ages obtained were calculated using a total weighted mean zeta (OWMZ) of 281.6 ± 5.1 a·cm−2, which was obtained using Durango [34] and Fish Canyon Tuff [35] age standards and IRMM 540 glass dosimeters [36]. In addition to the AFT age, the confined tracks length distribution was determined to reconstruct the thermal history [37,38,39]. Track densities were too low to measure ~100 confined tracks as is usually aspired. In general, about 50 horizontal confined tracks for each of our samples were measured on prismatic sections parallel to the crystallographic c-axis to construct length frequency distributions (Table 3). Confined track lengths were measured using a 100× plan apochromat class objective and a 2× secondary optical magnification (Nikon DSC zooming port) without using c-axis projection [32]. To estimate the annealing behavior of the counted grains with measured confined track lengths, measurements of the kinetic parameter Dpar (mean etch pit diameter parallel to the crystallographic c-axis; [40,41]) were carried out. Dpar values were measured in at least 20 different grains, five measurements per grain. Thermal histories were simulated for all samples using the QTQt software (version 5.4.6, Rennes, France) [39] applying the annealing model of [38]. Detailing input parameters used for thermal histories modelling are given in Supplementary Materials (Tables S1 and S2).

3. Results and Discussion

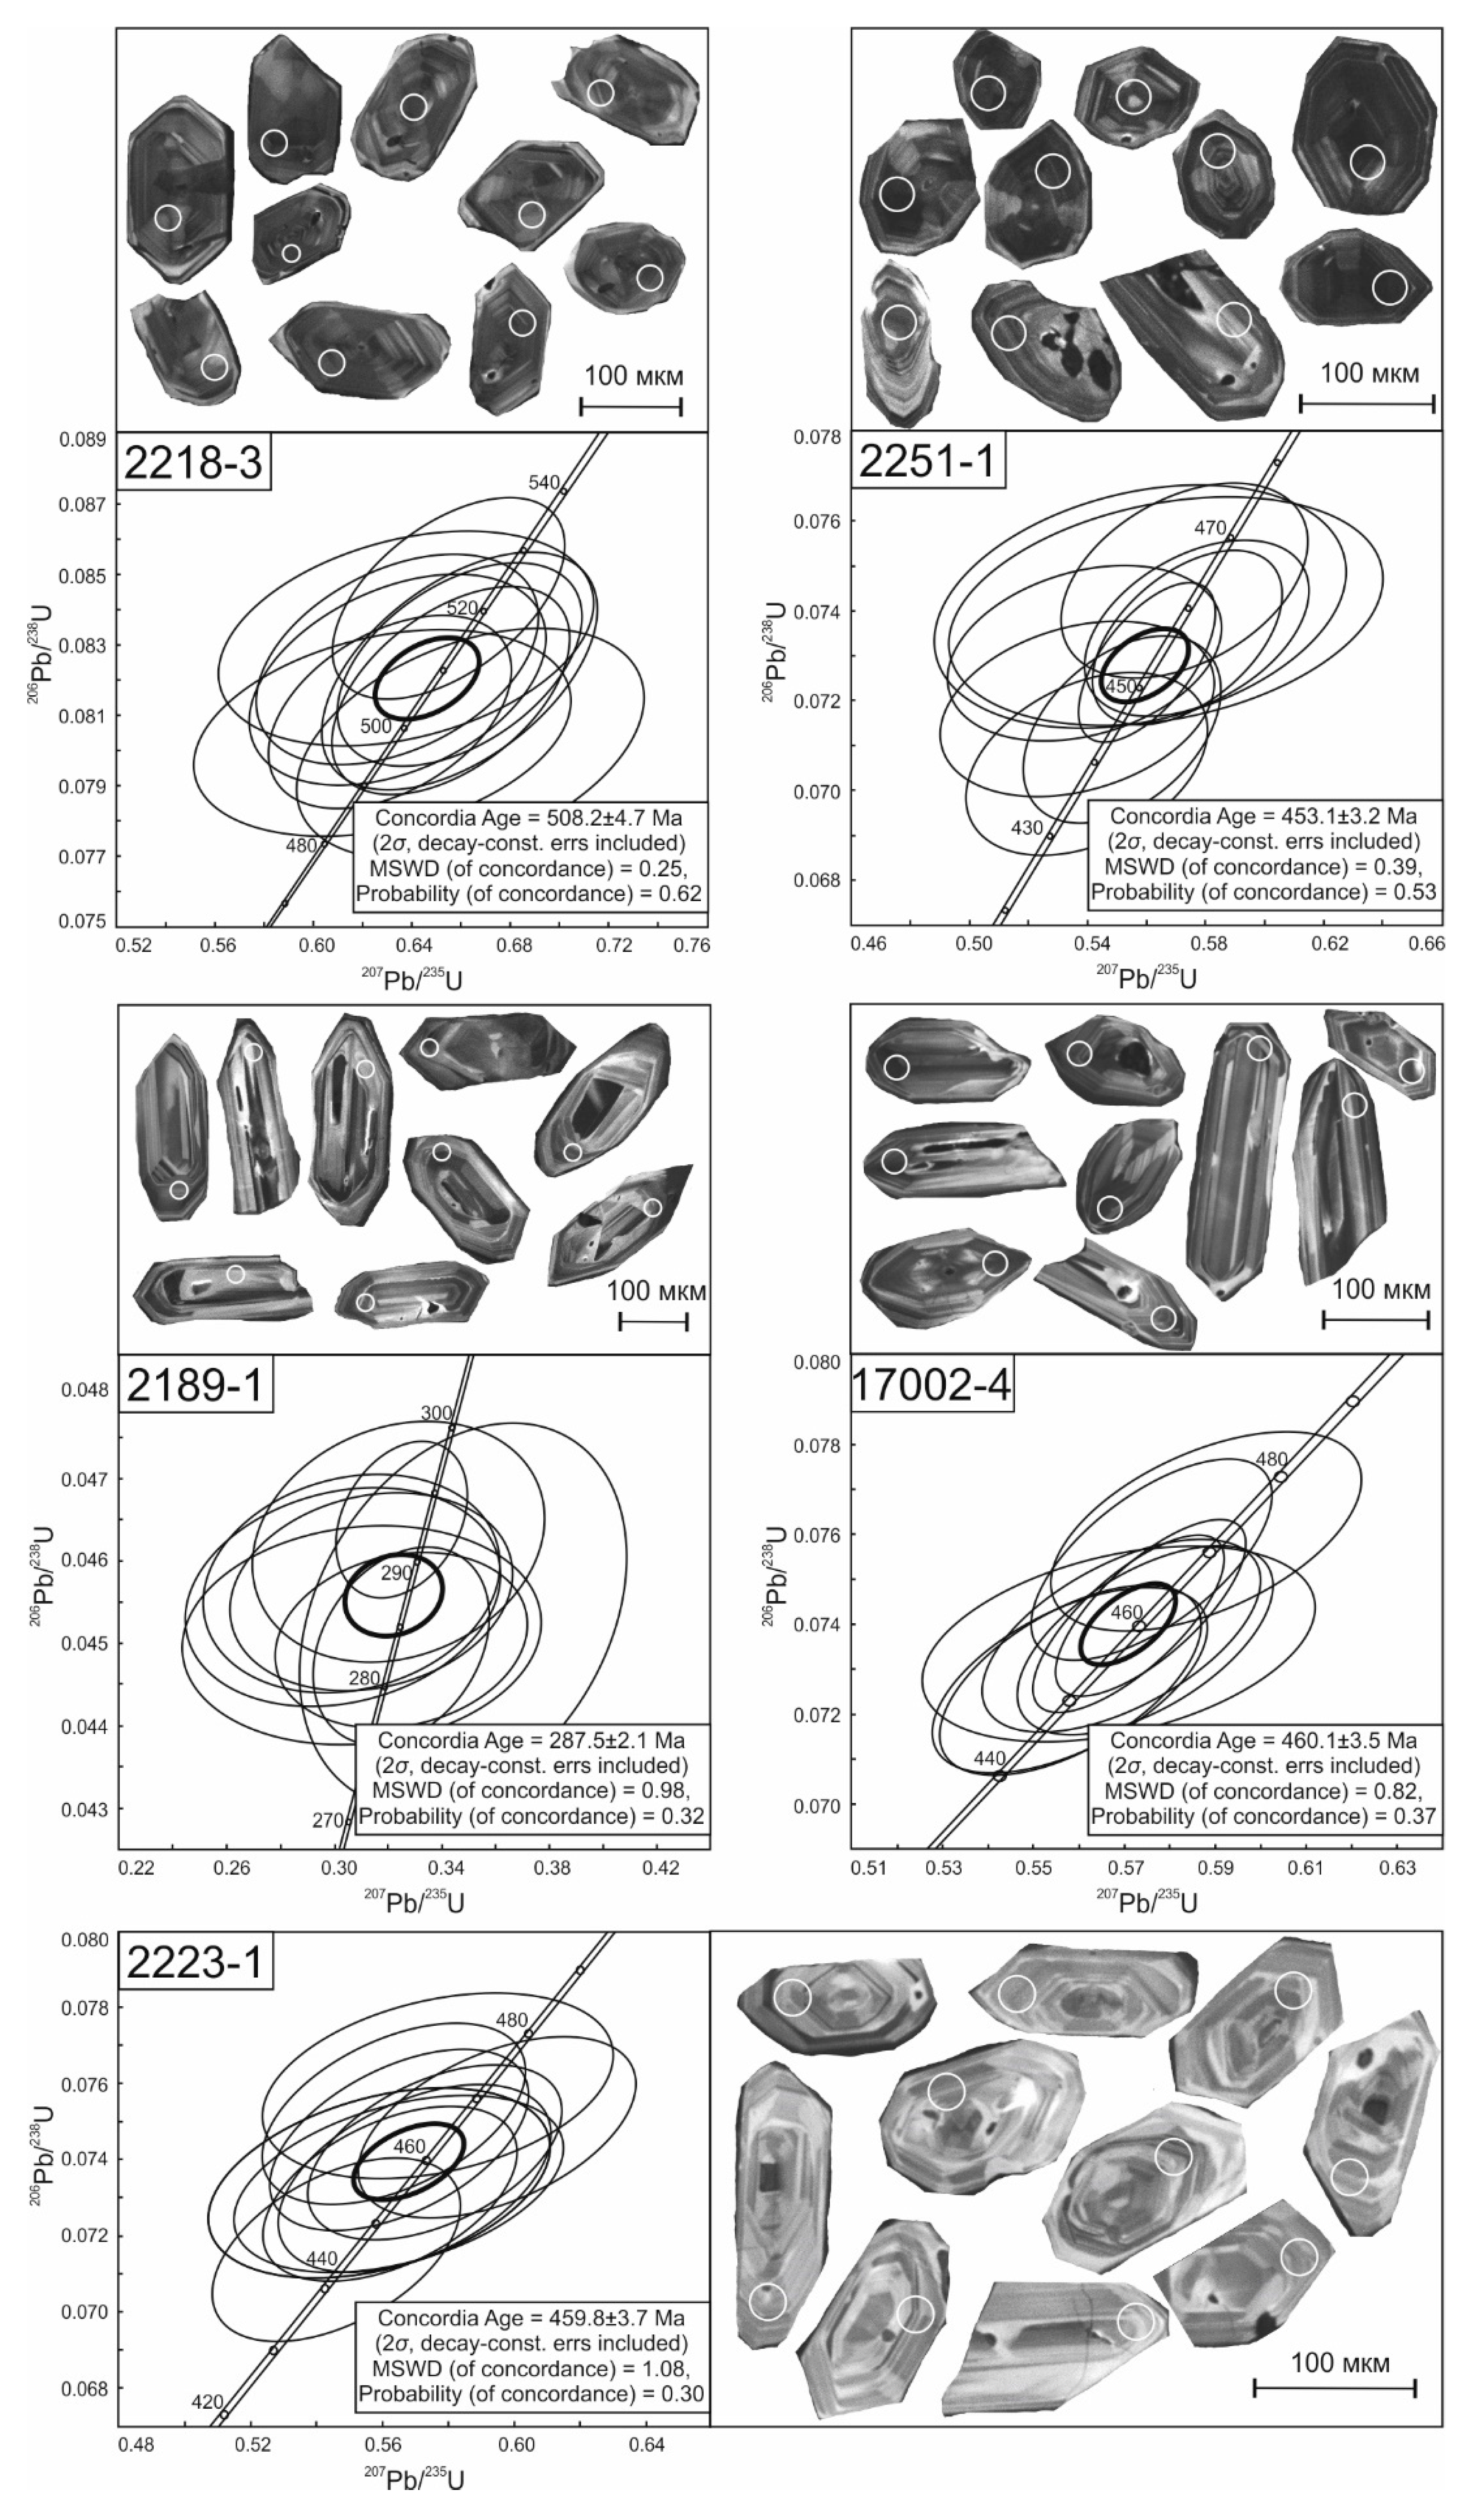
3.1. Zircon U/Pb Dating

The results of the zircon U/Pb dating are shown alongside previously published results [5,6,7] in Table 2 as arithmetic mean values grouped over all analyzed grains. In this study, five zircon U/Pb ages were obtained for samples 2218-3, 2251-1, 17002-4, 2223-1 and 2189-1. The resulting concordia plots and CL images of the analyzed zircons are shown in Figure 3.
For sample 2218-3 (rhyodacite), 10 transparent idiomorphic and sub-idiomorphic prismatic zircon crystals with typical magmatic zoning were analyzed and yielded a concordant Cambrian age of 508.2 ± 4.7 Ma. This age is consistent with independent geological data and constrains the timing of felsic volcanic activity related to Cambrian island-arc evolution and is closely associated with widely occurring Cambrian granitoids in the region [5,6]. According to the existing model of the entire Altay–Sayan region evolution [1,2,3,4], the emplacement of island arc volcanic rocks occurred in the early stages of the early Cambrian (Figure 4) and was accompanied by coeval gabbroid and granitoid intrusions. At the final stage of early Cambrian island arc development, there was underwater subaquatic volcanic activity and small reef banks developed in a warm shallow basin [1].
The concordant Ordovician ages (453.1 ± 3.2 and 460.1 ± 3.5 Ma) for rhyodacite samples 2251-1 and 17002-4 were determined by analyzing 10 and nine zircon grains, respectively. These zircon grains of both samples are yellowish to colorless, transparent idiomorphic to sub-idiomorphic prismatic crystals. In the CL images, they exhibit a bright to moderately bright luminescence, displaying typical fine to coarser magmatic zoning. In this study, a Middle Ordovician age was obtained for the Kyzyldag massif leucogranites (sample 2223-1) that intrude the Ordovician rhyodacites. For sample 2223-1, yellow, transparent, idiomorphic and subidiomorphic prismatic zircon crystals of 80–250 microns were analyzed. In the CL images these zircons have a bright luminescence, and subtle to sectoral zoning. A concordant age of 459.8 ± 3.7 Ma is obtained on a selection of 10 grains. Considering the magmatic nature of these zircons, we interpret this as the age of crystallization of the Kyzyldag massif rocks. Within error zircon U/Pb age of 451 ± 4 Ma on other granitoid facies of this massif, was obtained earlier [5].
The concordant Middle to Late Ordovician ages of the rhyodacites and granitoids indicate a subsequent episode of magmatism along the STFZ. Ordovician volcanism is not typical for the wider Altay–Sayan region of the CAOB; however, local volcanic centers are known within the nearby Khamsara terrane [42], in the Kuznetsk Alatau [43,44,45] and in the Western Sayan [44]. This period of magmatism along the STFZ is likely associated with final stage of collisional events on southern-west margin (in present-day coordinates) of the Siberian paleo-continent. The collisional events started during late Cambrian–Early Ordovician and caused intense deformation of the Altay–Sayan region paleo-structures [1]. This deformation event is associated with the closure of the marginal basins, amalgamation and gradual accretion of island-arc, associated terranes and Precambrian microcontinents to the Siberian paleo-continent. During the Cambrian–Early Ordovician, orogeny and intense collisional granitoid magmatism is typical in Tuva and the adjacent Kuznetsk Alatau and East Sayan areas [1,5,6,7,44,46,47] and is expressed along the STFZ.
Ten zircon grains were analyzed for gabbroic sample 2189-1. The grains are translucent to turbid, sub-idiomorphic to idiomorphic prismatic. In the CL images, the zircons show a bright luminescence with a fine to sectoral zoning. A concordant age of 287.5 ± 2.1 Ma (early Permian) was calculated from nine grains and one grain gave a Cambrian age of 511.2 ± 7.7 Ma. The latter was interpreted as an inherited xenocryst from the hosting Cambrian volcanic rocks. The early Permian age of these gabbros the first obtained for the STFZ and the broader Tuva Region implies a minor phase of mafic magmatism occurring here at this time. Despite the absence of wide-spread Permian magmatism in the Tuva Region, rocks of an intraplate affinity have been identified along the eastern border of Tuva and the Eastern Sayan areas, yielding ages from 305 to 292 Ma [48], in the Udino–Vitim zone east of Tuva and East Sayan with ages from 295 to 275 Ma [49], in the Synyr and Sayzhen zones of the Barguzin-Vitim volcanic province with ages from 295 to 288 Ma and from 295 to 280 Ma, respectively (Figure 5). This Permian phase of magmatism is commonly represented by dykes and alkaline mafic stocks in intracontinental rifts, were formed simultaneously with the larger Angara–Vitim granitoid batholith (303–281 Ma). The contemporaneous age of the mafic rift zone rocks and the batholithic granitoids suggests a common source of bimodal activity. It is thought that the formation of these juvenile rocks can, hence, possibly be linked to the North Asian mantle plume [50], and we assume that the emplacement of the early Permian gabbro of the STFZ fault zone could be associated with the activity of this plume (Figure 5). Its effects may have led to the formation of zones of rift magmatism in the marginal areas, and to anatectic melting of the crust under the influence of the upwelling mantle heat in the central areas [51].

3.2. Plagioclase and K-Feldspar 40Ar/39Ar Dating

Along the STFZ, characteristic mafic dykes and sills occur not structurally or temporally related to the previously discussed gabbroids, but also with a sub-latitudinal orientation similar to the STFZ. In total, eight plagioclase and K-feldspar 40Ar/39Ar plateau ages (Figure 6) were obtained on the mafic intrusives along the STFZ. The obtained 40Ar/39Ar ages can be divided into three groups: (1) early Devonian, (2) Devonian–Carboniferous, (3) “post-magmatic cooling ages”.
Group 1
Samples from the stock (3619) and dikes (3621, 4019-1), intruding the Silurian passive margin deposits in our study area, revealed Early Devonian ages. There is a plateau of four steps (Figure 6), characterized by 83% of the cumulative 39Ar fraction (Ar*) and an age of 398.7 ± 4.6 Ma in the age spectrum of K-feldspar from sample 3619. A plateau of three steps characterized by 61% of Ar* in the age spectrum of plagioclase from sample 3621 gives an age of 406.9 ± 4.1 Ma. In the age spectrum of K-feldspar from sample 4019-1, a high-temperature plateau of three steps, characterized by 44% of the allocated Ar* and gave an age of 403.9 ± 3.7 Ma. The resulting age range from 399 to 407 Ma corresponds to the closure of the 40Ar/39Ar isotope system of K-feldspars and plagioclase and, potentially, reflects a post-magmatic cooling of the gabbro intrusions, which corresponds well to geological data. During the Early Devonian significant tectono-magmatic processes were manifested throughout the southern margin of the Siberian paleo-continent (in present-day coordinates) under conditions of diffuse rifting in the back-arc region of the active continental margin (Figure 7) [50,51]. This led to the formation of an extended post-accretionary volcano-plutonic belt along the margins of the PAO basins [1,3,6]. At this time, swarms of basic stocks, sills and dikes intruded, registering large-amplitude vertical and horizontal extension of the crystalline basement and the active rise of melts to the surface. The formation of these mafic plutonic bodies was also accompanied by subalkaline basaltic to rhyolitic volcanic extrusions [52].
Other researchers [53,54] associated this magmatic activation stage directly with subduction zones at the Siberian paleo-continent margin as a result of large shear displacements at the plate boundaries.
Group 2
The Late Devonian–Mississippian 40Ar/39Ar ages were obtained from mafic intrusions hosted by Silurian deposits (4018-1) and Cambrian granitoids (4583-1). A four-step K-feldspar plateau (70% Ar*) from sample 4018 gives an age of 365.2 ± 3.8 Ma. Sample 4583-1 gives a three-step K-feldspar plateau (53% Ar*) with an age of 340.3 ± 5.2 Ma. These 40Ar/39Ar ages (340 and 365 Ma), either show the age of K-feldspar crystallization or a cooling age, post-dating the formation of the host rocks. Most likely, the 40Ar/39Ar ages indicates the age of the formation of the mafic bodies. The nature of this potential Devonian–Carboniferous stage of the tectono-magmatic activity in the Tuva area and Altay–Sayan region remains unclear. However, cobalt mineralization with an age of 349.8 ± 3.9 Ma (Karakul field), 384–350 Ma (Hovu–Aksi field) and 379.9 ± 3.8 Ma (Harajul field) [55] could be associated with this tectono-magmatic stage. Since one of the required conditions for cobalt mineralization is synchronicity with basite formation [55,56,57,58], the 40Ar/39Ar ages obtained can directly date the introduction of gabbro stocks and dikes. It is possible that gabbros have older ages of Cambrian and Devonian stages; however, their 40Ar/39Ar ages still indicating a Devonian–Carboniferous stage of reactivation.
Group 3
The third group of 40Ar/39Ar ages is not supported by either independent geological or other geochronological data and includes post-magmatic cooling ages. Sample 3624-2 with an early Cambrian (529 ± 3 Ma) zircon U/Pb age [5] has an Early Ordovician (476.3 ± 10.3 Ma) K-feldspar 40Ar/39Ar age as shown by a three-step plateau (95% Ar*). The K-feldspar 40Ar/39Ar age of sample 3741-2 from the gabbro intruded Cambrian volcanic rocks is early Silurian (432.3 ± 13.2 Ma) as shown by a plateau of six steps (93% Ar*). In the Early Silurian, geological data indicates the existence of a regional passive margin basin with carbonate-terrigenous sedimentation and wide distribution of brachiopods and bryozoans [59]. The Silurian sedimentation history suggests a passive margin at this time, and therefore, the obtained 40Ar/39Ar age represents steady cooling post-emplacement.
A Middle Devonian K-feldspar age (388.1 ± 6.8 Ma) was obtained for sample 4033-4 from gabbro dike intruded Cambrian granitoids with a plateau of six steps (95% Ar*). At this time, detrital-clastic and carbonate sediments indicative of a shallow-water basin isolated from the sea and desalinated lagoons prevail in the Tuva area [44]. Obscene of the geological information about the Middle Devonian mafic bodies along the STFZ indicates this 40Ar/39Ar age is not the crystallization age. Thus, this 40Ar/39Ar age clearly shows the post-magmatic cooling of the Tannuol basement.

3.3. AFT Thermochronometry

Six AFT ages were obtained for Kyzyldag massif basement samples (2223-1, 2224-1, 2225-1, 2226-1, 2227-1, 2228-1) along a profile across the STFZ. Analytical details can be found in Table 3. AFT ages are reported both as conventional zeta and central ages. Within uncertainty, these ages are the same [60,61]; therefore, only the conventional zeta ages will be reported in the following structural map and profile (Figure 8). All samples satisfy the chi-squared test (>5%). The chi-square value is used to test the dispersion of single grain ages. In this case, all the grains in each sample can be grouped in one age population. Four samples (2223-1, 2225-1, 2227-1, 2228-1) exhibit early–middle Paleogene (~60–40 Ma) AFT ages, whereas two samples (2224-1, 2226-1) have Late Cretaceous AFT ages (~80 and 75 Ma). Generally, the obtained AFT ages are younger than in other areas of Altay–Sayan region [26,27,28,62,63,64,65]. It can be dealt with the analyzed samples are clearly located in major fault systems [62,63] such as the STFZ.
As shown on the structural map and vertical profile in Figure 8, the sampled AFT age-elevation profile is cut by several fault branches and AFT ages indicate differential fault movements and regional tilting of crustal blocks along the STFZ. Mean track lengths (MTL) and length distributions show signs of thermal track shortening (Figure 8 and Table 3), suggesting a relatively long residence at APAZ temperatures (120–60 °C). Most length-frequency distributions exhibit relatively narrow to slightly broader, asymmetrical to slightly negatively skewed histograms with MTL (lm) between 11.8 and 12.3 μm (standard deviations between 1.5 and 1.8 μm). All analyzed samples have apatite grains with relatively high values of Dpar, i.e., between 2.2 and 2.5 μm (standard deviations between 0.1 and 0.5 μm), which are usually more resistant to annealing [40,41].
The standard target value of ~100 measurable confined tracks was not attained; however, most of our samples exhibit fewer numbers of confined tracks (~50). For each sample with sufficient to acceptable numbers of horizontal confined tracks (from 43 to 58 in this study) thermal history models were generated using the QTQt software [39]. The thermal history models reveal three stages based on the good fits of the modelled tT-paths (black lines), although not all samples show the first stage clearly: (1) Cretaceous–Eocene cooling (~100–40 Ma), (2) Eocene–Miocene stability (~40–10 Ma), (3) late Neogene to recent cooling (~10–0 Ma) (Figure 8). It should be noted that the latter “phase” might be enhanced by a well-known modelling artifact [38].
The AFT ages and thermal history models for the basement along the STFZ generally point to a Cretaceous–Eocene cooling episode associated with basement denudation and exhumation. This is supported by stratigraphic data [8], despite the absence of Upper Cretaceous sediments in the Mesozoic Ulughem Basin and Paleocene sediments in the Cenozoic Ubsunur Basin. The late Eocene Kurgak Formation, represented by continental molasses, suggests that tectonic movements induced basement denudation and exhumation, resulting in clastic sediments, and hence, the transport of detrital material to the Ubsunur Basin. We interpret the Cretaceous–Eocene cooling event as a result of increased Meso-Cenozoic denudation of the Tuvinian basement due to the reactivation of the STFZ faults. This STFZ reactivation may have been caused by (soft) collision of the Siberian and Amur paleo-continents in the Late Cretaceous–early Palaeogene [66]. The collision between Siberia and Amur (or Mongolia–North China) induced strong compression and thickening of the crust, leading to post-orogenic collapse of the Mongol–Okhotsk belt. The studied intrusions here are not deformed but evidence for the Late Mesozoic compressive deformation exists along the Siberian platform [26,64,67].
Following the Cretaceous–Eocene cooling, the thermal history models show an Eocene–Miocene period of near-horizontal tT-paths, indicative of tectonic quiescence and no to minor basement denudation and exhumation. Contemporaneously, the sedimentary record of the Ubsunur Basin [13] testifies to the evolution of a large paleo-lake, attaining maximum depths in the late Miocene. Some tT-paths (2226-1, 2227-1, 2228-1) of the thermal history models might suggest an Eocene–Miocene heating episode. This heating episode can be interpreted as a consequence of the basement burial under thick sediments in the aforementioned context, since there are no indications, such as thermal sources (e.g., Cenozoic intrusions) capable of significantly perturbing the local to regional geothermal gradient. Although remnants of Neogene deposits were not found on the tops or slopes of the Kyzyldag massif, its basement could nevertheless have been covered by them, and hence, the boundaries of this paleo-lake basin could have reached to our study area, i.e., further north than previously appreciated.
The thermal history models, especially for samples 2226-1 and 2227-1, seem to exhibit a late Neogene rapid cooling episode (from ~10 Ma onwards). Although the significance of this accelerated cooling is often dubious [37], and can potentially point to a modeling artifact, we interpret this episode as denudation induced by late Cenozoic renewed reactivation along the STFZ leading to the eventual building of the modern topography of our study area. This is supported by changes in sedimentation conditions in the Ubsunur Basin [13], where the appearance of pebbles and conglomerates replace the fine clastic lake deposit facies, pointing towards rapid exhumation of the basement along a reactivated the STFZ and potentially removing a Neogene cover. It is possible that the rapid denudation episode is due to changing of climate as well as tectonics. Accumulation of late Miocene sediments took place in warm climatic conditions. These sediments contain significant amounts of organic matter and ferromanganese nodules. Fragments of mollusk shells and fish bones indicate tropical conditions in a lacustrine to slow river facies [14]. In the late Miocene–early Pliocene, climate changed and sediment accumulation transpired under cooler conditions [12]. During this time, fine-grained arkosic sands and gray clays with mollusk fossils specific for a northern subtropics subzone climate were formed [13]. The late Neogene tectonic reactivation continued during the Quaternary and is still active today. This is evidenced by geomorphology, quaternary geology, seismological and paleo-seismological investigations. Signs of neotectonic movements were found within the East Tannuola Range, including the stepped nature of the modern relief, antecedent entrenching of river valleys, intersection of active faults displacing Late Pleistocene and Holocene alluvial sediments, seismic fractures in tectonic zones [68]. Furthermore, modern earthquakes (M = 6.7, [69]) and paleo-earthquakes with ages of 3000–3500 years [70] in the Tuva study area are documented and demonstrate the ongoing tectonic activity of the main fault zones including the STFZ. Late Neogene STFZ reactivation is likely related to continuing India–Eurasia convergence [65] and consequential structural reorganization within the CAOB edifice.
The low-temperature thermochronology was not able to resolve the tectonic history of the STFZ during the late Permian to the Lower Cretaceous. It is assumed that in the Late Permian the region was in a stable tectonic regime and was penoplenized [44]. In the Triassic, weathering crusts began forming within the Altay–Sayan region [44] but there is no evidence of this event in study area. This probably due to the weathering crusts could be denudated during Cretaceous–Eocene cooling episode. In the Jurassic–Cretaceous, there was an active restructuring of the tectonic regime in the region resulting in a clear Mesozoic overprint of the Paleozoic structures and basement [9,10].

4. Conclusions

The results of this study on igneous rocks along the South Tannuol Fault Zone (STFZ) using multi-method high-temperature and low-temperature geochronology allowed reconstructing the thermo-tectonic history and reactivation of this major structure in the poorly studied area (Figure 9).
  • Cambrian (~510 Ma) zircon U/Pb ages of felsic volcanic rocks and a single inherited grain in a Permian gabbro demonstrates synchronicity with granitoid magmatism that is widespread in the Altay–Sayan area. This is interpreted as the age of island-arc volcanism within the STFZ basement during the final stage of its formation.
  • Ordovician (460–450 Ma) zircon U/Pb ages for rhyodacites were obtained along the STFZ structures for the first time and indicate the presence of locally developed Ordovician volcanism. Ordovician volcanism is contemporaneous with Ordovician granitoid magmatism and marks the subsequent activation episode of the STFZ during the collision events on the southwest Siberian continental margin.
  • Early Devonian (~410–400 Ma) and Late Devonian–early Carboniferous (~365 and 340 Ma) activation episodes accompanied by the post-magmatic development of small basic bodies along the STFZ were determined by plagioclase and K-feldspar 40Ar/39Ar dating. These episodes of tectonic activation of the STFZ are probably related to the rifting processes at the backarc region of the active continental margin.
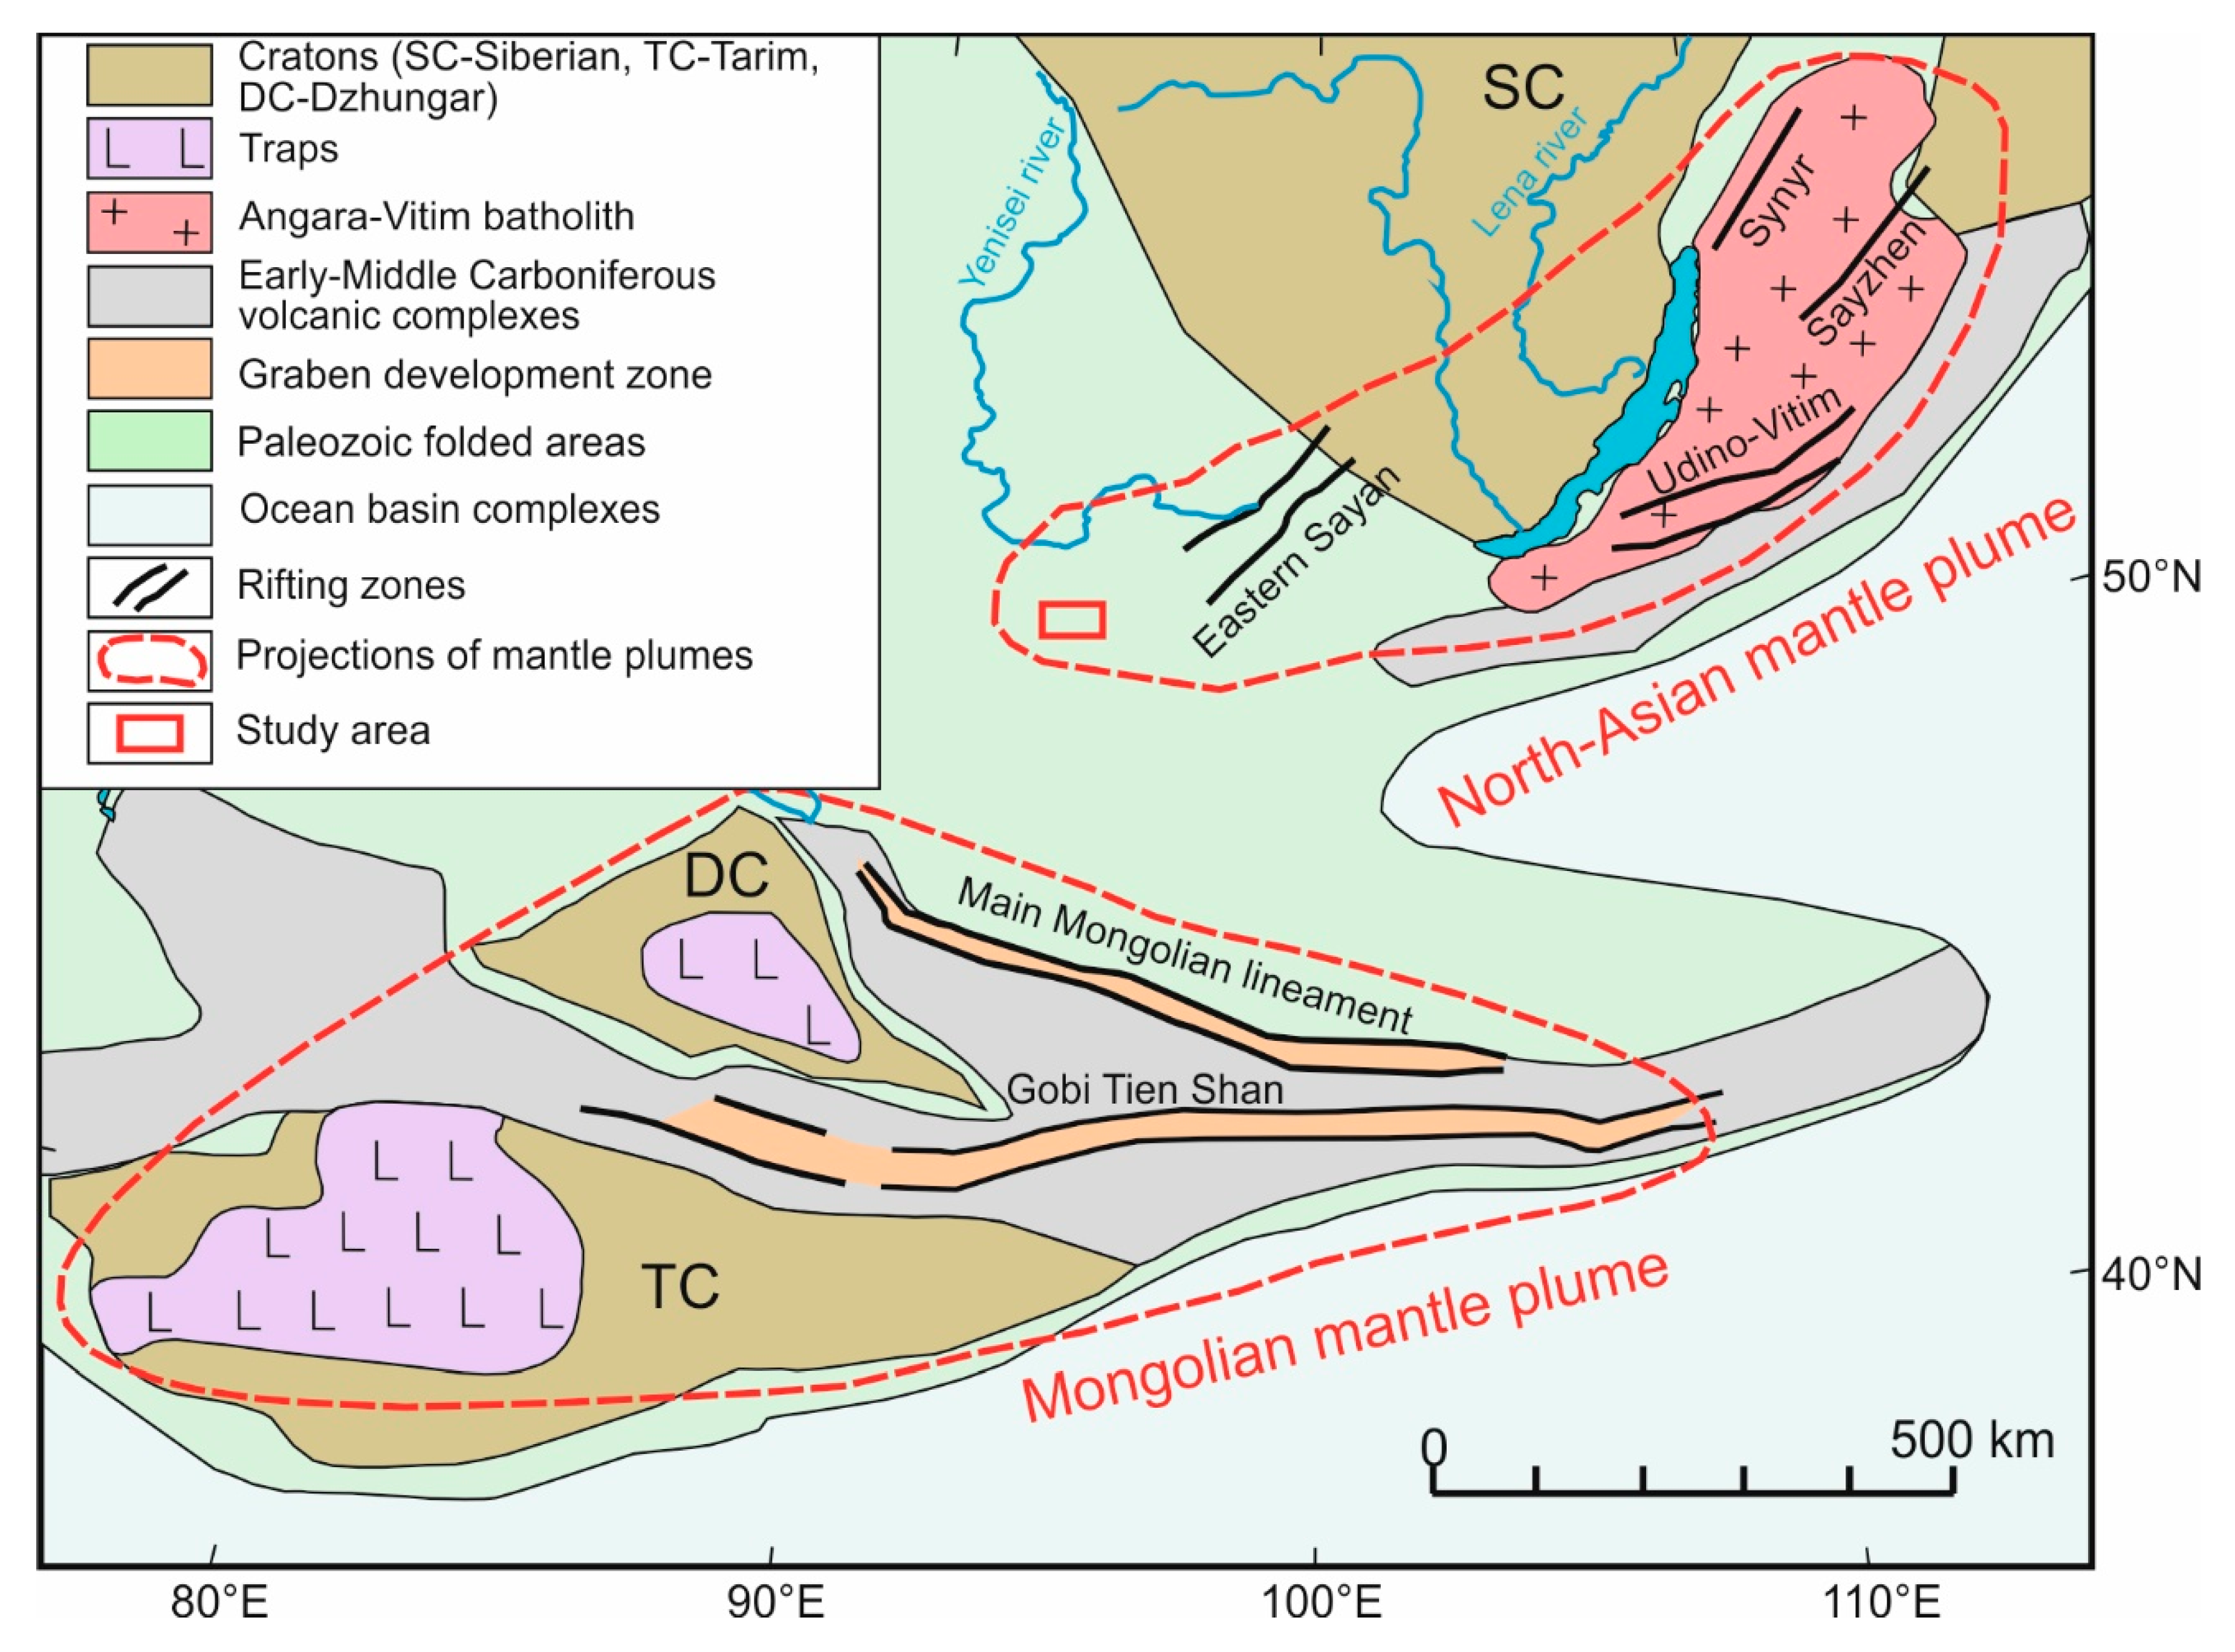
  • An Early Permian (~290 Ma) zircon U/Pb gabbro age is atypical for the STFZ and eastern Altay–Sayan region. The geodynamic setting of these gabbroids requires substantial further study but we might assume a connection with the North Asian mantle plume and its interaction with the Northern Asia lithosphere.
  • Late Cretaceous (~80 and 75 Ma) and early-middle Paleogene (~60–40 Ma) AFT ages are preserved in the crystalline basement along the STFZ. Thermal history modelling of the AFT data shows a Cretaceous–Eocene (~100–40 Ma) cooling episode. These ages and Cretaceous–Eocene cooling are interpreted as reflecting a period of renewed STFZ reactivation.
  • As shown in the thermal history models, the basement along the STFZ experienced temporary thermal stagnation and possibly even re-heating during the Eocene–Miocene (~40–10 Ma). This period of STFZ tectonic quiescence is evidenced by the sedimentary record of the Cenozoic Ubsunur Basin. During this period, a lake occupied the Ubsunur Basin, and its lacustrine sediments show deeper depositional environments from the Eocene to Miocene.
  • Finally, the late Neogene (from ~10 Ma onwards), the STFZ experienced renewed reactivation, resulting in the formation of the present-day mountainous topography under changing climate conditions. This reactivation episode, if not enhanced by modeling artefacts, is most likely associated with a far-field effect of the India–Eurasia collision, south of our study area, and the consequential development of the present-day mountainous topography in the area.

Supplementary Materials

The following are available online at https://www.mdpi.com/2075-163X/10/1/56/s1, Figure S1: Track lengths histograms output from QTQt software, Table S1: AFT density data, Table S2: AFT lengths data.

Author Contributions

Conceptualization, E.V.; Methodology, E.V., J.D.G., S.N. and G.V.R.; Software, G.V.R.; Validation, J.D.G., S.N. and G.V.R.; Formal Analysis, P.M.; Investigation, E.V., N.V., F.Z., S.N. and P.M.; Resources, J.D.G. and F.Z.; Data Curation, E.V.; Writing–Original Draft Preparation, E.V. and N.V.; Writing–Review & Editing, J.D.G., S.N. and G.V.R.; Visualization, N.V.; Supervision, E.V.; Project Administration, E.V.; Funding Acquisition, E.V. and J.D.G. All authors have read and agreed to the published version of the manuscript.

Funding

The reported study was carried out with a grant from the Russian Science Foundation (project №19-77-00033). Simon Nachtergaele is funded by a Ph.D. fellowship of the Research Foundation Flanders (FWO). We also wish to express our appreciation to the UGent Russia Platform for assistance and travel funds.

Acknowledgments

The authors would like to thank two anonymous reviewers for their comments and suggestions.

Conflicts of Interest

The authors declare no conflict of interest.

References

  1. Babin, G.A.; Shokalsky, S.P. Major geological features of the Altai–Sayan Folded Region (tectonic zoning, stratigraphy, magmatism, geological evolution). Geol. Miner. Resour. Sib. 2017, 6c, 19–37. (In Russian) [Google Scholar]
  2. Berzin, N.A.; Kungurtsev, L.V. Geodynamic interpretation of Altai–Sayan Geological complexes. Russ. Geol. Geophys. 1996, 37, 56–73. [Google Scholar]
  3. Gordienko, I.V.; Metelkin, D.V. The evolution of the subduction zone magmatism on the Neoproterozoic and Early Paleozoic active margins of the Paleoasian Ocean. Russ. Geol. Geophys. 2016, 57, 56–73. [Google Scholar] [CrossRef]
  4. Zonenshain, L.P.; Kuzmin, M.P.; Natapov, L.M. Geology of USSR: A Plate Tectonic Synthesis; Geodynamic Series; American Geophysical Union: Washington, DC, USA, 1990; Volume 21, p. 242. [Google Scholar]
  5. Vetrov, E.V.; Chernykh, A.I.; Babin, G.A. Early Paleozoic granitoid magmatism in the East Tannu-Ola sector of the Tuvinian magmatic belt: Geodynamic position, age, and metallogeny. Russ. Geol. Geophys. 2019, 60, 492–513. [Google Scholar]
  6. Rudnev, S.N.; Kovach, V.P.; Ponomarchuk, V.A. Vendian–Early Cambrian island-arc plagiogranitoid magmatism in the Altai–Sayan folded area and in the Lake Zone of western Mongolia (geochronological, geochemical, and isotope data). Russ. Geol. Geophys. 2013, 54, 1272–1287. [Google Scholar] [CrossRef]
  7. Mongush, A.A.; Lebedev, V.I.; Kovach, V.P.; Sal’nikova, E.B.; Druzhkova, E.K.; Yakovleva, S.Z.; Plotkina, Y.V.; Zagornaya, N.Y.; Travin, A.V.; Serov, P.A. The tectonomagmatic evolution of structure-lithologic complexes in the Tannu–Ola zone, Tuva, in the Late Vendian–Early Cambrian (from geochemical, Nd isotope, and geochronological data). Russ. Geol. Geophys. 2011, 52, 503–516. [Google Scholar] [CrossRef]
  8. Berzon, E.I.; Petruhina, O.N. Stratigraphic subdivision of the Jurassic System of the Ulughem coal basin (Republic of Tuva). Reg. Geol. Metallog. 2016, 68, 30–41. (In Russian) [Google Scholar]
  9. Ivantsov, S.V.; Kostesha, O.N.; Krasnolutsky, S.A.; Lyaluk, K.P. New location of the Middle Jurassic vertebrates Novoaltatsky section: A comprehensive study and paleogeographic interpretation. Bull. TSU 2009, 328, 220–225. (In Russian) [Google Scholar]
  10. Berzon, E.I.; Smokotina, I.V. New data on litho- and biostratigraphy of the Ulug–Khem coalfield (Tuva). Jurassic System in Russia: Issues of Stratigraphy and Paleogeography. In Proceedings of the VI All-Russian Meeting, Makhachkala, Russia, 15–20 September 2015; pp. 34–37. (In Russian). [Google Scholar]
  11. Teslenko, Y.V. Stratigraphy and Flora of Jurassic Deposits of Western and Southern Siberia and Tuva; Nedra: Moscow, Russia, 1970; p. 288. (In Russian) [Google Scholar]
  12. Devyatkin, E.V. Geology of the Cenozoic of Western Mongolia. Geology of the Mesozoic and Cenozoic of Western Mongolia. Science 1970, 2, 44–102. (In Russian) [Google Scholar]
  13. Minina, E.A.; Borisov, B.A. Dismemberment and Correlation of the Cenozoic Sediments of Tuva with the Aim of Compiling Reference Legends for the State Geological Map-50; Public Foundation FGUGP: Kyzyl, Russia, 1991. (In Russian) [Google Scholar]
  14. Popova, S.M. Freshwater Mollusks of the Neogene Stratum of the Ubsunur Depression (Tuva ASSR); Mesozoic and Cenozoic Lakes of Siberia; Nedra: Moscow, Russia, 1968; pp. 232–251. (In Russian) [Google Scholar]
  15. Devyatkin, E.V. Cenozoic Sediments and Neotectonics of South-Eastern Altai; Trudy Geologii Instituta: Moscow, Russia, 1965; p. 234. (In Russian) [Google Scholar]
  16. Williams, I.S. U–Th–Pb Geochronology by Ion Microprobe. In Applications of Microanalytical Techniques to Understanding Mineralizing Processes; McKibben, M.A., Shanks, W.C., Ridley, W.I., Eds.; Reviews in Economic Geology: Malden, MA, USA, 1998; Volume 7, pp. 1–35. [Google Scholar]
  17. Black, L.P.; Kamo, S.L.; Allen, C.M.; Aleinikoff, J.N.; Davis, D.W.; Korsch, R.J.; Foudoulis, C. TEMORA 1: A new zircon standard for U–Pb geochronology. Chem. Geol. 2003, 200, 155–170. [Google Scholar] [CrossRef]
  18. Ludwig, K. User’s Manual for Isoplot 3.00: A Geochronological Toolkit for Microsoft Excel; Berkeley Geochronology Center Special Publication: Berkeley, CA, USA, 2003; Volume 4. [Google Scholar]
  19. Cassata, W.S.; Renne, P.R.; Shuster, D.L. Argon diffusion in plagioclase and implications for thermochronometry: A case study from the Bushveld Complex, South Africa. Geochim. Cosmochim. Acta 2009, 73, 6600–6612. [Google Scholar] [CrossRef]
  20. Reynolds, P.H. Low temperature thermochronology by the 40Ar/39Ar method. In Short Course Handbook on Low Temperature Thermochronology; Zentilli, M., Reynolds, P.H., Eds.; Mineralogical Association of Canada: Quebec City, QC, Canada, 1992; pp. 3–19. [Google Scholar]
  21. McDougall, I.; Harrison, M. Geochronology and Thermochronology by the 40Ar/39Ar Method; Oxford University Press: Oxford, UK, 1999; p. 269. [Google Scholar]
  22. Reiners, P.W.; Ehlers, T.A.; Zeitler, P.K. Past, Present, and Future of Thermochronology. Rev. Mineral. Geochem. 2005, 58, 1–18. [Google Scholar] [CrossRef] [Green Version]
  23. Travin, A.V.; Yudin, D.S.; Vladimirov, A.G.; Khromykh, S.V.; Volkova, N.I.; Mekhonoshin, A.S.; Kolotilina, T.B. Thermochronology of the Chernorud Granulite Zone, Ol’khon Region, Western Baikal Area. Geochem. Int. 2009, 47, 1107–1124. [Google Scholar] [CrossRef] [Green Version]
  24. Baksi, A.K.; Archibald, D.A.; Farrar, E. Intercalibration of 40Ar/39Ar dating standarts. Chem. Geol. 1996, 129, 307–324. [Google Scholar] [CrossRef]
  25. Wagner, G.A.; Van den haute, P. Fission Track-Dating; Kluwer Academic Publishers: Dordrecht, The Netherlands, 1992; p. 285. [Google Scholar]
  26. De Grave, J.; Van den haute, P. Denudation and cooling of the Lake Teletskoye region in the Altai Mountains (South Siberia) as revealed by apatite fission-track thermochronology. Tectonophysics 2002, 349, 145–159. [Google Scholar] [CrossRef]
  27. De Grave, J.; Buslov, M.M.; Van den haute, P.; Metcalf, J.; Dehandschutter, B.; Mc Williams, M.O. Multi-Method chronometry of the Teletskoye graben and its basement, Siberian Altai Mountains: New insights on its thermo-tectonic evolution. Geol. Soc. Lond. Spec. Publ. 2009, 324, 237–259. [Google Scholar] [CrossRef]
  28. De Grave, J.; Glorie, S.; Zhimulev, F.I.; Buslov, M.M.; Elburg, M.; Vanhaecke, F.; Van den haute, P. Emplacement and exhumation of the Kuznetsk–Alatau basement (Siberia): Implications for the tectonic evolution of the Central Asian Orogenic Belt and sediment supply to the Kuznetsk, Minusa and West Siberian Basins. Terra Nova 2011, 23, 248–256. [Google Scholar] [CrossRef]
  29. Glorie, S.; De Grave, J.; Buslov, M.M.; Elburg, M.A.; Stockli, D.F.; Gerdes, A.; Van den haute, P. Multi-method chronometric constraints on the evolution of the Northern Kyrgyz Tien Shan granitoids (Central Asian Orogenic Belt): From emplacement to exhumation. J. Asian Earth Sci. 2010, 38, 131–146. [Google Scholar] [CrossRef]
  30. De Pelsmaeker, E.; Glorie, S.; Buslov, M.M.; Zhimulev, F.; Poujol, M.; Korobkin, V.V.; Vanhaecke, F.; Vetrov, E.V.; De Grave, J. Late-Paleozoic emplacement and Meso-Cenozoic reactivation of the southern Kazakhstan granitoid basement. Tectonophysics 2015, 662, 416–433. [Google Scholar] [CrossRef] [Green Version]
  31. Nachtergaele, S.; De Pelsmaeker, E.; Glorie, S.; Zhimulev, F.; Jolivet, M.; Danisík, M.; Buslov, M.M.; De Grave, J. Meso-Cenozoic tectonic evolution of the Talas–Fergana region of the Kyrgyz Tien Shan revealed by low-temperature basement and detrital thermochronology. Geosci. Front. 2018, 9, 1495–1514. [Google Scholar] [CrossRef]
  32. Van Ranst, G.; Carlos Pedrosa-Soares, A.P.; Novo, T.; Vermeesch, P.; De Grave, J. New insights from low-temperature thermochronology into the tectonic and geomorphologic evolution of the southeast Brazilian highlands and passive margin. Geosci. Front. 2019. [Google Scholar] [CrossRef]
  33. Van Ranst, G.; Baert, P.; Fernandes, A.C.; De Grave, J. Technical note: TRACKFlow, a new versatile microscope system for fission track analysis. Geochronology 2019. [Google Scholar] [CrossRef] [Green Version]
  34. McDowell, F.W.; McIntosh, W.C.; Farley, K.A. A precise 40Ar–39Ar reference age for the Durango apatite (U–Th)/He and fission-track dating standard. Chem. Geol. 2005, 214, 249–263. [Google Scholar] [CrossRef]
  35. Hurford, A.J.; Hammerschmidt, K. 40Ar/39Ar and K/Ar dating of the Bishop and Fish Canyon Tuffs: Calibration ages for fission-track dating standards. Chem. Geol. 1985, 58, 23–32. [Google Scholar] [CrossRef]
  36. De Corte, F.; Bellemans, F.; Van den haute, P.; Ingelbrecht, C.; Nicholl, C. A New U Doped Glass Certified by the European Commission for the Calibration of Fission Track Dating; Kluwer Academic Publishers: Dordrecht, The Netherlands, 1998; pp. 67–78. [Google Scholar]
  37. Ketcham, R.A.; Donelick, R.A.; Carlson, W.D. Variability of apatite fission-track anneling kinetics: III. Extrapolation to geological time scales. Am. Mineral. 1999, 84, 1235–1255. [Google Scholar] [CrossRef]
  38. Ketcham, R.A.; Carter, A.; Donelick, R.A.; Barbarand, J.; Hurford, A.J. Improved modeling of fission-track annealing in apatite. Am. Mineral. 2007, 92, 799–810. [Google Scholar] [CrossRef]
  39. Gallagher, K. Transdimensional inverse thermal history modeling for quantitative thermochronology. J. Geophys. Res. Solid Earth 2012, 117, 1–16. [Google Scholar] [CrossRef] [Green Version]
  40. Carlson, W.D.; Donelick, R.A.; Ketcham, R.A. Variability of apatite fission-track annealing kinetics: I. Experimental results. Am. Mineral. 1999, 84, 1213–1223. [Google Scholar] [CrossRef]
  41. Donelick, R.; O’Sullivan, P.; Ketcham, R. Apatite fission-track analysis. Rev. Mineral. Geochem. 2005, 58, 49–94. [Google Scholar] [CrossRef]
  42. Shkol’nik, S.I.; Ivanov, A.V.; Reznitsky, L.Z.; Letnikova, E.F.; Hyaiyu, H.; Zhiqlang, Y.; Youjueen, L.; Vishnevskaya, I.A.; Barash, I.G. Middle Ordovician effusive rocks of the Khamsara terrane (Tyva) as an indicator complex. Russ. Geol. Geophys. 2017, 58, 1032–1044. [Google Scholar] [CrossRef]
  43. Babin, G.A.; Borisov, S.M.; Tokarev, V.N. The Legend of the Kuzbass Series of the State Geological Map of the Russian Federation in Scale 1: 200,000, 2nd ed.; Public Foundation FGUGP: Novokuznetsk, Russia, 1999. (In Russian) [Google Scholar]
  44. Babin, G.A.; Zeyfert, L.L.; Shchigrev, A.F. The Legend for the Altai-Sayan Map Series of the Russian Federation State Geological Map in Scale 1:1000000, 3rd ed.; Public Foundation FGUGP: Novokuznetsk, Russia, 2006. (In Russian) [Google Scholar]
  45. Vorontsov, A.A.; Perfilova, O.Y.; Kruk, N.N. Geodynamic setting, structure, and composition of continuous trachybasalt–trachyandezite–rhyolite series in the north of the Altai–Sayan Area: The role of crust-mantle interaction in continental magmaformation. Russ. Geol. Geophys. 2018, 59, 2055–2078. [Google Scholar] [CrossRef]
  46. Rudnev, S.N.; Serov, P.A.; Kiseleva, V.Y. Vendian–Early Paleozoic granitoid magmatism in Eastern Tuva. Russ. Geol. Geophys. 2015, 56, 1232–1255. [Google Scholar] [CrossRef]
  47. Kruk, N.N. Continental crust of Gorny Altai: Stages of formation and evolution; indicative role of granitoids. Russ. Geol. Geophys. 2015, 56, 1097–1113. [Google Scholar] [CrossRef]
  48. Yarmolyuk, V.V.; Kovach, V.P.; Kovalenko, V.I.; Salnikova, E.B.; Kozlovskii, A.M.; Kotov, A.B.; Yakovleva, S.Z.; Fedoseenko, A.M. Composition, sources, and mechanism of continental crust growth in the Lake zone of the Central Asian Caledonides: I. Geological and geochronological data. Petrology 2011, 19, 55–78. [Google Scholar] [CrossRef]
  49. Litvinovsky, B.A.; Tsygankov, A.A.; Jahn, B.M.; Katzir, Y.; Be’eri-Shlevin, Y. Origin and evolution of overlapping calc-alkaline and alkaline magmas: The Late Palaeozoic post-collisional igneous province of Transbaikalia (Russia). Lithos 2011, 125, 845–874. [Google Scholar] [CrossRef]
  50. Yarmolyuk, V.V.; Kuz’min, M.I.; Vorontsov, A.A. West Pacific-type convergent boundaries and their role in the formation of the Central Asian Fold Belt. Russ. Geol. Geophys. 2013, 54, 1427–1441. [Google Scholar] [CrossRef]
  51. Kuzmin, M.I.; Yarmolyuk, V.V. Plate tectonics and mantle plumes as a basis of deep-seated Earth’s tectonic activity for the last 2 Ga. Russ. Geol. Geophys. 2014, 55, 120–143. [Google Scholar] [CrossRef]
  52. Sugorakova, A.M.; Nikiforov, A.V.; Bolonin, A.V. Devonian magmatism of the Tuvinian Trough. In Large Igneous Provinces of Asia, Mantle Plumes and Metallogeny. Abstracts of the International Symposium; Sipprint: Novosibirsk, Russia, 2009; pp. 353–355. [Google Scholar]
  53. Dobretsov, N.L.; Berzin, N.A.; Buslov, M.M.; Ermikov, V.D. General aspects of the evolution of the Altai region and the interrelationships between its basement pattern and the neotectonic structural development. Russ. Geol. Geophys. 1995, 36, 3–15. [Google Scholar]
  54. Gordienko, I.V. Geodynamic evolution of the Central-Asian and Mongol–Okhotsk fold belts and formation of the endogenic deposit. Geosci. J. 2001, 5, 233–241. [Google Scholar] [CrossRef]
  55. Tretiakova, I.G.; Borisenko, A.S.; Lebedev, V.I.; Pavlova, G.G.; Goverdovskii, V.A.; Travin, A.V. Cobalt mineralization in the Altai–Sayan orogen: Age and correlation with magmatism. Russ. Geol. Geophys. 2010, 51, 1078–1090. [Google Scholar] [CrossRef]
  56. Andrews, A.J.; Masliwec, A.; Morris, W.A.; Owsiacki, L.; York, D. The silver deposits at Cobalt and Gowganda, Ontario. II: An experiment in age determinations employing radiometric and paleomagnetic measurements. Can. J. Earth Sci. 1986, 23, 1507–1519. [Google Scholar] [CrossRef]
  57. Oberthur, T.; Stein, H.; Gerdes, A.; El Ghorfi, M. Evidence for a Hercynian age for cobalt-arsenide (gold) mineralization, Bou Azzer, Anti-Atlas, Morocco from new U–Pb, Sm–Nd and Re–Os age determinations. Digging Deeper. In Proceedings of the 9 Biennial SGA Meeting, Dublin, Ireland, 20–23 August 2007; pp. 357–360. [Google Scholar]
  58. Polyakov, G.V.; Shelepaev, R.A.; Hoa, T.T.; Izokh, A.E.; Balykin, P.A.; Phuong, N.T.; Hung, T.Q.; Nien, B.A. The Nui Chua layered peridotite–gabbro complex as manifestation of Permo–Triassic mantle plume in northern Vietnam. Russ. Geol. Geophys. 2009, 50, 501–516. [Google Scholar] [CrossRef]
  59. Sennikov, N.V.; Rodina, O.A.; Izokh, N.G.; Obut, O.T. New data on Silurian vertebrates of southern Siberia. Palaeoworld 2015, 24, 231–242. [Google Scholar] [CrossRef]
  60. Galbraith, R.F. The radial plot: Graphical assessment of spread in ages. Nucl. Tracks Radiat. Meas. 1990, 17, 207–214. [Google Scholar] [CrossRef]
  61. Hurford, A.J. Standardization of fission track dating calibration: Recommendation by the Fission Track Working Group of the I.U.G.S. Subcommission on Geochronology. Chem. Geol. 1990, 80, 171–178. [Google Scholar] [CrossRef]
  62. De Grave, J.; De Pelsmaeker, E.; Zhimulev, F.I.; Glorie, S.; Buslov, M.M.; Van den haute, P. Meso-Cenozoic building of the northern Central Asian Orogenic Belt: Thermotectonic history of the Tuva region. Tectonophysics 2014, 621, 44–59. [Google Scholar] [CrossRef]
  63. Glorie, S.; De Grave, J.; Zhimulev, F.I.; Buslov, M.M.; Elburg, M.A.; Van den haute, P. Structural control on Meso-Cenozoic tectonic reactivation and denudation in the Siberian Altai: Insights from multi-method thermochronometry. Tectonophysics 2012, 544, 75–92. [Google Scholar] [CrossRef]
  64. Jolivet, M.; De Boisgrolier, T.; Petit, C.; Fournier, M.; Sankov, V.A.; Ringenbach, J.C.; Byzov, L.; Miroshnichenko, A.I.; Kovalenko, S.N.; Anisimova, S.V. How old is the Baikal Rift Zone? Insight from apatite fission track thermochronology. Tectonics 2009, 28, TC3008. [Google Scholar] [CrossRef]
  65. De Grave, J.; Buslov, M.M.; Van den haute, P.; Dehandschutter, B.; Delvaux, D. Meso-Cenozoic evolution of mountain range—Intramontane basin systems in the southern Siberian Altai Mountains by apatite fission-track thermochronology. In Thrust Belts and Foreland Basins: From Fold Kinematics to Hydrocarbon Systems; Lacombe, O., Lavé, J., Roure, F., Vergés, J., Eds.; Springer: Berlin, Heidelberg, 2007; pp. 457–470. [Google Scholar]
  66. Kravchinsky, V.A.; Cogne, J.P.; Harbert, W.P.; Kuzmin, M.I. Evolution of the Mongol–Okhotsk Ocean as constrained by new palaeomagnetic data from the Mongol–Okhotsk suture zone, Siberia. Geophys. J. Int. 2002, 148, 34–57. [Google Scholar] [CrossRef] [Green Version]
  67. Ermikov, V.D. Mesozoic precursors of rift structures of Central Asia. Bull. Cent. Res. Explor. Prod. Elf Aquitaine 1994, 18, 123–134. [Google Scholar]
  68. Zhalkovskii, N.D.; Kuchai, O.A.; Muchnaya, V.I. Seismicity and some characteristics of the stressed state of the Earth’s crust in the Altai–Sayan region. Russ. Geol. Geophys. 1996, 36, 16–25. [Google Scholar]
  69. Ovsyuchenko, A.N.; Butanaev, Y.V. Seismic history of the Altai–Sayan region and the 2011–2012 earthquakes in Tuva. New Res. Tuva 1 2017, 1, 162–180. (In Russian) [Google Scholar]
  70. Ovsyuchenko, A.N.; Butanayev, Y.V.; Kuzhuget, K.S. Paleoseismic seismotectonic study of the node in the south-west of Tuva. Vestn. Otd. Nauk Zemle 2016, 8, NZ1201. (In Russian) [Google Scholar] [CrossRef]
Figure 1. Digital elevation model (SRTM data) of the northern part of the Central Asian Orogenic Belt (CAOB). Our study area of the South Tannuol Fault Zone (STFZ) is indicated by the black box.
Minerals 10 00056 g001
Figure 2. (a) Simplified geological map of the South Tannuol Fault Zone (STFZ) (based on [5]) with sample positions indicated; (b) digital relief model (SRTM data, Mercator projection—WGS84) of the STFZ with indication of main structural features, basins and mountain ranges. Sample sites are indicated, see Table 1 for details.
Minerals 10 00056 g002
Figure 3. 206Pb/238U versus 207Pb/235U concordia plots (drawn with Isoplot [18]) and internal structure of the zircon grains in cathodoluminescence images. The central, thicker ellipse represents the Concordia age with its uncertainty.
Minerals 10 00056 g003
Figure 4. Paleogeodynamic model of the Siberian continent margin at 540–520 Ma after [3].
Minerals 10 00056 g004
Figure 5. Late Carboniferous–Early Permian large igneous provinces of Central Asia after [51].
Minerals 10 00056 g005
Figure 6. Plagioclase and K-feldspar 40Ar/39Ar step-wise heating plateau-ages reflecting emplacement ages or the post-magmatic cooling age of the gabbros (see text for detailed discussion).
Minerals 10 00056 g006
Figure 7. The structure of the Siberian continent margin in the Middle Paleozoic after [50,51].
Minerals 10 00056 g007
Figure 8. Structural map of the Kyzyldag massif (see legend for Figure 2), profile sampled across the STFZ and A–B profile constructed from the AFT results (age, mean spontaneous track lengths and thermal histories). Track lengths histograms output from QTQt software are given in Supplementary Materials (Figure S1).
Minerals 10 00056 g008
Figure 9. Tectonic events associated to the ages obtained for the STFZ samples from U/Pb, 40Ar/39Ar geochronology and apatite thermochronology. Time is shown in the horizontal axis; the vertical axis marks the isotope system’s closing temperature.
Minerals 10 00056 g009
Table 1. List of the sample locations with indication of the dating methods applied to each sample. Published data are shown in italics by a—[7], b—[6], c—[5]. ZUPb = zircon U/Pb, HblAr = hornblende Ar/Ar, PlAr = plagioclase Ar/Ar, FspAr = K-feldspar Ar/Ar, AFT = Apatite fission track. Altitude in meters above sea level.
SampleLatitudeLongitudeAltitudeLithologyLocationMethod
12218-3N50°46′04.42″E093°38′32.07″1450rhyoliteEast-Tannuol Range, Serligoruk riverZUPb
22251-1N50°44′08.64″E093°44′54.57″1412rhyodaciteEast-Tannuol Range, Despen riverZUPb
317002-4N50°43′45.26″E093°44′09.12″1209rhyodaciteEast-Tannuol Range, Despen riverZUPb
42189-1N50°55′53.44″E093°34′56.84″2178gabbroEast-Tannuol Range, Doshtughem riverZUPb
5PT-10N50°47′44.9″E093°08′43.92″1272quartz dioriteEast-Tannuol Range, Irbitey riverZUPb b
62422N50°49′23.7″E093°44′48.69″1805leucograniteEast-Tannuol Range, Bicheserlig riverZUPb c
72127-1N50°44′23.69″E093°09′40.55″1008plagiograniteEast-Tannuol Range, Irbitey riverZUPb c
82168-2N50°49′40.01″E093°24′47.31″1316dioriteEast-Tannuol Range, Holu riverZUPb c
94073-2N50°49′45.89″E093°29′01.32″1629plagiograniteEast-Tannuol Rang, Aptara riverZUPb c
104567-3N50°50′17.66″E093°46′13.91″1875plagiograniteEast-Tannuol Range, Karasuk riverZUPb c
114033-3N50°48′40.07″E093°09′35.89″1296plagiograniteEast-Tannuol Range, Tali riverZUPb c
122135-1N50°47′33.1″E093°06′33.13″1392plagiograniteEast-Tannuol Range, Irbitey riverZUPb c
13K-1N50°49′38.8″E093°07′24.66″1334gabbroEast-Tannuol Rang, Irbitey riverHblAr a
143621N50°51′30.67″E093°01′44.49″1577gabbro (dike)East-Tannuol Range, Irbitey riverPlAr
154583-1N50°49′28.62″E093°47′07.8″1668gabbro (dike)East-Tannuol Range, Karasuk riverFspAr
163619N50°51′31.72″E093°01′00.2″1580gabbroEast-Tannuol Range, Irbitey riverFspAr
173624-2N50°49′01.93″E093°07′10.91″1270gabbro East-Tannuol Range, Irbitey riverZUPb c, FspAr
184019-1N50°53′33.89″E093°08′01.2″1929gabbro (dike)East-Tannuol Range, Irbitey riverFspAr
193741-2N50°49′19.24″E093°36′02.8″1770gabbroEast-Tannuol Range, Aptara riverFspAr
204018-1N50°54′57.84″E093°00′51.22″1857gabbro (dike)East-Tannuol Range, Irbitey riverFspAr
214033-4N50°48′42.01″E093°12′13.08″1391gabbro (dike)East-Tannuol Range, Tali riverFspAr
222223-1N50°43′22.8″E093°48′25.20″1145leucograniteKyzyldag massifZUPb, AFT
232224-1N50°43′51.6″E093°48′25.20″1226leucograniteKyzyldag massifAFT
242225-1N50°44′34.8″E093°48′43.20″1313leucograniteKyzyldag massifAFT
252226-1N50°45′14.40″E093°48′50.4″1439leucograniteKyzyldag massifZUPb c, AFT
262227-1N50°45′50.4″E093°48′50.4″1452leucograniteKyzyldag massifAFT
272228-1N50°46′22.8″E093°48′54″1523leucograniteKyzyldag massifAFT
Table 2. Zircon U/Pb results (all errors are 2σ). The concordia ages were calculated using Isoplot [18]. Pbc and Pb* indicate common and radiogenic lead, respectively; U and Pb content and Th/U ratio were calculated relative to TEMORA zircon, the error in standard calibration in different sessions was from 0.24 to 0.61% (not included in above errors but required when comparing data from different mounts); common Pb correction using measured 204Pb; 207 Pb/235U calculated using 207Pb/206Pb/(238U/206Pb* = 1/137.88).
Sample206Pbc, %U, ppmTh, ppm232Th/238U206Pb*, ppm207Pb*/206Pb*±, %207Pb*/235U±, %206Pb*/238U±, %Age, Ma
2218-30.111132.674.90.5769.3530.057113.410.64593.750.082031.51508.2 ± 4.7
2251-10.21374.43470.86723.470.05712820.557723.270.0729451.19453.1 ± 3.2
2189-10.399174.9162.10.8917.1340.051696.240.35426.370.049251.26287.5 ± 2.1
17002-40.159578.3429.30.86437.8110.0690681.720.702312.410.0901911.44460.1 ± 3.5
PT-100.338214.792.10.43115.430.0577443.310.665673.540.0805681.23521.9 ± 4.1
24220.279299.6186.30.64618.540.0561682.60.555472.690.071730.62447 ± 2
2127-10.157323.6119.50.37523.0270.057912.870.66482.990.083280.9518 ± 3
2168-20.143174.377.80.4511.8910.056394.410.61784.770.07961.84492.2 ± 5.5
4073-20.172274.485.70.31620.120.05742.820.67412.930.085180.83526 ± 4
4567-30.24430.5272.50.61331.360.0588212.770.68862.920.084890.84534 ± 3
4033-30.558191.488.20.42213.9760.059926.140.69856.250.0845671.05524 ± 3
2135-10.378220.3125.40.54316.15711.76571.020.056044.870.65685.01527 ± 3
3624-20.651170.499.80.60212.610.056045.70.66065.920.085521.05529 ± 3
2223-10.133145.2103.10.7289.250.056782.380.56793.110.739591.33459.8 ± 3.7
2226-10.676133.187.90.6778.3320.054357.210.5427.350.072291.36451 ± 4
Table 3. Apatite Fission Track results: n is the number of counted grains, ρs and ρi correspond to the density of spontaneous tracks (in the apatite) and induced tracks (in the external detector, ED) respectively. ρd-values are interpolated values of the density of induced tracks in the ED irradiated against regularly spaced glass dosimeters (IRMM-540). ρs and ρi are expressed as 106 tracks/cm2; ρd is expressed as 105 tracks/cm2. Ns and Ni are the number of counted spontaneous tracks (in the apatite) and induced tracks (in the ED), respectively. Nd is the interpolated value of the number of counted induced tracks in the ED irradiated against regularly spaced glass dosimeters. P(χ2) is the chi-squared probability that the dated grains have a constant ρsi-ratio. For the calculation of the AFT zeta-age t(ζ) (in Ma), a ζ-value of 281.6 ± 5.1 a.cm2 was used, based on Durango and Fish Canyon Tuff age standards and IRMM-540 dosimeter glass. AFT ages were also calculated as central ages t(c) (in Ma). AFT length results are reported as mean track length (lm in μm) with standard deviation σ (in μm), obtained from the measurement of an amount (nl) of natural, horizontal confined tracks. Measurements of Dpar are in μm.
Samplenρs (±1σ)Nscρi (±1σ)Nicρd (±1σ)NdcρsiP(χ2)t(ζ)t(c)lm (±1σ)n1Dpar (±1σ)
2223-1262.289 (0.104)4825.058 (0.155)10655.581 (0.124)20240.48 ± 0.030.9437.5 ± 2.335.5 ± 2.212.1 ± 1.8432.3 ± 0.4
2224-1303.949 (0.161)6034.209 (0.166)6455.589 (0.124)20190.96 ± 0.050.9675.4 ± 4.873.2 ± 4.611.9 ± 1.5512.2 ± 0.3
2225-1213.330 (0.149)5094.885 (0,181)7325.595 (0.125)20140.73 ± 0.040.8057.4 ± 3.755.1 ± 4.812.1 ± 1.7472.4 ± 0.5
2226-1404.282 (0.126)12404.430 (0.124)12835.604 (0.125)20080.99 ± 0.040.4277.5 ± 3.874.9 ± 3.811.8 ± 1.5582.5 ± 0.5
2227-1413.127 (0.115)7414.263 (0.134)10105.611 (0.125)20030.74 ± 0.030.2857.9 ± 3.356.8 ± 3.512.2 ± 1.5502.2 ± 0.1
2228-1364.722 (0.154)9456.267 (0.177)12545.618 (0.126)19880.73 ± 0.030.8357.6 ± 3.059.3 ± 3.112.3 ± 1.6532.3 ± 0.4

