Human Biomonitoring Data from Mercury Exposed Miners in Six Artisanal Small-Scale Gold Mining Areas in Asia and Africa


Abstract
:Objectives
In artisanal small-scale gold mining (ASGM) areas in many developing countries, mercury (Hg) is used to extract gold from ore. Data of 1250 participants from Indonesia, Mongolia, Philippines, Tanzania, and Zimbabwe were combined to analyze the relation between exposure in ASGM areas and body burden.
Methods
Four groups were selected relating to their intensity of contact with mercury: (i) a non-exposed control group; (ii) a low exposed group with participants only living in mining areas, but not working as miners; (iii) a medium exposed group, miners living in exposed areas and working with mercury without smelting amalgam; and (iv) a high exposed group, miners living in exposed areas and smelting amalgam.
Results
Compared to the non-exposed control group, participants living and/or miners working in highly exposed areas have significantly higher concentration of total mercury in urine, hair and blood (p-value < 0.001). The median mercury value in urine in the control group is <0.2 μg/L. In the high exposed group of amalgam smelters, the median in urine is 12.0 μg/L. The median in blood in the control group is <0.93 μg/L. The median level in blood of the high exposed group is 7.56 μg/L. The median for mercury in hair samples from the control group is 0.21 μg/g. In the high exposed group the median hair concentration is 2.4 μg/g hair. Mercury levels also differ considerably between the countries, reflecting a diverse background burden due to different fish eating habits and different work place methods.
Conclusions
A high percentage of exposed individuals had levels above threshold values. These high levels of mercury are likely to be related with serious health problems.
1. Introduction
In many developing countries, ASGM is an important economic factor. According to Hentschel et al., the willingness of artisanal small-scale gold miners to operate legally depends on four interacting factors, named: “legal and administrative factors”, “moral factors”, “economic factors” and “factors related to enterprise” [1]. There are many different ways of gaining gold from ore, some with and some without using mercury. In our study, workers used mercury to extract the gold from the ore. After digging the miners crush and milling the ore. The workers add liquid mercury and pan the mixture to ensure that gold is bound to mercury forming an amalgam. These workers are called panners. To dissolve the gold from the amalgam the miners smelt the mixture and the result is refined gold and mercury vapor. These workers are called smelters. All miners still work without any kind of protection, neither gloves nor dusk masks or technical systems to avoid the release of mercury vapor. The workers inhale the toxic mercury vapor while smelting the amalgam. The environment is polluted with mercury vapor and liquid mercury, entering the ecosystem including the aquatic system. Mercury is one of the most dangerous and toxic neurotoxins [2].
An international response to mercury used in ASGM is the GMP (Global Mercury Project). Health and environment assessments were performed in several countries by UNIDO [3].
LMU (University of Munich) performed health assessments in (i) Indonesia/2003 [4], (ii) Tanzania/2003 [5,6] and (iii) Zimbabwe/2004 [7]. Two different mining areas were assessed in (i) Indonesia, (i-a) Kalimantan and (i-b) Sulawesi [4]. In (ii) Tanzania Rwamagasa mining area near Lake Victoria was assessed [5]. In (iii) Zimbabwe Kadoma mining area was assessed [7]. Apart from the GMP projects further health assessments were carried out: (iv) in the Philippines UNIDO and LMU performed 1999 and 2000 two projects in the mining area of (iv-a) Mt. Diwalwal and (iv-b) the neighboring area of Monkayo [6,8,9]. In (v) Zimbabwe LMU and the UMIT examined in 2006 exposed mother child pairs, once again in Kadoma mining area. In (vi) Mongolia two projects were performed in 2008 by WHO, the Ministry of Health of Mongolia and UMIT. The first project (vi-a) was performed in Khongor soum, the second project was performed in (vi-b) Bornuur and Jargalant soum [10].
The objective of this paper is to use a new combined database of all above mentioned projects which implies miners and communities from different countries with ASGM areas to report their levels of mercury in specimens and to compare them with threshold values and non-exposed participants.
For this purpose participants were assessed according to their exposure to mercury. Additionally the different mining areas will be compared.
2. Methods
2.1. Study Design
This study is an environmental epidemiological, cross sectional study. The influence of different external mercury exposure on the internal human exposure is analyzed. The question is, whether the kind of work or the area of living has influence on the concentration of mercury in the urine, blood or hair and if ASGM is a health hazard.
2.2. Participants
All participants had given a written consent to participate at the health assessments. Data from 1,609 participants from the five above mentioned countries were pooled into a new database. The results for children have already been published [11].
The statistical analysis was restricted to participants from 15 to 60 years, which is the usual age of miners. In total 284 participants were excluded because they were under the age of 15 and 37 participants because they were over the age of 60. Parkinson's disease, stroke, heavy consumption of alcohol and certain neurological diseases can mimic typical neurological symptoms of chronic mercury intoxication. Therefore 27 participants were excluded because of such pre-existing health problems. In the used questionnaire, questions regarding to mining history have been asked to avoid false negative results while putting former miners into one of the groups not working with mercury. Only participants with a reliable exposure history to mercury were included, e.g., participants with former exposure to mercury were not considered for the statistical analysis. In total 359 participants were excluded from the further statistical analysis. 1,250 participants, between the ages of 15 and 60 years from the database were used for the following analysis.
For each project area a comparable control area without gold mining activities was selected by the national project manager. The mercury exposure was determined by a detailed interview of each participant including actual and previous occupational history. According to the different exposures with mercury, the participants were divided into four different exposure groups: (i) A non-exposed control group volunteers from areas without gold mining activities (210 participants); (ii) a low exposed group with participants who live in mining areas but do not work with mercury. (405 participants); (iii) a medium exposed group, with participants who live in mining areas and work with mercury like panning, but do not smelt mercury (181 participants); (iv) a high exposed group, participants who live in mining areas and smelt mercury (449 participants).
The participants were divided into three different age groups: (1) 15 to 25 years, (2) 26 to 45 years and (3) 46 to 60 years. In the age group 15 to 25 years there were 399 participants, in the age group 26 to 45 745 participants and in the age group 46 to 60 years 101 participants.
2.3. Laboratory Methods
From 1250 participants urine, blood and hair samples were collected and analyzed for total mercury: (i) From the 210 participants of the control group 210 urine samples, 166 blood samples and 191 hair samples; (ii) from the 405 participants in the low exposed group 405 urine samples, 352 blood samples and 398 hair samples; (iii) from the 181 participants in the medium exposed group 181 urine samples, 168 blood samples and 177 hair samples; and (iv) from 449 participants in the high exposed group 449 urine samples, 435 blood samples and 408 hair samples.
The samples were transported to the laboratories within a month. To avoid degradation, the urine and blood samples were constantly stored at 4 °C until analysis.
2.3.1. Sample Preparation and Mercury Determination
The detailed laboratory methods can be found in the specific country reports and publications [4,5,9]. All analysis was performed by the laboratory of the Institute of Forensic Medicine (LMU), unless otherwise specified. All analyses were performed under strict internal and external quality control. The following standard reference materials served as matrix-matched control samples: Clin Chek Level II, Recipe, Germany. For many years the laboratory in Munich has been participating successfully in external quality control tests for mercury in human specimen. A short overview of the laboratory methods will be given in the following paragraph.
Spontaneous urine samples were acidified to avoid degradation. Urine samples from Indonesia, Philippines, Tanzania, Zimbabwe and the second project in Mongolia were directly analyzed without further pre-treatment. The content of total mercury was determined by Cold-Vapor Atomic-Absorption-Spectrometry (CV-AAS) after capturing the mercury on a gold amalgam net. The urine samples from the first project in Mongolia were decomposed in sealed Teflon® containers, and total mercury concentration was measured by the same method as described above; the analysis was performed by the National Institute for Minamata Disease (Minamata, Kumamoto, Japan).
Blood was sampled in EDTA-coated vials. Blood samples from the Indonesia, Philippines, Tanzania, Zimbabwe and the second project in Mongolia were analyzed without pre-treatment with CV-AAS as described above. Blood samples from the first project in Mongolia were analyzed using a Inductively-Coupled-Plasma Mass-Spectrometer (ICP-MS) by the Health and Safety Laboratory (Harpur Hill, Buxton, United Kingdom).
Hair was cut if possible from the scalp with a scissor. If the hair was long, only the three centimeters closest to the scalp were used. The hair samples were pre-treated and digested. Different ways of analyzing mercury in hair exist in literature, but in this study, no initial washing steps were performed. All hair samples were analyzed with CV-AAS. The hair samples from the first project in Mongolia were analyzed using CVAAS [12]. The hair samples were washed well with detergent, and rinsed two times with acetone to dry. Sample digestion was performed with HNO3 HClO4 and H2SO4 followed by reduction to Hg0 by SnCl2. The total mercury levels were analyzed with an oxygen combustion-gold amalgamation method. The analysis for the first project was performed by the National Institute for Minamata Disease (Minamata, Kumamoto, Japan), the analysis of the second project in Mongolia was done by the National Institute of Public Health (Ulaanbaatar, Mongolia).
Different methods were used to identify the amount of mercury in the specimens because in this new database, information about different countries, from different mercury projects, were pooled together. Therefore, different methods and laboratories were described.
2.3.2. Limits of Detection (LOD)
The LODs for urine analysis were 0.10 μg/L for the first project in Mongolia, 0.20 μg/L for Indonesia, Tanzania, Zimbabwe plus the second project in Mongolia and 0.50 μg/L for the Philippines. The LODs for blood analysis were 0.20 μg/L for all countries, except for the Philippines with 0.50 μg/L. The LODs for hair analysis were 0.01 μg/g for the first project in Mongolia and for the Philippines, and 0.02 μg/g for Zimbabwe, Tanzania and Indonesia. For the statistical analysis values below the LOD were set to ½ of the LOD.
2.3.3. Threshold Values
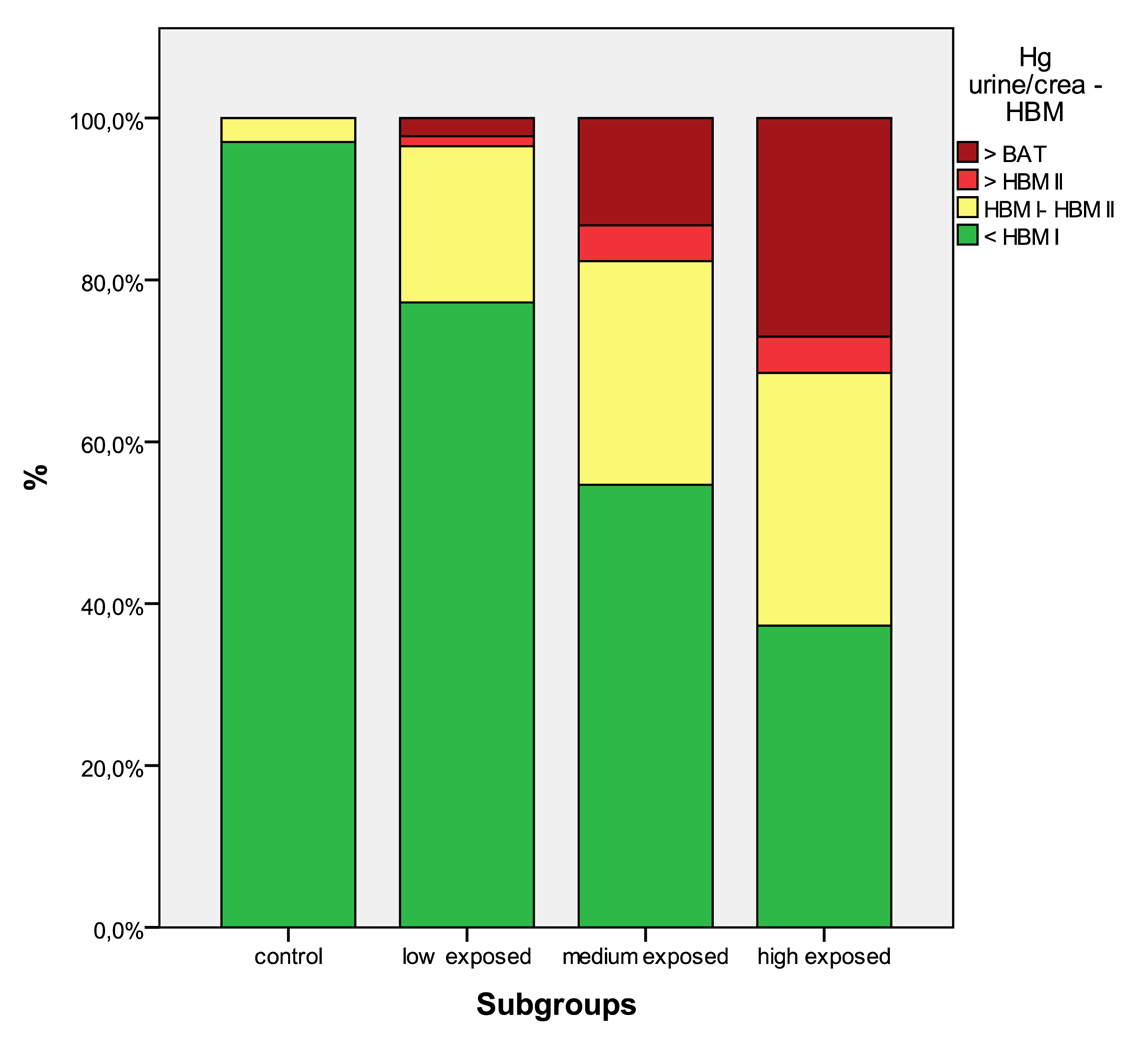
To compare the results threshold values were used. There are not many actual threshold values available, mainly not for elemental mercury [7]. WHO recommendations are out of date [13]. The German Human Biomonitoring Commission recommended threshold values for mercury in urine and blood for the common population [14]. These threshold values (called Human Biomonitoring levels—HBM) were used to describe the health risks from mercury exposure. Results below the lower threshold HBM I level are considered as “safe” levels. Results between HBM I and HBM II should be taken as “alert” levels and reducing the level of exposure as reasonably as is achievable is indicated [15], adverse health effects are not excluded [9,16]. Mercury levels above HBM II are seen as “action” levels, negative health effects are likely, and exposure reduction is essential [15,16].
Another threshold value is the BAT value of the “Commission for the Investigation of Health Hazards of Chemical Compounds in the Work Area”, above which workers are not allowed to work anymore at their work place [17].
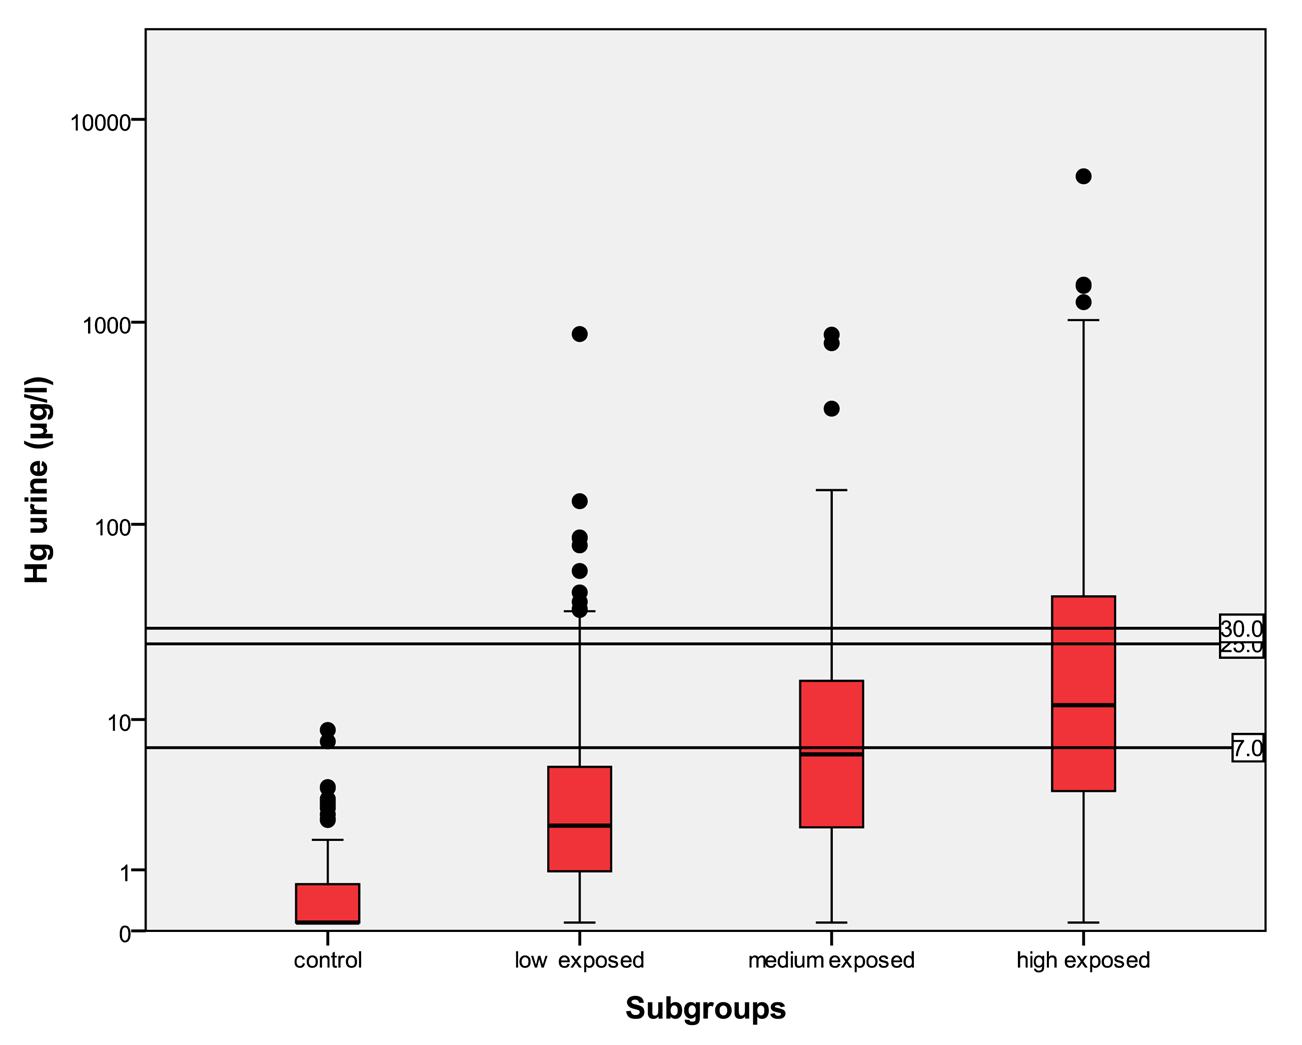
For mercury in urine the HBM I level is 7 μg/L, the HBM II level is 25 μg/L and the BAT value is 30 μg/L. For mercury in urine adjusted to creatinine the HBM I level is 5 μg/g crea, the HBM II level is 20 μg/g crea and the BAT value is 25 μg/g crea. For mercury in blood the HBM I level is 5 μg/L and the HBM II level is 15 μg/L.
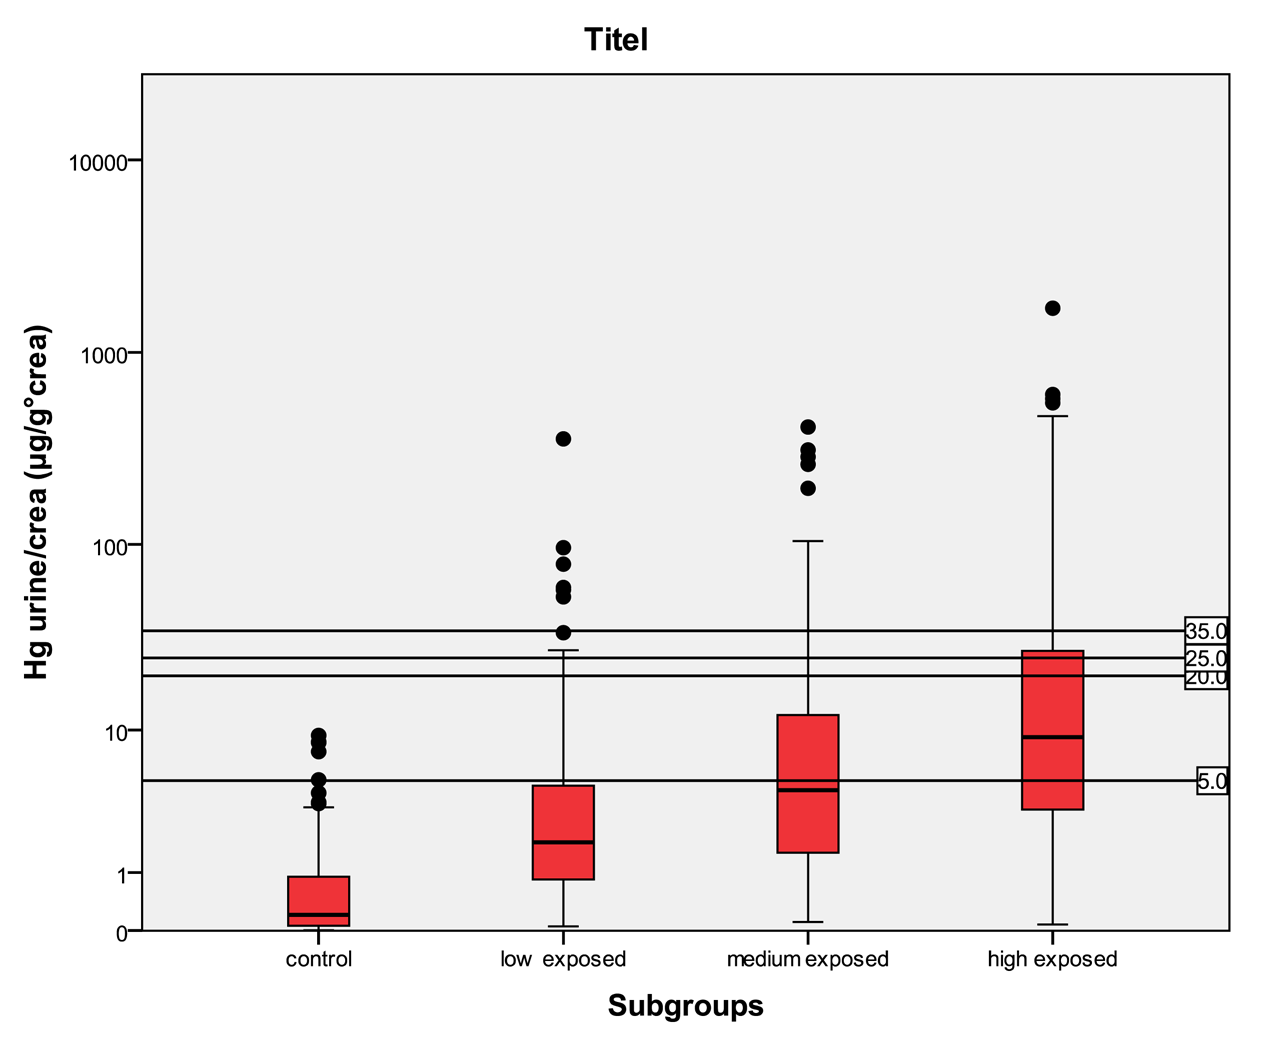
Relating to the biological exposure index values (BEI), the value of mercury in urine should not be over 35 μg/g crea. A mercury level in blood of 15 μg/L should be used as the biological exposure index value. To compare the differently exposed group with each other, subgroups according to threshold values were formed. The available results for urine, blood and hair were grouped according to the HBM categories. Up to four categories were established: (i), below HBM I, (ii) from HBM I to HBM II, (iii) from HBM II to BAT or BEI, and, if available, (iv) above BAT or BEI.
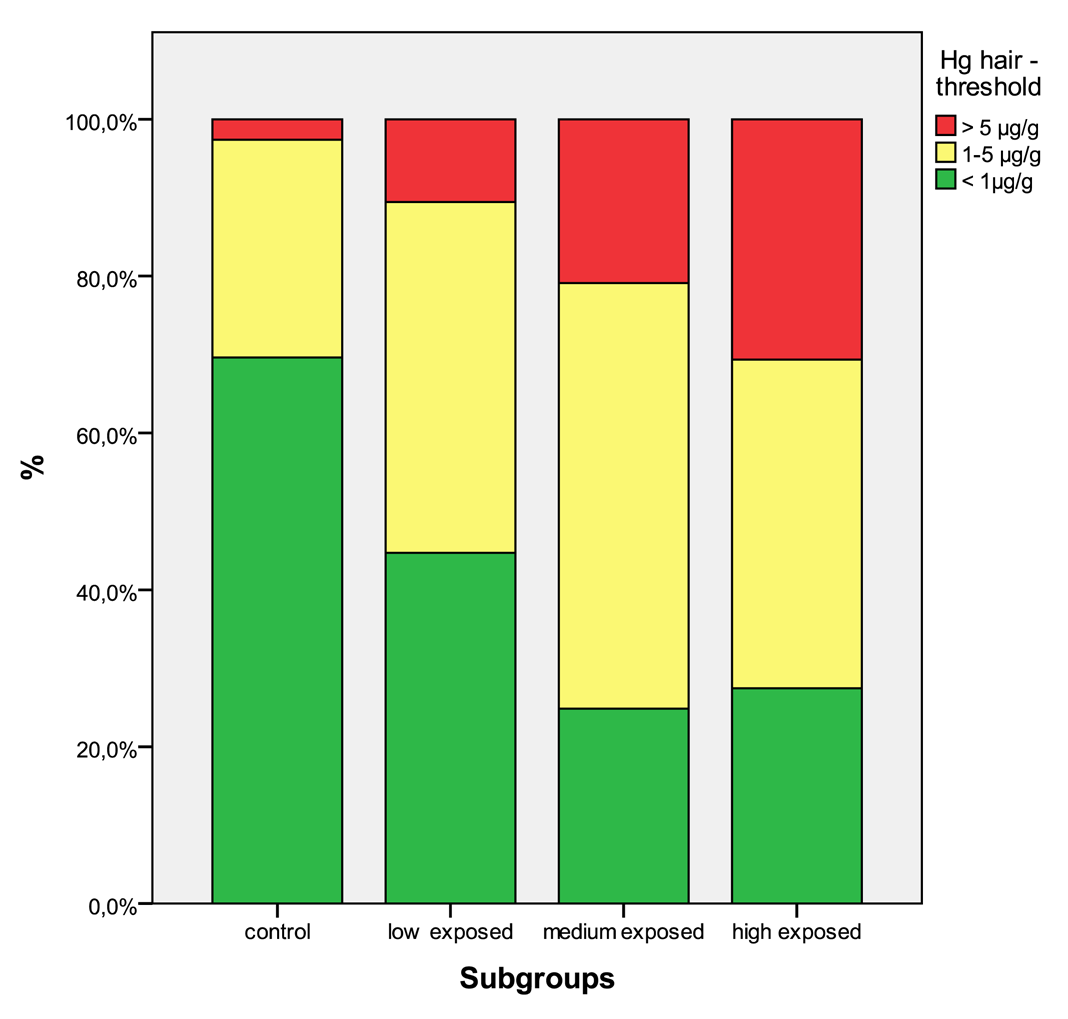
For total mercury in hair, comparable limits of 1 μg/g and 5 μg/g were set [9].
2.4. Statistical Methods
The existing data from the five countries were pooled into one common database. Information from the questionnaires such as age, gender and detailed history of work exposure was included in this new database.
The distributions of the data were analyzed. The Kruskal-Wallis one-way analysis of variance was used to test for possible differences over all groups for the amount of mercury in human specimens between the various exposed groups. Furthermore, the Mann-Whitney U test was performed to compare the different exposure groups to the control group. Box plots and stacked bar charts were used to visualize the results. Moreover threshold values were plotted into the box plot figures.
The significance was tested on α = 0.05. The statistical analysis was performed with SPSS 17.0®.
3. Results
The metric data of age, height and weight are normally distributed in each group. The Kruskal-Wallis test and the Mann-Whitney test were performed with the four subgroups. Both, the Kruskal-Wallis and the Mann-Whitney test are statistically highly significant and therefore the groups are not comparable to each other in age, height and weight.
The differences are based on the different composition of the different subgroups. Mostly men are working as miners and women tend to work less frequently as miners, mainly not as smelters. Therefore, more men are in the highly exposed group and mainly women are in the lower exposed groups.
In Table 1, the distributions of mercury values in the specimens are shown for the different age groups. Moreover, the age groups were compared to each other. Relating to the age, there are no significant differences in the amount of mercury in the specimens between the three age groups.
3.1. Mercury Levels in the Different Countries
The human biomonitoring data were analyzed for the different countries, stratified into exposed and non-exposed areas in each country. Table 2 shows the results for the exposed areas of the countries and Table 3 corresponding to the control areas of each country. The results differ greatly between the differently exposed areas (Table 2). Mercury in urine is a good marker for acute inorganic exposure. The highest median mercury urine levels were found in Zimbabwe 2004 (36.6 μg/L) and Philippines-Mt. Diwalwal (8.64 μg/L). The highest maximum mercury urine levels were found in Indonesia-Kalimantan (5,240 μg/L) and Zimbabwe 2004 (1,530 μg/L). Mercury in urine corrected for creatinine is another marker for acute exposure. The highest median mercury levels were found in Zimbabwe 2004 (25.8 μg/g crea) and Philippines-Mt. Diwalwal (5.64 μg/g crea). The highest maximum mercury levels were found in Indonesia-Kalimantan (1,697 μg/g crea) and Zimbabwe 2004 (547 μg/g crea). Mercury in blood indicates acute and chronic exposure for both inorganic and organic mercury. The highest median mercury blood levels were found in Indonesia-Sulawesi (11.1 μg/L) and Zimbabwe 2004 (10.2 μg/L). The highest maximum mercury blood levels were found in Indonesia-Kalimantan (429 μg/L) and Indonesia-Sulawesi (186 μg/L). Mercury in hair is a marker for chronic organic, but as well inorganic exposure. The highest median mercury hair levels were found in Zimbabwe 2004 (3.58 μg/g) and Indonesia-Sulawesi (3.09 μg/g). The highest maximum mercury hair levels were found in Indonesia-Kalimantan (792 μg/g) and Indonesia-Sulawesi (239 μg/g).
To summarize, mainly in Zimbabwe 2004, Philippines-Mt. Diwalwal, Indonesia-Kalimantan and Indonesia-Sulawesi the median levels in the mining areas are high, compared to the other areas. This is mainly due to different exposure situations. The ore gained in the different areas depends on the technical equipment of the miners, the more ore they gain, the more processing is performed, leading to a higher use of mercury. Also, different ways of processing the ore influence the mercury release into the environment and the miners and the general population are exposed to a different risk. The mining areas in Zimbabwe, Philippines and Indonesia are real hot spots of ASGM, whereas in Tanzania and Mongolia mining is performed at a much lower industrial level, and in Zimbabwe 2006 only women were examined, who are far less involved in amalgam smelting than male miners. The very high maximum levels from Indonesia and Zimbabwe are due to a specific high exposure of the amalgam smelters in these areas. These descriptive results might help to compare results from other mining areas worldwide. The control areas differ as well. The median levels in all specimens (Table 3) are highest in Philippines, second highest in Indonesia-Sulawesi. Lowest median levels were found in Zimbabwe 2006 and Mongolia. The difference in the control groups is due to different fish consumption habits, high in Eastern Asian areas, close to the sea, and low in land-locked countries.
3.2. Results in the Differently Exposed Subgroups
The results for mercury in urine, blood and hair are given for the four differently exposed subgroups in Table 4.
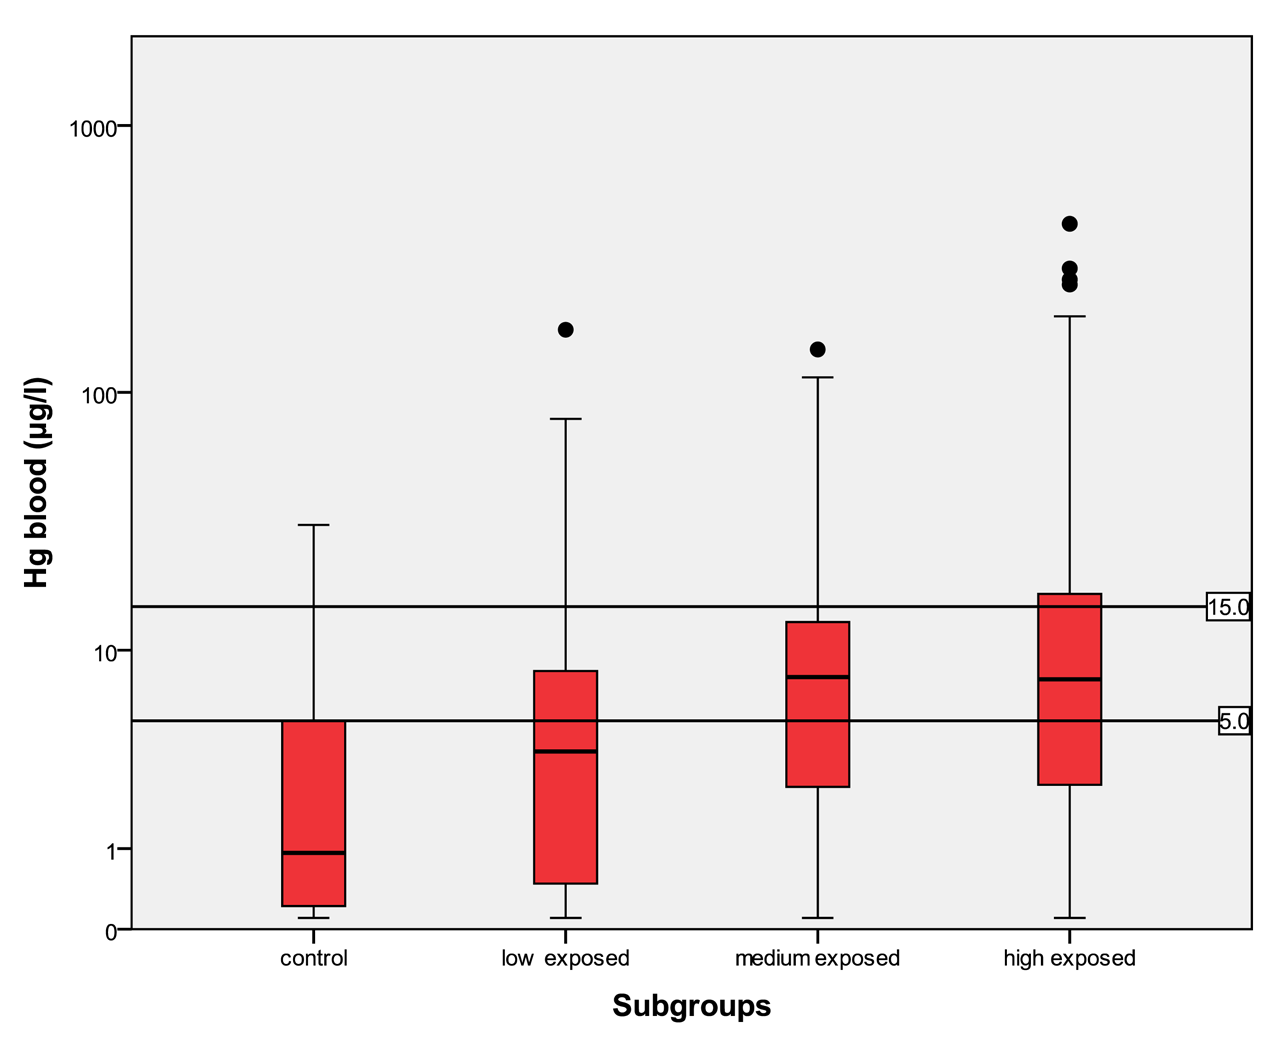
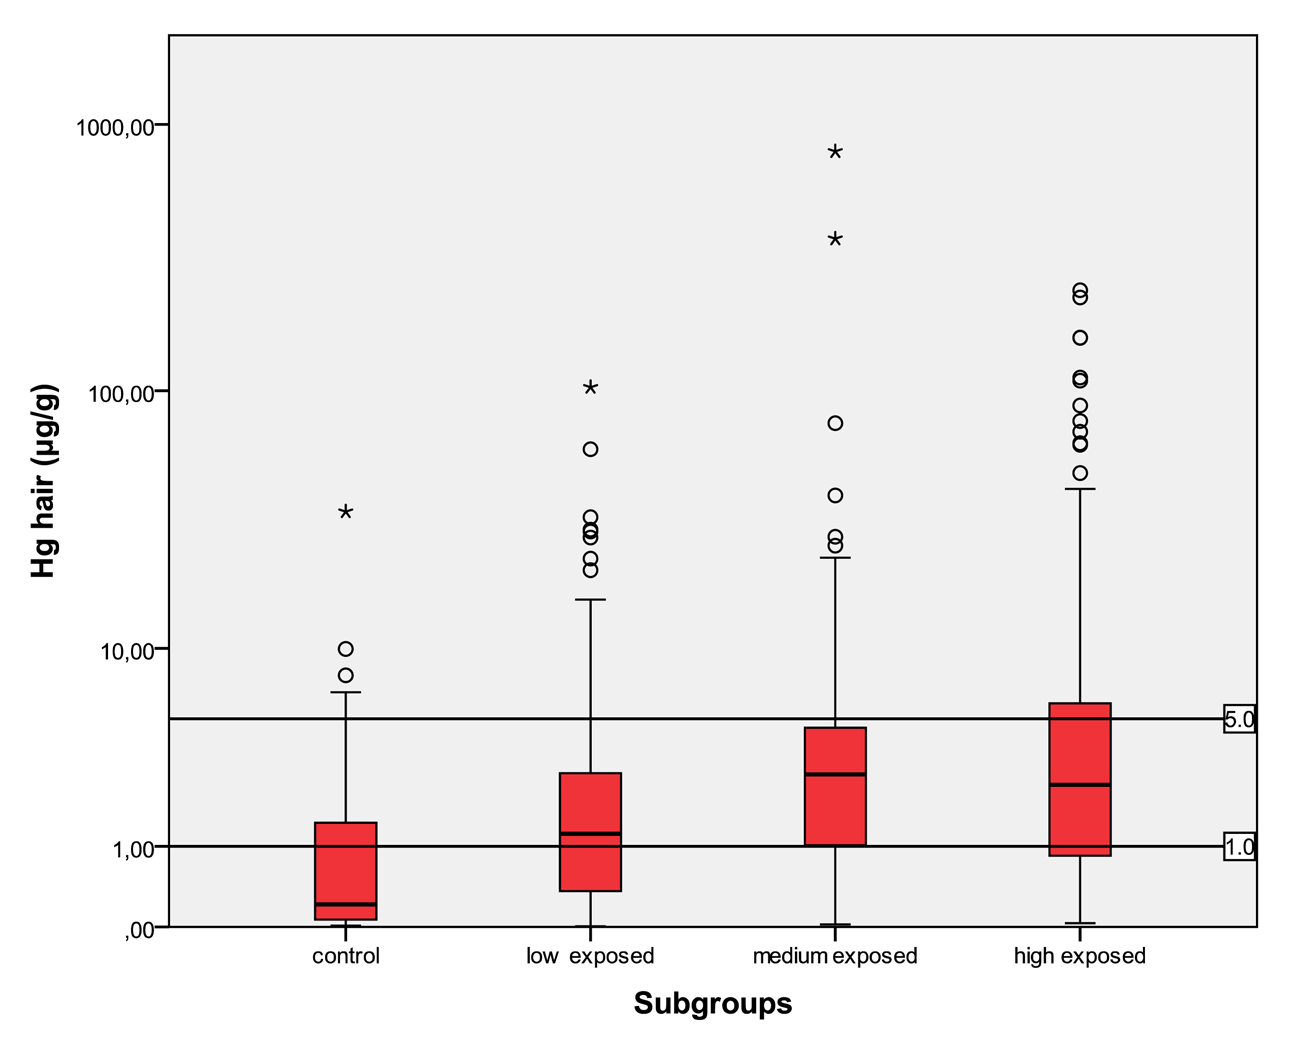
In the control group, the median of mercury in urine is <LOD with a maximum of 8.78 μg/L and a minimum <LOD. The amount of mercury in blood lies in between <LOD and 31.3 μg/L with a median of 0.93 μg/L. The amount of mercury in hair lies within the interval of <LOD and 34.7 μg/g with a median of 0.21 μg/g. In the low exposed group, the level of mercury in urine lies in an interval of <LOD to 874 μg/L with a median of 2.3 μg/L. The amount of mercury in blood in the low exposed group lies within the range of <LOD to 172 μg/L with a median of 3.61 μg/L. The amount of mercury in hair lies within the interval <LOD and 103 μg/g with a median value of 1.23 μg/g. In the medium exposed group, the amount of mercury in urine lies between a level <LOD and 868 μg/L with a median of 6.41 μg/L. The level of mercury in blood lies between a level of <LOD and 145 μg/L with a median of 7.74 μg/L. The amount of mercury in hair lies between the range of <LOD and 792 μg/g with a median of 2.72 μg/g. In the high exposed group, the level of mercury in urine lies between the levels of <LOD to 5240 μg/L with a median of 12.0 μg/L; and the amount of mercury in blood in this group lies within the interval of <LOD and 429 μg/L with a median of 7.56 μg/L. The amount of mercury in hair lies between <LOD and 239 μg/g with a median of 2.40 μg/g.
Participants from the control group have statistically significant lower levels of mercury in the different specimens than participants in exposed areas. There is a clear trend to higher levels of mercury in all specimens according to the relevant exposure situation in the different subgroups. Participants who live in the exposed area and smelt mercury have the highest levels of mercury.
4. Discussion
In the control areas of each country the levels of mercury in the specimens are rather low, but in the corresponding exposed areas the levels of mercury are increased. The level of mercury in all specimens increases in relation to the intensity of contact with mercury. The analysis of the four different exposure subgroups shows that the control group has significantly lower levels of mercury in urine, blood and hair compared to the low, medium and mainly the high exposed group. This tendency is not only seen in the primary projects but as well in the common database for all subgroups.
4.1. Mercury Threshold Values
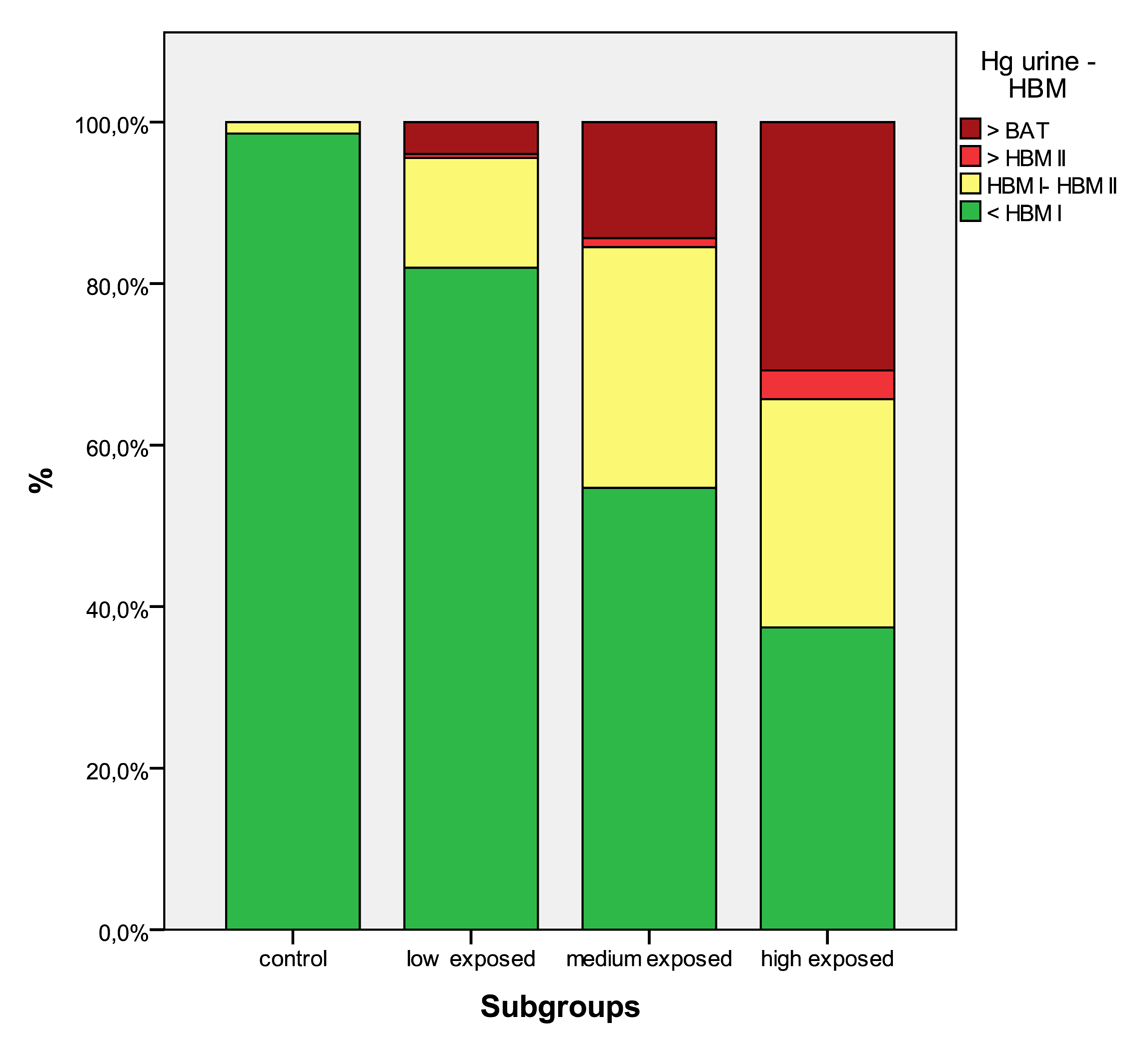
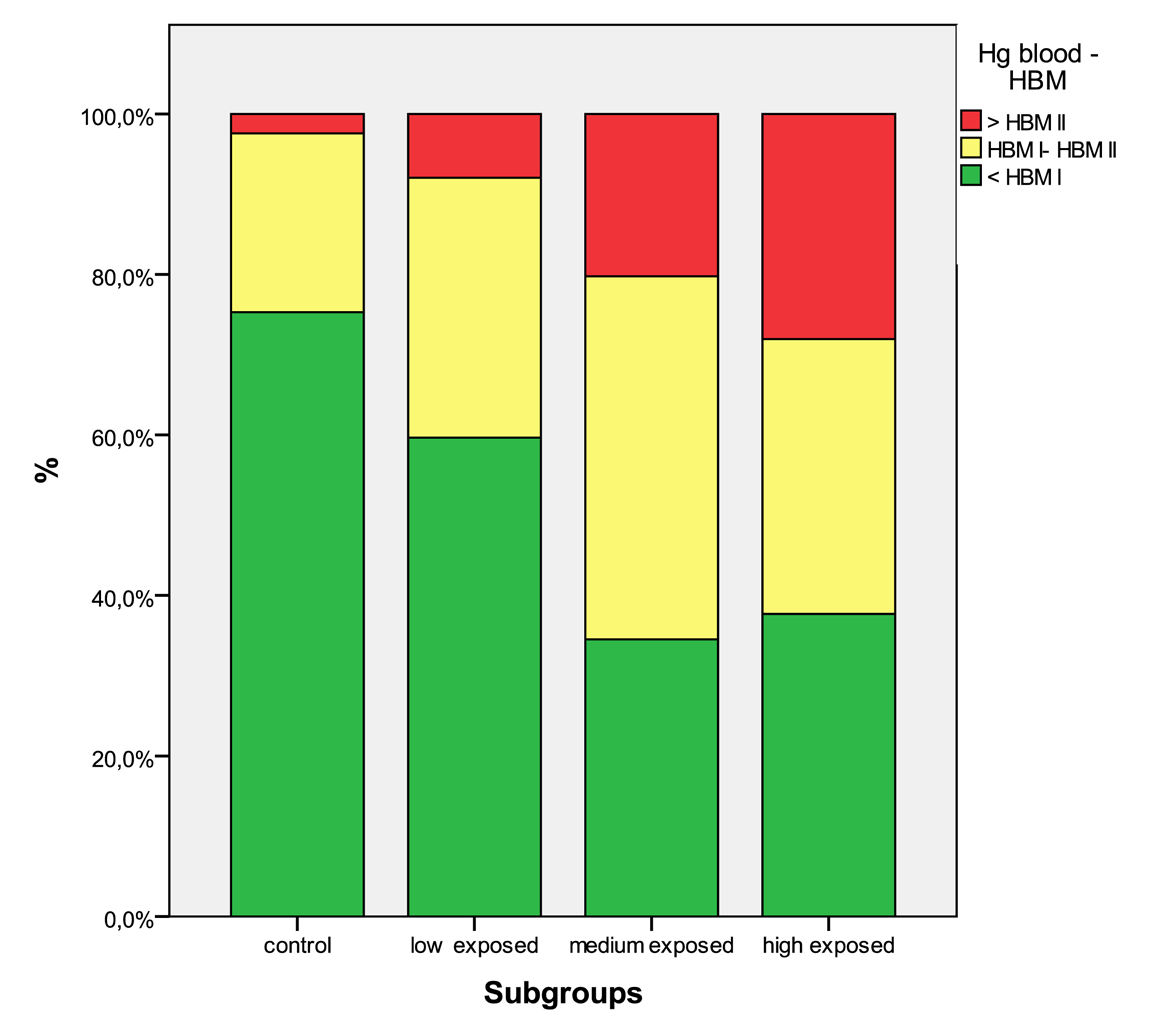
In Table 5 the distribution of the results from subgroups formed due to the exposure status are shown in comparison to the threshold categories. In Figures 1 to 4 the results are shown as box plots. These box plots show clearly that the increasing exposure is well reflected in urine, blood and hair mercury levels. Participants from the control group have in general levels of mercury below threshold values, but many participants living in the exposed area have levels above threshold values. Mainly participants in the high exposed group, the amalgam smelters have levels above HBM II or even BAT/BEI values.
The comparison of the levels from control areas with threshold values indicates that in the control areas there is only background mercury exposure likely, e.g., the fish consumption influences the levels in the control areas. Areas with a high consumption of fish, such as the Philippines and Indonesia have higher mercury levels compared to areas with lower fish consumption such as Zimbabwe and Tanzania, but the lowest levels were found in Mongolia, where hardly any fish is available.
Occupational exposure is the main contributor to the body burden with mercury. The population that is not involved in working with mercury, but living in exposed areas has in a considerable percentage mercury levels above HBM I and even HBM II (see Table 4). As published elsewhere, severe symptoms can be found even in these low exposed groups [4,5,9]. Miners working with mercury have mercury levels of a high percentage, above HBM II, the highest levels are found in the group of amalgam smelters. Levels above HBM II are likely to be associated with mercury intoxication [4,5,9]; but also participants with levels below HBM II are not unlikely to have neurological symptoms from the chronic mercury exposure [16]. In Figures 5 to 8 the mercury levels of the different subgroups were classified on the basis of HBM-levels and BEI/BAT values.
In general, a reasonable percentage of participants living in ASGM areas is already burdened with mercury. Miners using mercury are heavily endangered, since their mercury levels are in a high percentage above the threshold values. Finally, the workers smelting amalgam are extremely burdened and are very likely to develop chronic neurological symptoms.
4.2. Results in Comparison with Other Publications
The participants from the control areas had low background mercury levels. Similar background levels for mercury were found in Europe and Northern America [18-20].
From two ASGM areas in Northern Tanzania, mercury levels in urine were determined. The mercury levels in the exposed areas were similar to the ones reported in this paper with a mean mercury urinary level of 39 μg/g creatinine for high exposed participants and maximum mercury level in urine of 172 μg/g creatinine [21].
In Zimbabwe, participants from two ASGM areas were assessed, four out of 43 participants in one area and seven out of 23 participants in another area had mercury levels in blood >50μg/L. For urine the results were four out of 43 in the first area >10 μg/L [22].
In a ASGM area in Southern Peru mean mercury levels in urine were 728 μg/L for the six high exposed participants and 8 μg/L for the six low exposed participants [23]. These levels are higher compared to results of this study, but the case number is very small.
A study in Mindanao, Philippines showed similar results [24]. Another study in the Talensi–Nabdam District, Ghana showed that 20% of all participants had levels of urinary mercury (>10 μg/L) and 5% had urine mercury levels of above 50 μg/L. Active miners had the highest mercury levels, mainly amalgam burners (median: 43.8 μg/L; mean ± SD: 171.1 ± 296.5 μg/L; n = 5) [25]. In an Amazonian population in Bolivia hair levels of the general population were high, due to high fish consumption, but still occupational exposure showed an increase in mercury hair levels (geometric mean 5.75 μg/g) [26]. Only few human biomonitoring studies were published with mainly small case numbers. The results of this study are comparable with the published references.
4.3. Limitations of This Study
One limitation of this study may be that the four differently exposed groups have a different composition relating to gender. In the control group, 67.3% of the participants are female and only 32.7% are male. However, in the high exposed group, 30.2% are female and 69.8% are male. On the other hand, no gender-specific susceptibility to mercury is described in literature. Moreover, the different additional exposure with mercury from fish consumption in the respective countries is a problem. In Indonesia or the Philippines for example, the background burden with mercury is higher, which means that participants from these areas have a mixed exposition with inorganic and organic mercury, which might have adulterated the result.
One general limitation is the exposure assessment. There are no personal exposure assessments available, and the questionnaire is the only reliable source of information. Some miners might have worked every day, others only occasionally. So with this data collection, it is not possible to quantify the mercury exposure [27].
Another limitation might be that not all results were obtained from the same laboratory. Only the results from Mongolia come from different laboratories, but still they might not be fully comparable.
A final limitation is that the threshold values used were derived toxicologically using methyl mercury and elemental mercury data. It might be that the threshold values are not fully adequate for elemental mercury [7].
5. Conclusions
The newly developed database was created with urine, blood and hair mercury results from participants from different ASGM areas. This new database enables, for the first time, a comparison of the mercury concentrations in the specimens of participants living and/or working in mining communities worldwide. The level of mercury in all specimens augmented with the increasing mercury exposure. The mercury levels between the various exposure subgroups differ significantly.
According to environmental studies, many possible pathways to uptake mercury exist for miners and inhabitants, e.g., drinking water, from the soil through eating vegetables and consuming fish [28-30]. However, the toxic mercury vapor from smelting the amalgam seems to be the most dangerous pathway of exposure, since the amalgam smelters in particular have shown extreme high levels of mercury in their specimens.
Today, medical knowledge about the health risks in ASGM is limited. It is unknown how many people precisely all over the world are working with mercury in gold mining areas. However, Hentschel et al. made some estimates about people working in ASGM areas in different countries, estimating a total number of workers of 185.000 on the Philippines, 550.000 in Tanzania, 350.000 in Zimbabwe and 109.000 thousand in Indonesia [1]. This database, containing six “hot spots” in five countries, provides a first overview about the situation in certain countries in Africa and Asia. It would be useful if this project, examining participants living in mining areas, should be extended to gain more data on health effects of elemental mercury in ASGM areas.
It is essential to introduce strategies to minimize the mercury exposure of miners and community members in ASGM areas. The introduction of mercury-free technologies, corresponding technical trainings and health education campaigns is urgently needed. There are already some studies and recommendations referring to mercury-free gold mining, for example M. Vieira et al. “Mercury-free gold mining technologies: possibilities for adaptation in the Guianas” [31] and Appel et al. “Borax—an alternative to mercury for gold extraction by artisanal small-scale gold miners: introducing the method in Tanzania” [32]. Additionally regional capacity-building measures and regulations on governmental levels are necessary [33,34].
There are some studies about children from the Faroe Islands who suffer from mercury side effects due to intoxication from the environment and from their parents. Children in a highly exposed study region with mother having high levels of mercury in her hair, show a decreased intelligence as one severe outcome of chronic mercury intoxication disclosed [35].
This is only one further example which categorically demonstrates the need for more research regarding the effects of mercury and the implementation of mercury reduction projects.


| Age groups | |||||
|---|---|---|---|---|---|
| 15–25 | 26–45 | 46–60 | Total | ||
| Hg in urine μg/L p-value < 0.001 (Kruskal-Wallis) | Number | 399 | 745 | 101 | 1245 |
| Minimum | <LOD | <LOD | <LOD | <LOD | |
| Median | 4.09 | 3.47 | 3.26 | 3.57 | |
| Mean | 33.1 | 32.4 | 20.0 | 31.6 | |
| Percentile 95 | 166 | 112 | 55.7 | 119 | |
| Maximum | 1530 | 5240 | 900 | 5240 | |
| Mann-Whitney p-value | <0.001 | <0.001 | |||
| Hg in urine μg/g crea p-value < 0.001 (Kruskal-Wallis) | Number | 375 | 703 | 100 | 1178 |
| Minimum | <LOD | <LOD | <LOD | <LOD | |
| Median | 3.65 | 2.94 | 2.24 | 3.08 | |
| Mean | 20.3 | 18.9 | 10.3 | 18.6 | |
| Percentile 95 | 105 | 78.4 | 26.8 | 80.9 | |
| Maximum | 575 | 1697 | 392 | 1697 | |
| Mann-Whitney p-value | <0.001 | <0.001 | |||
| Hg in blood μg/L p-value < 0.001 (Kruskal-Wallis) | Number | 312 | 706 | 103 | 1121 |
| Minimum | <LOD | <LOD | <LOD | <LOD | |
| Median | 3.87 | 5.16 | 6.36 | 5.12 | |
| Mean | 9.67 | 11.7 | 11.1 | 11.1 | |
| Percentile 95 | 41.0 | 39.2 | 24.5 | 38.2 | |
| Maximum | 292 | 429 | 193 | 429 | |
| Mann-Whitney p-value | <0.001 | <0.001 | |||
| Hg in hair μg/g p-value < 0.001 (Kruskal-Wallis) | Number | 372 | 704 | 98 | 1174 |
| Minimum | <LOD | <LOD | 0.04 | <LOD | |
| Median | 1.16 | 1.71 | 2.57 | 1.60 | |
| Mean | 3.99 | 6.70 | 5.12 | 5.71 | |
| Percentile 95 | 14.5 | 19.9 | 23.5 | 19.2 | |
| Maximum | 158 | 792 | 76.8 | 792 | |
| Mann-Whitney p-value | <0.001 | <0.001 | |||
| Indonesia-Kalimantan mining | Indonesia-Sulawesi mining | Tanzania mining | Zimbabwe mining (2004) | Philippines-Mt. Diwalwal mining | Philippines-Monkayo mining | Mongolia mining | Zimbabwe mining (2006) | Total | ||
|---|---|---|---|---|---|---|---|---|---|---|
| Hg in urine μg/L | Number | 168 | 101 | 184 | 157 | 119 | 72 | 155 | 79 | 1035 |
| Minimum | 0.29 | 0.43 | <LOD | 0.44 | 0.27 | 0.25 | 0.25 | <LOD | <LOD | |
| Median | 5.86 | 14.1 | 1.73 | 36.6 | 8.64 | 1.00 | 3.57 | 4.76 | 5.28 | |
| Mean | 88.2 | 36.2 | 7.56 | 93.0 | 22.9 | 1.37 | 5.15 | 14.0 | 37.9 | |
| Percentile 95 | 197 | 137 | 30.6 | 377 | 112 | 3.70 | 12.0 | 35.4 | 146 | |
| Maximum | 5240 | 564 | 147 | 1530 | 294 | 8.55 | 78.5 | 374 | 5240 | |
| Hg in urine/g crea | Number | 168 | 101 | 182 | 157 | 119 | 72 | 142 | 79 | 1020 |
| Minimum | 0.46 | 0.48 | <LOD | 0.20 | 0.27 | <LOD | <LOD | <LOD | <LOD | |
| Median | 3.47 | 5.27 | 0.96 | 25.8 | 5.64 | 1.22 | 4.70 | 4.00 | 4.04 | |
| Mean | 35.4 | 20.8 | 3.77 | 55.2 | 14.6 | 1.38 | 12.4 | 10.1 | 21.4 | |
| Percentile 95 | 128 | 102 | 17.6 | 211 | 56.7 | 3.47 | 34.2 | 19.5 | 98.4 | |
| Maximum | 1697 | 233 | 36.8 | 547 | 196 | 5.15 | 311 | 286 | 1697 | |
| Hg in blood μg/L | Number | 168 | 101 | 187 | 153 | 119 | 72 | 155 | 0 | 955 |
| Minimum | 1.45 | 3.42 | 0.45 | 0.60 | 1.22 | <LOD | <LOD | . | <LOD | |
| Median | 9.31 | 11.1 | 1.85 | 10.2 | 10.1 | 6.86 | 0.20 | . | 6.04 | |
| Mean | 24.8 | 20.5 | 3.29 | 16.7 | 14.8 | 9.06 | 0.42 | . | 12.4 | |
| Percentile 95 | 128 | 72.0 | 11.0 | 51.6 | 43.8 | 21.5 | 1.40 | . | 42.4 | |
| Maximum | 429 | 186 | 33.3 | 97.6 | 108 | 47.5 | 9.60 | . | 429 | |
| Hg in hair μg/g | Number | 167 | 99 | 160 | 136 | 117 | 72 | 155 | 77 | 983 |
| Minimum | 0.33 | 0.58 | <LOD | 0.39 | 0.43 | 0.68 | <LOD | <LOD | <LOD | |
| Median | 3.05 | 3.09 | 0.58 | 3.58 | 2.81 | 2.99 | 0.15 | 1.26 | 1.89 | |
| Mean | 17.5 | 9.33 | 1.80 | 9.21 | 5.27 | 3.51 | 0.28 | 2.56 | 6.61 | |
| Percentile 95 | 60.1 | 38.9 | 5.98 | 33.9 | 19.9 | 10.1 | 0.80 | 5.82 | 20.6 | |
| Maximum | 792 | 239 | 48.7 | 112 | 37.8 | 13.2 | 2.71 | 29.1 | 792 | |
| Indonesia-Sulawesi control | Tanzania control | Zimbabwe (2004) control | Philippines-control | Mongolia control | Zimbabwe(2006) control | Total | ||
|---|---|---|---|---|---|---|---|---|
| Hg in urine μg/L | Number | 21 | 31 | 36 | 38 | 41 | 43 | 210 |
| Minimum | <LOD | <LOD | <LOD | <LOD | <LOD | <LOD | <LOD | |
| Median | 0.73 | 0.31 | <LOD | 1.66 | <LOD | <LOD | <LOD | |
| Mean | 0.90 | 0.43 | 0.52 | 2.06 | 0.19 | 0.18 | 0.69 | |
| Percentile 95 | 2.75 | 1.76 | 3.32 | 7.59 | 0.60 | 0.22 | 3.26 | |
| Maximum | 3.16 | 1.78 | 8.78 | 7.59 | 1.24 | 3.03 | 8.78 | |
| Hg in urine/g crea | Number | 21 | 31 | 36 | 38 | 0 | 32 | 158 |
| Minimum | <LOD | <LOD | <LOD | 0.39 | . | <LOD | <LOD | |
| Median | 0.40 | 0.20 | <LOD | 1.61 | . | <LOD | 0.21 | |
| Mean | 0.43 | 0.24 | 0.31 | 2.56 | . | 0.18 | 0.83 | |
| Percentile 95 | 0.66 | 0.52 | 2.82 | 8.55 | . | 0.89 | 3.62 | |
| Maximum | 1.35 | 0.92 | 3.57 | 9.31 | . | 3.37 | 9.31 | |
| Hg in blood μg/L | Number | 20 | 31 | 36 | 38 | 41 | 0 | 166 |
| Minimum | 2.36 | 0.22 | <LOD | 0.72 | <LOD | <LOD | ||
| Median | 4.47 | 0.98 | 0.43 | 9.26 | <LOD | . | 0.93 | |
| Mean | 4.92 | 1.05 | 0.53 | 10.4 | 0.31 | . | 3.37 | |
| Percentile 95 | 9.16 | 2.01 | 1.79 | 24.5 | 1.60 | . | 14.2 | |
| Maximum | 10.1 | 2.29 | 1.88 | 31.3 | 3.60 | . | 31.30 | |
| Hg in hair μg/g | Number | 20 | 24 | 32 | 39 | 34 | 42 | 191 |
| Minimum | 0.83 | 0.08 | <LOD | 0.98 | 0.03 | <LOD | <LOD | |
| Median | 1.53 | 0.36 | 0.09 | 2.72 | 0.07 | 0.07 | 0.21 | |
| Mean | 1.64 | 0.36 | 0.22 | 4.02 | 0.10 | 0.11 | 1.14 | |
| Percentile 95 | 3.03 | 0.65 | 1.01 | 9.94 | 0.30 | 0.31 | 4.13 | |
| Maximum | 3.72 | 0.68 | 3.25 | 34.71 | 0.62 | 0.55 | 34.7 | |
| Control | Low exposed | Medium exposed | High exposed | Total | ||
|---|---|---|---|---|---|---|
| Hg in urine μg/L (p-value < 0.001 Kruskal-Wallis) | Number | 210 | 405 | 181 | 449 | 1245 |
| Minimum | <LOD | <LOD | <LOD | <LOD | <LOD | |
| Median | <LOD | 2.3 | 6.41 | 12.0 | 3.57 | |
| Mean | 0.69 | 7.96 | 25.9 | 69.7 | 31.6 | |
| Percentile 95 | 3.26 | 22.1 | 70.8 | 274 | 119 | |
| Maximum | 8.78 | 874 | 868 | 5240 | 5240 | |
| Mann-Whitney p value | <0.001 | <0.001 | <0.001 | . | ||
| Hg in urine/g crea (p-value < 0.001 Kruskal-Wallis) | Number | 158 | 397 | 179 | 444 | 1178 |
| Minimum | <LOD | <LOD | <LOD | <LOD | <LOD | |
| Median | 0.21 | 1.88 | 4.36 | 9.11 | 3.08 | |
| Mean | 0.83 | 5.63 | 18.8 | 36.5 | 18.6 | |
| Percentile 95 | 3.62 | 18.9 | 79.6 | 143 | 80.9 | |
| Maximum | 9.31 | 355 | 409 | 1697 | 1697 | |
| Mann-Whitney p value | <0.001 | <0.001 | <0.001 | . | ||
| Hg in blood μg/L (p-value < 0.001 Kruskal-Wallis) | Number | 166 | 352 | 168 | 435 | 1121 |
| Minimum | <LOD | <LOD | <LOD | <LOD | <LOD | |
| Median | 0.93 | 3.61 | 7.74 | 7.56 | 5.12 | |
| Mean | 3.37 | 6.38 | 12.5 | 17.3 | 11.1 | |
| Percentile 95 | 14.2 | 19.5 | 42.6 | 56.4 | 38.2 | |
| Maximum | 31.3 | 172 | 145 | 429 | 429 | |
| Mann-Whitney p value | . | <0.001 | <0.001 | <0.001 | ||
| Hg in hair μg/g (p-value < 0.001 Kruskal-Wallis) | Number | 191 | 398 | 177 | 408 | 1174 |
| Minimum | <LOD | <LOD | <LOD | <LOD | <LOD | |
| Median | 0.21 | 1.23 | 2.72 | 2.40 | 1.6 | |
| Mean | 1.12 | 2.72 | 11.0 | 8.49 | 5.71 | |
| Percentile 95 | 4.13 | 7.32 | 19.9 | 33.1 | 19.2 | |
| Maximum | 34.7 | 103 | 792 | 239 | 792 | |
| Mann-Whitney p value | <0.001 | <0.001 | <0.001 | |||
| Control | Low exposed | Medium exposed | High exposed | ||||||
|---|---|---|---|---|---|---|---|---|---|
| Count | % | Count | % | Count | % | Count | % | ||
| Hg urine | <HBM I | 207 | 98.6% | 332 | 82.0% | 99 | 54.7% | 168 | 37.4% |
| HBM I—HBM II | 3 | 1.4% | 55 | 13.6% | 54 | 29.8% | 127 | 28.3% | |
| HBM II—BAT | 0 | 0% | 2 | 0.5% | 2 | 1.1% | 16 | 3.6% | |
| >BAT | 0 | 0% | 16 | 4.0% | 26 | 14.4% | 138 | 30.7% | |
| Hg urine/g crea | <HBM I | 164 | 97.0% | 312 | 77.2% | 99 | 54.7% | 167 | 37.3% |
| HBM I—HBM II | 5 | 3.0% | 78 | 19.3% | 50 | 27.6% | 140 | 31.3% | |
| HBM II—BAT | 0 | 0% | 5 | 1.2% | 8 | 4.4% | 20 | 4.5% | |
| >BAT | 0 | 0% | 9 | 2.2% | 24 | 13.3% | 121 | 27.0% | |
| Hg blood | <HBM I | 125 | 75.3% | 210 | 59.7% | 58 | 34.5% | 164 | 37.7% |
| HBM I—HBM II | 37 | 22.3% | 114 | 32.4% | 76 | 45.2% | 149 | 34.3% | |
| >HBM II/BEI | 4 | 2.4% | 28 | 8.0% | 34 | 20.2% | 122 | 28.0% | |
| Hg hair | <1 μg/g | 133 | 69.6% | 178 | 44.7% | 44 | 24.9% | 112 | 27.5% |
| 1–5 μg/g | 53 | 27.7% | 178 | 44.7% | 96 | 54.2% | 171 | 41.9% | |
| >5 μg/g | 5 | 2.6% | 42 | 10.6% | 37 | 20.9% | 125 | 30.6% | |
Acknowledgments
First of all we want to thank all participants from all countries for their willingness to be examined. The support from doctors, nurses and many other national and regional experts during the projects was essential for our success. We need to thank deeply the national project managers Jonny Calvez from the Philippines, Mrs. Selinawati from Indonesia, Aloyce Tesha from Tanzania, Dennis Shoko from Zimbabwe and Enkhjargal Altangerel from Mongolia. We want to thank for the trust and backing from the chief project managers in the responsible agencies, mainly Christian Beinhoff (UNIDO), Kersten Gutschmidt (WHO headquarter, Switzerland) and Enkhtsetseg Shinee (WHO office, Mongolia): Our environmental counterparts Don Appleton (BGS, UK), Saulo Rodrigues Pereira Filho (CETEM, Brazil) and Pierre Billaud (BRGM, France) enabled us to perform the projects successfully. All our colleagues that either worked with us in the field or in the laboratories deserve a special thank you.
Funding: This paper consists of differently funded projects: UNIDO—United Nations Industrial Development Organization funded the projects in Indonesia, Philippines, Tanzania and Zimbabwe (2004), LMU funded the project Zimbabwe 2006 and WHO—World Health Organization funded the project Mongolia together with the Ministry of Health of Mongolia.
The above mentioned institutions had provided for each single project the approval of the relevant national committees to perform the health assessments.
References
- Hentschel, T.; Hruschka, F.; Priester, M. Global Report on Artisanal and Small-Scale Mining; MMSD: London, UK, 2002; Volume 70, p. 67. [Google Scholar]
- Drasch, G.; Horvat, M.; Stoeppler, M. Mercury. In Elements and their Compounds in the Environment; Merian, E., Anke, M., Ihnat, M., Stoeppler, M., Eds.; Wiley-VHC Verlag: Weinheim, Germany, 2004; Volume 2, pp. 931–1005. [Google Scholar]
- Veiga, M.M.; Baker, R.F. Protocols for Environmental and Health Assessment of Mercury Released by Artisanal and Small-Scale Miners. In Global Mercury Project; GEF/UNDP/UNIDO: Vienna, Austria, 2004; p. 289. [Google Scholar]
- Bose-O'Reilly, S.; Drasch, G.; Beinhoff, C.; Rodrigues-Filho, S.; Roider, G.; Lettmeier, B.; Maydl, A.; Maydl, S.; Siebert, U. Health assessment of artisanal gold miners in Indonesia. Sci. Total Environ. 2010, 408, 713–725. [Google Scholar]
- Bose-O'Reilly, S.; Drasch, G.; Beinhoff, C.; Tesha, A.; Drasch, K.; Roider, G.; Taylor, H.; Appleton, D.; Siebert, U. Health assessment of artisanal gold miners in Tanzania. Sci. Total Environ. 2010, 408, 796–805. [Google Scholar]
- Appleton, J.D.; Williams, T.M.; Breward, N.; Apostol, A.; Miguel, J.; Miranda, C. Mercury contamination associated with artisanal gold mining on the island of Mindanao, the Philippines. Sci. Total Environ. 1999, 228, 95–109. [Google Scholar]
- Lettmeier, B.; Boese-O'Reilly, S.; Drasch, G. Proposal for a revised Reference Concentration (RfC) for mercury vapour in adults. Sci. Total Environ. 2010, 408, 3530–3535. [Google Scholar]
- Bose-O'Reilly, S.; Drasch, G.; Beinhoff, C.; Maydl, S.; Vosko, M.R.; Roider, G.; Dzaja, D. The Mt. Diwata study on the Philippines 2000-treatment of mercury intoxicated inhabitants of a gold mining area with DMPS (2,3-dimercapto-1-propane-sulfonic acid, Dimaval). Sci. Total Environ. 2003, 307, 71–82. [Google Scholar]
- Drasch, G.; Bose-O'Reilly, S.; Beinhoff, C.; Roider, G.; Maydl, S. The Mt. Diwata study on the Philippines 1999—assessing mercury intoxication of the population by small scale gold mining. Sci. Total Environ. 2001, 267, 151–168. [Google Scholar]
- Steckling, N.; Boese-O'Reilly, S.; Gradel, C.; Gutschmidt, K.; Shinee, E.; Altangerel, E.; Badrakh, B.; Bonduush, I.; Surenjav, U.; Ferstl, P.; Roider, G.; Sakamoto, M.; Sepai, O.; Drasch, G.; Lettmeier, B.; Morton, J.; Jones, K.; Siebert, U.; Hornberg, C. Mercury exposure in female artisanal small-scale gold miners (ASGM) in Mongolia: An analysis of human biomonitoring (HBM) data from 2008. Sci. Total Environ. 2011, 409, 994–1000. [Google Scholar]
- Bose-O'Reilly, S.; Lettmeier, B.; Gothe, R.M.; Beinhoff, C.; Siebert, U.; Drasch, G. Mercury as a serious health hazard for children in gold mining areas. Environ. Res. 2008, 107, 89–97. [Google Scholar]
- Yasutake, A.; Matsumoto, M.; Yamaguchi, M.; Hachiya, N. Current hair mercury levels in Japanese: Survey in five districts. Tohoku J. Exp. Med. 2003, 199, 161–169. [Google Scholar]
- Environmental Health Criteria 118: Inorganic Mercury; WHO: Geneva, Switzerland, 1991.
- Schulz, C.; Angerer, J.; Ewers, U.; Kolossa-Gehring, M. The german human biomonitoring commission. Int. J. Hyg. Environ. Health 2007, 210, 373–382. [Google Scholar]
- Ewers, U.; Krause, C.; Schulz, C.; Wilhelm, M. Reference Values and Human Biological Monitoring Values for Environmental Toxins. Report on the work and recommendations of the Commission on Human Biological Monitoring of the German Federal Environmental Agency. Int. Arch. Occup. Environ. Health 1999, 72, 255–260. [Google Scholar]
- Drasch, G.; Bose-O'Reilly, S.; Maydl, S.; Roider, G. Scientific comment on the German human biological monitoring values (HBM values) for mercury. Int. J. Hyg. Environ. Health 2002, 205, 509–512. [Google Scholar]
- Commission for the investigation of health hazards of chemical compounds in the work area. In List of MAK and BAT Values 2006: Maximum Concentrations and Biological Tolerance Values at the Workplace; Report 42 (MAK & BAT Values); Wiley: Hoboken, NJ, USA, 2006; pp. 1–266.
- Global Mercury Assessment; United Nations Environment Programme Chemicals: Geneva, Switzerland, 2002; pp. 1–258.
- Becker, K.; Kaus, S.; Krause, C.; Lepom, P.; Schulz, C.; Seiwert, M.; Seifert, B. German Environmental Survey 1998 (GerES III): environmental pollutants in blood of the German population. Int. J. Hyg. Environ. Health 2002, 205, 297–308. [Google Scholar]
- Becker, K.; Schulz, C.; Kaus, S.; Seiwert, M.; Seifert, B. German environmental survey 1998 (GerES III): Environmental pollutants in the urine of the German population. Int. J. Hyg. Environ. Health 2003, 206, 15–24. [Google Scholar]
- van Straaten, P. Human exposure to mercury due to small scale gold mining in northern Tanzania. Sci. Total Environ. 2000, 259, 45–53. [Google Scholar]
- Matchaba-Hove, R.B.; Siziya, S.; Rusakaniko, S.; Kadenhe, R.M.; Dumbu, S.; Chirenda, J. Mercury poisoning: Prevalence, knowledge and frequency of gold panning and doing retort among alluvial gold panners in Chiweshe and Tafuna communal lands in Zimbabwe. Cent. Afr. J. Med. 2001, 47, 251–254. [Google Scholar]
- Hurtado, J.; Gonzales, G.F.; Steenland, K. Mercury exposures in informal gold miners and relatives in southern Peru. Int. J. Occup. Environ. Health 2006, 12, 340–345. [Google Scholar]
- Cortes-Maramba, N.; Reyes, J.P.; Francisco-Rivera, A.T.; Akagi, H.; Sunio, R.; Panganiban, L.C. Health and environmental assessment of mercury exposure in a gold mining community in Western Mindanao, Philippines. J. Environ. Manage 2006, 81, 126–134. [Google Scholar]
- Paruchuri, Y.; Siuniak, A.; Johnson, N.; Levin, E.; Mitchell, K.; Goodrich, J.M.; Renne, E.P.; Basu, N. Occupational and environmental mercury exposure among small-scale gold miners in the Talensi-Nabdam District of Ghana's Upper East region. Sci. Total Environ. 2010, 408, 6079–6085. [Google Scholar]
- Barbieri, F.L.; Cournil, A.; Gardon, J. Mercury exposure in a high fish eating Bolivian Amazonian population with intense small-scale gold-mining activities. Int. J. Environ. Health Res. 2009, 19, 267–277. [Google Scholar]
- Hodgson, S.; Nieuwenhuijsen, M.J.; Colvile, R.; Jarup, L. Assessment of exposure to mercury from industrial emissions: Comparing “distance as a proxy” and dispersion modelling approaches. Occup. Environ. Med. 2007, 64, 380–388. [Google Scholar]
- Appleton, J.D.; Weeks, J.M.; Calvez, J.P.; Beinhoff, C. Impacts of mercury contaminated mining waste on soil quality, crops, bivalves, and fish in the Naboc River area, Mindanao, Philippines. Sci. Total Environ. 2006, 354, 198–211. [Google Scholar]
- Castilhos, Z.C.; Rodrigues-Filho, S.; Rodrigues, A.P.; Villas-Boas, R.C.; Siegel, S.; Veiga, M.M.; Beinhoff, C. Mercury contamination in fish from gold mining areas in Indonesia and human health risk assessment. Sci. Total Environ. 2006, 368, 320–325. [Google Scholar]
- Taylor, H.; Appleton, J.D.; Lister, R.; Smith, B.; Chitamweba, D.; Mkumbo, O.; Machiwa, J.F.; Tesha, A.L.; Beinhoff, C. Environmental assessment of mercury contamination from the Rwamagasa artisanal gold mining centre, Geita District, Tanzania. Sci. Total Environ. 2005, 343, 111–133. [Google Scholar]
- Vieira, R. Mercury-free gold mining technologies: Possibilities for adoption in the Guianas. J. Clean. Prod. 2006, 14, 448–454. [Google Scholar]
- Appel, P.W.U.; Jønsson, J.B. Borax—An alternative to mercury for gold extraction by small-scale miners: introducing the method in Tanzania. Geol. Surv. Den. Greenl. Bull. 2010, 20, 87–90. [Google Scholar]
- Swain, E.B.; Jakus, P.M.; Rice, G.; Lupi, F.; Maxson, P.A.; Pacyna, J.M.; Penn, A.; Spiegel, S.J.; Veiga, M.M. Socioeconomic consequences of mercury use and pollution. Ambio 2007, 36, 45–61. [Google Scholar]
- Spiegel, S.J.; Yassi, A.; Spiegel, J.M.; Veiga, M.M. Reducing mercury and responding to the global gold rush. Lancet 2005, 366, 2070–2072. [Google Scholar]
- Grandjean, P.; Weihe, P.; White, R.F.; Debes, F.; Araki, S.; Yokoyama, K.; Murata, K.; Sorensen, N.; Dahl, R.; Jorgensen, P.J. Cognitive deficit in 7-year-old children with prenatal exposure to methylmercury. Neurotoxicol. Teratol. 1997, 19, 417–428. [Google Scholar]
Abbreviations
| ASGM | Artisanal small-scale gold mining |
| BAT | Work place tolerance level |
| BEI | Biological Exposure Index |
| Crea | Creatinine |
| GMP | Global Mercury Project |
| HBM | Human Biomonitoring levels |
| Hg | Mercury |
| LMU | Ludwig-Maximilians Universitaet—University of Munich |
| LOD | limit of detection |
| UMIT | The Health & Life Sciences University |
| UNIDO | United Nations Industrial Development Organization |
| WHO | World Health Organization |
© 2011 by the authors; licensee MDPI, Basel, Switzerland. This article is an open access article distributed under the terms and conditions of the Creative Commons Attribution license (http://creativecommons.org/licenses/by/3.0/).
Share and Cite
Baeuml, J.; Bose-O’Reilly, S.; Gothe, R.M.; Lettmeier, B.; Roider, G.; Drasch, G.; Siebert, U. Human Biomonitoring Data from Mercury Exposed Miners in Six Artisanal Small-Scale Gold Mining Areas in Asia and Africa. Minerals 2011, 1, 122-143. https://doi.org/10.3390/min1010122
Baeuml J, Bose-O’Reilly S, Gothe RM, Lettmeier B, Roider G, Drasch G, Siebert U. Human Biomonitoring Data from Mercury Exposed Miners in Six Artisanal Small-Scale Gold Mining Areas in Asia and Africa. Minerals. 2011; 1(1):122-143. https://doi.org/10.3390/min1010122
Chicago/Turabian StyleBaeuml, Jennifer, Stephan Bose-O’Reilly, Raffaella Matteucci Gothe, Beate Lettmeier, Gabriele Roider, Gustav Drasch, and Uwe Siebert. 2011. "Human Biomonitoring Data from Mercury Exposed Miners in Six Artisanal Small-Scale Gold Mining Areas in Asia and Africa" Minerals 1, no. 1: 122-143. https://doi.org/10.3390/min1010122
APA StyleBaeuml, J., Bose-O’Reilly, S., Gothe, R. M., Lettmeier, B., Roider, G., Drasch, G., & Siebert, U. (2011). Human Biomonitoring Data from Mercury Exposed Miners in Six Artisanal Small-Scale Gold Mining Areas in Asia and Africa. Minerals, 1(1), 122-143. https://doi.org/10.3390/min1010122