Article

University Campuses as Vital Urban Green Infrastructure: Quantifying Ecosystem Services Based on Field Inventory in Nizhny Novgorod, Russia

by
Basil N. Yakimov
1,2,*,
Nataly I. Zaznobina
2,
Irina M. Kuznetsova
3,
Angela D. Bolshakova
2,
Taisia A. Kovaleva
2,
Ivan N. Markelov
2 and
Vladislav V. Onishchenko
4
1
Faculty of Biology, Shenzhen MSU-BIT University, Shenzhen 518172, China
2
Department of Ecology, Institute of Biology and Biomedicine, Lobachevsky State University of Nizhny Novgorod, Gagarin Avenue 23, Nizhny Novgorod 603022, Russia
3
Faculty of Biology and Biotechnology, HSE University, Myasnitskaya Ulitsa 20, Moscow 101000, Russia
4
The Center for Strategic Research, Gazetny Pereulok 1, Moscow 125009, Russia
*
Author to whom correspondence should be addressed.
Land 2025, 14(10), 2073; https://doi.org/10.3390/land14102073
Submission received: 17 September 2025 / Revised: 5 October 2025 / Accepted: 9 October 2025 / Published: 17 October 2025
(This article belongs to the Section Land Use, Impact Assessment and Sustainability)

Abstract

This study provides the first comprehensive, field-inventory-based assessment of urban ecosystem services within a Russian university campus, focusing on the woody vegetation of the Lobachevsky State University of Nizhny Novgorod. Utilizing a detailed field tree inventory combined with the i-Tree framework (including i-Tree Eco, i-Tree Canopy, UFORE, and i-Tree Hydro models), we quantified the campus’s capacity for carbon storage and sequestration, air pollutant removal, and stormwater runoff mitigation. The campus green infrastructure, comprising 1887 trees across 32 species with a density of 145.5 stems per hectare, demonstrated significant ecological value. Results show a carbon storage density of 26.61 t C ha−1 and an annual gross carbon sequestration of 11.43 tons. Furthermore, the campus trees removed 1213.7 kg of air pollutants annually (a deposition rate of 9.35 g m−2), with ozone, particulate matter, and sulfur dioxide showing the highest deposition. The campus also retained 956.1 m3 of stormwater annually. These findings, particularly the high carbon sequestration rates, are attributed to the dominance of relatively young, fast-growing tree species. This research establishes a critical baseline for understanding urban ecosystem services in a previously under-researched geographical context. The detailed, empirical data offers crucial insights for urban planners and policymakers in Nizhny Novgorod and beyond, advocating for the strategic integration of ecosystem services assessments into campus planning and broader urban green infrastructure development across Russian cities. The study underscores the significant role of university campuses as vital components of urban green infrastructure, contributing substantially to environmental sustainability and human well-being.

1. Introduction

Urbanization worldwide presents significant challenges to local ecosystem services, which are essential for creating habitable city environments and mitigating global climate change impacts [1]. While the definition of “urban” ecosystems can vary, they possess substantial biomass, influenced by land cover and use [2,3,4]. Unfortunately, urban pollution [5] and global climate change [6,7] negatively affect the well-being of city inhabitants. Ecological engineering is primarily employed to preserve and enhance natural systems to address environmental issues. Urban forests, in particular, offer numerous critical ecosystem services to city dwellers [8,9,10], including food provision [11,12], habitat support, oxygen production [13,14], local climate regulation [12,13], carbon sequestration [15], mitigation of the urban heat island effect [16,17,18], management of stormwater runoff [19,20], control of air pollution [21,22], and water pollution remediation [23]. They also provide cultural services such as recreational opportunities and environmental education [24,25]. Despite their recognized importance, urban ecosystems have historically been understudied compared to natural ecosystems, leading to significant gaps in understanding their full capacity to provide ecosystem services and contribute to urban sustainability and resilience [26].
There is a clear need for research to improve our understanding and develop effective tools for local resource planning and management, fostering sustainability. Ecological engineering underscores the critical importance of integrating urban areas with natural environments to benefit both human well-being and biodiversity [27]. This approach closely aligns with the concept of Nature-Based Solutions (NBS), a key European Union framework for sustainable urban development, which promotes the use of natural processes to address environmental and societal challenges [28]. In doing so, it aligns with the global pursuit of the Sustainable Development Goals (SDGs). Innovative approaches to sustainable urban development, such as the implementation of NBS exemplified by the green infrastructure, are essential to address the pressing issues of natural resource degradation and ecosystem loss, thereby advancing the objectives of Agenda 2030 [29]. Effective municipal climate preparedness and the protection of urban environmental quality necessitate a more precise understanding of local ecosystem functions, such as carbon storage and dry deposition, that underpin critical services. Enhancing estimates of these indicators will deepen our comprehension of urban ecosystem functioning and illuminate the potential impacts of green infrastructure policies on climate mitigation. This improved understanding will also highlight the significant role that urban green spaces play in enhancing urban resilience and quality of life by providing a diverse array of ecosystem services, thereby informing more strategic urban planning and policy development [30,31].
Ecosystem services stem from ecosystem functions, such as carbon uptake, occurring within a specific spatiotemporal context [32]. A significant portion of the services provided by urban ecosystems, particularly those relevant to climate change mitigation and resilience planning, are associated with the quantity, growth rate, canopy cover, and volume of live trees [33,34]. In recent years, researchers have dedicated efforts to developing methodologies for quantifying various ecosystem services. Broadly, there are two types of approaches for quantifying ecosystem services. First, bottom-up approaches rely on field inventories, providing detailed information on the characteristics of individual trees. This allows for the development of detailed models of the biophysical processes that underpin the provision of ecosystem services [35,36]. Second, top-down approaches utilize various remote sensing data, including satellite data, active and passive aerial imagery, as well as terrestrial scanning. Remote sensing enables the rapid acquisition of extensive data across large areas without direct contact with the objects of study. Among the available methodologies, the i-Tree suite of tools (https://www.itreetools.org/, accessed on 21 August 2025) represents a collection of widely adopted, validated, and freely accessible models that combine both top-down and bottom-up approaches. The i-Tree Canopy tool offers a comparatively swift estimation of canopy cover, obviating the necessity for field-based plot surveys [37]. This tool employs human photo-interpretation of land cover data derived from Google Earth aerial imagery to ascertain the percentage of tree canopy cover, defined as the projected area of the canopy onto the ground surface. Studies have indicated that human photo-interpretation yields more accurate tree canopy estimates than auto-classification methods using multispectral data, which tend to underestimate urban tree cover [38]. The i-Tree Eco tool, utilizing input data on tree structure, air pollution levels, weather patterns, building characteristics, and economic valuations, quantifies tree-based ecosystem services including the reduction in air pollutants, mitigation of stormwater runoff, savings in building energy consumption, and the sequestration of carbon dioxide [37]. This manuscript integrates field-based research data with data from the i-Tree Canopy tool to provide an estimate of several regulating ecosystem services.
Numerous studies have quantified the ecosystem services provided by urban forests [39], parks [40,41], gardens [13,41,42], and green infrastructure [43,44,45]. Despite this extensive research, university campuses, as a specific form of urban green infrastructure, have been comparatively overlooked. While urban parks, forests, and gardens share the common goal of providing ecosystem services, a university campus uniquely synthesizes three core functions: it serves simultaneously as a living laboratory for research and innovation, a demographic hub with a dense, transient, and educable population, and a managed institutional entity with its own governance and long-term sustainability commitments [46,47]. This triad creates a distinctive socio-ecological setting that is uniquely conducive to practical experimentation with and the scaling of sustainable development frameworks, including NBS. Specifically, the campus environment allows for the integrated development, real-world testing, and rapid dissemination of green technologies and adaptation measures—from innovative water management systems to biodiversity monitoring networks—in a way that is systemically managed and pedagogically integrated, which is rarely feasible in conventional public green spaces [48]. Prior research on campus ecosystem services has predominantly concentrated on carbon stock assessment and sequestration [49,50,51,52,53], with some studies also examining air pollution removal and stormwater runoff retention [54,55,56,57].
The existing body of research on ecosystem services within Russian cities remains limited. Current calculations predominantly rely on estimations of tree-occupied areas [58], with a notable absence of field-based tree inventory studies in Russia that incorporate species composition and tree condition.
This research presents a comprehensive assessment of ecosystem services on the Lobachevsky University campus, the most prominent university in a major Russian city. By treating the campus as representative of Nizhny Novgorod’s broader land use patterns, this study sought to answer critical questions regarding the campus trees’ capacity for carbon storage and sequestration, their impact on air quality and pollutant concentrations, and their role in retaining rainwater. This detailed, field-inventory-based assessment represents the first such endeavor in Russia, providing a crucial baseline for future urban ecological planning and sustainable campus management.

2. Materials and Methods

The methodology employed for this assessment combined extensive field surveys with established modeling techniques to accurately quantify the ecological benefits provided by the campus’s urban forest. First, we provide a general overview of the campus structure, including its climatic and topographic description, as well as its historical construction background and the demography of its inhabitants. Furthermore, to obtain a quantitative description of cover types, we utilized the i-Tree Canopy tool (Section 2.1). Second, we conducted a comprehensive field inventory of all trees across the campus to gather stem-specific data on tree size, health, and location, which provided the necessary information for subsequent ecosystem service modeling (Section 2.2). Finally, we leveraged the i-Tree Eco model to calculate various ecosystem services, integrating the collected field data with local meteorological and air quality information to assess benefits such as carbon storage and sequestration, pollutant removal, and stormwater runoff retention (Section 2.3).

2.1. Study Area and Cover Type Inventory

Nizhny Novgorod, situated in the temperate zone, experiences a temperate continental climate characterized by prolonged cold winters and brief, warm summers. The city’s average annual temperature stands at 5.3 °C, with precipitation levels ranging from 530 to 683 mm. Geographically positioned on the banks of the Volga and Oka rivers, Nizhny Novgorod is demarcated into an Upland and a Lowland part. As the administrative hub for both the Nizhny Novgorod Region and the Volga Federal District, the city boasts a population exceeding 1.2 million residents, with its urban agglomeration reaching approximately 1.7 million. Ranking as Russia’s sixth-largest city and the second most populous along the Volga River and within its federal district, Nizhny Novgorod serves as a pivotal economic, transportation, scientific, educational, and cultural center for both Russia and the broader Volga-Vyatka economic region.
A significant portion of the city’s land area, approximately one-fifth, comprises parks, forests, and natural slopes, predominantly characterized by mixed forest ecosystems. Gardens, squares, boulevards, parks, and forests collectively constitute one-seventh of Nizhny Novgorod’s total green spaces. Public transportation is crucial to the city’s functionality; however, its efficiency is hampered by the dispersed population, substantial daily commuter traffic, and high congestion on bridges spanning the Oka and Volga Rivers, exacerbated by the absence of a comprehensive rapid transit network. Consequently, vehicular emissions contribute significantly, accounting for 75% of atmospheric air pollution in Nizhny Novgorod.
National Research Lobachevsky State University of Nizhny Novgorod was established in 1916. The campus’s development began in the 1950s, with initial tree and shrub plantings following the construction of the first buildings in the 1960s. The university encompasses 19 faculties and educational institutes, along with 132 departments. Currently, it educates approximately 30,000 students from 97 countries, supported by over 1000 post-graduates and doctoral students, and a faculty comprising 1200 associate professors and 400 professors.
The university campus, a restricted-use area currently spanning 12.98 hectares, is situated in the Upland part of the city. It comprises 17 buildings, including 6 academic and research facilities, 4 student dormitories, 2 training centers, and 5 utility and administrative buildings, alongside mature trees and shrubs both native and exotic to the region (Figure 1 and Figure A1, Appendix A). Located in the historical part of the city, the campus overlooks a major highway characterized by heavy traffic. However, the university’s academic buildings are buffered from the highway by a wide strip of woody and shrubby vegetation. Thus, the type and number of stories of buildings, the presence of a green zone, and the proximity to transport arteries make the campus territory comparable to the historical development of the upper part of Nizhny Novgorod. These ecological contributions support the characterization of the university campus as a representative urban environment.
The i-Tree Canopy web-application (https://canopy.itreetools.org/, accessed on 21 August 2025) was utilized to ascertain the proportional distribution of various cover types across the campus. Seven distinct cover types were identified: Grass/Herbaceous, Impervious Buildings, Impervious Other, Impervious Road, Soil/Bare Ground, Tree/Shrub, and Water. A total of 198 points were randomly allocated within the campus boundary. Each point was categorized according to its cover type, determined through photo-interpretation of aerial imagery obtained from Google. Subsequently, the total area and percentage cover for each cover type were computed, along with their respective standard errors.

2.2. Tree and Shrub Inventory

The research methodology employed the i-Tree framework [37], necessitating a comprehensive field inventory of all trees and shrubs on campus with a diameter at breast height exceeding 1 inch. This detailed assessment was conducted in the summer of 2022 by a team of four master’s students under the supervision of experienced researchers. For each recorded stem, the following metrics were precisely measured: diameter at breast height, total tree height, height to the base of the crown, crown width, percentage of crown missing, degree of crown dieback, and crown light exposure (Table 1). The assessment of these main parameters was carried out using specialized tools, including a Stayer ProLeader tape for measuring dbh, and a Leica DISTOD810 laser rangefinder for determining tree height and crown width. To enhance the accuracy of each tree’s geo-positioning, a Prince I30 geodetic satellite receiver (CHCNAV, Shanghai, China) was utilized, accessing a system of reference base stations for corrections from the nearest station. Raw inventory data are provided in the Supplementary Material.

2.3. Quantification of Urban Ecosystem Services

2.3.1. Carbon Storage and Sequestration

The calculation of carbon stock utilizes allometric equations for aboveground biomass, which are derived from stem diameter measurements [59]. Aboveground biomass is subsequently computed using these equations and converted to total biomass by applying a root-to-shoot ratio of 0.26 [60]. To account for the lower biomass of isolated trees (with light exposure 4–5) compared to those in dense forest canopies, their biomass is adjusted by a factor of 0.8 [15]. Carbon stock is determined based on a 50% contribution to the total wood biomass [61].
Carbon sequestration is quantified based on the annual diameter at breast height (dbh) growth. Tree species are categorized into fast, medium, and slow-growing groups, with corresponding base growth rates of 1.09, 0.84, and 0.58 cm per 153-day growing season. Growth rate adjustments are applied considering factors such as the duration of the growing season, light exposure (for light exposure 0–1 coefficient of 0.44 was applied, for light exposure 2–3 coefficient of 0.56 was applied), crown dieback, and tree diameter. In particular, growth is projected to slow when a tree reaches 80% of its species’ maximum size, and at 125% of maximum size, growth is limited to 2% of its potential. Biomass increment is determined as the difference in aboveground biomass between the initial state and after growth. The conversion of biomass increment to carbon sequestration follows the same methodology used for calculating carbon storage.

2.3.2. Air Pollution Removal

The removal of air pollutants is calculated using the UFORE model [62,63]. This model determines pollutant (carbon monoxide CO, nitrogen dioxide NO2, sulfur dioxide SO2, ozone O3, particulate matter PM2.5 and PM10) deposition on leaves based on concentration and prevailing weather conditions, estimating removal as a flux (g/m2) derived from multiplying dry deposition velocity (m/s) by pollutant concentration (g/m3). The deposition velocity is computed considering aerodynamic and quasi-laminar boundary layer and canopy resistances, with the latter being a function of stomatal, mesophyll, and cuticular resistances [64,65]. To calculate the total pollutant removal by trees, the pollutant flux is multiplied by the total leaf area, and average pollution removal per square meter of tree cover is also determined.
The leaf area for each tree was subsequently determined using a regression equation that incorporated crown height, crown diameter, and a shading factor [66]. As the foundational regression equation was established for trees with crown heights between 1 and 12 m, crown diameters from 1 to 14 m, and height-to-width ratios of 0.5 to 2; specific adjustments were implemented for trees falling outside these limits. The ultimate estimation of leaf area accounted for the degree of missing crown and crown dieback.
In addition to total pollutant removal, changes in the concentration of pollutants in the air were also calculated, taking into account the boundary layer height. The initial concentrations of pollutants and hourly meteorological data were taken from the nearest meteorological station.

2.3.3. Runoff Retention

The i-Tree Hydro model [67] is employed to quantify the volume of precipitation intercepted by vegetation, which subsequently reduces stormwater runoff. The model first simulates hourly precipitation interception processes, categorizing precipitation into in-canopy and through-canopy. This interception occurs in three stages: the first stage involves canopy storage and evaporation until the canopy storage capacity is filled; the second stage occurs when storage is full, leading to canopy drip while evaporation continues; and the third stage is a drying period after precipitation ceases, where only evaporation occurs from stored water. Precipitation that reaches the ground, either as through-canopy precipitation or canopy drip, is then subject to further interception by impervious and pervious ground covers under the canopy. These ground covers also undergo a three-stage process involving depression storage, evaporation, and either overland runoff (for impervious surfaces) or infiltration (for pervious surfaces).
To quantify the effect of vegetation, the model considers a hypothetical scenario where the same area of interest has no vegetation cover. In this alternative scenario, all precipitation directly impacts the ground cover. Urban areas are assumed to consist of 25.5% impervious cover and 74.5% pervious cover [68]. The precipitation interception process for these ground covers is calculated without the initial vegetation layer. The total annual surface runoff volume is computed for both scenarios (with and without vegetation), and the net runoff retention is then calculated, quantifying the reduction in surface runoff attributable to vegetation.

3. Results

3.1. Campus Surface Cover

Trees and shrubs, along with impervious building structures, represent the predominant land cover types on the campus. Lawns, roads, and bare soil occupy a smaller proportion of the area, and there are no water bodies present on the campus (Table 2).

3.2. Vegetation Structure

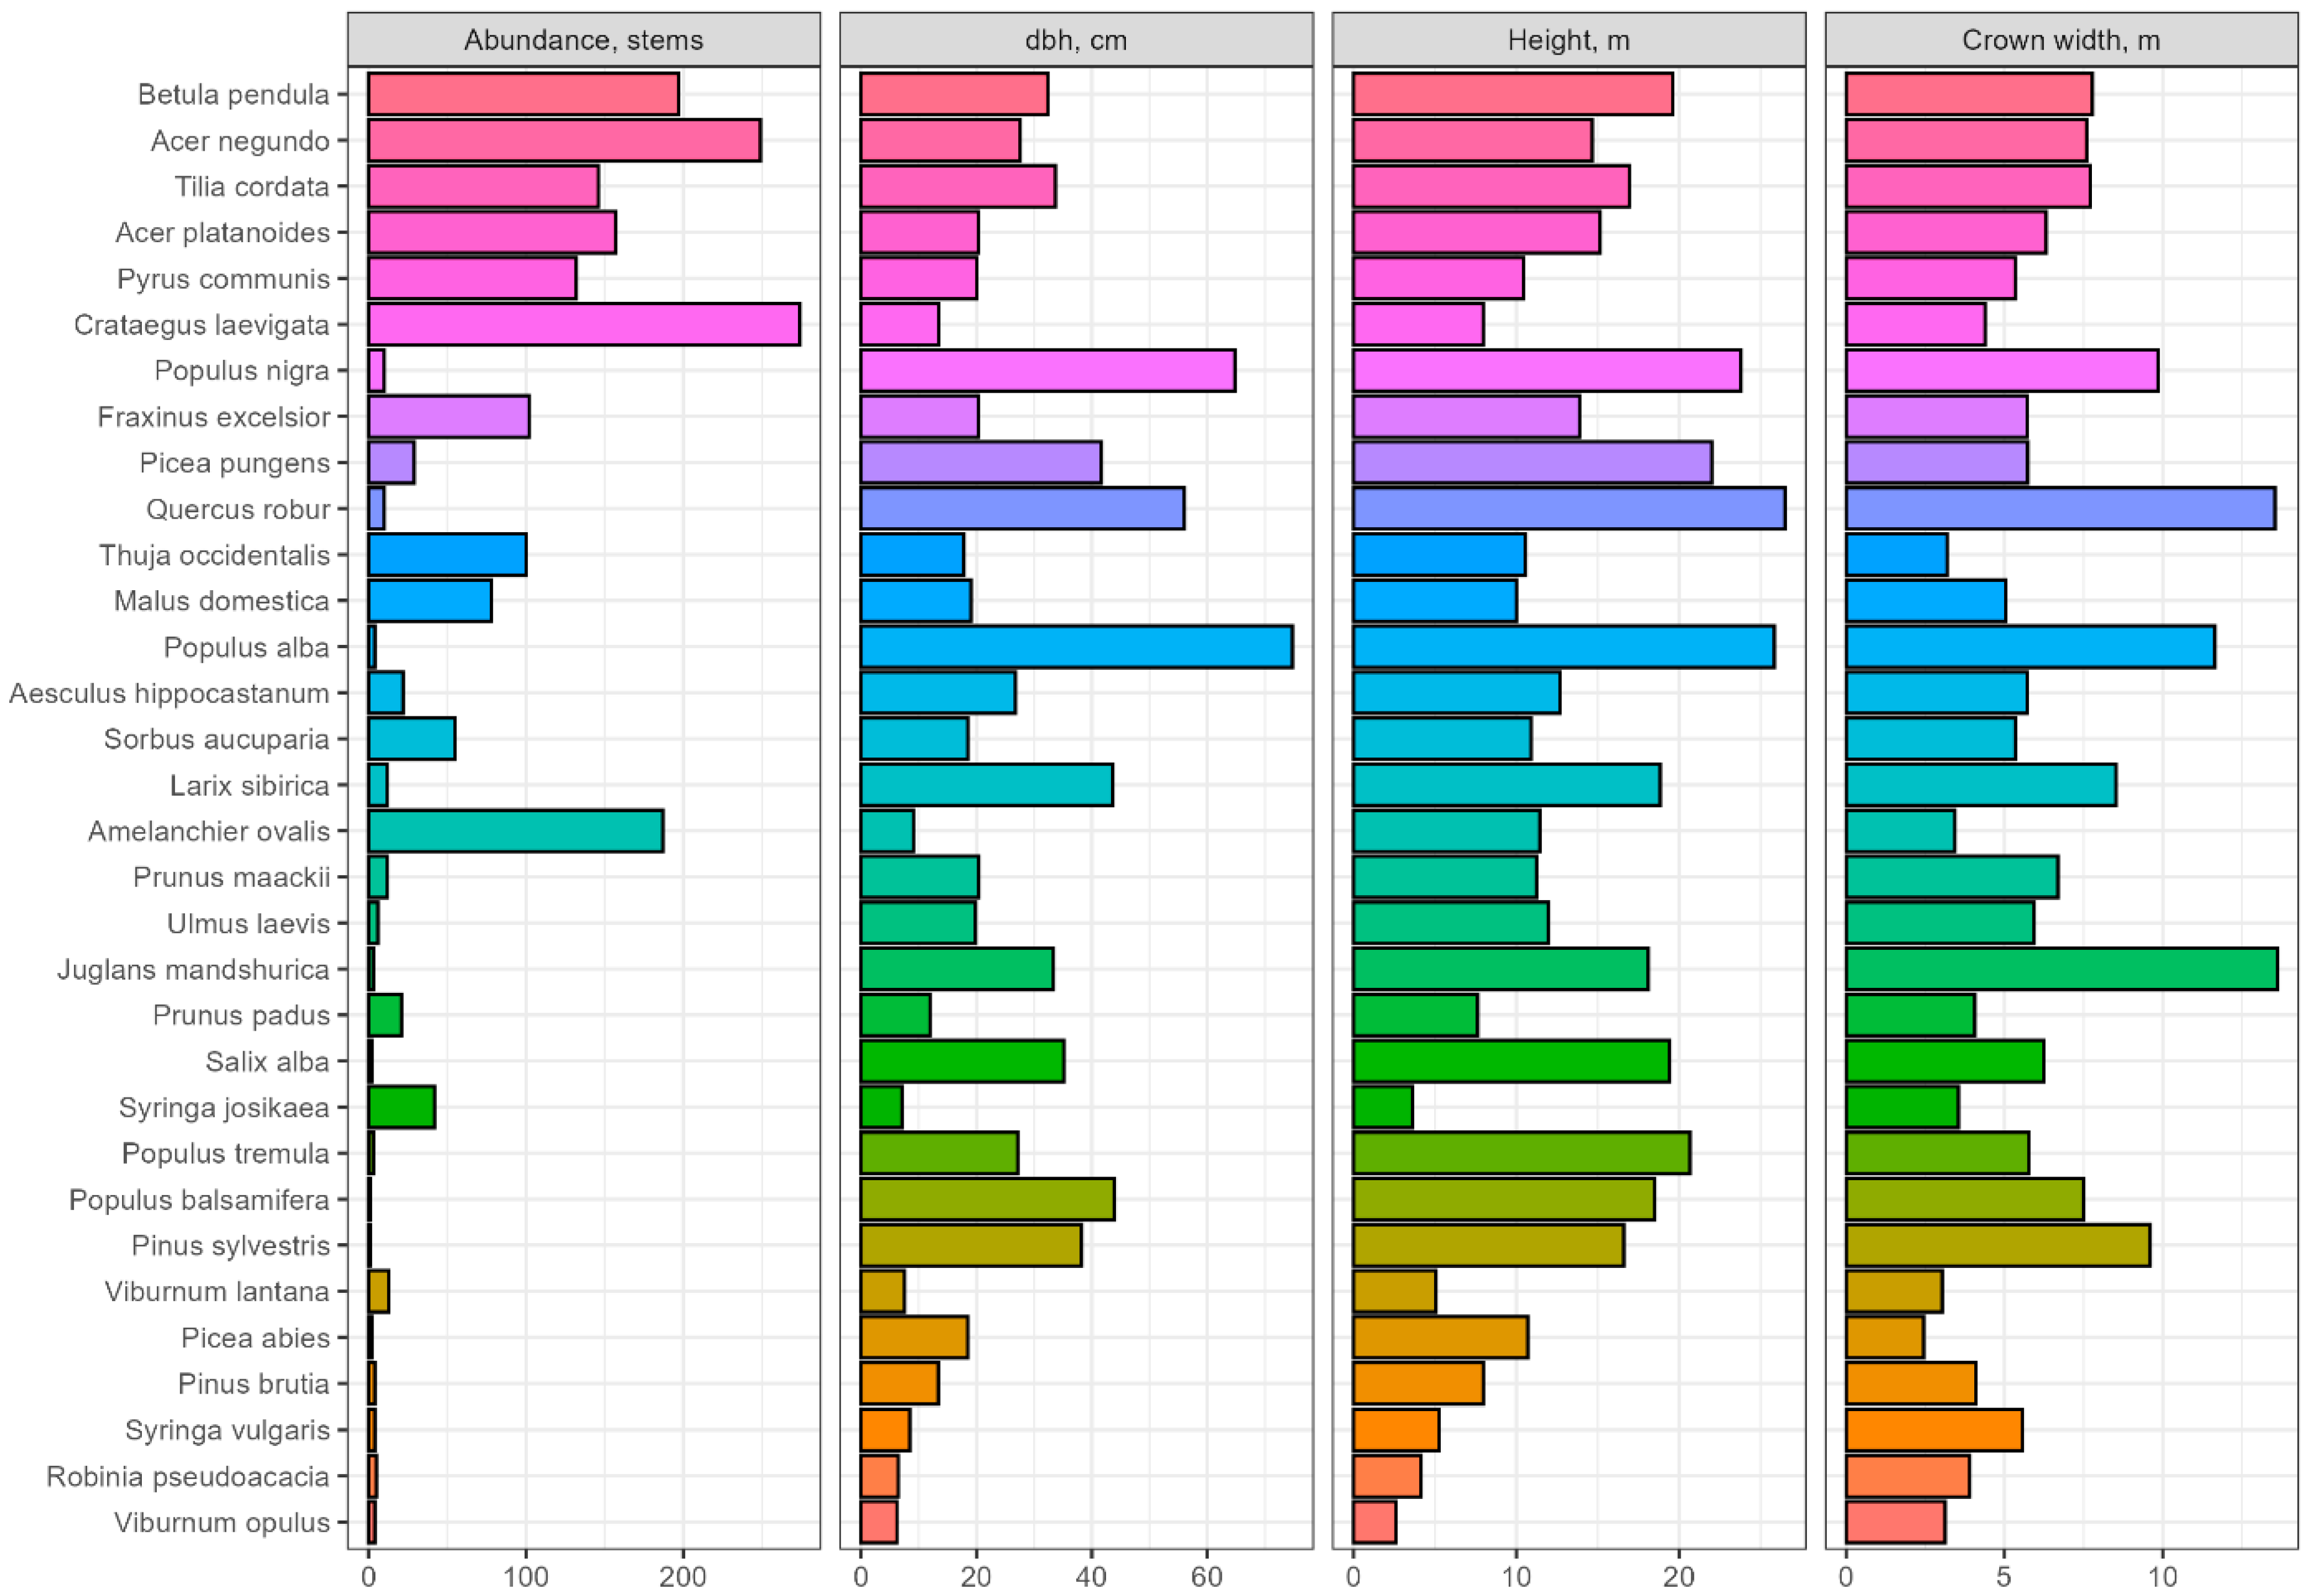
The campus garden contains a total of 1887 trees (97% deciduous and 3% coniferous trees), representing 32 different species, with an overall tree density of 145.5 stems per hectare. The most common species is Crataegus laevigata, with 274 stems, followed by Acer negundo and Betula pendula (Figure 2). The ten most common species collectively account for 85.9% of the total number of trees. These species, while dominant, exhibit varying distributions and structural characteristics across the campus landscape.
The maximal heights were recorded for Quercus robur, Populus alba, and Populus nigra. In contrast, Crataegus laevigata, Viburnum opulus, and Syringa joskaea, species often classified as shrubs, exhibited minimal heights. A similar pattern was observed for both dbh and average crown width. The maximal dbh values were recorded for Populus alba, Populus nigra, and Quercus robur, while the minimal values were measured for Viburnum opulus and Syringa joskaea. The maximal average crown widths were characteristic of Juglans mandshurica, Quercus robur, and Populus alba, with Viburnum opulus and Robinia pseudoacacia, which predominantly form shrubs on the campus, showing the minimal average crown widths.
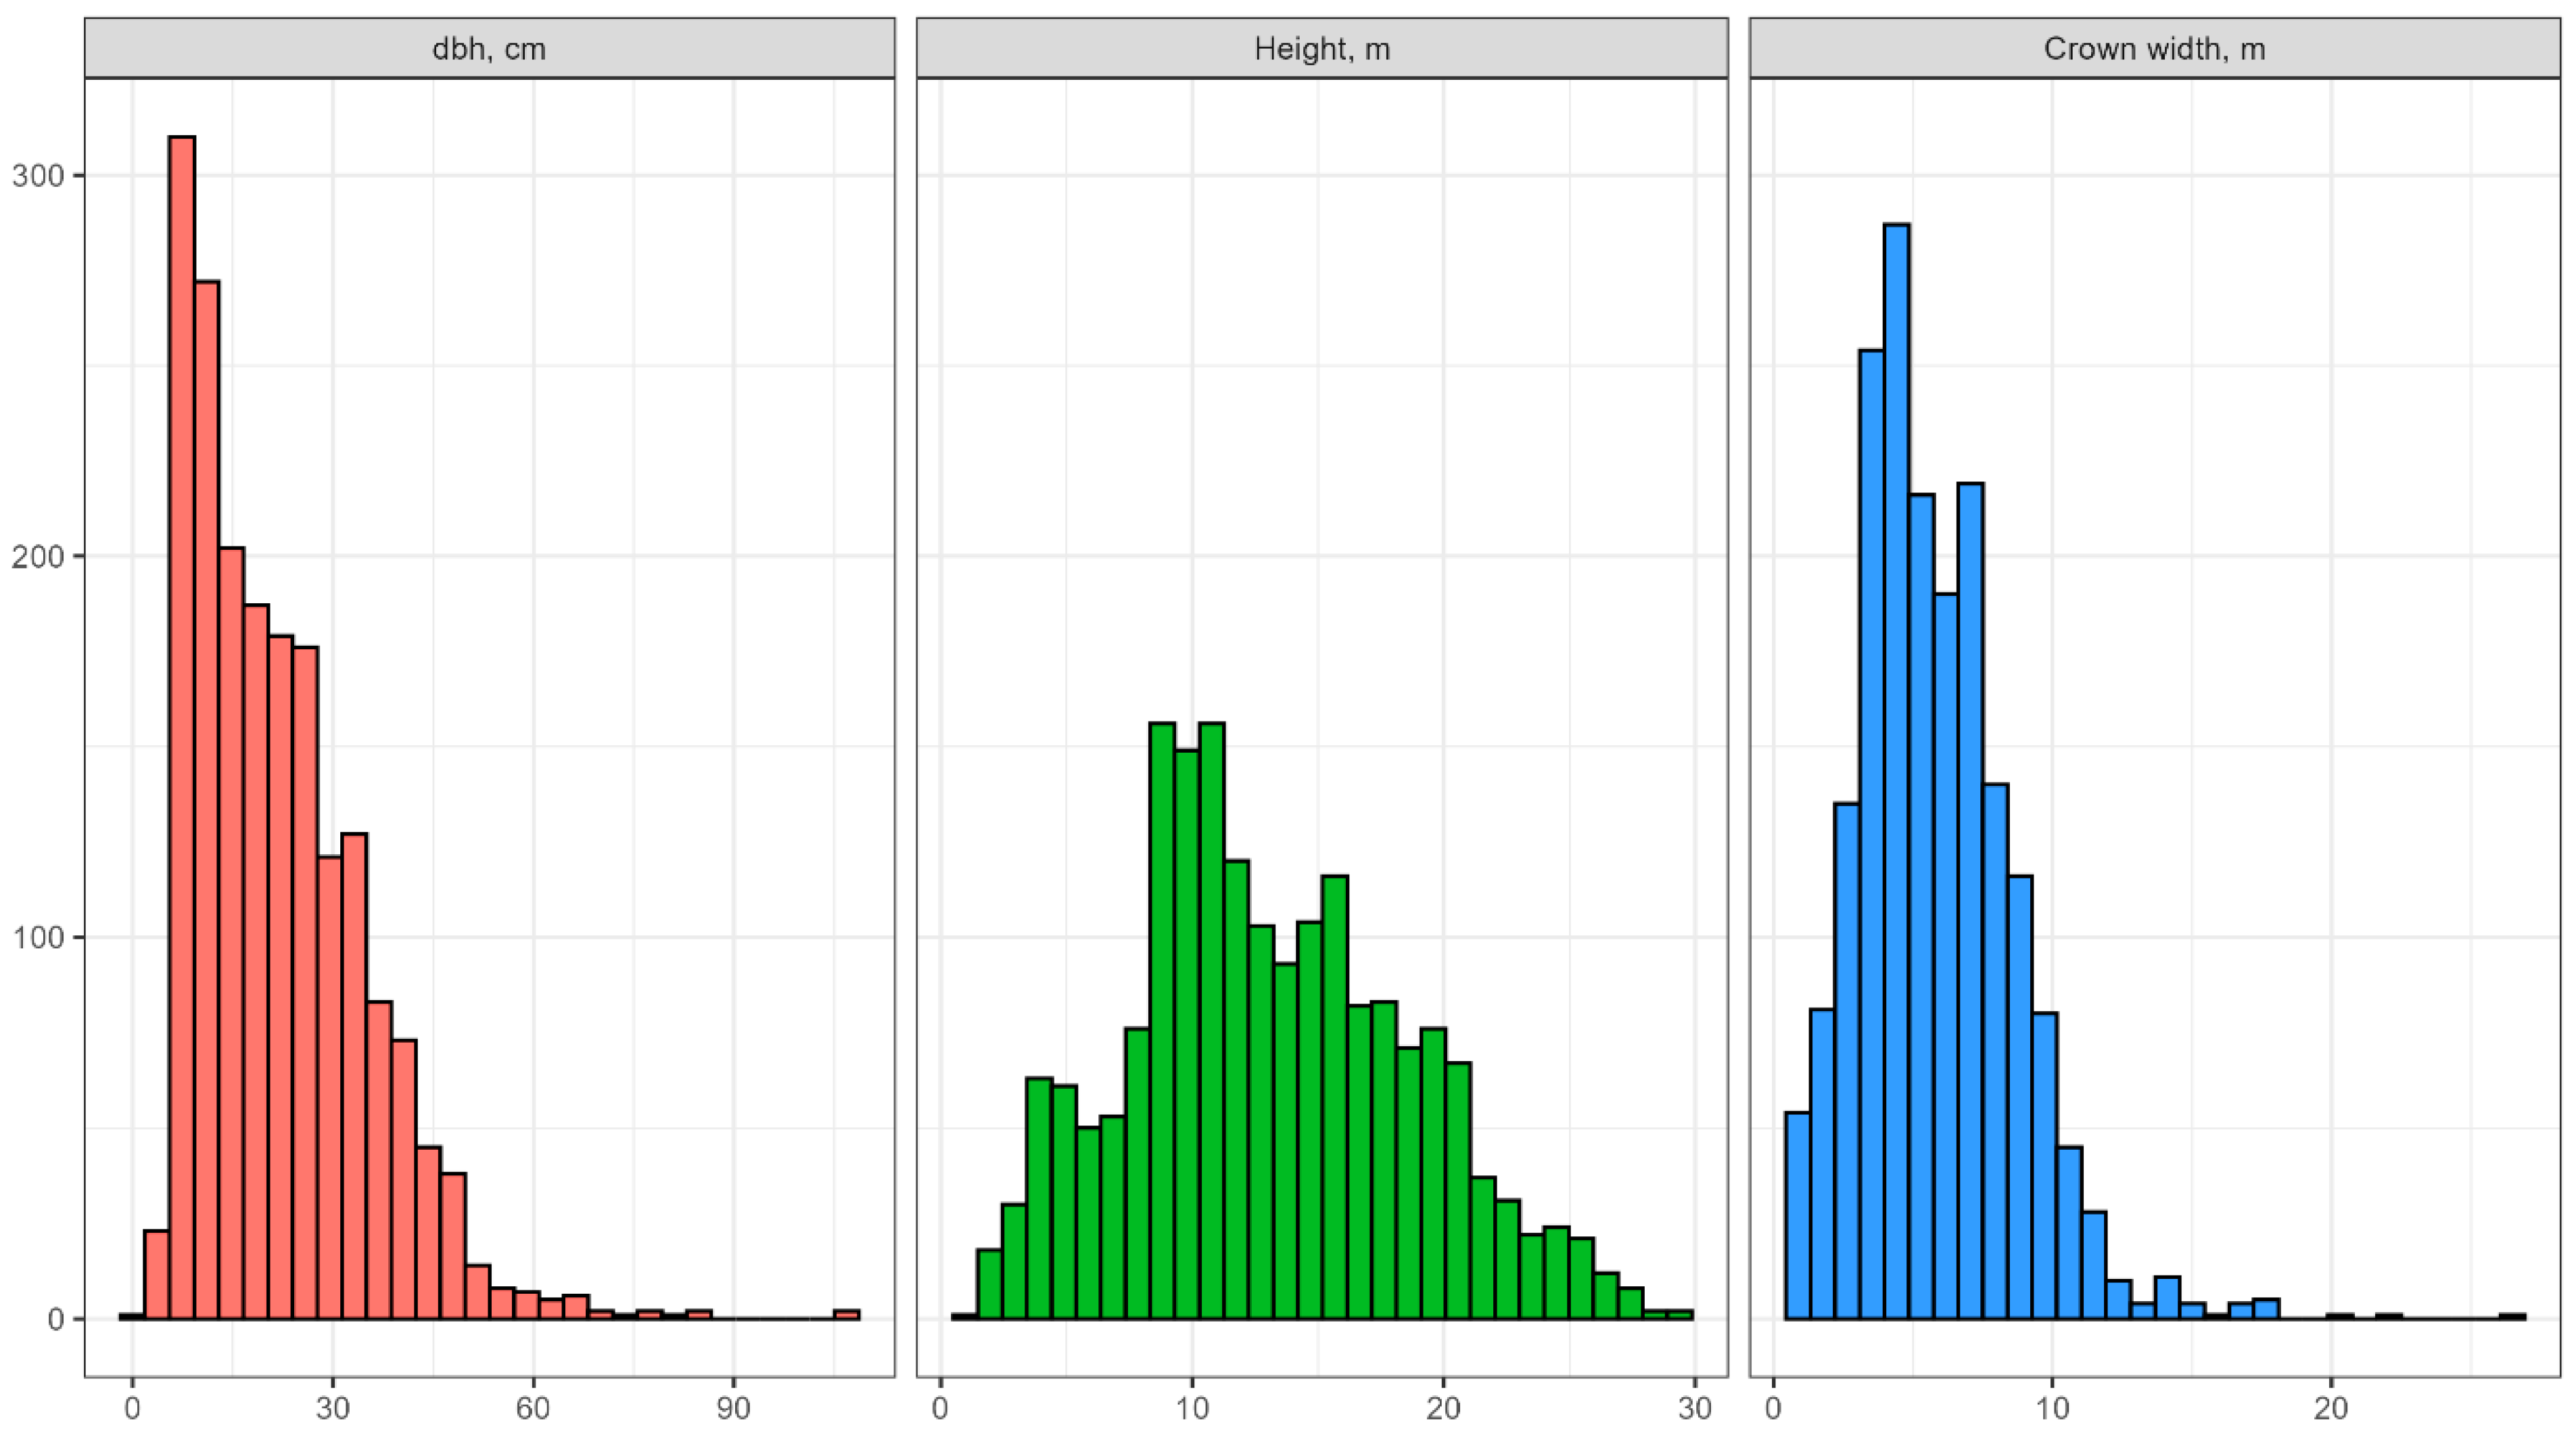
Overall, the campus garden is dominated by relatively small, shrub-like individuals. A significant proportion of stems, 64.5%, have a dbh less than 25 cm, and 44.25% have a crown width less than 5 m (Figure 3). Both dbh and average crown width exhibit a right-skewed distribution, whereas the height distribution is much more symmetric, with a modal height of 10 m and a median height of 12.3 m.

3.3. Quantification of Urban Ecosystem Services

3.3.1. Carbon Storage and Sequestration

The trees and shrubs in the campus garden store 345.37 t C, which translates to an overall carbon storage density of 26.61 t C ha−1 across the campus, and a carbon density per canopy cover of 58.54 t C ha−1. The largest quantities of carbon are found within the biomass of Betula pendula, Acer negundo, and Tilia cordata (Figure 4). Collectively, these three species account for 175.89 t C, representing 50.9% of the total stored carbon.
The gross carbon sequestration by trees on campus is approximately 11.43 tons of carbon per year (0.088 kg m−2). Betula pendula, Acer negundo, and Tilia cordata exhibit the highest sequestration potential on campus, mirroring the species with the largest stored carbon quantities. The average size of trees belonging to these species is much smaller than the size at which growth typically slows down. This is the primary reason for the high carbon sequestration potential observed in the campus trees. However, this growth pattern suggests that while current sequestration rates are high, the long-term potential may be limited as the trees mature.

3.3.2. Air Pollution Removal

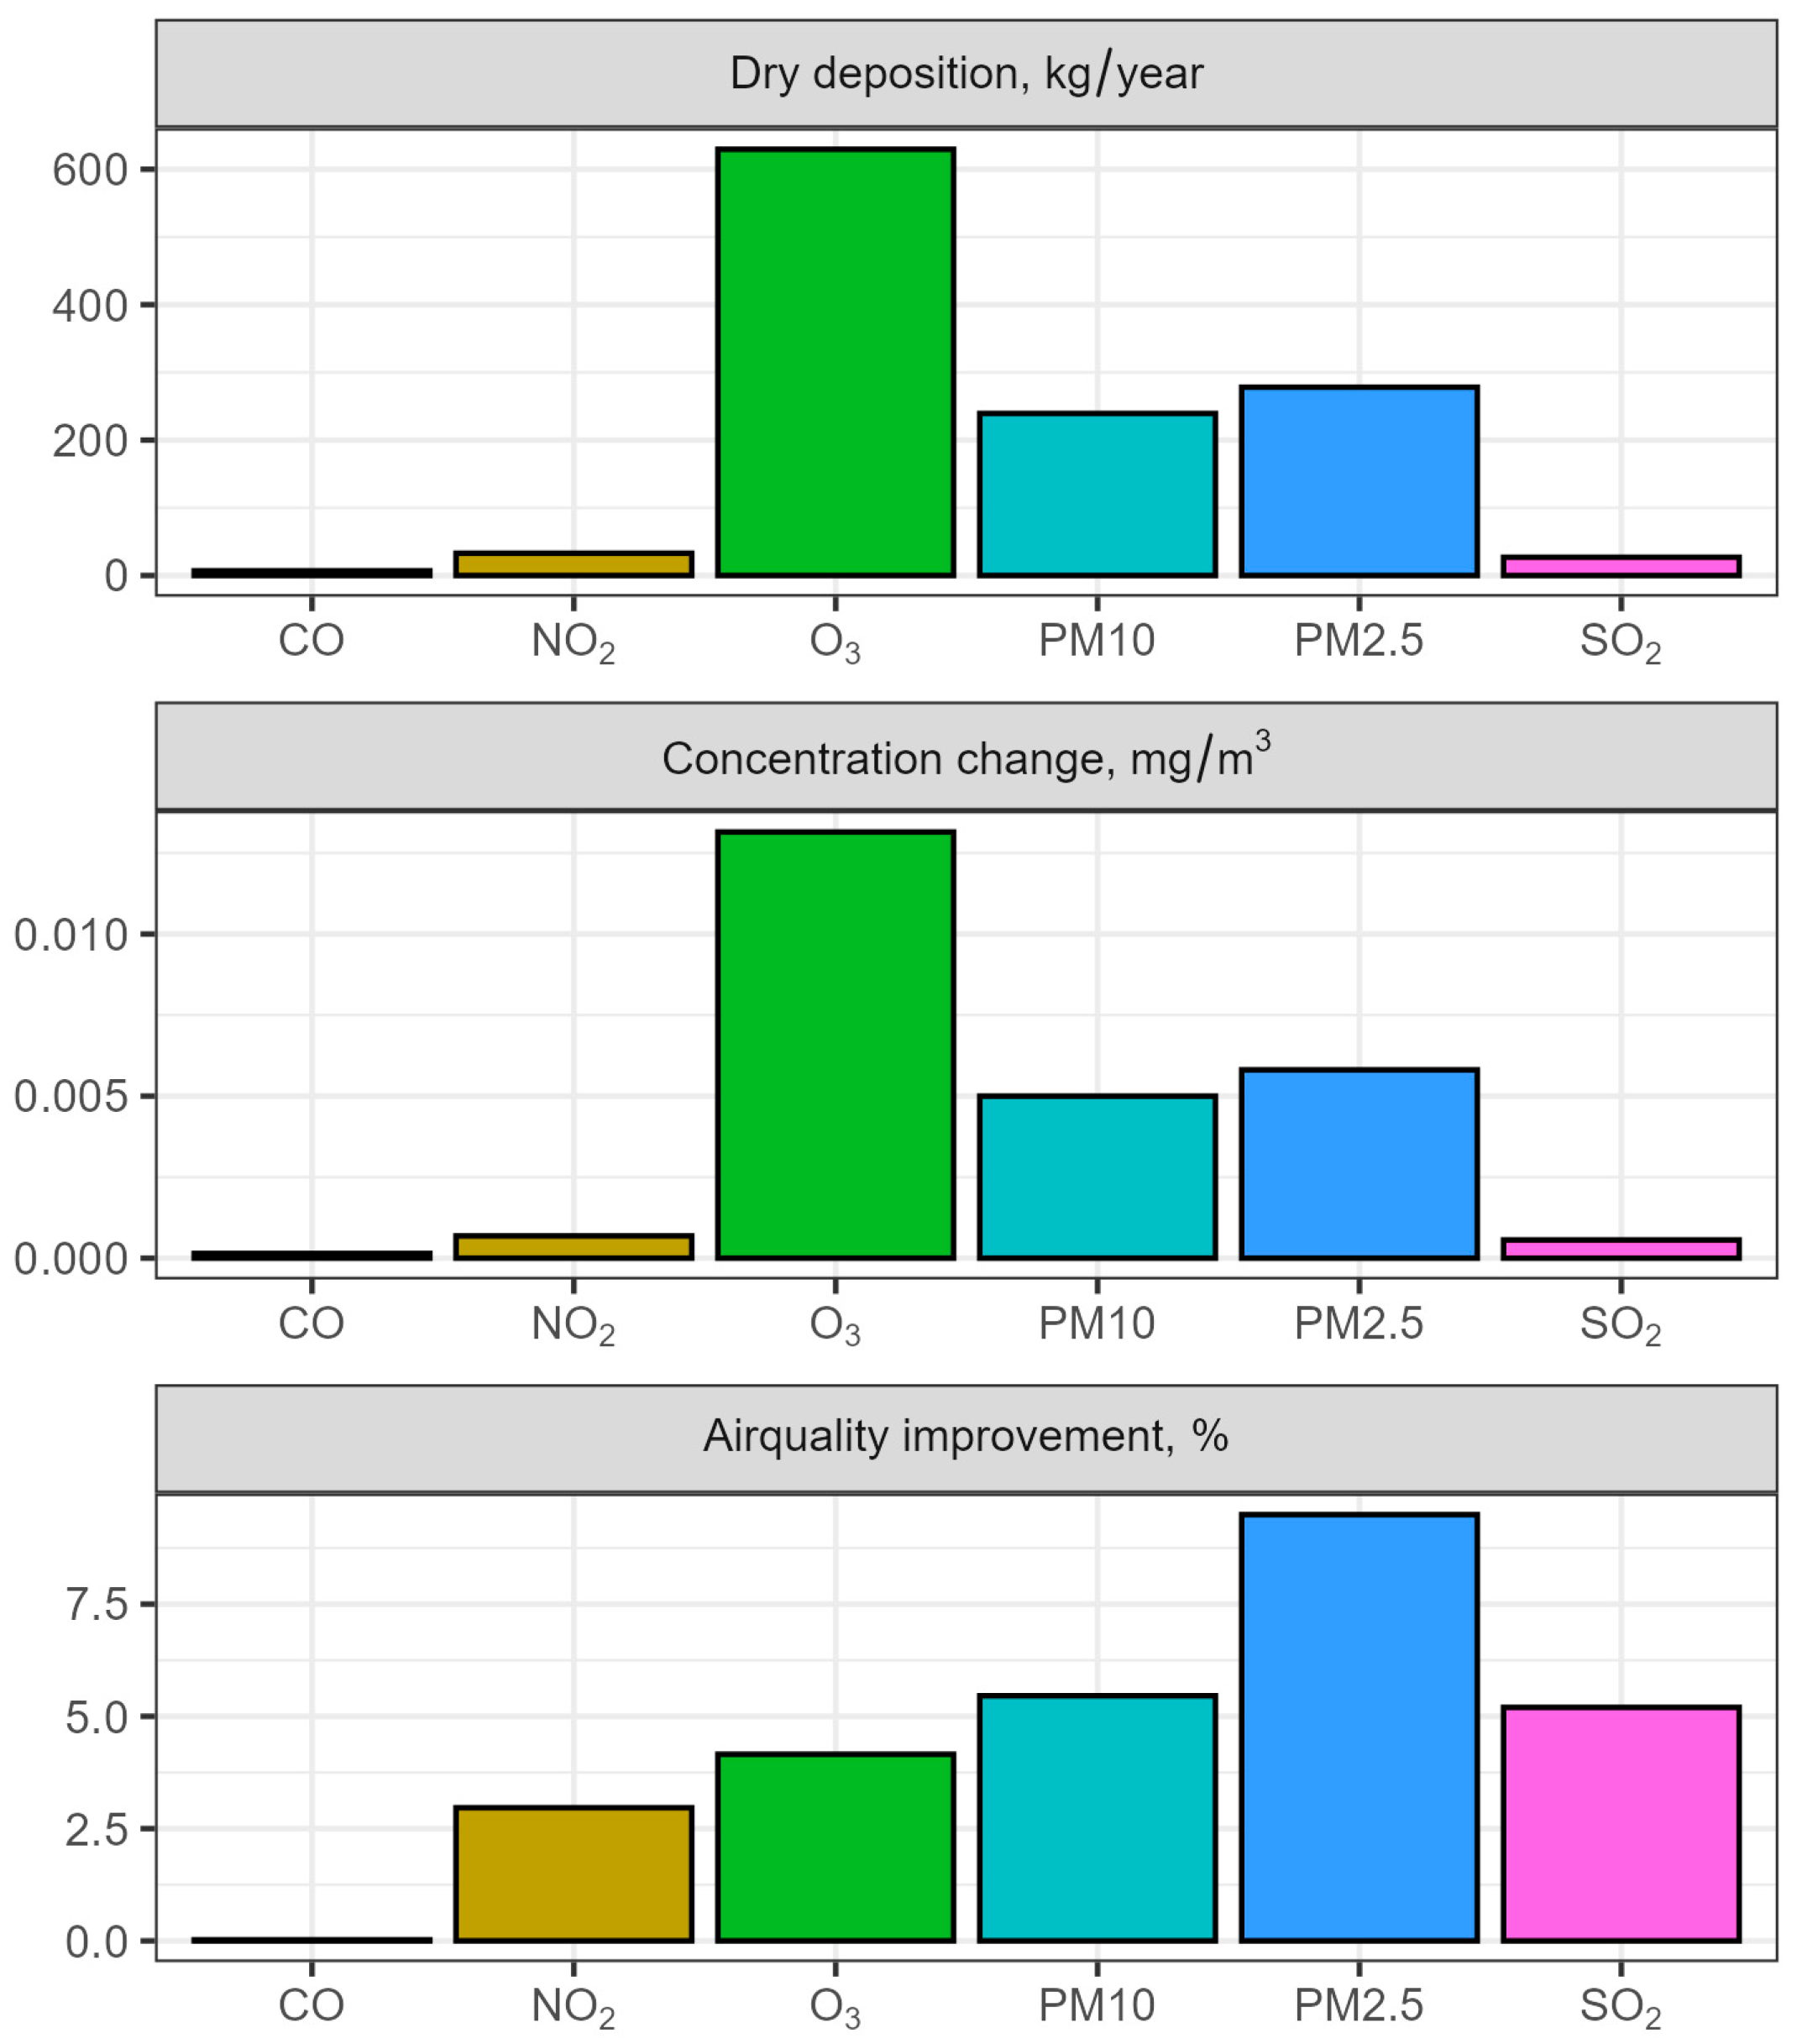
The total mass of pollutants deposited on leaf surfaces annually is 1213.7 kg, corresponding to an overall deposition rate of 9.35 g m−2. Ozone exhibits the highest deposition when considering both its mass and the absolute change in concentration (Figure 5). However, when evaluating the relative improvement in pollutant concentrations, particulate matter and sulfur dioxide are deposited best. Carbon monoxide and nitrogen dioxide demonstrate the least deposition and concentration changes.
The contribution of particular tree species to dry deposition is directly proportional to their leaf surface area. Dry deposition is dominated by three tree species with the largest biomass: Betula pendula, Acer negundo, and Tilia cordata (Figure 4).

3.3.3. Runoff Retention

The campus experienced a total runoff retention volume of 956.1 m3 annually. Throughout the leaf-on period, trees and shrubs collectively retained approximately 2.3% of the total precipitation. The dominant tree species on campus, including Betula pendula, Acer platanoides, and Tilia cordata, contributed most significantly to this runoff retention (Figure 4), accounting for 50.5% of the total.

4. Discussion

This study presents a detailed assessment of urban ecosystem services on a university campus, based on a direct field inventory. Unlike previous methods that used general estimates or remote sensing, our research uses precise data collected from individual trees. This approach greatly improves the accuracy of our estimates for carbon storage and sequestration, air pollutant removal, and stormwater runoff retention. By providing these empirical insights from a typical Russian urban green space, our work creates a solid foundation for future urban ecological planning and sustainable campus management in the region, offering a deeper and more reliable understanding of their environmental contributions.
The tree density observed at the main campus of Lobachevsky University was 145.5 stems per hectare, which is comparable to the Ege University Rectorship Garden (167 stems per hectare [54]) and significantly higher than that of campuses at larger institutions such as Amity University, Noida (83.2 stems per hectare [52]), the University of Georgia’s Main Campus (73 stems per hectare [51]), the University of New Zealand (68 stems per hectare [50]), and the University of Leeds (36.3 stems per hectare [57]). This variation in tree density among university campuses highlights the diverse approaches to green infrastructure integration within urban academic environments, reflecting differences in planning, available space, and ecological priorities.
Estimates of key ecosystem services were derived from tree inventory data, allowing for comparisons with other university campuses. However, the gross volume of these services is highly dependent on canopy cover, which is influenced by the overall campus structure. Therefore, our comparisons focus on ecosystem service densities, as the Lobachevsky University campus is considered representative of the Upland part of Nizhny Novgorod. This approach enables a more accurate assessment of the per-unit-area ecological benefits provided by urban green infrastructure, offering valuable insights for urban planning and environmental management within similar geographical and climatic contexts [69].
The carbon stock density on the main campus of Lobachevsky University was 26.61 t C ha−1. This is comparable to carbon stock estimates reported for the Main Campus of the University of Georgia (36.7 t C ha−1) [51], KIWI University (24.4 t C ha−1) [50], and the University of Leeds (13.5 t C ha−1) [57]. However, it is lower than the estimates recorded for Bangalore University (54.8 t C ha−1) [49] and the Ege University Rectorship Garden, which has a carbon stock of 89.4 t C ha−1 [54].
Comparative analyses of carbon storage and sequestration rates across urban environments worldwide reveal significant variability. For instance, studies in London reported rates of 15 t C ha−1 [70], while domestic gardens in Leicester, UK, showed 31.6 t C ha−1 [2]. Similarly, Atlanta recorded 35.7 t ha−1, Boston 20.3 t ha−1, and Chicago 14.2 t ha−1 [71]. The relatively high carbon stock observed in the university campus vegetation can be attributed to the high density of its trees and shrubs. Specifically, the canopy carbon density at Lobachevsky University campus is 58.54 t C ha−1, an estimate comparable to the total carbon stored by urban trees across 28 cities in six U.S. states (76.9 t ha−1) [39] and the average carbon storage in Leipzig, Germany, which stands at 68.2 t C ha−1 of tree cover [72].
The annual gross carbon sequestration on the Lobachevsky University main campus amounts to 0.088 kg m−2, which is comparable to the Ege University Rectorship Garden [54] and the University of Georgia [51], and significantly higher than that of Chungnam National University [56]. This rate is also consistent with sequestration levels from temperate urban areas, including London at 0.05 kg m−2 [70], Chicago at 0.149 kg m−2, Boston at 0.168 kg m−2, New York at 0.124 kg m−2, and Philadelphia at 0.151 kg m−2 [39].
Elevated rates of carbon sequestration per hectare and enhanced carbon storage are attributed to increased tree density and a greater prevalence of mature, larger trees. The capacity of trees to store and sequester carbon is influenced by factors beyond mere stem count, including their physical characteristics such as biomass, with larger trees typically storing more carbon. Furthermore, trees in suboptimal condition exhibit reduced sequestration rates. The substantial carbon sequestration observed on the Lobachevsky University main campus is primarily due to the dominance of relatively young, fast-growing tree species that have not yet reached the stage where their growth rate significantly decelerates. This indicates a critical window for maximizing carbon benefits through proactive management, as ongoing growth contributes substantially to carbon accumulation rather than reaching a steady state [51].
The campus trees contribute to air purification by removing 9.35 g m−2 of pollutants annually. This gross dry deposition value aligns well with typical amounts for the USA and Europe. For example, the median pollution removal for US cities is 10.8 g/m2/yr [63], for London it is 10.04 g/m2/yr [70], and for Barcelona it is 9.3 g/m2/yr. However, the air pollution removal on the Lobachevsky University main campus is significantly higher than in Canadian cities, where the average value is 3.72 g/m2/yr [73]. While ozone showed the greatest concentration change, particulate matter experienced the most significant air quality improvement percentage, whereas carbon monoxide showing the least improvement. This pattern aligns with findings from similar studies in European and North American cities [45,63,73], which also reported maximal removal for O3, SO2, and PM10, and minimal removal for CO.
Campus vegetation offers not only regulating ecosystem services but also a range of other benefits. Specifically, the green infrastructure of campuses positively influences the psycho-emotional state of students, facilitating the restoration of concentration, reducing stress levels, and improving overall well-being in the context of daily life [74]. The effectiveness of campus green areas in reducing symptoms of depression among students has been demonstrated through comparisons of different types of campus spaces [75,76]. The presence of ample greenery, water, and aesthetically pleasing visual elements contributes to an improvement in students’ emotional state and a reduction in stress levels, which is essential for effective adaptation to modern urban environments [77].
The university campus also provides supporting ecosystem services, integrating academic buildings, scientific laboratories, and dormitories into natural environment. The natural component of the Lobachevsky University main campus is characterized by significant biological diversity, including 32 species of trees and shrubs, approximately 120 species of herbaceous plants, 25 bird species, 5 rodent species, and about 150 arthropod species. This rich biodiversity ensures the stability of ecosystems and the overall environment. The campus also serves as a valuable educational resource, with zoological and botanical excursions conducted for students to study systematics, taxonomy, ontogenesis, and the impact of negative urban environmental factors. These hands-on field research experiences are particularly significant for providing crucial training in legal environmental investigations. Furthermore, the natural component of the campus offers cultural ecosystem services, providing opportunities for recreation, enjoying nature, and maintaining physical and mental health, as exposure to greenery has been shown to improve mood, reduce stress, and support cognitive functions.
The initial comprehensive assessment of ecosystem services within the Russian Federation was conducted between 2012 and 2020, utilizing the TEEB-Russia project’s framework which relied on publicly available statistical and cartographic data [78,79]. Regression-correlation analysis was employed to discern relationships between ecosystem asset indicators and service provision at the regional level, a method deemed appropriate for such assessments. In 2021, an evaluation of ecosystem services in the 16 largest Russian cities was undertaken [58,80], employing a vegetation cover inventory derived from Landsat satellite imagery to generate normalized relative vegetation index rasters. This inventory, however, simplified green infrastructure into three categories: tree vegetation, non-tree vegetation, and agricultural land, consequently yielding approximate estimates of vegetation cover lacking species-specific and structural detail. The calculation of ecosystem services was subsequently based on this generalized vegetation cover and averaged values from US and Canadian cities with comparable populations and vegetation zones. This dependence on broad generalizations from international contexts underscores a significant limitation in the precision of early Russian urban ecosystem service assessments, emphasizing the critical need for locally derived, detailed field inventories.
This current study addresses this gap by presenting the first detailed, field-based assessment of ecosystem services provided by urban trees within a Russian university campus, offering a more robust and granular understanding of their contributions. This meticulous approach allows for a precise quantification of various ecosystem services directly from empirical data gathered within the specific urban context of the Lobachevsky University campus, thereby enhancing the reliability and applicability of the findings for urban planning and environmental management in Russia [81]. This pioneering research thereby establishes a foundational methodology for future, more widespread assessments across Russian urban green spaces, moving beyond generalized estimations to empirically grounded data.
Further efforts are needed to obtain a comprehensive inventory of vegetation across large Russian cities to fully estimate ecosystem services encompassing all land use types. However, even our current estimates, limited to the university campus, represent the first direct assessment of ecosystem services provided by trees in Russian cities, grounded in detailed field investigations. This work serves as a critical baseline, demonstrating the feasibility and value of high-resolution, empirical data for understanding urban forest contributions within a historically under-researched geographic context.
Despite the clear advantages of the methodology employed in our study, particularly concerning the high level of detail in the initial data and the reliability of the resulting ecosystem service assessments, several limitations persist. The primary limitation lies in the considerable investment of time, labor, and expertise required for conducting a valid inventory. The meticulous collection of field data by trained arborists or volunteers can be financially prohibitive for municipalities operating with constrained budgets. Furthermore, extending this inventory-based approach to an entire city inevitably presents plot-based extrapolation challenges; an insufficiently dense or poorly distributed sampling network risks overlooking significant local variations within the urban forest. Another constraint stems from the i-Tree Eco toolkit’s exclusive focus on regulating ecosystem services. Consequently, alternative approaches are necessary for evaluating cultural, environmental, and supporting ecosystem services, all of which are crucial for sustainable urban development. Additionally, the precision of ecosystem service estimations within i-Tree Eco can be compromised by prolonged climatic variations, disturbances, and inaccuracies in measuring tree size and species-specific traits, such as dbh, tree height and canopy cover [82]. Moreover, while i-Tree Eco is a robust analytical instrument, its original design for US case studies mandates meticulous adaptation of climate regions and species databases for accurate application in non-US contexts, such as Russia.
Nevertheless, the detailed and reliable insights generated by this approach are precisely what is needed to address critical gaps in urban green infrastructure management, especially within the Russian context. Recent sector legislation has designated Russian municipalities as the primary custodians of urban greenery. Yet, these municipalities often grapple with insufficient funding, limited staff, and the unique challenges of managing historic, densely built-up urban centers, where planning and executing effective green interventions is exceptionally difficult. Consequently, local administrators urgently require practical, transparent decision-making tools to evaluate and compare design alternatives for their green infrastructure.
This study addresses this need by applying an established methodology to quantify the ecosystem services provided by urban trees on the Lobachevsky University campus in Nizhny Novgorod. The choice of a university campus as a case study is strategic; it serves as a controlled, manageable model that mirrors the complexities of the wider city while functioning as a demonstrative site for innovation. While this research does not develop a new evaluation tool, its primary contribution lies in translating quantitative results into actionable intelligence for planners and policymakers. The findings are designed to actively help in making practical choices by:
  • Informing strategies for tree maintenance and renewal, by identifying high-performing zones and specimens that are critical to preserving ecosystem service benefits.
  • Guiding future species selection to maximize specific ecosystem services (e.g., carbon sequestration, air purification, shading) based on comparative data.
  • Supporting the integration of green infrastructure into broader urban development plans by providing a replicable framework and tangible evidence of the economic and well-being returns on investment.
By delivering clear and transparent estimates, this work provides a replicable framework for more competent urban forestry management. Ultimately, this study aims to bolster the awareness among decision-makers that investing in and effectively managing urban forests yields tangible well-being and economic benefits, on par with investments in other productive sectors [83].

5. Conclusions

This study provides a quantitative assessment of ecosystem services within the National Research Lobachevsky State University of Nizhny Novgorod Campus. By calculating and mapping these services through a detailed field-inventory-based approach, our research offers a robust framework for informed urban green space management, demonstrating the campus’s significant contributions to carbon storage and sequestration, air purification, and runoff retention. This work underscores the critical role of university campuses as vital green infrastructure nodes, highlighting their capacity for long-term carbon sequestration and the importance of fostering a deeper understanding of urban green areas’ multifaceted roles in densely built-up environments. Quantifying ecosystem services, as demonstrated here, is a critical step for unlocking their full potential and guiding sustainable management decisions at both university and municipal levels.
The findings of this study directly contribute to the global effort of achieving the UN’s Sustainable Development Goals, extending beyond the local context. Specifically, this research provides a practical pathway towards:
  • SDG 11 (Sustainable Cities and Communities): Through documented ecosystem services like air purification and runoff retention, fundamental for enhancing urban resilience and making cities more inclusive, safe, and sustainable.
  • SDG 13 (Climate Action): Via the significant role of the campus’s urban forest in carbon storage and sequestration, representing a tangible NBS for climate change mitigation.
  • SDG 3 (Good Health and Well-being): By improving air quality and providing aesthetic and recreational spaces, the campus’s green infrastructure directly contributes to ensuring healthy lives and promoting well-being.
Thus, the methodological approach and evidence presented in this study offer a replicable model for aligning local urban greening strategies with the overarching targets of the UN Agenda 2030. An integrated, systematic approach is required to ensure the optimal provision of these services, amplifying the environmental, aesthetic, recreational, and economic benefits for urban residents [30,84].

Supplementary Materials

The following supporting information can be downloaded at: https://www.mdpi.com/article/10.3390/land14102073/s1, Inventory: tree-level vegetation inventory of the Lobachevsky State University of Nizhny Novgorod Campus.

Author Contributions

Conceptualization, B.N.Y. and V.V.O.; methodology, B.N.Y. and N.I.Z.; software, B.N.Y. and T.A.K.; validation, A.D.B., T.A.K. and I.N.M.; formal analysis, A.D.B. and T.A.K.; investigation, N.I.Z., A.D.B., T.A.K. and I.N.M.; resources, B.N.Y. and V.V.O.; data curation, N.I.Z., A.D.B., T.A.K. and I.N.M.; writing—original draft preparation, I.M.K.; writing—review and editing, B.N.Y., N.I.Z. and I.M.K.; visualization, B.N.Y. and T.A.K.; supervision, B.N.Y. and V.V.O.; project administration, N.I.Z. and I.M.K.; funding acquisition, B.N.Y. All authors have read and agreed to the published version of the manuscript.

Funding

This study was supported by the Ministry of Science and Higher Education of the Russian Federation (project No. FSWR-2023-0032).

Data Availability Statement

The original contributions presented in this study are included in the Supplementary Material. Further inquiries can be directed to the corresponding author.

Acknowledgments

The authors would like to acknowledge the Lobachevsky University field crew for implementing the field inventory. During the preparation of this manuscript, the authors used Jenni.ai service (https://jenni.ai/, accessed 5 October 2025) for the purposes of English editing and improving text fluency. The authors have reviewed and edited the output and take full responsibility for the content of this publication.

Conflicts of Interest

The authors declare no conflicts of interest.

Appendix A

Figure A1. Overview of the National Research Lobachevsky State University of Nizhny Novgorod Campus. This set of photographs illustrates the spatial context and the diverse character of the urban green infrastructure within the campus.
Land 14 02073 g0a1

References

  1. Seto, K.C.; Güneralp, B.; Hutyra, L.R. Global Forecasts of Urban Expansion to 2030 and Direct Impacts on Biodiversity and Carbon Pools. Proc. Natl. Acad. Sci. USA 2012, 109, 16083. [Google Scholar] [CrossRef]
  2. Davies, Z.G.; Edmondson, J.L.; Heinemeyer, A.; Leake, J.R.; Gaston, K.J. Mapping an Urban Ecosystem Service: Quantifying Above-ground Carbon Storage at a City-wide Scale. J. Appl. Ecol. 2011, 48, 1125. [Google Scholar] [CrossRef]
  3. Raciti, S.M.; Hutyra, L.R.; Rao, P.; Finzi, A.C. Inconsistent Definitions of “Urban” Result in Different Conclusions about the Size of Urban Carbon and Nitrogen Stocks. Ecol. Appl. 2012, 22, 1015. [Google Scholar] [CrossRef] [PubMed]
  4. Rao, P.; Hutyra, L.R.; Raciti, S.M.; Finzi, A.C. Field and Remotely Sensed Measures of Soil and Vegetation Carbon and Nitrogen across an Urbanization Gradient in the Boston Metropolitan Area. Urban Ecosyst. 2013, 16, 593. [Google Scholar] [CrossRef]
  5. Gurjar, B.R.; Butler, T.M.; Lawrence, M.G.; Lelieveld, J. Evaluation of Emissions and Air Quality in Megacities. Atmos. Environ. 2008, 42, 1593. [Google Scholar] [CrossRef]
  6. Dasgupta, S.; Gosain, A.K.; Rao, S.; Roy, S.; Sarraf, M. A Megacity in a Changing Climate: The Case of Kolkata. Clim. Change 2013, 116, 747. [Google Scholar] [CrossRef]
  7. Mourshed, M. The Impact of the Projected Changes in Temperature on Heating and Cooling Requirements in Buildings in Dhaka, Bangladesh. Appl. Energy 2011, 88, 3737. [Google Scholar] [CrossRef]
  8. Cameron, R.W.F.; Blanuša, T. Green Infrastructure and Ecosystem Services—Is the Devil in the Detail? Ann. Bot. 2016, 118, 377. [Google Scholar] [CrossRef]
  9. Elmqvist, T.; Setälä, H.; Handel, S.; Van Der Ploeg, S.; Aronson, J.; Blignaut, J.; Gómez-Baggethun, E.; Nowak, D.; Kronenberg, J.; De Groot, R. Benefits of Restoring Ecosystem Services in Urban Areas. Curr. Opin. Environ. Sustain. 2015, 14, 101. [Google Scholar] [CrossRef]
  10. McDonald, R.; Marcotullio, P. Global Effects of Urbanization on Ecosystem Services; Oxford University Press: Oxford, UK, 2011; p. 193. ISBN 978-0-19-956356-2. [Google Scholar]
  11. Alamgir, M.; Turton, S.M.; Macgregor, C.J.; Pert, P.L. Assessing Regulating and Provisioning Ecosystem Services in a Contrasting Tropical Forest Landscape. Ecol. Indic. 2016, 64, 319. [Google Scholar] [CrossRef]
  12. Bagdon, B.A.; Huang, C.-H.; Dewhurst, S. Managing for Ecosystem Services in Northern Arizona Ponderosa Pine Forests Using a Novel Simulation-to-Optimization Methodology. Ecol. Model. 2016, 324, 11. [Google Scholar] [CrossRef]
  13. Camps-Calvet, M.; Langemeyer, J.; Calvet-Mir, L.; Gómez-Baggethun, E. Ecosystem Services Provided by Urban Gardens in Barcelona, Spain: Insights for Policy and Planning. Environ. Sci. Policy 2016, 62, 14. [Google Scholar] [CrossRef]
  14. Wang, B.; Liu, Z.; Mei, Y.; Li, W. Assessment of Ecosystem Service Quality and Its Correlation with Landscape Patterns in Haidian District, Beijing. Int. J. Environ. Res. Public Health 2019, 16, 1248. [Google Scholar] [CrossRef]
  15. Nowak, D.J. Atmospheric Carbon Dioxide Reduction by Chicago’s Urban Forest; U.S. Department of Agriculture, Forest Service, Northeastern Forest Experiment Station: Radnor, PA, USA, 1994; p. 83. [Google Scholar]
  16. Ferrini, F.; Fini, A.; Mori, J.; Gori, A. Role of Vegetation as a Mitigating Factor in the Urban Context. Sustainability 2020, 12, 4247. [Google Scholar] [CrossRef]
  17. Lin, B.B.; Egerer, M.H.; Liere, H.; Jha, S.; Bichier, P.; Philpott, S.M. Local- and Landscape-Scale Land Cover Affects Microclimate and Water Use in Urban Gardens. Sci. Total Environ. 2018, 610, 570. [Google Scholar] [CrossRef]
  18. Pena Acosta, M.; Vahdatikhaki, F.; Santos, J.; Hammad, A.; Dorée, A.G. How to Bring UHI to the Urban Planning Table? A Data-Driven Modeling Approach. Sustain. Cities Soc. 2021, 71, 102948. [Google Scholar] [CrossRef]
  19. Coutts, A.M.; Tapper, N.J.; Beringer, J.; Loughnan, M.; Demuzere, M. Watering Our Cities: The Capacity for Water Sensitive Urban Design to Support Urban Cooling and Improve Human Thermal Comfort in the Australian Context. Prog. Phys. Geogr. Earth Environ. 2013, 37, 2. [Google Scholar] [CrossRef]
  20. Inkiläinen, E.N.M.; McHale, M.R.; Blank, G.B.; James, A.L.; Nikinmaa, E. The Role of the Residential Urban Forest in Regulating Throughfall: A Case Study in Raleigh, North Carolina, USA. Landsc. Urban Plan. 2013, 119, 91. [Google Scholar] [CrossRef]
  21. Baró, F.; Chaparro, L.; Gómez-Baggethun, E.; Langemeyer, J.; Nowak, D.J.; Terradas, J. Contribution of Ecosystem Services to Air Quality and Climate Change Mitigation Policies: The Case of Urban Forests in Barcelona, Spain. AMBIO 2014, 43, 466. [Google Scholar] [CrossRef]
  22. Jim, C.Y.; Chen, W.Y. Assessing the Ecosystem Service of Air Pollutant Removal by Urban Trees in Guangzhou (China). J. Environ. Manag. 2008, 88, 665. [Google Scholar] [CrossRef]
  23. Schäffler, A.; Swilling, M. Valuing Green Infrastructure in an Urban Environment under Pressure—The Johannesburg Case. Ecol. Econ. 2013, 86, 246. [Google Scholar] [CrossRef]
  24. Andersson, E.; McPhearson, T.; Kremer, P.; Gomez-Baggethun, E.; Haase, D.; Tuvendal, M.; Wurster, D. Scale and Context Dependence of Ecosystem Service Providing Units. Ecosyst. Serv. 2015, 12, 157. [Google Scholar] [CrossRef]
  25. Chiesura, A. The Role of Urban Parks for the Sustainable City. Landsc. Urban Plan. 2004, 68, 129. [Google Scholar] [CrossRef]
  26. Russo, A.; Cirella, G.T. Urban Ecosystem Services: Current Knowledge, Gaps, and Future Research. Land 2021, 10, 811. [Google Scholar] [CrossRef]
  27. Mitsch, W.J.; Jørgensen, S.E. Ecological Engineering: A Field Whose Time Has Come. Ecol. Eng. 2003, 20, 363. [Google Scholar] [CrossRef]
  28. Bauduceau, N.; Berry, P.; Cecchi, C.; Elmqvist, T.; Fernández, M.D.; Hartig, T.; Krull, W.; Mayerhofer, E.; Sandra, N.O.; Noring, L.; et al. Towards an EU Research and Innovation Policy Agenda for Nature-Based Solutions & Re-Naturing Cities: Final Report of the Horizon 2020 Expert Group on “Nature-Based Solutions and Re-Naturing Cities”; Technical University of Denmark: Kongens Lyngby, Denmark, 2015; p. 76. [Google Scholar]
  29. UNEP. Sustainable Development Goals and the 2030 Agenda: Why Environmental Sustainability and Gender Equality Are So Important to Reducing Poverty and Inequalities; UNEP Perspectives Issue 2015; UNEP: Nairobi, Kenya, 2015. [Google Scholar]
  30. Mersal, A. Sustainable Urban Futures: Environmental Planning for Sustainable Urban Development. Procedia Environ. Sci. 2016, 34, 49. [Google Scholar] [CrossRef]
  31. Russo, A.; Cirella, G.T. Urban Ecosystem Services: New Findings for Landscape Architects, Urban Planners, and Policymakers. Land 2021, 10, 88. [Google Scholar] [CrossRef]
  32. Escobedo, F.J.; Kroeger, T.; Wagner, J.E. Urban Forests and Pollution Mitigation: Analyzing Ecosystem Services and Disservices. Environ. Pollut. 2011, 159, 2078. [Google Scholar] [CrossRef]
  33. Nowak, D.; Crane, D.; Stevens, J.; Hoehn, R.; Walton, J.; Bond, J. A Ground-Based Method of Assessing Urban Forest Structure and Ecosystem Services. Arboric. Urban For. 2008, 34, 347. [Google Scholar] [CrossRef]
  34. Ziter, C.D.; Pedersen, E.J.; Kucharik, C.J.; Turner, M.G. Scale-Dependent Interactions between Tree Canopy Cover and Impervious Surfaces Reduce Daytime Urban Heat during Summer. Proc. Natl. Acad. Sci. USA 2019, 116, 7575. [Google Scholar] [CrossRef] [PubMed]
  35. Sharma, G.; Morgenroth, J.; Richards, D.R.; Ye, N. Advancing Urban Forest and Ecosystem Service Assessment through the Integration of Remote Sensing and I-Tree Eco: A Systematic Review. Urban For. Urban Green. 2025, 104, 128659. [Google Scholar] [CrossRef]
  36. Lin, J.; Kroll, C.N.; Nowak, D.J.; Greenfield, E.J. A Review of Urban Forest Modeling: Implications for Management and Future Research. Urban For. Urban Green. 2019, 43, 126366. [Google Scholar] [CrossRef]
  37. Nowak, D.J. Understanding I-Tree: 2021 Summary of Programs and Methods; U.S. Department of Agriculture, Forest Service, Northern Research Station: Madison, WI, USA, 2021. [Google Scholar]
  38. Chen, Z.; Xu, B.; Gao, B. Assessing Visual Green Effects of Individual Urban Trees Using Airborne Lidar Data. Sci. Total Environ. 2015, 536, 232. [Google Scholar] [CrossRef] [PubMed]
  39. Nowak, D.J.; Greenfield, E.J.; Hoehn, R.E.; Lapoint, E. Carbon Storage and Sequestration by Trees in Urban and Community Areas of the United States. Environ. Pollut. 2013, 178, 229. [Google Scholar] [CrossRef] [PubMed]
  40. Buchel, S.; Frantzeskaki, N. Citizens’ Voice: A Case Study about Perceived Ecosystem Services by Urban Park Users in Rotterdam, the Netherlands. Ecosyst. Serv. 2015, 12, 169. [Google Scholar] [CrossRef]
  41. Langemeyer, J.; Baró, F.; Roebeling, P.; Gómez-Baggethun, E. Contrasting Values of Cultural Ecosystem Services in Urban Areas: The Case of Park Montjuïc in Barcelona. Ecosyst. Serv. 2015, 12, 178. [Google Scholar] [CrossRef]
  42. Breuste, J.H.; Artmann, M. Allotment Gardens Contribute to Urban Ecosystem Service: Case Study Salzburg, Austria. J. Urban Plan. Dev. 2015, 141, A5014005. [Google Scholar] [CrossRef]
  43. Derkzen, M.L.; Van Teeffelen, A.J.A.; Verburg, P.H. Quantifying Urban Ecosystem Services Based on High-resolution Data of Urban Green Space: An Assessment for Rotterdam, the Netherlands. J. Appl. Ecol. 2015, 52, 1020. [Google Scholar] [CrossRef]
  44. Kim, G.; Miller, P.A.; Nowak, D.J. Assessing Urban Vacant Land Ecosystem Services: Urban Vacant Land as Green Infrastructure in the City of Roanoke, Virginia. Urban For. Urban Green. 2015, 14, 519. [Google Scholar] [CrossRef]
  45. Selmi, W.; Weber, C.; Rivière, E.; Blond, N.; Mehdi, L.; Nowak, D. Air Pollution Removal by Trees in Public Green Spaces in Strasbourg City, France. Urban For. Urban Green. 2016, 17, 192. [Google Scholar] [CrossRef]
  46. Filho, W.L.; Özuyar, P.G.; Dinis, M.A.P.; Azul, A.M.; Alvarez, M.G.; da Silva Neiva, S.; Sálvia, A.L.; Borsari, B.; Nita, A.C.; Vasconcelos, C.R.P. Living Labs in the Context of the UN Sustainable Development Goals: State of the Art. Sustain. Sci. 2022, 18, 1163. [Google Scholar] [CrossRef]
  47. Villegas-Ch, W.; Palacios-Pacheco, X.; Luján-Mora, S. Application of a Smart City Model to a Traditional University Campus with a Big Data Architecture: A Sustainable Smart Campus. Sustainability 2019, 11, 2857. [Google Scholar] [CrossRef]
  48. Wang, D.; Xu, P.; An, B.-W.; Guo, Q. Urban Green Infrastructure: Bridging Biodiversity Conservation and Sustainable Urban Development through Adaptive Management Approach. Front. Ecol. Evol. 2024, 12, 1440477. [Google Scholar] [CrossRef]
  49. Nandini, N.; Kumar, K.; Tandon, S. Assessment of Carbon Sequestration in Trees of Jnanabharathi Campus-Bangalore University. Ecol. Environ. Conserv. 2009, 15, 503. [Google Scholar]
  50. De Villiers, C.; Chen, S.; Jin, C.; Zhu, Y. Carbon Sequestered in the Trees on a University Campus: A Case Study. Sustain. Account. Manag. Policy J. 2014, 5, 149. [Google Scholar] [CrossRef]
  51. Fox, W.; Dwivedi, P.; Lowe, I.; Welch, S.; Fuller, M. Estimating Carbon Stock of Live Trees Located on the Main Campus of the University of Georgia. J. For. 2020, 118, 457. [Google Scholar] [CrossRef]
  52. Sharma, R.; Pradhan, L.; Kumari, M.; Bhattacharya, P. Assessment of Carbon Sequestration Potential of Tree Species in Amity University Campus Noida. Environ. Sci. Proc. 2021, 3, 52. [Google Scholar] [CrossRef]
  53. Vishnu, P.R.; Patil, S.S. Sequestration and Storage of Carbon by Trees in and around University Campus of Aurangabad City in Maharashtra, India. Int. Res. J. Eng. Technol. 2017, 4, 598. [Google Scholar]
  54. Hepcan, C.C.; Hepcan, S. Assessing Regulating Ecosystem Services Provided by the Ege University Rectorship Garden. Urban For. Urban Green. 2018, 34, 10. [Google Scholar] [CrossRef]
  55. Martin, N.; Chappelka, A.; Somers, G.; Loewenstein, E.; Keever, G. Evaluation of Sampling Protocol for I-Tree Eco: A Case Study in Predicting Ecosystem Services at Auburn University. Arboric. Urban For. 2013, 39, 56–61. [Google Scholar] [CrossRef]
  56. Hintural, W.P.; Jeon, H.J.; Kim, S.C.; Go, S.-J.; Park, B.B. Quantifying Regulating Ecosystem Services of Urban Trees: A Case Study of a Green Space at Chungnam National University Using i-Tree Eco. Forests 2024, 15, 1446. [Google Scholar] [CrossRef]
  57. Gugan, A.; Walker, H.; Mooney, H.; Scott, C.; Birch, H.; Bliss, T.; Chowdhury, A.; Cooney, P.; Doick, K.; Robinson, S. University of Leeds: Enhancing the Benefits of Trees on Campus; United Bank of Carbon & Leeds Ecosystem, Atmosphere and Forest Centre, University of Leeds: Leeds, UK, 2019. [Google Scholar]
  58. Klimanova, O.; Illarionova, O.; Grunewald, K.; Bukvareva, E. Green Infrastructure, Urbanization, and Ecosystem Services: The Main Challenges for Russia’s Largest Cities. Land 2021, 10, 1292. [Google Scholar] [CrossRef]
  59. Henry, M.; Bombelli, A.; Trotta, C.; Alessandrini, A.; Birigazzi, L.; Sola, G.; Vieilledent, G.; Santenoise, P.; Longuetaud, F.; Valentini, R.; et al. GlobAllomeTree: International Platform for Tree Allometric Equations to Support Volume, Biomass and Carbon Assessment. Iforest—Biogeosci. For. 2013, 6, 326. [Google Scholar] [CrossRef]
  60. Cairns, M.A.; Brown, S.; Helmer, E.H.; Baumgardner, G.A. Root Biomass Allocation in the World’s Upland Forests. Oecologia 1997, 111, 1–11. [Google Scholar] [CrossRef]
  61. Chow, P.; Rolfe, G. Carbon and Hydrogen Contents of Short-Rotation Biomass of Five Hardwood Species. Wood Fiber Sci. 1989, 21, 30. [Google Scholar]
  62. Nowak, D.J.; Hirabayashi, S.; Bodine, A.; Greenfield, E. Tree and Forest Effects on Air Quality and Human Health in the United States. Environ. Pollut. 2014, 193, 119. [Google Scholar] [CrossRef]
  63. Nowak, D.J.; Crane, D.E.; Stevens, J.C. Air Pollution Removal by Urban Trees and Shrubs in the United States. Urban For. Urban Green. 2006, 4, 115. [Google Scholar] [CrossRef]
  64. Lovett, G.M. Atmospheric Deposition of Nutrients and Pollutants in North America: An Ecological Perspective. Ecol. Appl. 1994, 4, 630. [Google Scholar] [CrossRef]
  65. Baldocchi, D. A Multi-Layer Model for Estimating Sulfur Dioxide Deposition to a Deciduous Oak Forest Canopy. Atmos. Environ. 1967 1988, 22, 869. [Google Scholar] [CrossRef]
  66. Nowak, D.J. Estimating Leaf Area and Leaf Biomass of Open-Grown Deciduous Urban Trees. For. Sci. 1996, 42, 504. [Google Scholar] [CrossRef]
  67. Wang, J.; Endreny, T.A.; Nowak, D.J. Mechanistic Simulation of Tree Effects in an Urban Water Balance Model. JAWRA J. Am. Water Resour. Assoc. 2008, 44, 75. [Google Scholar] [CrossRef]
  68. Nowak, D.J.; Greenfield, E.J. Tree and Impervious Cover in the United States. Landsc. Urban Plan. 2012, 107, 21. [Google Scholar] [CrossRef]
  69. Strashok, O.; Бідолах, Д.І.; Ziemiańska, M. Ecosystem Benefits of Urban Woody Plants for Sustainable Green Space Planning: A Case Study from Wroclaw. Sci. Rep. 2025, 15, 10999. [Google Scholar] [CrossRef]
  70. Rogers, K.; Sacre, K.; Goodenough, J.; Doick, K. Valuing London’s Urban Forest; Treeconomics: London, UK, 2015. [Google Scholar]
  71. Nowak, D.J.; Crane, D.E. Carbon Storage and Sequestration by Urban Trees in the USA. Environ. Pollut. 2002, 116, 381. [Google Scholar] [CrossRef] [PubMed]
  72. Strohbach, M.W.; Haase, D. Above-Ground Carbon Storage by Urban Trees in Leipzig, Germany: Analysis of Patterns in a European City. Landsc. Urban Plan. 2012, 104, 95. [Google Scholar] [CrossRef]
  73. Nowak, D.J.; Hirabayashi, S.; Doyle, M.; McGovern, M.; Pasher, J. Air Pollution Removal by Urban Forests in Canada and Its Effect on Air Quality and Human Health. Urban For. Urban Green. 2018, 29, 40. [Google Scholar] [CrossRef]
  74. Guo, W.; Wen, H.; Liu, X. Research on the Psychologically Restorative Effects of Campus Common Spaces from the Perspective of Health. Front. Public Health 2023, 11, 1131180. [Google Scholar] [CrossRef]
  75. Gao, W.; Tang, B.M.; Liu, B. Effects of Landscape Characteristic Perception of Campus on College Students’ Mental Restoration. Behav. Sci. 2025, 15, 470. [Google Scholar] [CrossRef] [PubMed]
  76. Liu, H.; Wang, Y.; He, Q.; Wang, X.; Cui, C.; Gong, Y. Assessing the Restorative Effects of Campus Greeness on Student Depression: A Comparative Study across Three Distinct University Campus Type in Macau. BMC Public Health 2025, 25, 907. [Google Scholar] [CrossRef]
  77. Malekinezhad, F.; Courtney, P.; Lamit, H.; Vigani, M. Investigating the Mental Health Impacts of University Campus Green Space Through Perceived Sensory Dimensions and the Mediation Effects of Perceived Restorativeness on Restoration Experience. Front. Public Health 2020, 8, 578241. [Google Scholar] [CrossRef] [PubMed]
  78. Bukvareva, E.; Zamolodchikov, D. Ecosystem Services of Russia: Prototype National Report. Vol. 1. Terrestrial Ecosystems Services; BCC Press: Moscow, Russia, 2018. [Google Scholar]
  79. Bukvareva, E.; Sviridova, T. Ecosystem Services of Russia: Prototype National Report. Vol. 2. Biodiversity and Ecosystem Services; BCC Press: Moscow, Russia, 2020. [Google Scholar]
  80. Bukvareva, E.; Grunewald, K.; Klimanova, O.; Kolbovsky, E.; Shcherbakov, A.; Sviridova, T.; Zamolodchikov, D. TEEB-Russia: Towards National Ecosystem Accounting. Sustainability 2021, 13, 6678. [Google Scholar] [CrossRef]
  81. García-Pardo, K.A.; Moreno-Rangel, D.; Domínguez-Amarillo, S.; García-Chávez, J.R. Remote Sensing for the Assessment of Ecosystem Services Provided by Urban Vegetation: A Review of the Methods Applied. Urban For. Urban Green. 2022, 74, 127636. [Google Scholar] [CrossRef]
  82. Wei, S.; Cheng, S. An Artificial Intelligence Approach for Identifying Efficient Urban Forest Indicators on Ecosystem Service Assessment. Front. Environ. Sci. 2022, 10, 994389. [Google Scholar] [CrossRef]
  83. Endreny, T.A.; Santagata, R.; Perna, A.M.; Stefano, C.D.; Rallo, R.F.; Ulgiati, S. Implementing and Managing Urban Forests: A Much Needed Conservation Strategy to Increase Ecosystem Services and Urban Wellbeing. Ecol. Model. 2017, 360, 328. [Google Scholar] [CrossRef]
  84. Haq, S.M.A. Urban Green Spaces and an Integrative Approach to Sustainable Environment. J. Environ. Prot. 2011, 2, 601. [Google Scholar] [CrossRef]
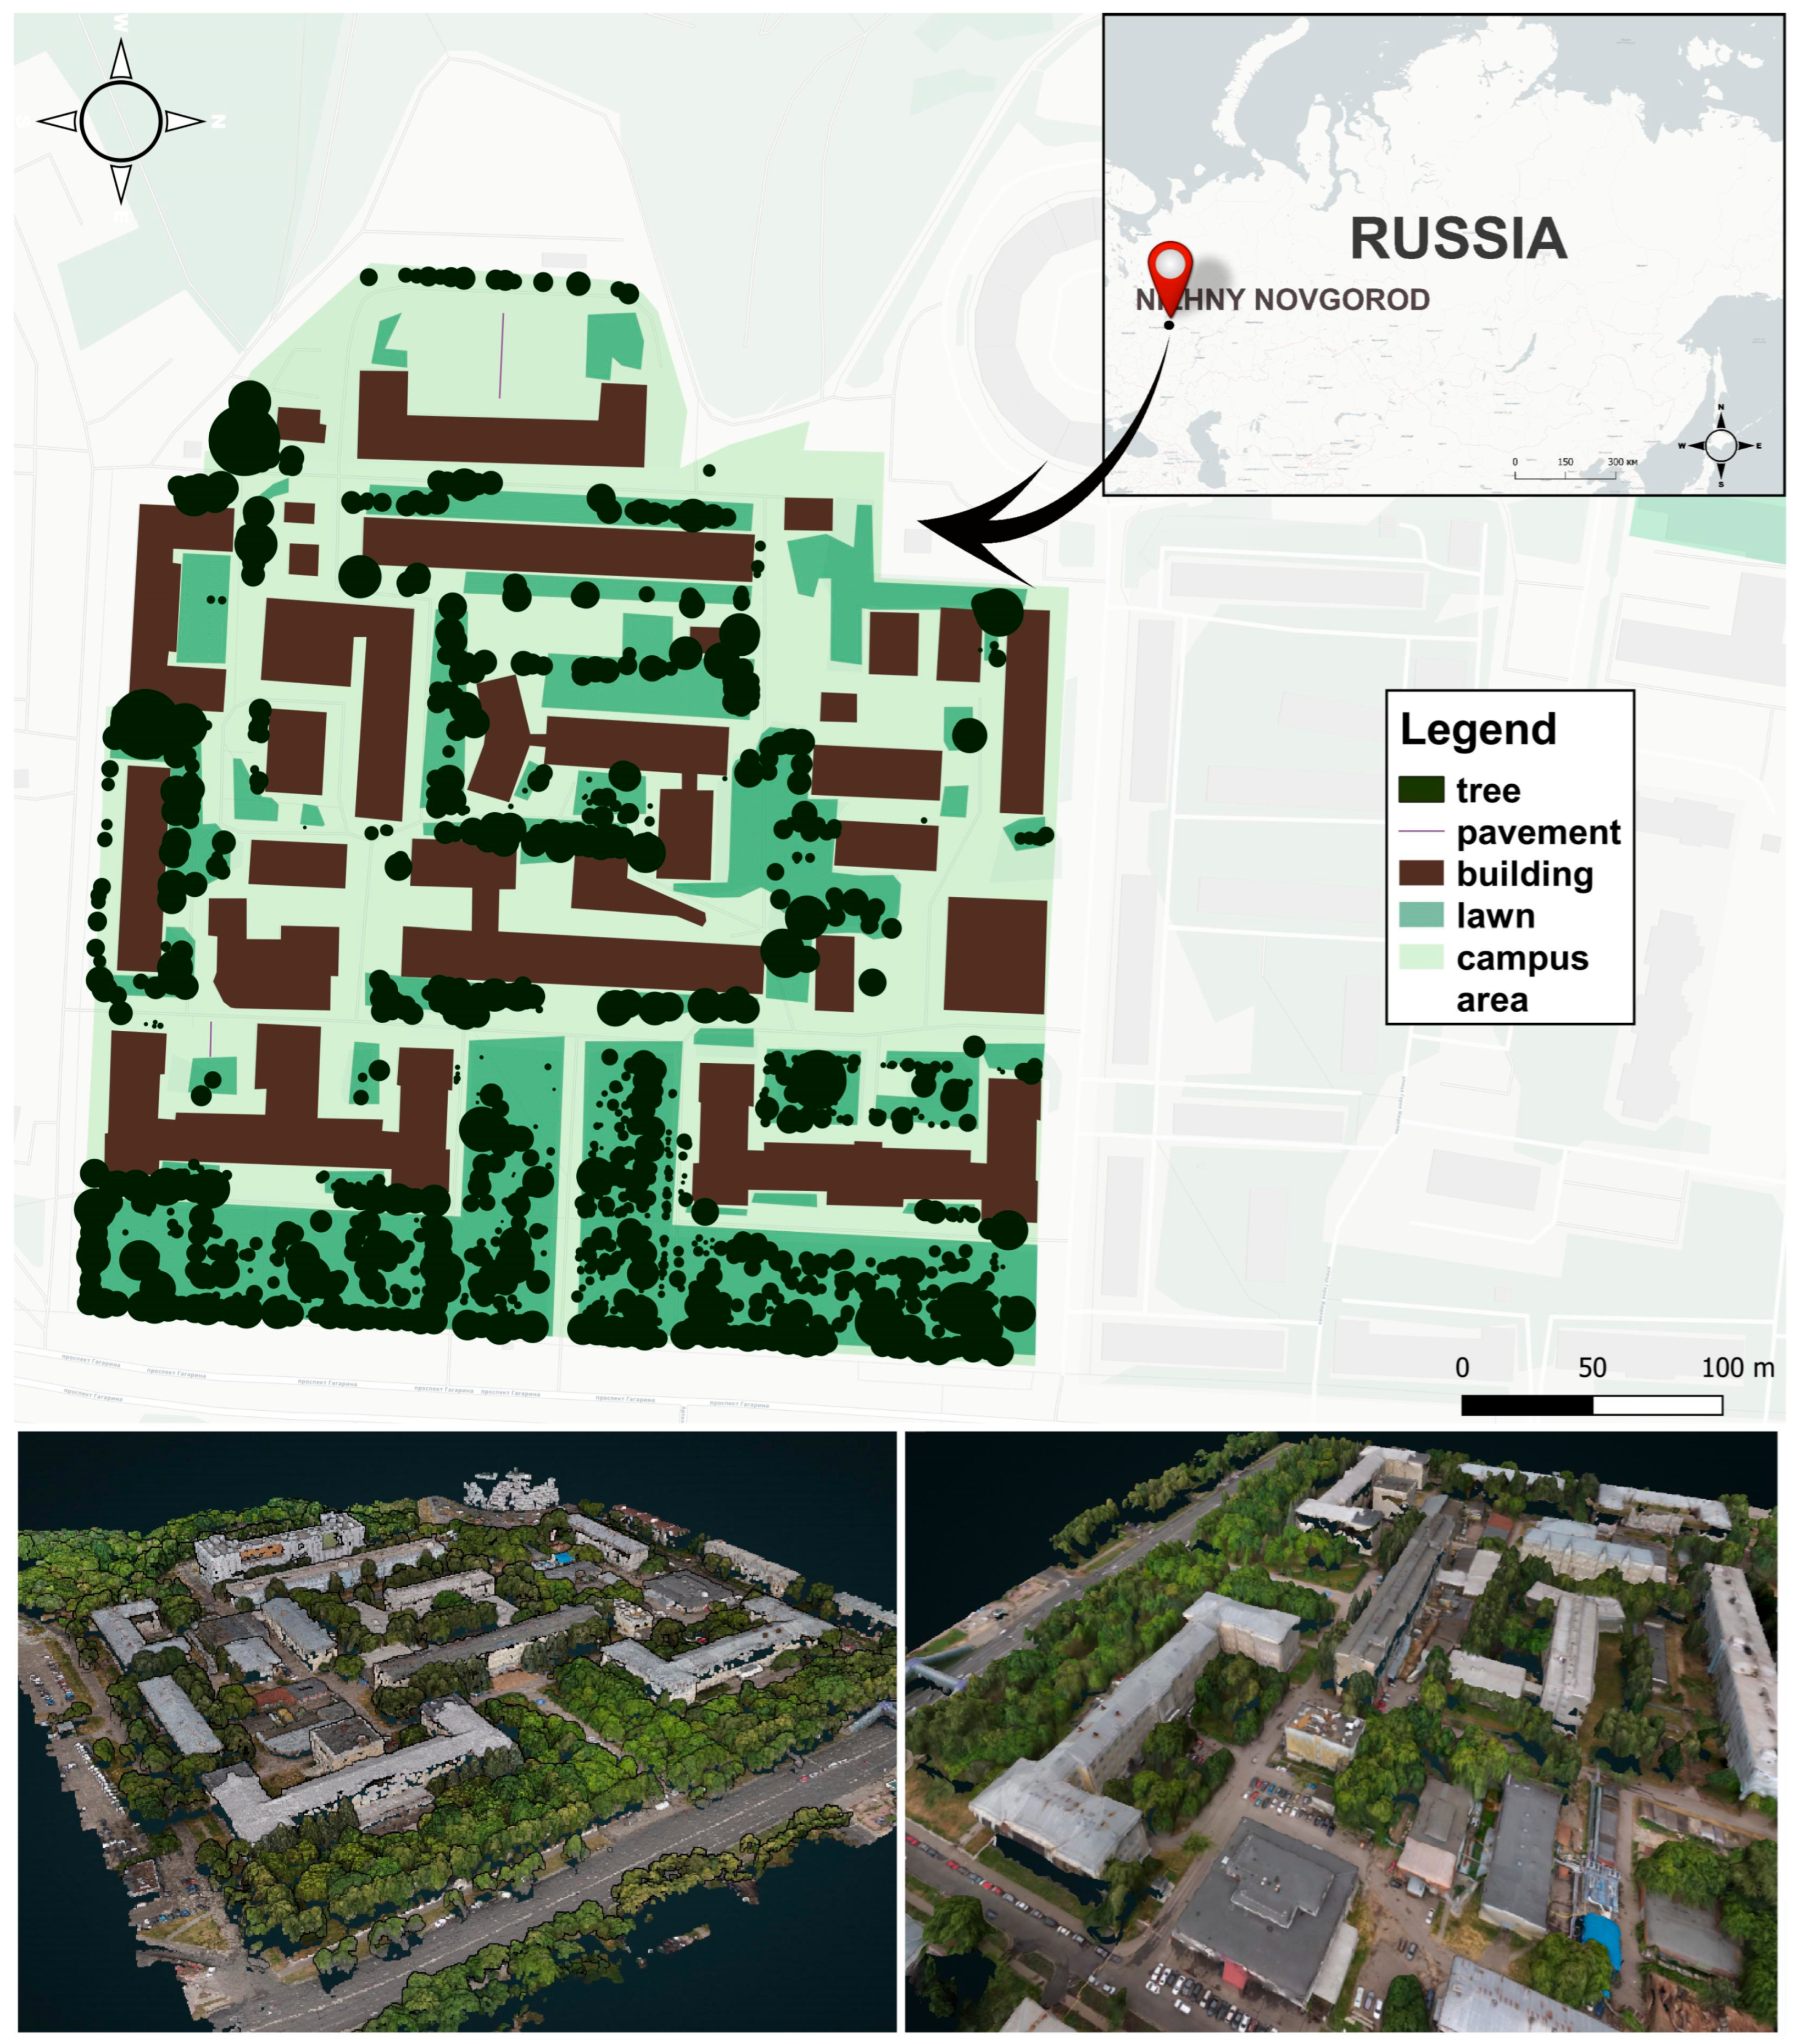
Figure 1. Main campus of Lobachevsky University and location of the study area.
Land 14 02073 g001
Figure 2. Abundance, average stem diameter at the breath height (dbh), average tree height and average crown width for tree species of Lobachevsky University main campus. Tree species are arranged according to total biomass.
Land 14 02073 g002
Figure 3. Distribution of stem diameter at the breath height (dbh), tree height and crown width of trees surveyed in the Lobachevsky University main campus.
Land 14 02073 g003
Figure 4. Carbon storage and sequestration, overall air pollution removal and runoff retention for tree species of Lobachevsky University main campus. Tree species are arranged according to total carbon storage.
Land 14 02073 g004
Figure 5. Air pollutants’ dry deposition, concentration change and air quality improvement by trees in the Lobachevsky University main campus.
Land 14 02073 g005
Table 1. Parameters of i-Tree Eco model.
ParameterTypeDescriptionCarbon Storage and SequestrationAir Pollution RemovalRunoff Retention
SpeciesCategoricalSpecies identity+ 1
Diameter at breast height, cmContinuousTree stem diameter at breast height (1.37 m)+
Total height, mContinuousHeight from the ground to the top of the tree+++
Crown base heigh, mContinuousHeight from the ground to the base of the live crown ++
Crown width, mContinuousThe width of the crown in two directions: north–south and east–west ++
Crown light exposureIntegerNumber of sides of the tree receiving sunlight from above (maximum of 5) ++
Percent crown missingPercentagePercent of the crown volume that is not occupied by branches and leaves+++
Crown diebackPercentagePercent of the crown volume that is composed of dead branches+++
1 Plus marks whether the parameter is used to estimate particular ecosystem services.
Table 2. Surface cover types of Lobachevsky University campus.
Cover ClassPoints% Cover ± SEArea (ha) ± SE
Grass/Herbaceous136.57 ± 1.760.85 ± 0.23
Impervious Buildings6934.85 ± 3.394.52 ± 0.44
Impervious Other73.54 ± 1.340.46 ± 0.17
Impervious Road115.56 ± 1.630.72 ± 0.21
Soil/Bare Ground84.04 ± 1.430.52 ± 0.19
Tree/Shrub9045.45 ± 3.545.90 ± 0.46
Water00.00 ± 0.000.00 ± 0.00
Total19810012.98
Disclaimer/Publisher’s Note: The statements, opinions and data contained in all publications are solely those of the individual author(s) and contributor(s) and not of MDPI and/or the editor(s). MDPI and/or the editor(s) disclaim responsibility for any injury to people or property resulting from any ideas, methods, instructions or products referred to in the content.