Article

Accessing Local Tacit Knowledge as a Means of Knowledge Co-Production for Effective Wildlife Corridor Planning in the Chignecto Isthmus, Canada

by
Jessica L. Needham
*,
Karen F. Beazley
and
Victoria P. Papuga
School for Resource and Environmental Studies, Dalhousie University, P.O. Box 15000, Halifax, NS B3H 4R2, Canada
*
Author to whom correspondence should be addressed.
Land 2020, 9(9), 332; https://doi.org/10.3390/land9090332
Submission received: 30 July 2020 / Revised: 5 September 2020 / Accepted: 15 September 2020 / Published: 20 September 2020

Abstract

:
Inclusive knowledge systems that engage local perspectives and social and natural sciences are difficult to generate and infuse into decision-making processes but are critical for conservation planning. This paper explores local tacit knowledge application to identify wildlife locations, movement patterns and heightened opportunities and barriers for connectivity conservation planning in a critical linkage area known as the Chignecto Isthmus in the eastern Canadian provinces of Nova Scotia and New Brunswick. Thirty-four local hunters, loggers, farmers and others with strong tacit knowledge of wildlife and the land participated in individual interviews and group workshops, both of which engaged participatory mapping. Individuals’ data were digitised, analysed and compiled into thematic series of maps, which were refined through participatory, consensus-based workshops. Locations of key populations and movement patterns for several species were delineated, predominantly for terrestrial mammals and migratory birds. When comparing local tacit-knowledge-based maps with those derived from formal-natural-science models, key differences and strong overlap were apparent. Local participants provided rich explanatory and complementary data. Their engagement in the process fostered knowledge transfer within the group and increased confidence in their experiential knowledge and its value for decision making. Benefits derived from our study for conservation planning in the region include enhanced spatial data on key locations of wildlife populations and movement pathways and local insights into wildlife changes over time. Identified contributing factors primarily relate to habitat degradation and fragmentation from human activities (i.e., land use and cover changes caused by roads and forestry practices), thereby supporting the need for conservation measures. The generated knowledge is important for consideration in local planning initiatives; it addresses gaps in existing formal-science data and validates or ground truths the outputs of existing computer-based models of wildlife habitat and movement pathways within the context of the complex social-ecological systems of the place and local people. Critically, awareness of the need for conservation and the value of the participants’ shared knowledge has been enhanced, with potential influence in fostering local engagement in wildlife conservation and other planning initiatives. Consistent with other studies, engagement of local people and their tacit knowledge was found to (i) provide important insights, knowledge translation, and dissemination to complement formal, natural science, (ii) help build a more inclusive knowledge system grounded in the people and place, and (iii) lend support to conservation action for connectivity planning and human-wildlife co-existence. More broadly, our methods demonstrate an effective approach for representing differences and consensus among participants’ spatial indications of wildlife and habitat as a means of co-producing knowledge in participatory mapping for conservation planning.

1. Introduction

Connected systems of effectively protected and conserved areas are considered critical to addressing both biodiversity and climate crises [1,2,3,4,5]. Ecological connectivity allows for genetic flow and is imperative to maintaining natural ecosystem processes [6,7]. Discontinuous and fragmented habitat can restrict the movement of wildlife and gene flow with adverse effects on populations and the persistence of species [8,9]. Connectivity facilitates genetic exchange among subpopulations [10,11,12,13] helping to maintain genetic diversity and metapopulation viability [14,15], which support species resilience to changes such as disease and climate [16,17,18,19]. In the face of climate change, ecological connectivity is considered crucial to species adaptation strategies [1,20]. As temperatures rise, connectivity can enhance the ability of species to move in response to range shifts by utilizing ecological corridors [19,20,21,22].
Given the importance of connectivity, and on-going threats to it, conservation measures are warranted to maintain and restore key ecological corridors [2,5,23]. With competing demands on a limited land base, however, any plans for additional protected or conserved areas need to be grounded in rigorous evidence and supported by local people [24,25,26,27]. Conservation issues are multi-faceted and involve complex social and natural systems that require both the natural and social sciences to solve [28]. For effective conservation decision-making processes to occur, there must be a mobilization of diverse forms of knowledge and ways of knowing. Knowledge systems that combine social and natural sciences, including local perspectives, are often difficult to generate and mobilize [29,30,31,32,33]. Yet, the importance of local and inclusive knowledge in conservation planning is increasingly recognized [34,35,36].
This paper accesses and generates local tacit knowledge of wildlife locations, movement patterns and landscape features that represent opportunities and barriers for connectivity conservation planning. The study area is the Chignecto Isthmus, a primarily rural region that serves a critical landscape linkage function in the eastern Canadian provinces of Nova Scotia (NS) and New Brunswick (NB). While the local findings and outcomes are important in their own right, the work contributes to the growing body of conservation planning literature that demonstrates the value and utility of local tacit knowledge as complementary, accurate information for decision making in diverse contexts. The generation of local experiential knowledge in study regions where formal-natural-science data and resources are sparse may represent a particularly important source of relevant data to address data gaps, validate or ground truth modeling studies, and weave in important social and ecological knowledge particular to the place and people. Even in areas where formal-science data are available, the engagement of local people and their tacit knowledge is important to opening up research to different ways of knowing, breaking down western-scientific notions of science and whose information counts. At the same time, inclusion in the research process may increase awareness and potentially mobilize locally influential participants to engage in associated planning and management initiatives. In our case, the research process may foster consideration of wildlife and key wildlife movement pathways in government efforts to identify engineering solutions to protect infrastructure from sea-level rise and engagement in on-going collaborative wildlife conservation initiatives in the Chignecto Isthmus.
The Chignecto Isthmus is a narrow strip of land (currently ~25 km in width, ~19 km as dry land) that connects NS and southeastern NB to the rest of mainland North America. It is threatened by sea-level rise [37,38,39], storm surges and flooding [40], along with increasing human developments such as roads, railways, and energy and communication infrastructure [41,42]. Effective mechanisms to conserve wildlife movement patterns are critical to biodiversity conservation and climate resilience and adaptation for species in this region. Although previous conservation planning studies have identified the region as of critical importance to species at risk and broader ecological connectivity [43,44,45] there have been relatively few empirical and spatial analyses. Most assessments of wildlife habitat and connectivity have been based on computer-based models [46,47,48], often at larger provincial and eco-regional scales [43,44,45]. In their 2005 study, Macdonald & Clowater noted that scientific knowledge of local species distribution in the region is lacking, making it difficult to assess habitat connectivity [46]. This situation remains at present. Wildlife monitoring and management by provincial government agencies is not coordinated across NS and NB and the empirical wildlife data that do exist remain provincially specific and not readily accessible or compatible for application across the Chignecto Isthmus region [46]. Recent predictive modelling by the Nature Conservancy of Canada (NCC) has identified high-probability wildlife movement pathways between protected areas in the region, with the recognized need for model verification and more detailed assessment of identified ‘pinch points’ to assist in future land management and conservation in the region [47,48]. Some model validation has occurred through roadside surveys of wildlife roadkill [49,50]. Capacity for wildlife research is limited in the area, with a lack of financial and other resources for field studies across the entire region.
To date, regional efforts to mobilize knowledge have largely focused on natural science and nature conservation, rather than on local tacit experience and perceptions. Yet, local forms of knowledge and ways of knowing are as important as those generated through formal natural sciences and models. It is likely that there is a strong base of knowledge of the land and wildlife in the region, given long-standing traditions, livelihoods, and pastimes associated with living off the land, seasonal hunting, trapping, and fishing in the area, and other natural resource uses. Indigenous peoples—the Mi’kmaq—have lived here, in their ancestral and unceded territory—Mi’kma’ki, for 15,000 years and Euro-American settlements began in the 1600s.
Realizing that human factors have been largely neglected in conservation science [51,52,53,54,55,56], our work aims to enhance the generation and use of local tacit knowledge for connectivity-conservation planning and broader norms of human-wildlife co-existence in the Chignecto Isthmus. More specifically, our study seeks to address data gaps and limitations by engaging in participatory research with local knowledgeable people as a means of garnering important insights on wildlife habitat locations and movement patterns that are likely not adequately represented in the existing empirical and spatial data. At the same time, we hope to enhance the participants’ support and engagement in conservation planning initiatives. In doing so, we aim to contribute to a more inclusive knowledge system and capacity base for potential infusion of local knowledge into conservation and other land planning initiatives in the region. Beyond the study area, our research contributes to the growing body of literature related to conservation planning, particularly for wildlife connectivity and the use of public participatory geographic information systems (PPGIS).

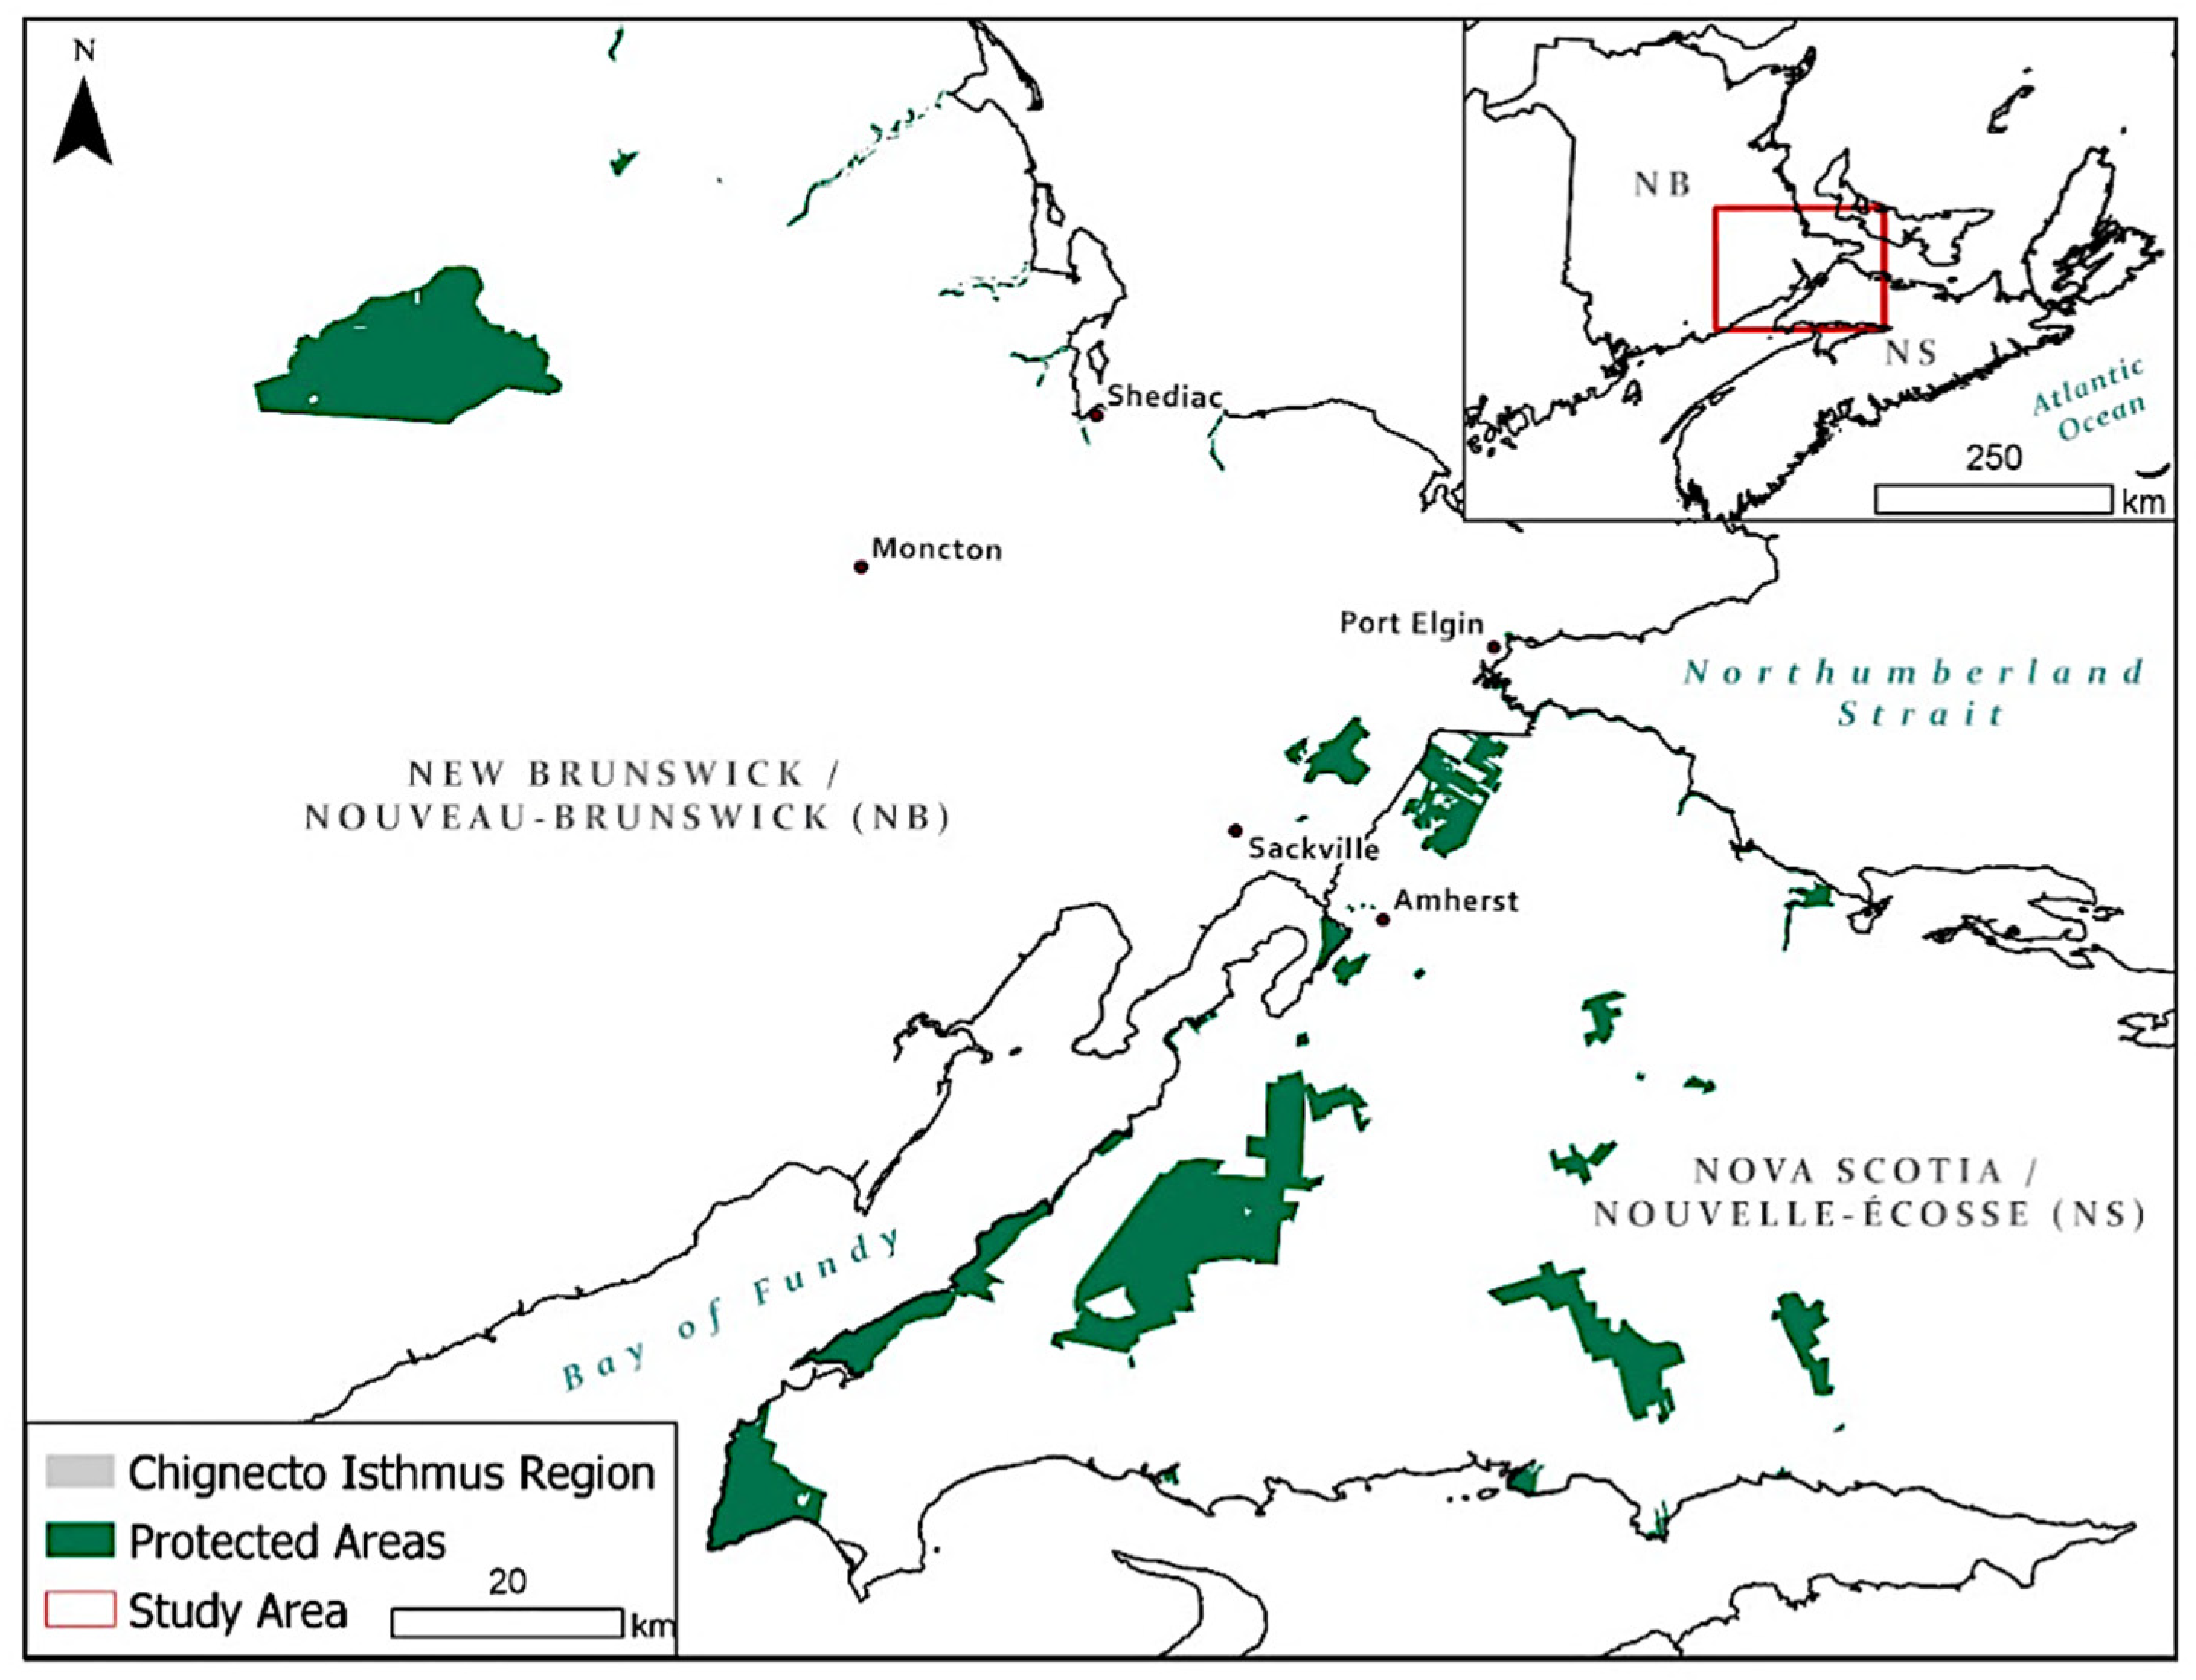
1.1. The Chignecto Isthmus in Context

The Chignecto Isthmus is a unique study region as it plays a critical role in landscape connectivity [43,44,45,46] (Figure 1). Recognized nationally and internationally as a high priority corridor, both for wildlife movements and linear human infrastructure such as roads, railways and energy pipelines, this region is key to maintaining connectivity between NS, southeastern NB and continental North America [48,57,58]. Its ecological importance is recognized through designation as one of Canada’s 15 Community-Nominated Priority Places1 [59]. Enhanced local awareness of its role in species’ population persistence has been raised through NCC’s ‘Moose Sex’ project [60,61]. Several challenges emerge, however, in understanding, maintaining, and restoring connectivity for wildlife and other ecological processes through this narrow region, particularly in the context of complex networks of roads and other human infrastructure. Bounded by the Northumberland Strait and the Bay of Fundy, the Isthmus is fragmented by seven two-lane roads that transect the region [46,50] and the Trans-Canada Highway and Canadian National Railway that transverse the region [42,62].
Sea-level rise [38,39], storm surges, and flooding [40,64] threaten terrestrial connectivity across the Isthmus, compounded by habitat loss and fragmentation [41,42]. Drivers include urban and rural development; transportation, energy and communications infrastructure; forestry and agricultural activities; and climate change [46,58,65]. At times, historically and during the Saxby Gale in 1869 [66,67], the Isthmus has been inundated with waters from the Bay of Fundy [37,68]. Storm surges funnel up the Bay of Fundy—a dynamic marine system with the highest recorded tides in the world (16.3 m)—culminating in the Chignecto Bay [69,70,71]. The elevation of the entire region is less than 90 m above sea level and is dominated in the southern region by low-lying salt marshes, wetlands, and bogs [46]. Beginning with French Acadian settlement in the late 1600s, large areas of salt marsh were transformed into dykelands for agricultural use [69,72]. The northern portion of the region is at higher elevation and relatively better drained, supporting mixed forests [46]. Higher elevations also occur towards the Northumberland Strait, rated by Canada’s Climate Change Impacts and Adaptation Program as of ‘medium’ sensitivity to sea-level rise compared to areas of ‘high’ sensitivity in the Isthmus’ southern portion [58].
Projected sea-level rise2, extreme weather events and storm surges threaten to breach the dykes, flooding parts of the Isthmus including the towns of Sackville, NB and Amherst, NS [38,39,40,41,73]. Over the past two centuries, major storm events have breached the dykes and caused extensive flooding around the perimeter of the Bay of Fundy [73]. Flooding threatens the Trans-Canada Highway and the Canadian National Railway, which move an estimated 50 million CAD per day in trade [58], potentially causing detrimental economic impacts [74]. As climate change adaptations become necessary, human infrastructural demands could put increased adverse pressures on wildlife habitat across a narrow five-kilometer-wide strip of higher elevation land at the NS-NB border [48]. Further fragmentation of habitat would restrict the movement of wildlife, with negative consequences for the persistence of populations of wide-ranging, sensitive and vulnerable species [8]. Alternatively, carefully planned adaptation measures could potentially provide opportunities to mitigate barriers and pinch points to wildlife movements. Conserving connectivity would facilitate geneflow between subpopulations of species, helping to maintain genetic diversity and species resilience in response to climate and other changes [8].
NCC’s recent predictive modelling [48] of high-probability wildlife movement pathways in the region may serve to identify priority areas for conserving connectivity. They modelled habitat suitability and least-cost paths for 15 terrestrial species selected to capture a range of territory sizes and habitat requirements3. Their analyses identified routes predicted to require the least energetic cost, providing the lowest risk to mortality, thereby minimizing risks to movements among habitat patches between five protected areas in NS and NB. The predictive modelling of potential corridors and pinch points has provided key information for future land management and conservation in the region [48]. Subsequent roadside surveys and roadkill hotspot analyses have helped to validate some of the model outputs [49,50]. Yet, further validation and consideration of areas outside of modeled and field-surveyed sites are warranted.
At the same time, there are increasing pressures to protect human infrastructure in the Chignecto Isthmus from impacts of climate change. In January 2020, the Province of NB sought professional assistance to explore climate mitigation solutions for the transportation corridor [75]. An engineering firm is leading, with the Provinces of NB and NS and the federal government, a 700,000 CAD feasibility study, with the aim to design engineering adaptations that are resilient to climate change and protect the trade corridor by preserving roads, dikes and infrastructure [76]. A previous cost–benefit analysis of adaptation measures to mitigate the impacts of sea-level rise and storm surges included scenarios of reinforcing and raising dikes and barricades, building new dykes further inland, and relocating and re-routing current transportation routes [77]. The need to ‘engineer’ new ‘solutions’ provides a potential opportunity to infuse an ecological lens into the mix, such as by considering opportunities for maintaining wildlife connectivity. It is imperative to identify and accommodate critical areas of ecological significance, especially if there is the need to relocate infrastructure and mitigations that could impact wildlife, positively or negatively. Critical areas should include pathways that are important to wildlife, as the Isthmus plays an essential role in not only trade and transportation but wildlife connectivity between the provinces. Successful implementation of any such conservation solution or initiative, however, will require political support, including engagement and buy-in by local communities.

1.2. Conservation Planning and Local Knowledge

Over the past 20 years, there has been a shift in the way science has been used in conservation planning [24,25], recognizing the importance of considering social factors along with ecological ones [78]. The social and natural sciences are now seen as complementary, with the challenges now being how to bring them together without privileging one over the other and how to infuse them into conservation planning and practice [34,78,79]. As such, conservation planning has begun to draw on transdisciplinary approaches from human geography, social-ecological systems, PPGIS and others. Such concepts are commonly applied in mapping and modeling studies of human-environment relationships, such as spatial patterns of land use and land cover [79]. Core principals are that conservation efforts ought to be systems oriented and cognizant of dynamic social-ecological interconnections between humans, culture, wildlife and ecosystems that are influenced by broad scale political, economic and biogeochemical conditions [28,34,80,81,82]. Ideally, both society’s and science’s perceptions of conservation issues should be collaboratively considered [28,83,84,85]. As such, conservation planning is challenged to apply innovative models through engagement of diverse communities, facilitate co-learning about conservation and derive solutions through the co-development of knowledge and practice [79,86,87]. Accordingly, there is a growing interest in engaging local people and diverse forms of knowledge to help interpret, frame, verify4 and otherwise complement knowledge gained through formal-natural-science methods, including addressing its gaps and limitations [88,89,90].
There is ongoing debate about the use of the term ‘integration’, referring to the inclusion of both local knowledge and scientific knowledge within environmental management [91], with important relevance for conservation planning. While the value of including local knowledge has been acknowledged, studies focused on knowledge ‘integration’ can struggle with considering which forms of knowledge are being privileged, sometime favouring scientific over local knowledge [56]. Differing epistemological beliefs about what and how things are known may constrain researchers’ abilities to engage fairly with the process of integration [56,91]. Challenges may also arise with distrust among researchers and local knowledge holders and through institutional power dynamics and privilege [55,56]. Such issues are inherent in attempts to ‘validate’ local or traditional knowledge with science. The desire to validate can derogate the legitimacy of local tacit and experiential knowledge, especially when the forms of knowledge and ways of knowing derive from fundamentally different epistemological systems, such as with traditional and scientific knowledge [92,93]. To acknowledge and address these challenges and barriers, conservation planning approaches are needed that facilitate the co-production of knowledge, engage more inclusive knowledge systems, and represent different forms of knowledge.
Connectivity conservation is a subset of conservation planning in which inclusive and collaborative efforts are particularly necessary, as it aims to address the conservation of public and private lands and Indigenous territories between protected areas [5,94,95,96]. The broader landscape is often highly contested space, with multiple demands and claims over a limited land base. Nonetheless, it is important to maintain and restore connectivity across human-dominated landscapes because habitat fragmentation is a key cause of wildlife decline [5]. Linear human developments such as roads are increasingly recognized as predominant impediments to habitat connectivity [97,98,99,100,101]. Yet, there are few studies that address wildlife and linear development patterns at broad-regional scales, despites calls for such attention [102,103,104,105]. There is also growing recognition that, particularly in coastal areas, responses to sea-level rise will require adaptation measures such as relocations of linear and other infrastructure from low-lying areas to higher elevations, with potential risks of further incursions into wildlife habitat and disruptions to wildlife movement patterns with implications for population persistence. In order to protect and maintain ecological connectivity, appropriate conservation planning strategies must be developed at local, regional, and national scales underpinned by an understanding of species distribution, barriers to movement and threats to their persistence, consideration of complex social-ecological contexts, and broad support of local people.
Given the challenges inherent to considering multiple, diverse layers of natural and social information and landscape spatial patterns in conservation planning, computer-based GIS are often used to facilitate data compilation and analyses [80,106]. The mapped outputs of such analyses are powerful tools for communication and decision support, yet they are strongly influenced by the choices of input data and the rules around interpreting it, such as in setting goals and targets for conservation modelling. These technologies, data sets and decisions about objectives and rule setting have been dominated by formal-natural sciences. To make these systems more inclusive and transparent, PPGIS approaches have been developed [107]. While helping to democratize the planning process and enrich the data, questions remain as to how best to reach consensus and how to accommodate and incorporate differences in knowledge and values [108]. Methodologies for representing differences and building consensus in participatory mapping are needed. This is especially important given that including local knowledge in planning and decision making is always troubled with questions of whose knowledge is included and privileged [56,91,92]. The idea of a homogenous community has been deeply critiqued in the literature and PPGIS methods provide an interesting model for engaging multiple viewpoints without assuming sameness in a local community [109]. Distinct from building consensus among diverse stakeholder groups, managers and planners, the question arises as to how to build consensus ‘within’ distinct groups, such as among local knowledge holders engaged in a participatory mapping exercise.
While the infusion of local perspectives in participatory mapping has expanded over the past two decades [90,110,111], there has been relatively little uptake in its application to wildlife connectivity planning. Local knowledge provides a key tool for understanding the complex social and ecological systems in which conservation planning operates and for which solutions are increasingly coming from models that are unconnected to local people and place. The Chignecto Isthmus provides a study area where conservation planning is not only imperative for maintaining local wildlife, but also for broader scale wildlife connectivity. Monitoring of wildlife movement, distribution and abundance is time consuming and costly and large gaps in knowledge for conservation planning remain. Local knowledge provides a means to help address these data gaps and limitations, while engaging local people and contributing to a more inclusive knowledge system. Accordingly, this study focuses on generating local tacit knowledge to help identify areas important to wildlife connectivity at a regional scale through an exploratory analysis using a participatory mapping approach. We focus on the local experiential knowledge of wildlife species, locations and movement pathways and landscape features that present opportunities or barriers to then. We address how such local knowledge enriches existing data and models, not simply through gap filling but by offering a deep understanding of interrelating factors that influence wildlife patterns within the region. We explore means of spatially delineating ‘fuzzy’ boundaries, representing diverse perspectives and generating consensus in local knowledge. The mapped outputs may be used to supplement and validate formal-scientific data and models relevant to delineating areas for wildlife connectivity and adapting human infrastructural developments in the region. Through the process, we seek to enhance local participants’ confidence in their knowledge and foster their support and future engagement in local conservation and other planning initiatives in the region, while contributing to more inclusive knowledge systems. We propose that the generation and engagement of local experiential knowledge can enhance understanding and support for wildlife connectivity planning. Our study provides broad intellectual contributions around validating or ground truthing modeling studies, where local knowledge provides a key tool for understanding knowledge about complex social-ecological systems that is increasingly coming from models that are unconnected to place and local people. As such, our approach and findings contribute to the scholarship and practice of connectivity conservation planning and PPGIS.

2. Materials and Methods

We used a mixed-methods approach engaging qualitative and quantitative social and natural sciences to create a spatial data set of wildlife connectivity patterns across the region. A combination of participatory one-on-one mapping interviews and two focus-group mapping workshops elicited local, tacit knowledge. Individual participants’ maps were digitised and compiled into a computer-based-mapping system. Spatial analyses were conducted to capture themes, similarities, and differences among the compiled mapped data from the individual interviews and group workshops. Maps were prepared to overlay local knowledge maps with NCC’s modeled wildlife habitat and movement pathways for discussion purposes. Explanatory texts from the participants’ interviews and workshop discussions were used to enrich, support, and interpret the participants’ mapped data. The methodological details associated with each step are provided in the following sections.

2.1. Participatory Mapping Interviews

We conducted participatory mapping interviews [112,113,114,115] with local knowledge holders to gather textual and spatial data representing their knowledge of wildlife species, population locations, habitat and movement patterns in the Chignecto Isthmus. Recruitment purposefully targeted people with long-term, lived experience on the land such as subsistence harvesters, woodlot owners, farmers, naturalists and recreational users of the land and wildlife. We conducted initial recruitment through local and provincial hunting, trapping, fishing, and naturalist groups and in collaboration with NCC, who has preestablished relationships with individuals and organizations in the region. Supplemental ‘chain-referral’ or ‘snowball’ sampling [116,117] was then employed, wherein interviewees were asked to suggest other potential participants knowledgeable of the land and wildlife. Recruitment ceased when no new referrals were forthcoming. Efforts were made to represent both provinces, aiming for 15–20 participants in each, and a breadth of experience and backgrounds. The participant sample was designed to reach the most knowledgeable local people while achieving a reasonable complement (n = 30–40) in terms of pragmatic logistical constraints such as time and funding, balanced against obtaining a range of viewpoints from knowledgeable individuals. The intent was to explore the deep experiential knowledge within this sub-section of the population, rather than be generalizable to the broader public. Preliminary screening ensured participants were knowledgeable of the region, identifying the nature of their relationship to the land and the time they had spent there. For the purpose of our study, “the local knowledge of an individual is unrelated to any institutional affiliation and is the product of both the individual’s cultural background and of a lifetime of interaction with his or her surroundings” [90] (p. 158). Knowledge sought from participants was to be based on the livelihoods and pastimes of the individuals and gained through “extensive observation” [118] (p. 1270) of the land and wildlife across the region over time. While it not possible to separate an individual’s tacit knowledge gained through their time spent on the land from their training within organizations and institutions, we asked participants to share their personal and experiential views and information, rather than represent the perspectives or provide formal data gleaned from their employers or member organizations.
A total of 34 local people with tacit knowledge of wildlife in the region participated in one-on-one participatory mapping interviews. Often participants did not identify as one specific type of knowledge holder, but rather had experience through a variety of work and recreational activities. Participants were engaged in hunting and trapping for sport, sustenance and income; farming and agriculture; forestry both at industrial and private woodlot scales; wildlife rehabilitation and photography; as naturalists and trail groomers; and in other recreational uses such as fishing, canoeing, hiking, birding, snowmobiling, biking and cross-country skiing. Many participants have spent their lifetimes growing up and working in different capacities in the Chignecto Isthmus, with 11 participants from NS, 18 from NB and five who had lived on both sides of the border. While some participants are not originally from the region, their connection to the land is strong through their work and long-term residence in the area. The shortest time a participant has lived in the region is 10 years, with a large part of that involved being out on the land. We did not seek other demographic data from our participants as we did not intend to stratify our sample into sub-groups. Since we intentionally targeted recruitment toward people with longer histories of time and relevant experience in the region, participants tended to be ~40 years and older. Due to their long-term, deep engagement and familiarity with the region, we were able to collect a wide temporal range of data based on their knowledge from the past to the present. Although we made significant efforts to increase recruitment of younger adults, women and Mi’kmaw individuals, these were largely unsuccessful, with only five women and none who identified as Indigenous participating in interviews. Particularly, we recognize that the inclusion of Mi’kmaw individuals is important, as the Chignecto Isthmus is situated within Mi’kma’ki, their ancestral and unceded territory. Unfortunately, the time frame of the study was insufficient to develop the relationships of trust and Indigenous methodologies necessary to meaningfully engage Mi’kmaw individuals in culturally appropriate ways. We acknowledge this limitation in our discussion (see Section 4.1). Inclusion of the Mi’Kmaq in dialogues and decision making within their territory is important, as are the insights likely to emerge, and as such their engagement in co-production of knowledge should be sought in future efforts (see Section 4.2).
We conducted semi-structured, face-to-face interviews in June-August 2019 in both NS and NB, at locations convenient for participants, such as at their farm, hunting cabin, or a coffee shop in a nearby town. Interviews of 1–2-h duration explored how participants view and value wildlife and wildlife habitat within the region. Interview-guide topics centered around several key questions used as prompts as they arose in natural conversations (Supplementary Materials S1). Questions were not necessarily all asked or addressed in any specific order as interviews were conversational and participant driven, based on their own experiential knowledge of the region. The first portion of the interview established context and built rapport to learn more about where participants live, how they came to live in the area, where they have spent their time in the region and the activities through which they have experienced the land. The second portion focused on core topics involving wildlife species, population distributions, movement patterns, habitat, conservation, roadkill hotspots, threats, and mitigation.
We solicited spatial data during the interviews through a participatory-mapping component. Participants selected base maps from among five options at three scales (1:30,000, 1:60,000, 1:170,000) upon which to convey their knowledge of the region. The base maps were centered around the NS-NB border and showed major highways and secondary roads, towns, protected and conserved areas, lakes and rivers, forest cover and elevation contours, all sourced from 1:50,000 Topographic Data of Canada [119]. Land cover was classified simply as forest or non-forest where the forest cover layer comprises a single land cover category which does not classify dominant species or forest type [119]. Often, forest cover served to orient participants to specific areas in the region such as the location of a pipeline right of way (i.e., a distinct linear feature of non-forest) and frequent occurrences of wildlife road crossings (i.e., adjacent known patches of forest cover on both sides of a highway). Elevation contours were often used to identify areas of higher elevation around Hall’s Hill and Uniacke Hill associated with known movements of terrestrial wildlife. Elevation contours were also useful for participants to orient themselves within the two main watersheds in the region and to identify two distinctive ridgelines in the region that were used as landmarks for recording wildlife observations. After the first few interviews, significant local landmarks emerged as identified by participants and were often used as points of reference for orienting and locating spatial data; these landmarks were added to the base maps. Key landmarks include the Old Ship Railway, a historical ship-railway route which is now used as a multi-use trail connecting the Bay of Fundy to the Northumberland Strait running from Tidnish to Fort Lawrence, and the Canadian Broadcasting Corporation (CBC) radio towers located in the Tantramar Marsh near Sackville, NB, which were distinctive landmarks at the border region for decades but have since been demolished.
Participants chose the map(s) on which they felt most comfortable identifying their key areas and observations, with the option to use multiple maps at various scales. Paper maps provide an integral elicitation and engagement tool and a means of physically recording participants’ responses in a spatial way. Participants were encouraged to draw directly on the maps, indicating any insights and tacit knowledge pertaining to wildlife, such as wildlife presence, absence and movements, particularly around roads, areas of concern for conservation, features that represent barriers to or heightened opportunities for wildlife movement, key areas used for their livelihood or recreational activities and their perception or the spatial extent of the Chignecto Isthmus as a region.
Individually mapped data were scanned and georeferenced to align with base map coordinates within a Geographical Information System (ArcGIS). The maps were then digitized to identify specific species’ presence, movement pathways and barriers to movement using layers of points, polylines, and polygons. The individual maps were compiled and organized to form a thematic series of maps representing participants’ landscape-based and experience-based knowledge of wildlife presence and pathways in the region. These were combined and overlaid to form group-consolidated thematic maps providing a composite landscape-scale perspective of wildlife presence and pathways in the region. Following the proposed methods outlined by McCall [115] for representing local spatial knowledge through dynamic mapping, composite areas were shown as multi-layered zones with fuzzy boundaries in recognition that individually delineated boundaries were not identical to each other. Local spatial knowledge often includes descriptive spatial terms and fuzzy boundaries which are not always perceived by participants as the same place or as existing in isolation [115]. There are also multiple levels of detail that are not single occurrences of location but rather represent temporal and spatial ranges, such as those used for hunting and trapping, and seasonal wildlife usage. The need for precision in participatory GIS can change in accordance with the intended output and goals of the research. As outlined by McCall [115], there is a need for less precision and lower resolution to represent various levels of certainty and confidence in the data. Such flexibility is appropriate in PPGIS applications aimed at eliciting and transferring generational knowledge for analysis of conflict or consensus and management applications [115] such as in our study.

2.2. Participatory Mapping Workshops

Subsequent to the individual map-interview phase of our research, we held two sequential, half-day mapping workshops near the border in Aulac, NB, in January and February 2020. The aim was to review and refine the map series derived from the interviews. We invited a subset of 20 individuals from among the 34 interview participants, selected on the basis of their demonstrated, strong experiential knowledge of the land and wildlife in the region and high regard as such by those in the larger group. Eight of these individuals participated in the first workshop, in which we sought to verify the consistency and accuracy of our interpretations and compilations of the individual data. Spatial data were presented and discussed as a series of thematic consolidated maps of wildlife habitat, movement pathways and associated threats and barriers. The second workshop brought together the same group of participants with an additional two who were unavailable for the first workshop but were identified by others as important to include. Workshop participants continued to represent a mix of diverse roles and knowledge of the region including hunters and trappers, farmers, loggers, birders, wildlife rehabilitation workers, wildlife photographers, active members of the Chignecto Naturalist Club and conservationists. This active engagement across various livelihoods and lifeways provided the opportunity for a mix of diverse perspectives and expertise and allowed for strong consensus building across experiential domains to develop a robust data set of spatially mapped, local tacit knowledge.
Workshop participants were asked to comment on the consolidated maps and whether or not they thought they accurately and/or completely represented their knowledge of (i) areas of wildlife presence, habitat and movement pathways and (ii) areas that represent heightened opportunities or barriers to wildlife passage, such as landscape features or changes. They were encouraged to note areas of similarities and differences in the maps and factors such as level of confidence, agreement/consensus and rationale. The workshop facilitated the pooling of participants’ knowledge and collective markings directly on the maps through roundtable breakout groups, where refinements were noted, such as additional or missing data and spatial revisions. Large printed maps were provided of the compiled, thematic spatial data. Participants were broken into two smaller groups to assess each map sequentially and provide opportunity to comment and draw on the maps, working through any areas of disagreement or uncertainty. Open focus-group discussions at the start and end of each workshop facilitated the sharing of participant’s views, thoughts, and opinions on the mapped data, expanding upon conversations and topics that had emerged.
After consensus was reached at workshop 1 on refinements to the initial consolidated thematic maps, the maps were updated to reflect the received inputs. In preparation for workshop 2, the outputs from NCC’s wildlife-movement-pathway model [48] also overlaid with the local knowledge holders’ consensus maps to develop a new series of thematic maps. Maps of wildlife roadkill hotspots identified by Barnes et al. [49,50] were also presented for comparison. The resultant composite maps reflected themes based on species distribution, movement patterns and wildlife-road interactions derived from both local-tacit knowledge and formal-science models, privileging neither.
In the second participatory mapping workshop held with the same subset of participants, the composite maps were reviewed for accuracy and completeness and to explore whether and why there may be similarities and differences in the results derived from their knowledge and those generated from the two formal-science data sources: (i) NCC’s model outputs of high-probability wildlife movement pathways derived from habitat-suitability and least-cost-path analyses for the focal species; and (ii) roadkill hotspots statistically derived from roadside survey data in the region [49,50]. Any differences between their tacit representations and the models were identified and discussed. Discussions also provided an opportunity to identify missing information in regard to other areas of habitat, wildlife movement or pathways and roadkill evidence. Questions explored whether they perceived problems with the model outputs; whether we had interpreted their feedback correctly or if further refinements were required in the maps; and why there may be differences between the model outputs and among their own knowledge of the land and wildlife. We also queried the most important patterns revealed through the maps, such as critical areas for supporting wildlife species and for addressing key threats to wildlife, and asked which species, if any, warrant heightened conservation attention.
After the second workshop, maps were refined based on participant feedback to create a series of final, local-consensus maps. Participants’ input and remaining similarities and differences between local-consensus and formal-science-derived maps were thematically and spatially analyzed. Points raised by the participants during the second workshop were used to understand patterns that emerged in the local data and how they compared to the modelled data.

3. Results

3.1. Predominant Species and Threats

During the interviews, participants were first encouraged to speak freely about their knowledge of wildlife and wildlife movement in the region and were later asked about the species considered in NCC’s modeling (see footnote 4). Species that featured prominently were closely tied to the livelihoods or relationships participants held with the land. These were predominantly large mammals, including moose, white-tailed deer and black bear, and other furbearing species that were hunted and trapped, including beaver, otter, mink, muskrat, coyote, hare and fisher. Others were porcupine, various bird species, including waterfowl, songbirds and birds of prey, along with fish, primarily gaspereau. Often these lesser-mentioned species were talked about more generally across the expanse of the region or as species affected by barriers, such as roads, but were not considered of conservation concern. A common theme was the general decline in species abundance across the region over the past few decades. As noted by a local forest ecologist, biologist and birder, “essentially every animal that belongs in this ecosystem is still there, although in depleted numbers, from predators to songbirds” (P27) 5,6.
Of the species modelled by the NCC, participants elaborated only on four, namely moose, black bear, hare and fisher, and showed considerable knowledge of habitat, movement pathways and barriers for black bear and moose (Figure 2a,b). Bears were said to be numerous and increases in bear activity across the region were noted, especially in NS, and often associated with forestry practices and agriculture, both of which were considered to provide enhanced food sources for bear. While key areas of habitat and points of observation were mapped for bear (Figure 2a), the common response was that you could find black bear ‘everywhere’ and that the population was increasing: “years ago there was hardly a bear around, but now they’re everywhere” (P25); and, “I mean, there’s bears everywhere. More than people realize” (P15).
Moose were mapped very differently from bears by participants (Figure 2b). They noted many factors impacting the locations and movements of moose across the region, including competing deer populations and the associated brain worm, climate change, heavy tick loads, poaching and habitat fragmentation, consistent with published explanations (P. tenuis is a parasitic brain worm that deer can live with but is fatal to moose; for a summary, see [8]). Many participants commented on the abundance of moose in NB and the dwindling population that persists in NS, with limited explanations as to why moose are not as abundant there. An avid hunter, trapper and past wildlife technician noted that moose “wander from the NB side, there’s no doubt about it, but they don’t seem to wander very far. Once they hit the Cobequid, along here, they just don’t seem to migrate much further than that” (P22). Participants recognized that there appears to be abundant moose habitat within NS but did not know why moose do not prefer that habitat, stating “I can’t really draw a conclusion if they will [move into NS], because if they’re not using it today, what’s going to make them use it tomorrow” (P18), and “I often go into areas and scratch my head, ‘why aren’t there moose here?’ The feed is there. The water is there. Everything is there for a moose, but there’s no moose in the area” (P10).
There was speculation among participants as to why moose do not seem to persist in NS yet remain abundant in NB. Poaching of moose in NS was raised as a concern by hunter, fisher and wildlife-technician participants (e.g., P1, 7, 18). Because native moose (Alces alces Americana) are officially listed as provincially endangered7, it is illegal to hunt them in mainland NS. Hunting for moose is allowed in NB, with limiting regulations managed by a lottery draw for a licence to hunt them each season and a bag limit of one [123]. However, illegal hunting was mentioned as a threat to moose moving across or on the NS side of the border: “Yeah, all over this area, here, … poaching goes on, … as you get back in the woods. I played golf with this guy three years ago and he said, ‘We poach one every year’!” (P7).
Another explanation that participants provided for relatively low numbers of moose in NS is increased temperatures impacting habitat selection, exacerbated by climate change. As a wildlife rehabilitation specialist noted, “they’re [moose] starting to move further north, like up into the highlands, because of the temperature changes where there’s enough variance that you can still get colder, snowier areas. The moose aren’t going to like hotter areas” (P29). This same pattern was observed by hunters, trappers and lifetime farmers who commented on temperature being a large factor and noted that populations of moose tend to persist further north in NB where it is cooler. Although information specific to the study area is not available to substantiate temperature trends, regional temperatures in the Atlantic provinces are projected to increase by 3–4 °C over the next 80 years [124]; and, annual average temperatures in NS have increased by 0.5 °C over the past century (1895–1998) [122]. Due to latitudinal and ocean influences, temperature changes in the Atlantic region are projected to be relatively moderate; however, even small changes are considered likely to have negative effects on populations of species at the limits of their thermal tolerances, which may be the case with moose in the Chignecto region and the rest of mainland NS [8,125]. Loss of mature forest cover adds to heat stress by limiting important opportunities for thermal regulation near forage in both summer and winter [8,125].
Some participants noted some relative changes in species abundance over many years, observed over generally extended temporal time frames spent on the land or hunting and trapping specific species. A common thread was consistency over time in the relatively high abundance of moose in NB as compared to NS. This trend remains evident in current distributions of moose shown in Figure 2b, where there is a dense amount of moose-related data recorded in NB versus smaller and more sparse pockets recorded in NS. This aligns with studies conducted in NS [8,122,126]. In the early 2000s it was estimated that there were approximately 1000 moose left in mainland NS, however recent aerial surveys conducted by T. Millette for NS Lands and Forestry has revealed very low numbers of moose, underlying concerns that there are likely far fewer left in the wild than previously thought [127].
Generally, when participants were asked to consider the focal species that the NCC used to model their wildlife corridor, they were reported as present and well dispersed across the Isthmus. Red fox and deer were described as more likely to be found around towns where they were safer from predators and near food sources. Deer and bear were said to be abundant around foraging areas such as farmers’ fields and deer wintering areas. In terms of relative declines and increases in abundances, deer and hare were frequently mentioned, noting a cyclical nature based on predatory pressures, hard winters, and food availability rather than a steady trend over the years.
As for the factors affecting species, several key themes arose from the interviews. Participants identified several barriers to wildlife movement across the Chignecto Isthmus, indicating that while roads provide an obvious physical detriment to movement, factors such as highway speed and forest cover are likely compounding limiting factors. A resounding factor, deeply expressed and agreed throughout, was the relatively fast rate at which the landscape has been changing over the past 30, 10 and as recently as 5 years. Landscape changes were considered to have not only impacted the resilience and abundance of species, but also their ability to move freely between NS and NB. Participants remarked on the proliferation of roads, especially for forestry, which have also facilitated access into natural areas. They described an increase in extent and intensity of forestry activities, which have diminished old growth forests and converted habitat through frequent clear cutting and herbicide applications. Noticeable increases in road speed, traffic and tourism-related travel were also reported.
Though anecdotal and relative, these qualitative observations are consistent with landscape changes found in other studies. Human footprint (HF) scores in the Isthmus are higher than average across the larger Acadian/Northern Appalachian ecoregion, with HF scores of 21–30 (out of 100) assigned to most of the Isthmus and higher HF scores (41–60) in a broad swath dissecting the Isthmus; as such, the Chignecto Isthmus region is classified as ‘high threat’, defined as above average levels for the ecoregion [45,65]. In general, many wildlife species are negatively affected by roads (for overviews relevant to the study area see, [99,128]). Moose populations have been shown to be vulnerable to increased hunting pressure near roads, especially illegal hunting; and in NB, 92% of moose killed by hunters occurred within 1 km of forest roads [129]. Densities for roads and trails across the study region are ‘moderate’ to ‘very high’ [125,128] and higher than a suggested threshold (0.6 km/km2) for sustaining mammal populations in naturally functioning landscapes [98]. Once road influence zones are taken into account, remnant forest patches are small and fragmented [46], average forest patch size across the region is <5.0 hectares [130]. Forestry practices, including clearcutting and herbicide spraying, have been criticized in NS (see [131] for an in-depth, independent review). Local species declines and the need for attention to such threats are documented in status reports and recovery plans for species at risk, provincially [e.g., 122, 126] and nationally [132,133], and reflected in the region’s designation as one of Canada’s Community-Nominated Priority Places for Species at Risk [59]. Accordingly, there is strong agreement between the participants’ observations and the small number of potentially corroborating studies available, with the local descriptions infusing rich explanatory insights to the local socio-ecological context.

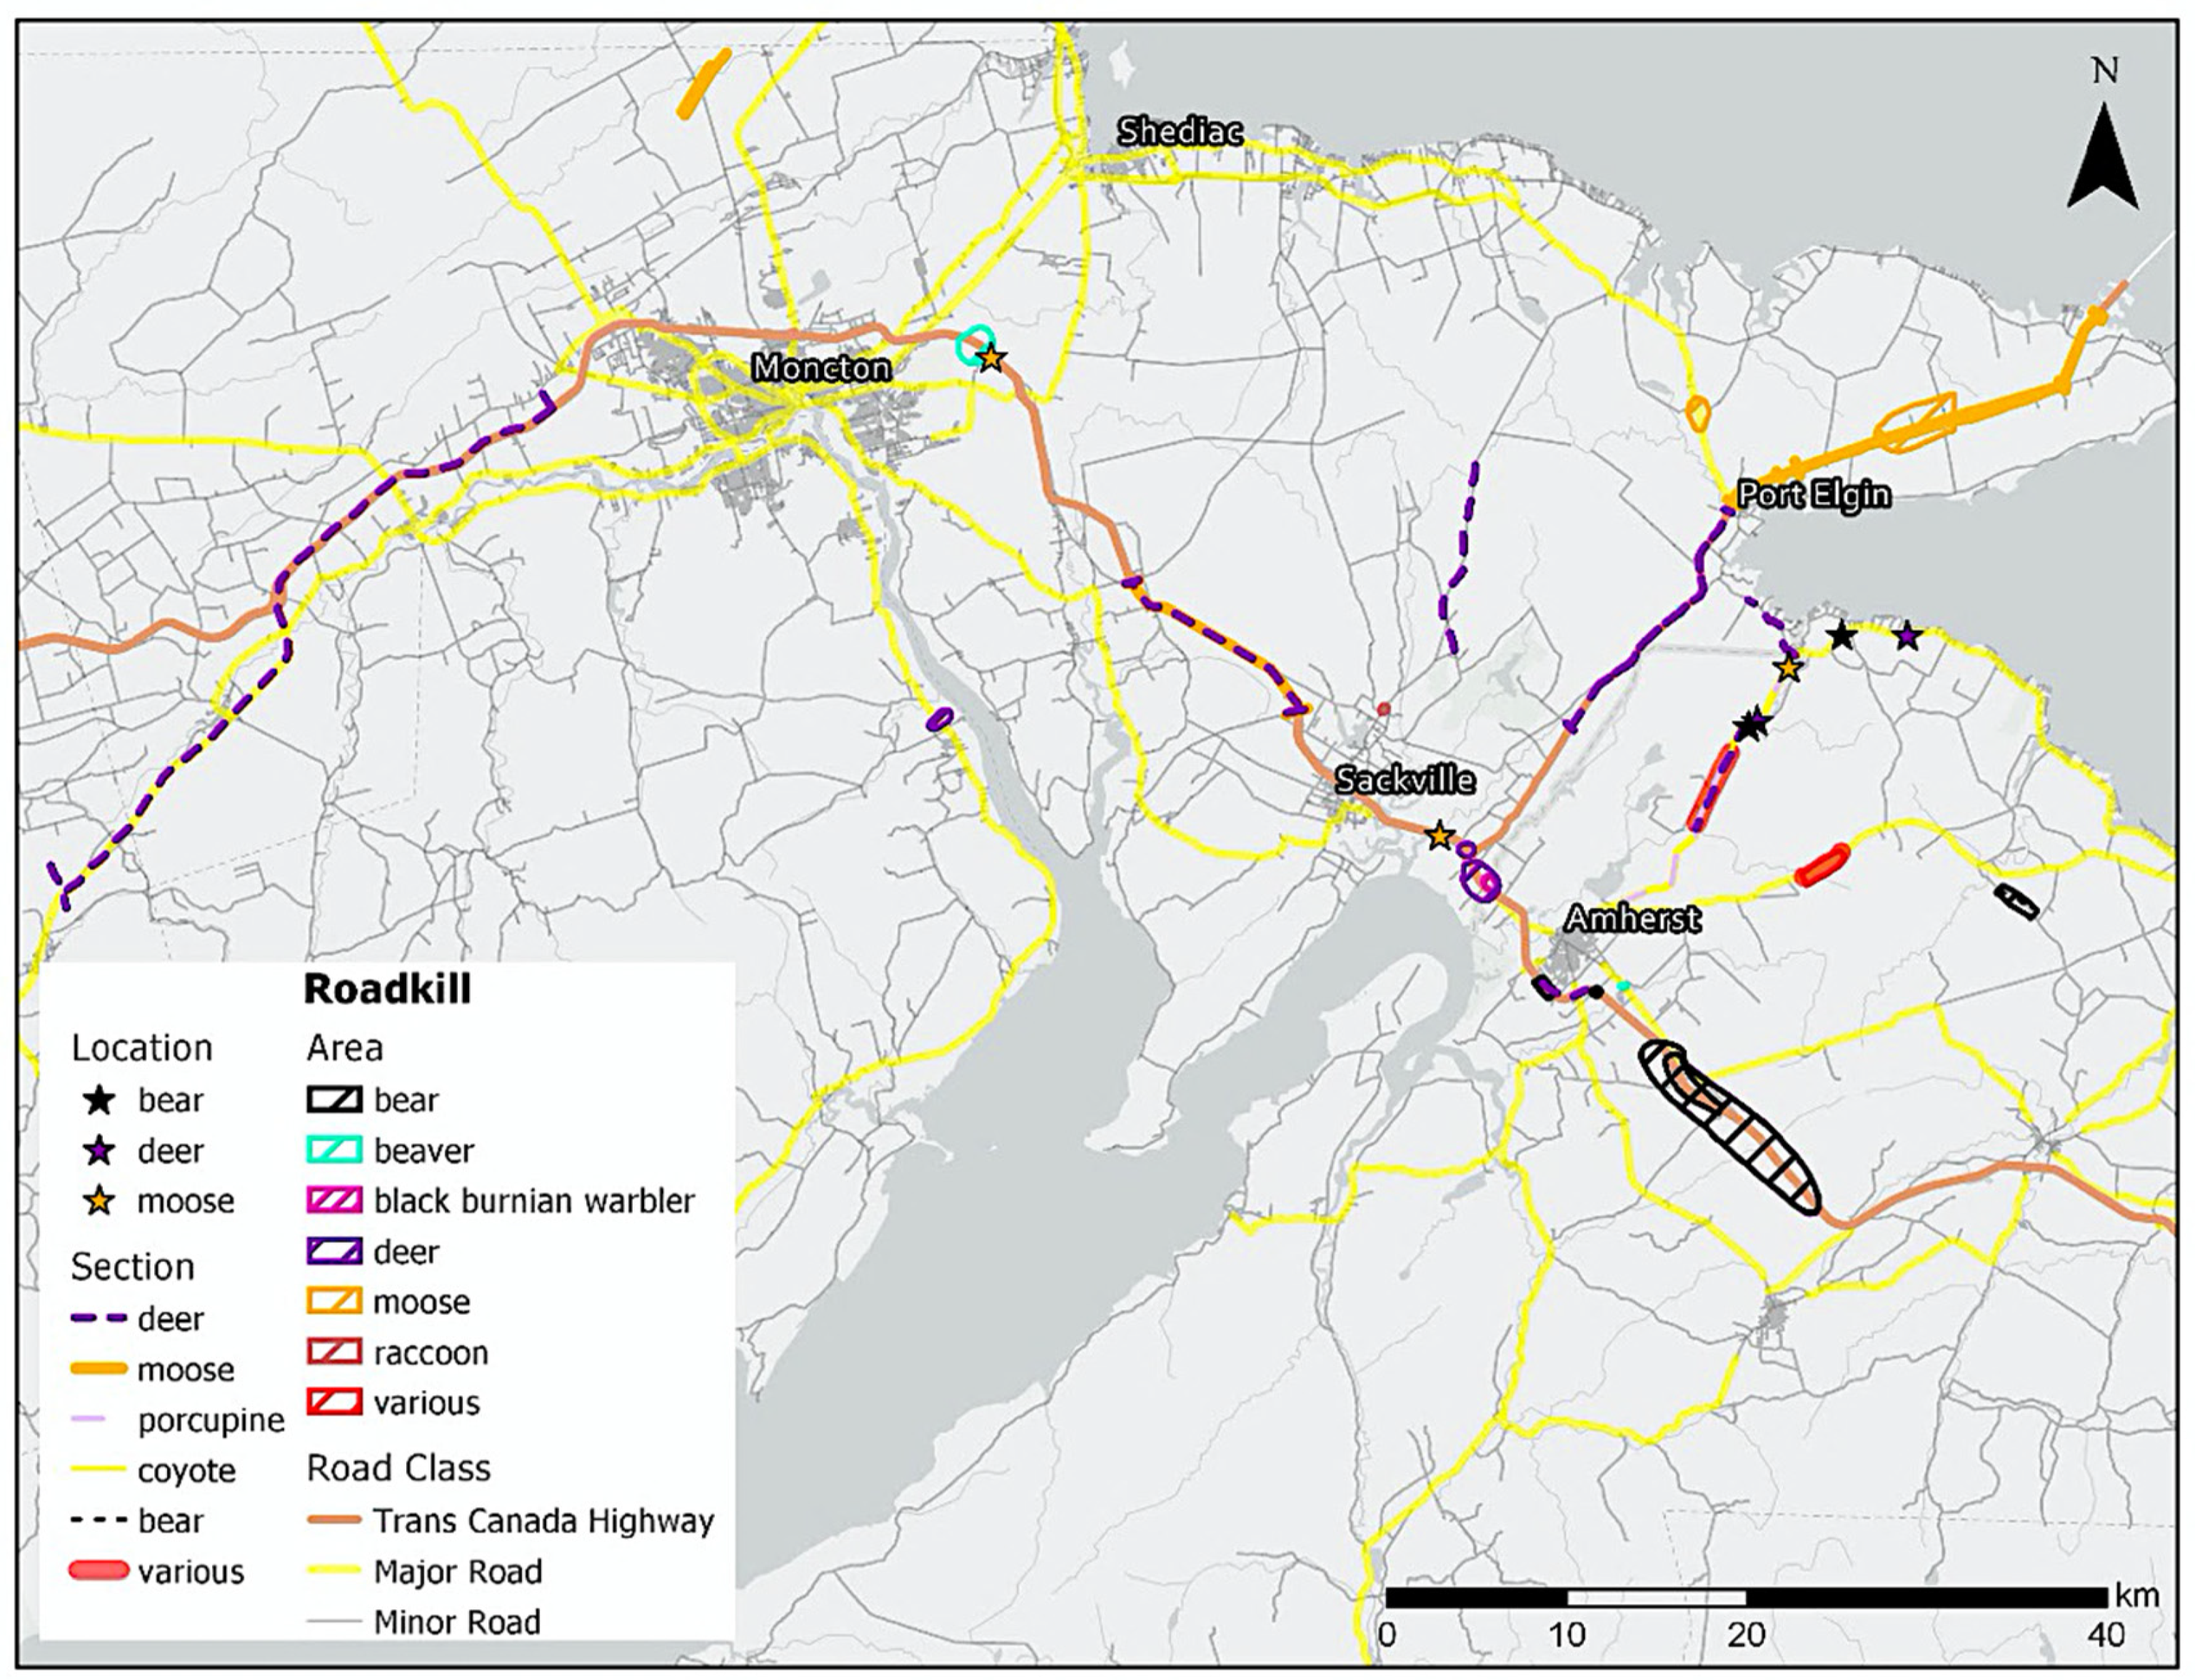
3.2. Patterns in Spatial Elicitation through Participatory Mapping

Based on predominant spatial data emerging from the participatory interview mapping, eight thematic maps were produced: (i) avian species presence, movement and roadkill; (ii) movement pathways of terrestrial wildlife; (iii) point locations, sections and areas of roadkill for terrestrial species; (iv–vii) location, movement and roadkill for black bear, moose, deer and other fur-bearing species; and (viii) overlapping moose and deer locations, movement patterns and observations (see Figure 2, Figure 3 and Figure 4. These maps served as the basis of discussion for workshop 1. At the workshop, participants indicated that the locations of species and other mapped spatial forms of knowledge were reflective of what they had indicated in their individual interviews. Although there were instances where participants noted a gap, they later discovered that the data was included on a map other than the one they were examining at that moment. As a consequence, the participants neither added nor removed information and requested no refinements to the consolidated, thematic maps, although encouraged to do so. Despite being mapped separately by 34 individuals, participants noted a high degree of agreement in their spatial representations. Accordingly, participants considered group consensus to have been established for the mapped information presented regarding species locations, movement pathways and roadkill areas for moose, deer and black bear and a suite of furbearing mammals. Participants in the two consecutive workshops reported that they were able to see their knowledge, along with the compilation of data from other participants, reflected in the maps, and that this increased their confidence in their knowledge in terms of its veracity and spatial accuracy.
That said, methods varied by which participants used base maps to record their knowledge. The spatial extent of their perceptions of the region, wildlife habitat, movement and barriers varied widely, drawing upon various map scales; 42 individual maps were produced at 1:30,000 (n = 11), 1:60,000 (n = 18) and 1:170,000 (n = 13). Some spoke broadly about general patterns and habitats across large geographical extents at a coarse level of detail, while others conveyed finely detailed knowledge in local vicinities, recording a total of 556 discrete points, lines, and polygons to record their knowledge of 47 different species. Their degrees of confidence varied across scales and background knowledge. Participants often demonstrated a desire to record a precise location, yet if they felt any uncertainty in spatial precision, they hesitated to place a mark on the map. In such cases, we encouraged them to make the mark according to their best judgment while representing uncertainty by a dashed line. Interestingly, when data were later compiled and collectively reviewed during the workshops, it was clear that there was much consensus in the various attributes that had been marked by individual participants, with uncertainty at the individual level overcome at the group level.

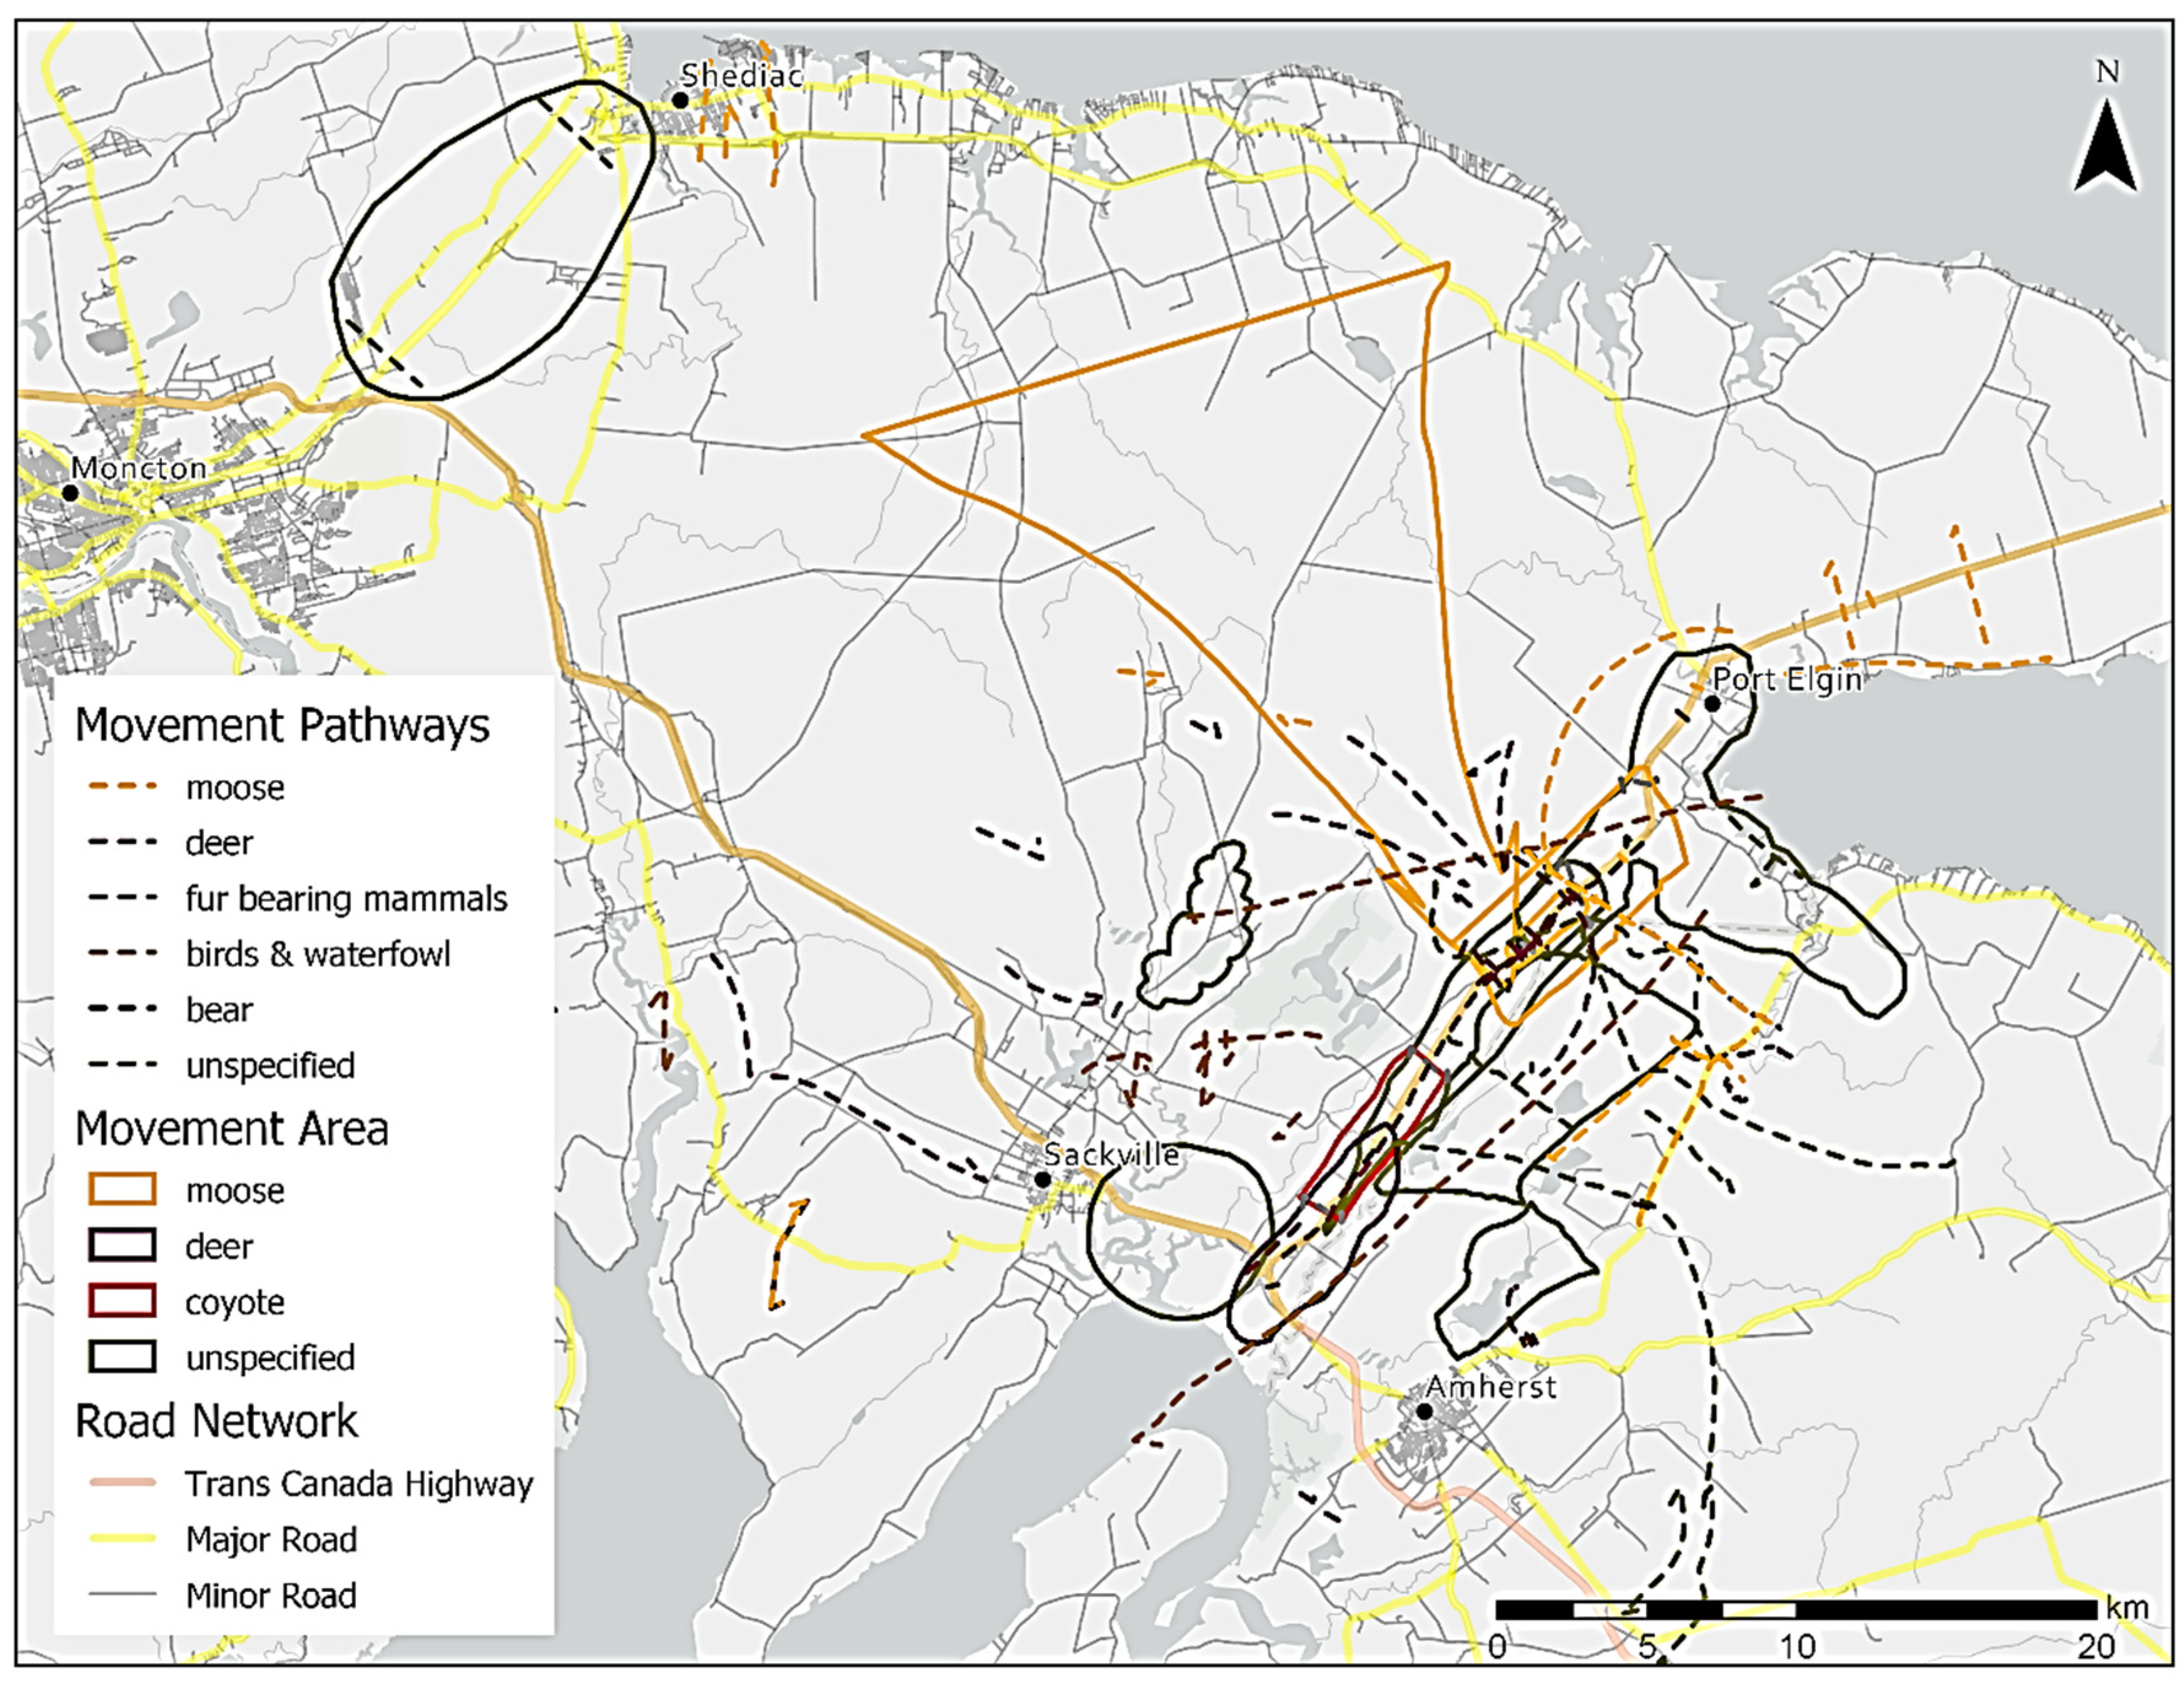
3.2.1. Wildlife Movement Pathways

A total of 129 discrete points, lines and polygons were drawn for 15 different species to indicate movement pathways (Figure 3) along with 41 records of roadkill sections (Figure 4) on key stretches of road, which also are indicative of wildlife movement within these areas. Pathways were merged in a single map layer to represent composite movements for all species (Figure 3). There were differences in ways individuals represented and thought about wildlife movement pathways. Some thought in terms of roads and how species were forced to move either across or along them. Their notations would often indicate an area or section of road where species frequently moved along (n = 12) or across (n = 34), at times representing places where species would readily cross due to factors such as higher elevation (n = 16) (versus low-lying wetlands and coastal marshes) or tree cover on either side of the road. At other times, these represented their observations of wildlife crossing the road, wildlife tracks or high numbers of incidences of roadkill in the area. Of note was a 1-km road section along Highway (Hwy) 16 between Aulac and Port Elgin, NB, which is the sole area along that highway with remnant tree cover on both sides. Wildlife, both live and roadkill, were reported to be frequently seen in this location. The surrounding landscape has been cleared for agriculture, housing, and forestry.
Many participants noted that wildlife often travelled along ‘paths of least resistance’. The most frequently mentioned was a natural gas pipeline right of way, which runs North-West to South-East across the NS-NB border and Hwy 16 near Hall’s Hill, NB. The pipeline is cleared of brush along its entire route but remains forested on either side and is relatively less frequently bisected by fences and devoid of other human developments as compared with other potential routes. Several participants have observed wildlife and other evidence of travel along this corridor, such as moose and black bear sightings, tracks, and scat. Similar use of human-made routes was noted for moose and black bear in areas where logging roads and other forestry activities have permeated forested regions. Participants often reported that wildlife may be seen travelling along logging roads as they move through an area and often recorded observations of species sightings or signs (tracks and scat) along these routes when mapping out their spatial knowledge. Some participants reflected that there may be increased observations in these areas due to increased human presence facilitated by road or trail access, consistent with observational or sampling bias often reported in field studies. As one trapper, hunter and fisher said, “I’d see tracks all over where the cuts (clear cuts and logging roads) are. The only reason I would see them there is because those are the places where I have access, where I can get to” (P4).
Others described wildlife movement in a broader context in terms of how species move throughout the region, particularly across the NS-NB border and between suitable areas of habitat for specific species (Figure 3). At this broader scale, it was also noted by several participants that the region between Halls Hill and Uniacke Hill along Hwy 16 is the highest point of elevation when crossing between the two provinces and provides a natural funnel where terrestrial wildlife are “streamlined” (P3) across the Isthmus. When describing how wildlife move between NB and NS, some participants drew an hourglass shape which captured suitable habitat on either side of the border for terrestrial wildlife but was constricted through a pinch point in the border region, along this area of higher elevation.
Temporal, daily and seasonal, movement pathways were also indicated, particularly for deer and migratory birds. Wintering areas and deer yards were often delineated, along with areas where deer would frequently graze in agricultural fields and near salt marshes, and spring and fall movement pathways in and out of wintering areas. These pathways often included areas along and across roads where high frequencies of vehicle-deer collisions and deer crossings were reported. Temporal movements were also recorded for migratory birds such as the American Black Duck and Common Eider. In contrast to most patterns, migratory birds were shown as moving across the Isthmus from the Northumberland Strait to the Bay of Fundy (Figure 3). Human changes to the landscape were noted as interfering with these daily and migratory flightpaths, acting as barriers to movement. A couple of participants who are hunters and also work in the conservation field identified power lines that stretch across pastures near the High Marsh Road just west of the NS-NB border that birds would strike on their daily flight paths at dusk and dawn. The powerlines were described as so frequently deadly that eagles have begun to perch and wait there to scavenge dead, stunned or injured prey (P8, P9). The wind turbines located between Sackville NB and Amherst NS were also stressed as a deterrent to movement for bird species and associated fencing as a barrier to other species (P13).

3.2.2. Threats to Wildlife Habitat and Movement

Roadkill in general was frequently mapped during the interviews (Figure 4), primarily for deer, moose and black bear. Moose was noted as a hazard to drivers and most frequently hit in NB on Hwy 16 between Port Elgin and the bridge to Prince Edward Island. This stretch of Hwy 16 is notorious for vehicle-wildlife collisions and was highlighted 16 times as a hotspot for moose crossings and roadkill. Several participants indicated the surrounding area as moose habitat, supporting a healthy moose population (Figure 2b). Deer movements were also marked along the same highway, but south of the moose hotspot between Port Elgin and Halls Hill (Figure 4). Deer roadkill hotspots were also noted along the Tyndal road east of Hwy 16 in NS and at the Aulac, NB interchange at the start of Hwy 16. Black bear roadkill locations were noted along the Tyndal Road in NS; near cottages in Tidnish, NS along the Northumberland Shore; and along the Trans-Canada Highway east of Amherst. The hotspot on the Trans-Canada Highway separates two large black bear habitat areas and populations identified by participants (Figure 2a).
Increasing human-wildlife conflicts [134], especially pertaining to moose, can result in varying societal attitudes and values [135]. In NB where many rural routes and highways pass through moose habitat, there is the potential of increased risk of moose-vehicle collisions which could cause damage to vehicles or have the potential to injure and kill both wildlife and humans. Individual and social characteristics can influence one’s risk perception; the evaluation of the probability and consequences of an unwanted outcome is heightened by experiencing the effects of danger [136,137]. Risk perception can be amplified by a mixture of individual, social, and environmental factors combined with perceptions and attitudes influenced by testimonials of extreme events [138]. This may well be the case with participants in our study. Collision data from NB Department of Energy and Resource Development show 13 records of dead moose on NB Routes 15 and 16 from 2013–2018 [49], and in an eight-week period in May–June 2017, vehicle-moose collisions averaged one per week [139]. Related media and other attention may have fostered a heightened sensitivity to moose-road interactions among our participants, resulting in its prevalence in their reports; however, it is also the case that high rates of moose-vehicle incidents do occur in this area.
Forestry was another predominant emerging theme that was often discussed and sometimes mapped during the interviews. Except for providing improved forage habitat for black bears, forestry was often discussed with a high level of frustration and concern for the ‘devastation’ it causes, resulting in a continuously changing landscape across the Chignecto Isthmus. Although some participants have worked in the industry and privately log wood from their land, there was overwhelming consensus that industrial silvicultural practices have rapidly shifted the landscape and negatively impacted habitat quality and quantity in the region.
We can go for a drive today and drive up in this area and see moose tracks, but does it represent or have any remnants of what it was like 35 or 40 years ago? Not even close, and it never will. That piece of ground will never be the same. Those things in itself, to me, are changes that are irreversible and are going to represent some sort of adversity to wildlife” [referring to swaths of land currently being used for industrial forestry] (P10).
Referred to as “death by a thousand cuts” (P27), the impacts of forestry across the region have “devastated diverse ecology” (P27). What was once a mature, mixed Acadian forest is now young plantations of jack pine and balsam fir, creating monocultures which have stripped away wintering areas for deer and feed for moose (P17, P18, P28). Participants criticized such practices, calling the push toward monoculture as ‘borealization’ due to the focus on specific softwood species, disrupting the balance in Acadian forests (P27, P28).

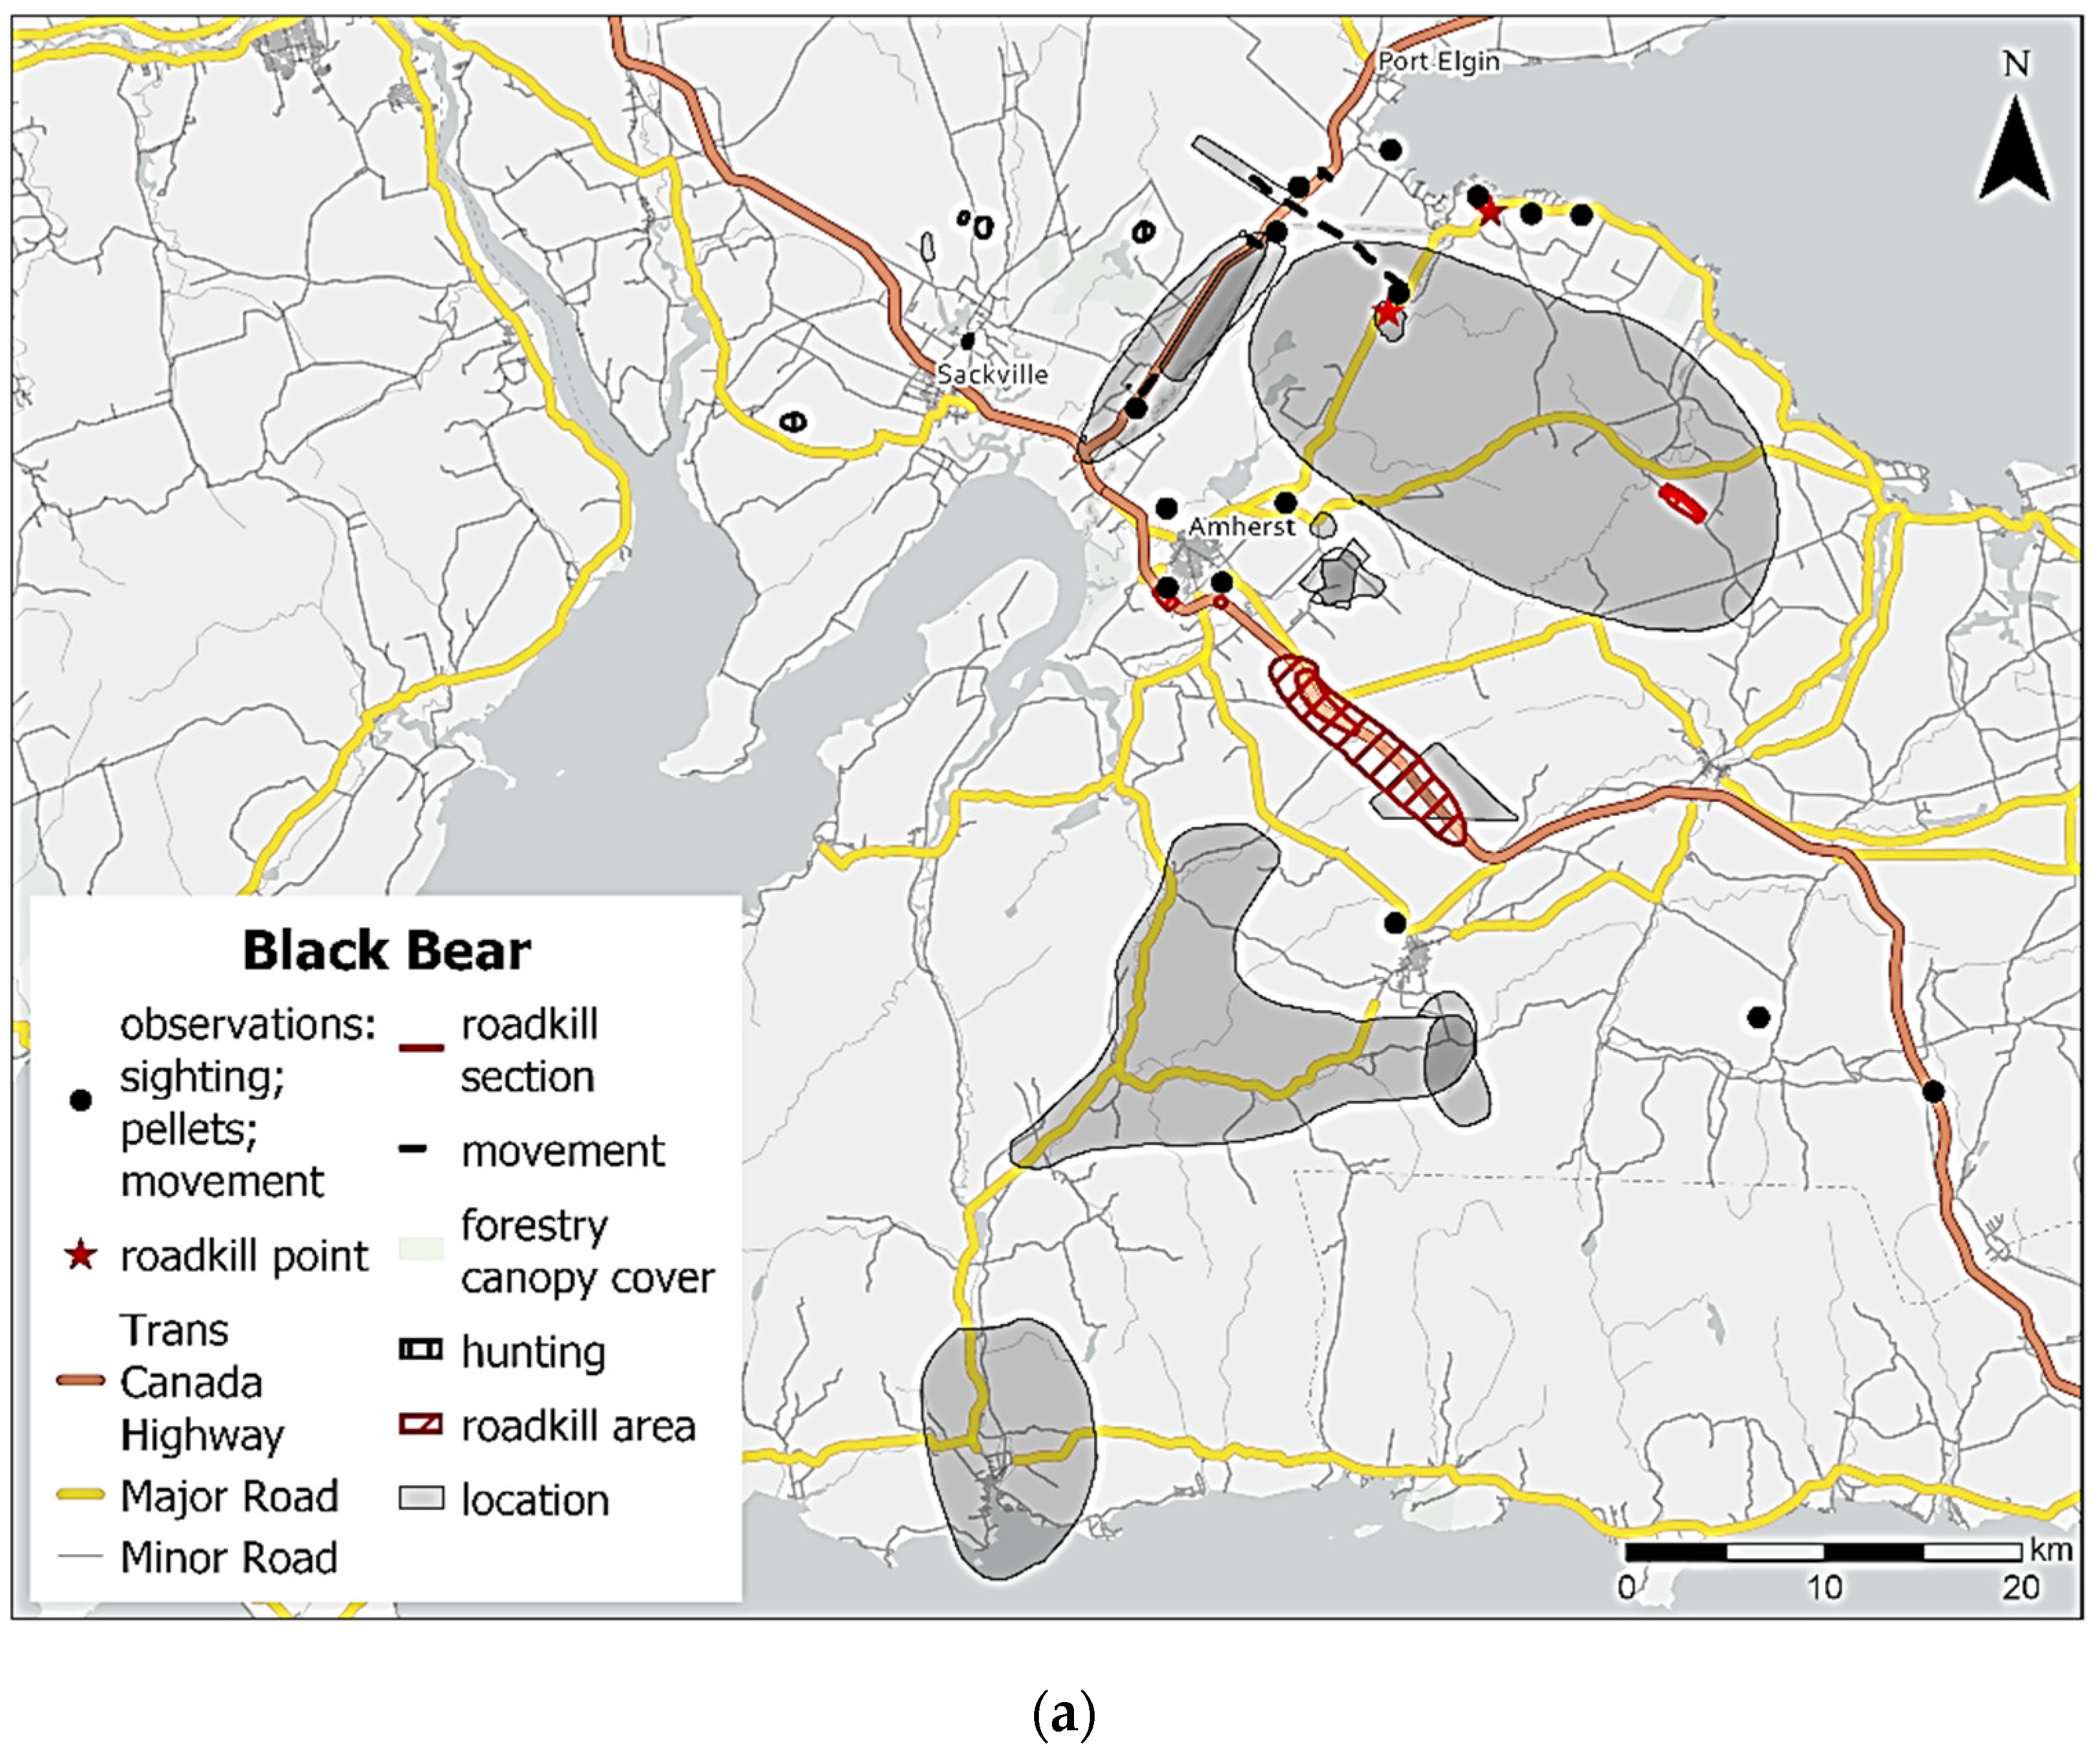
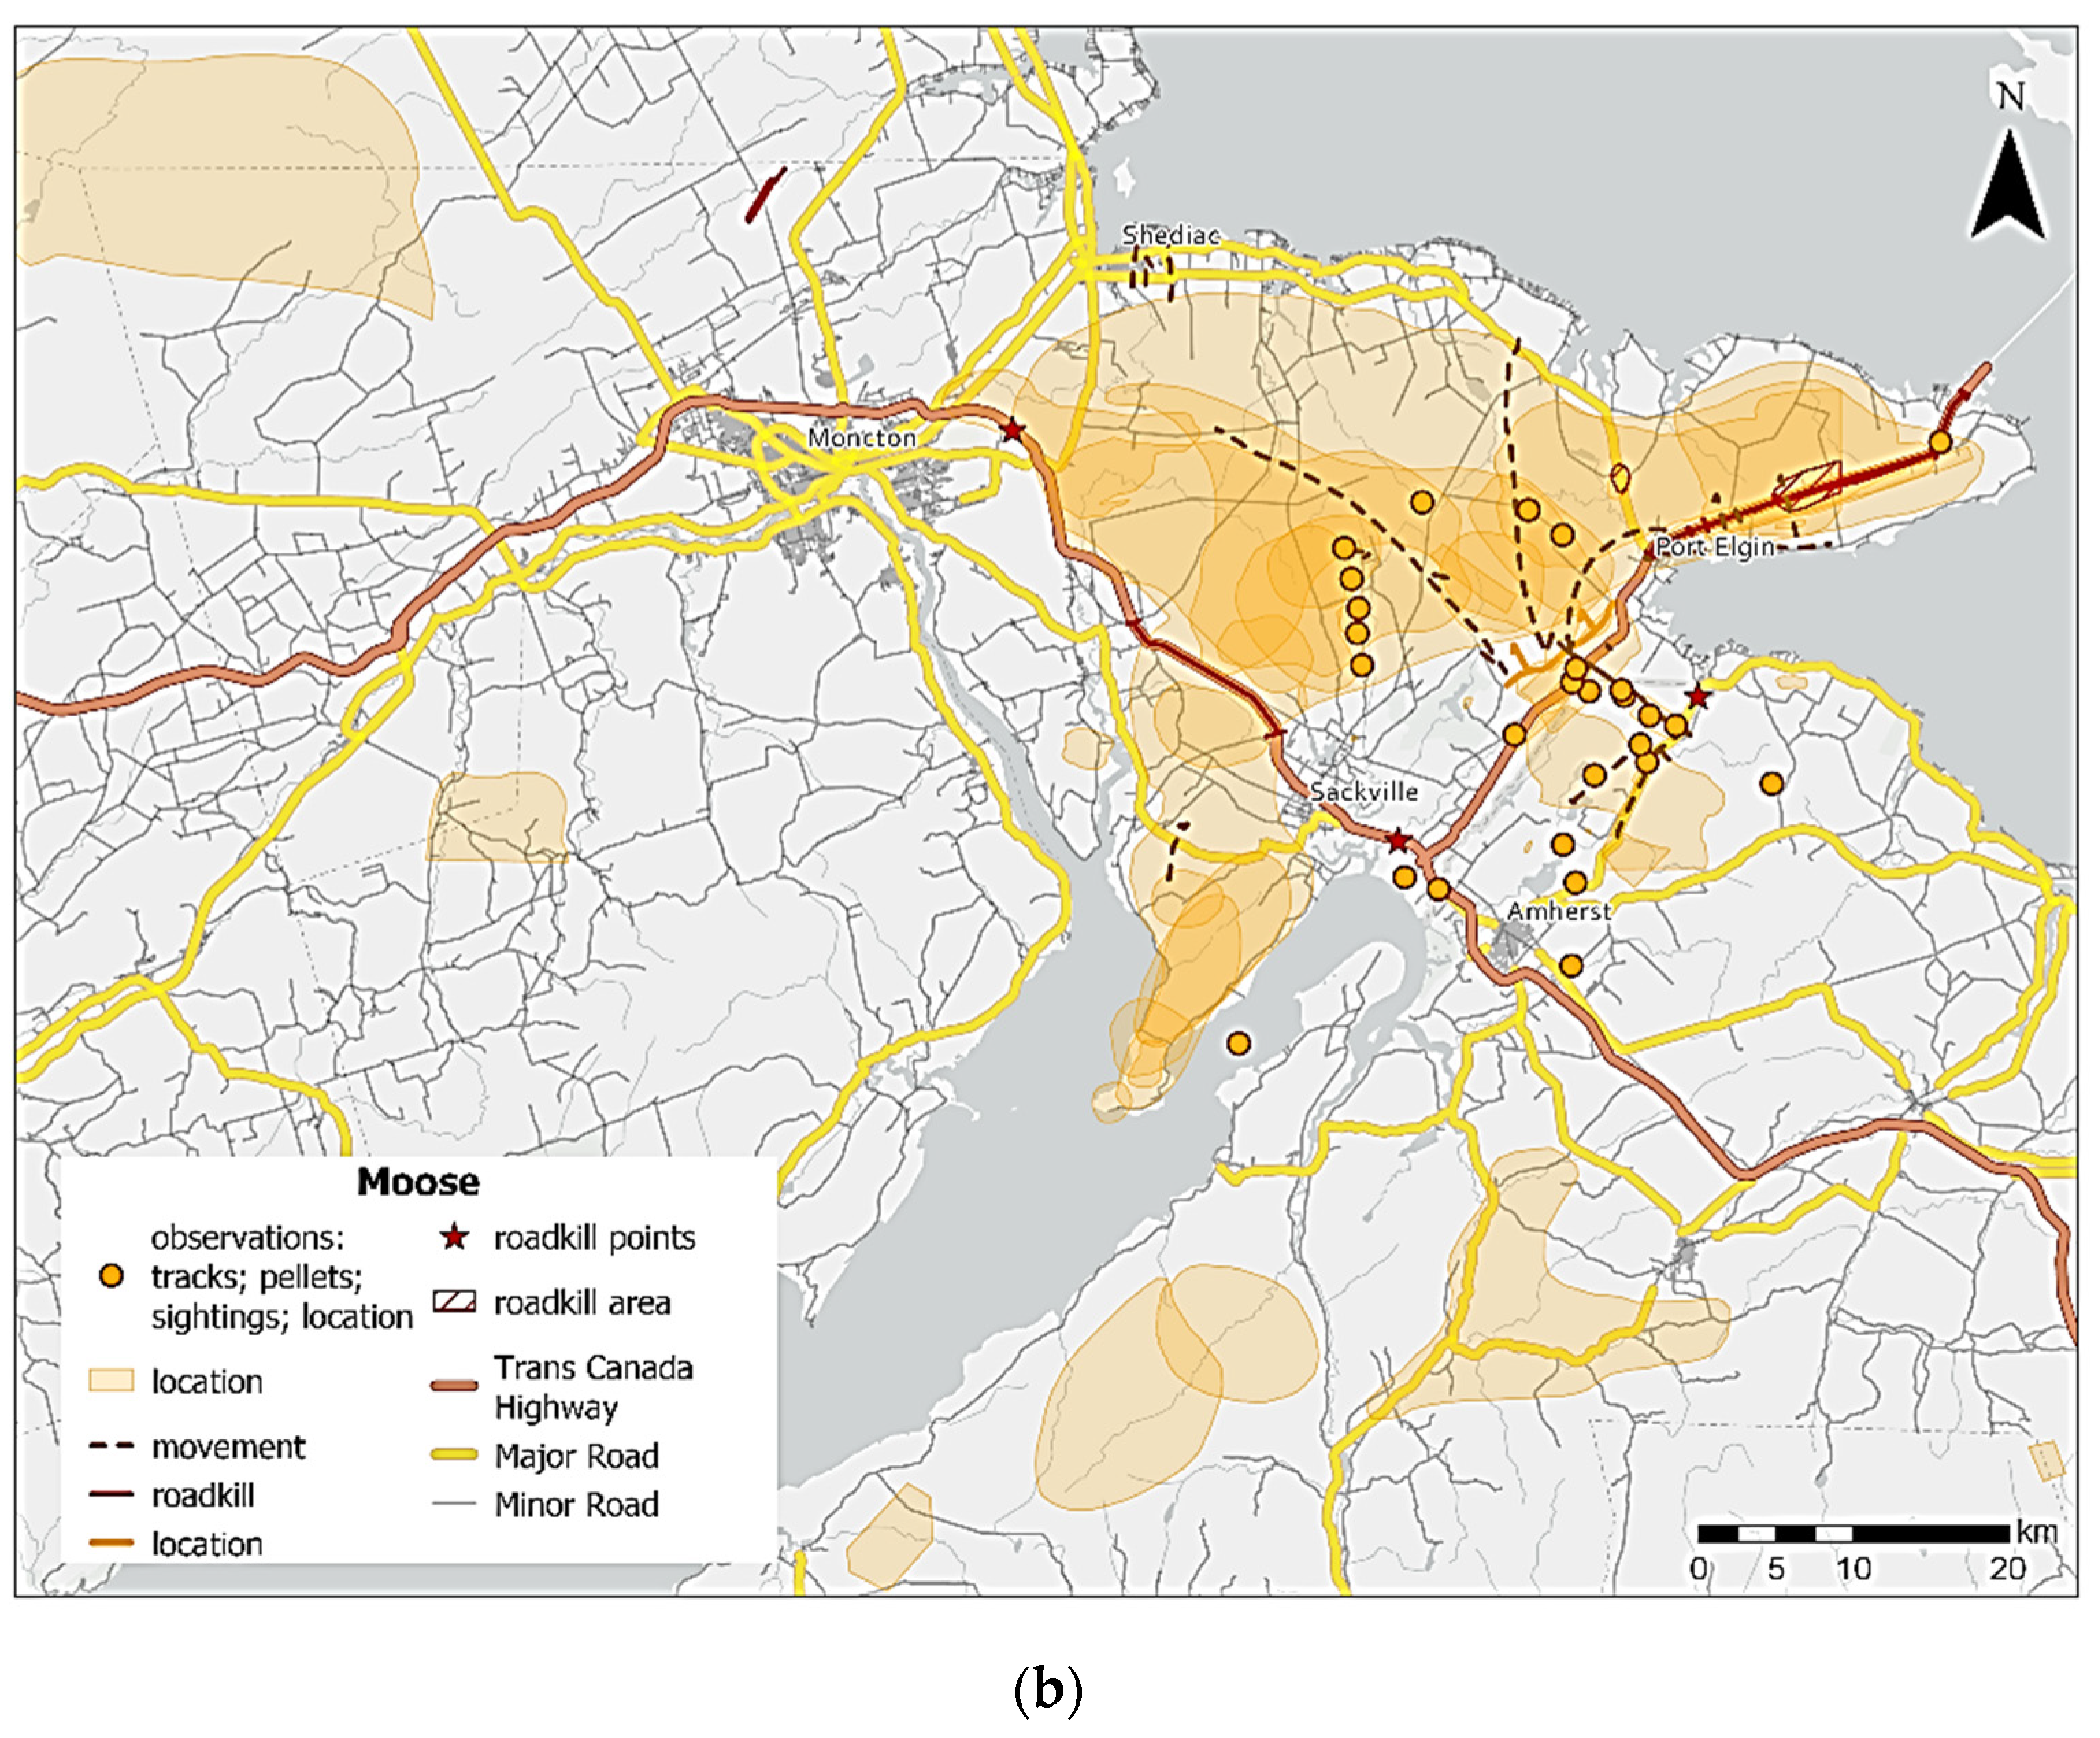
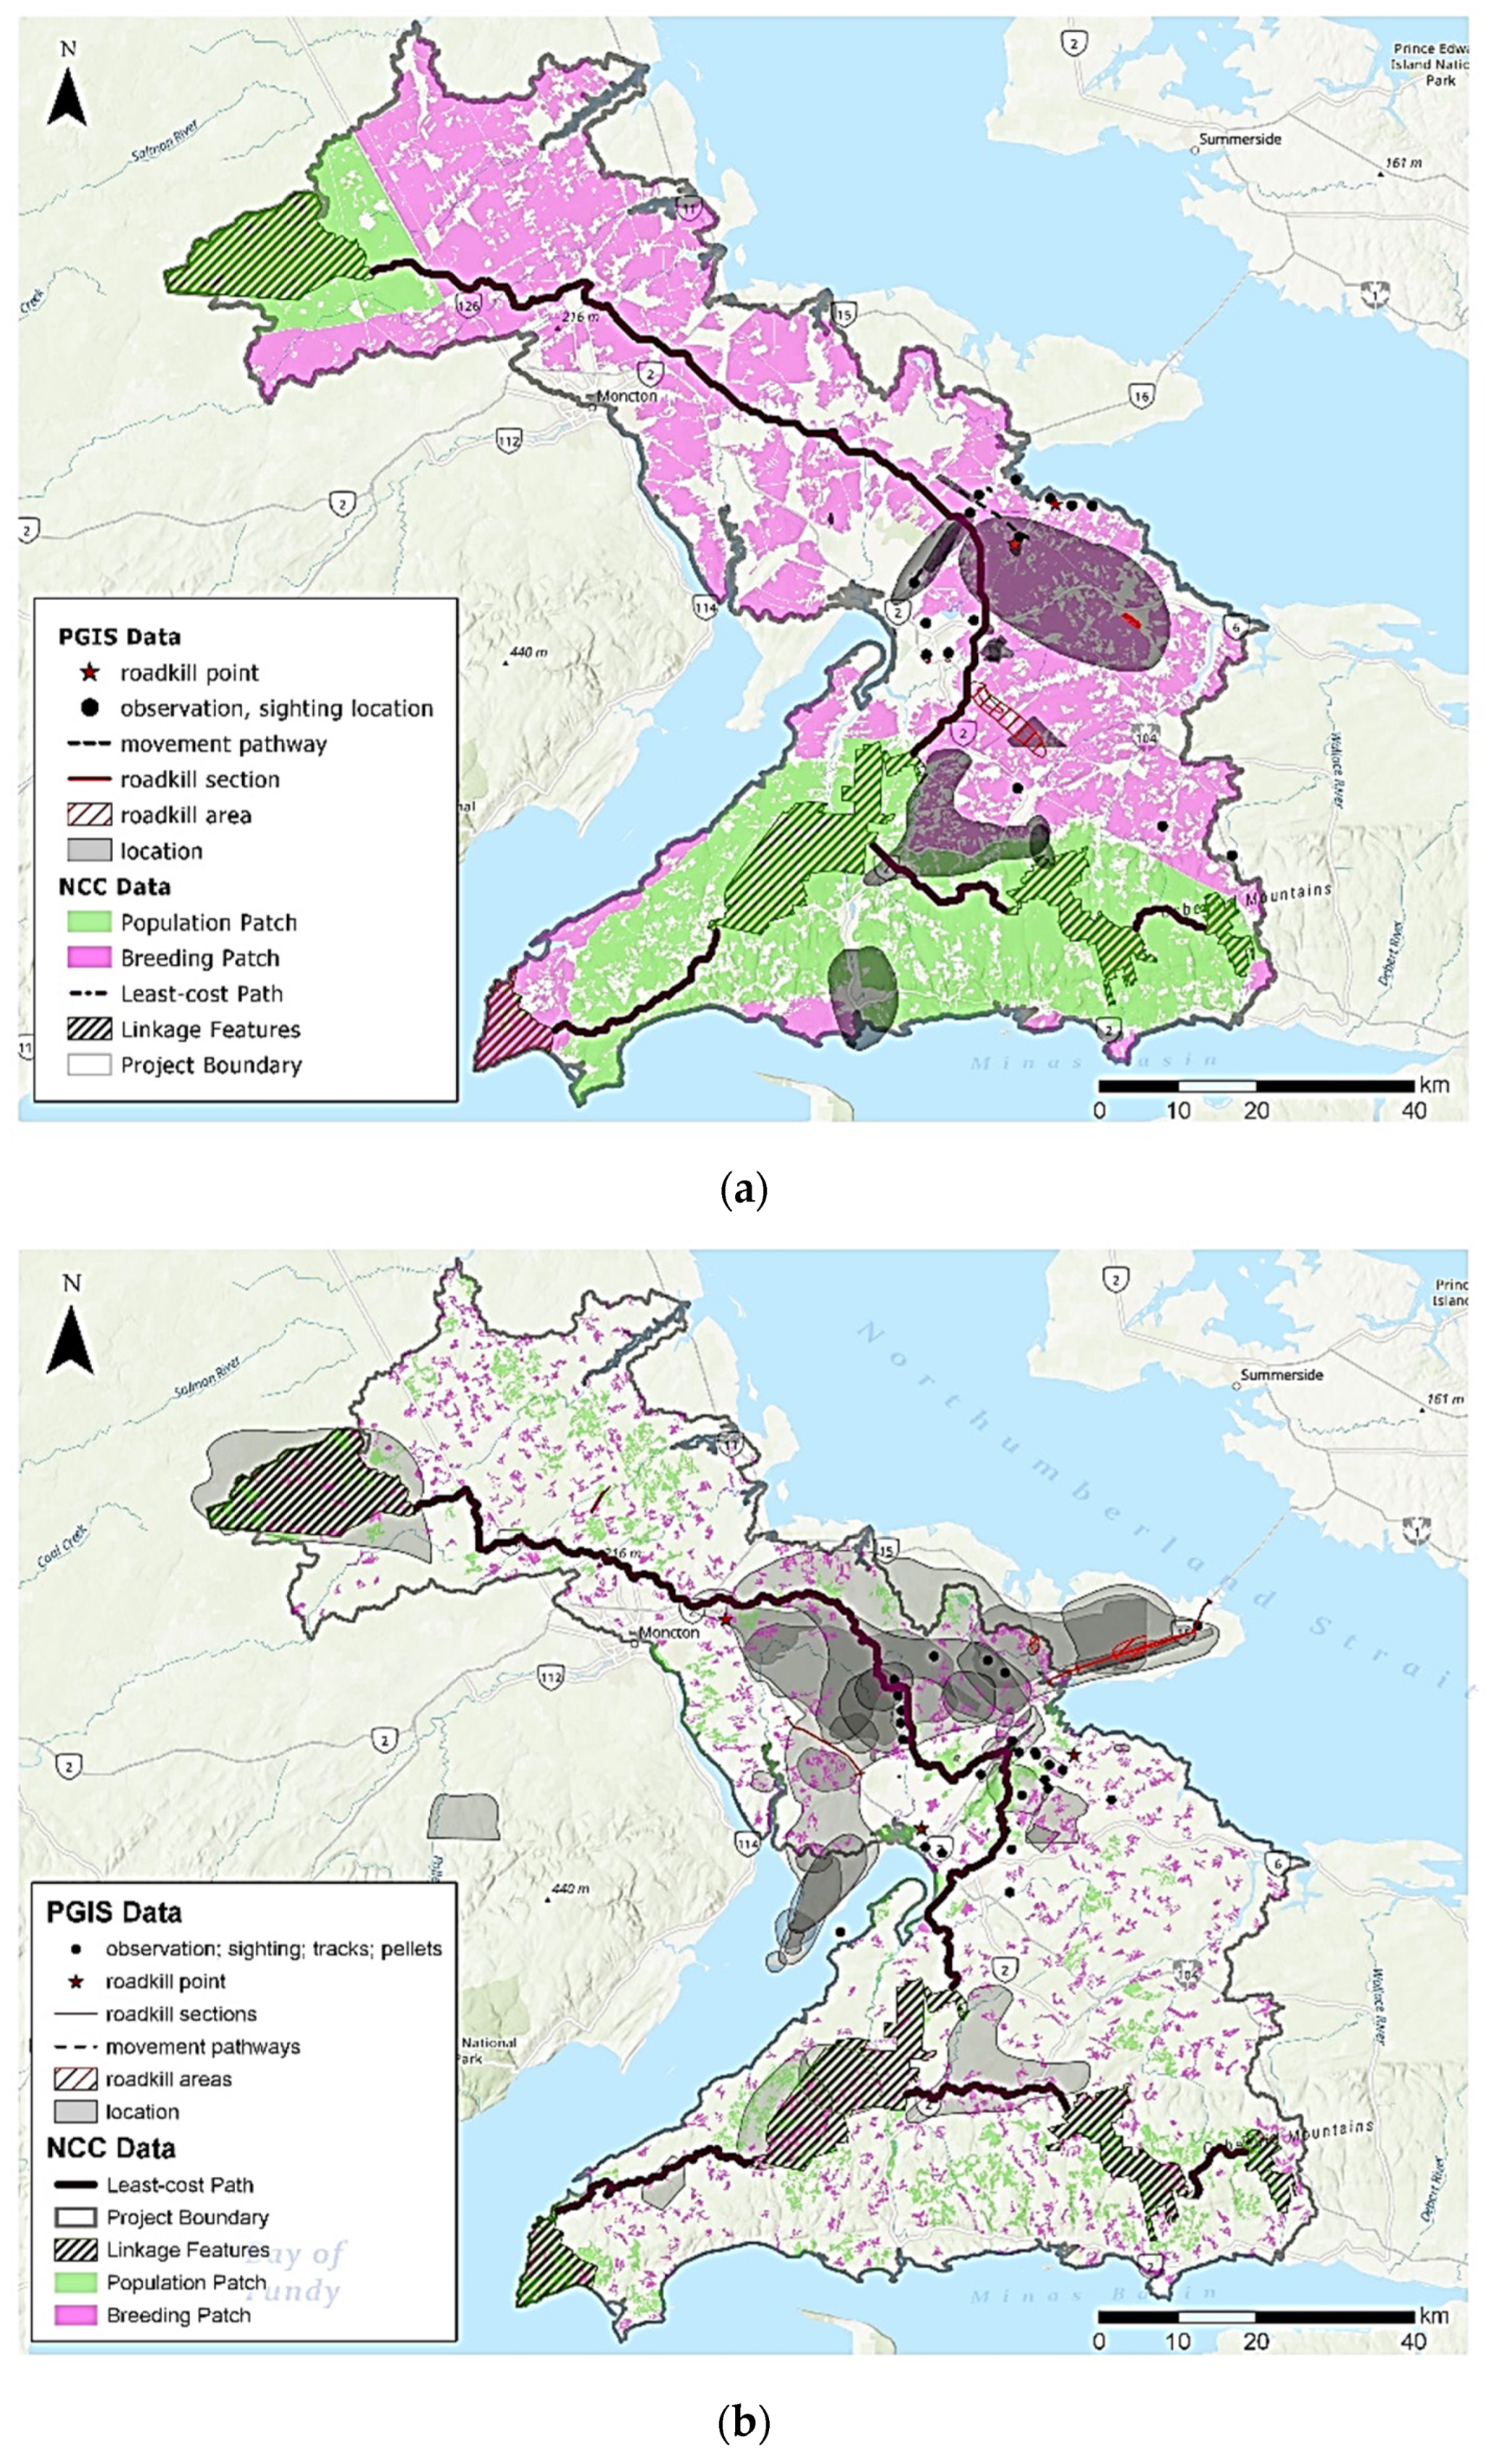
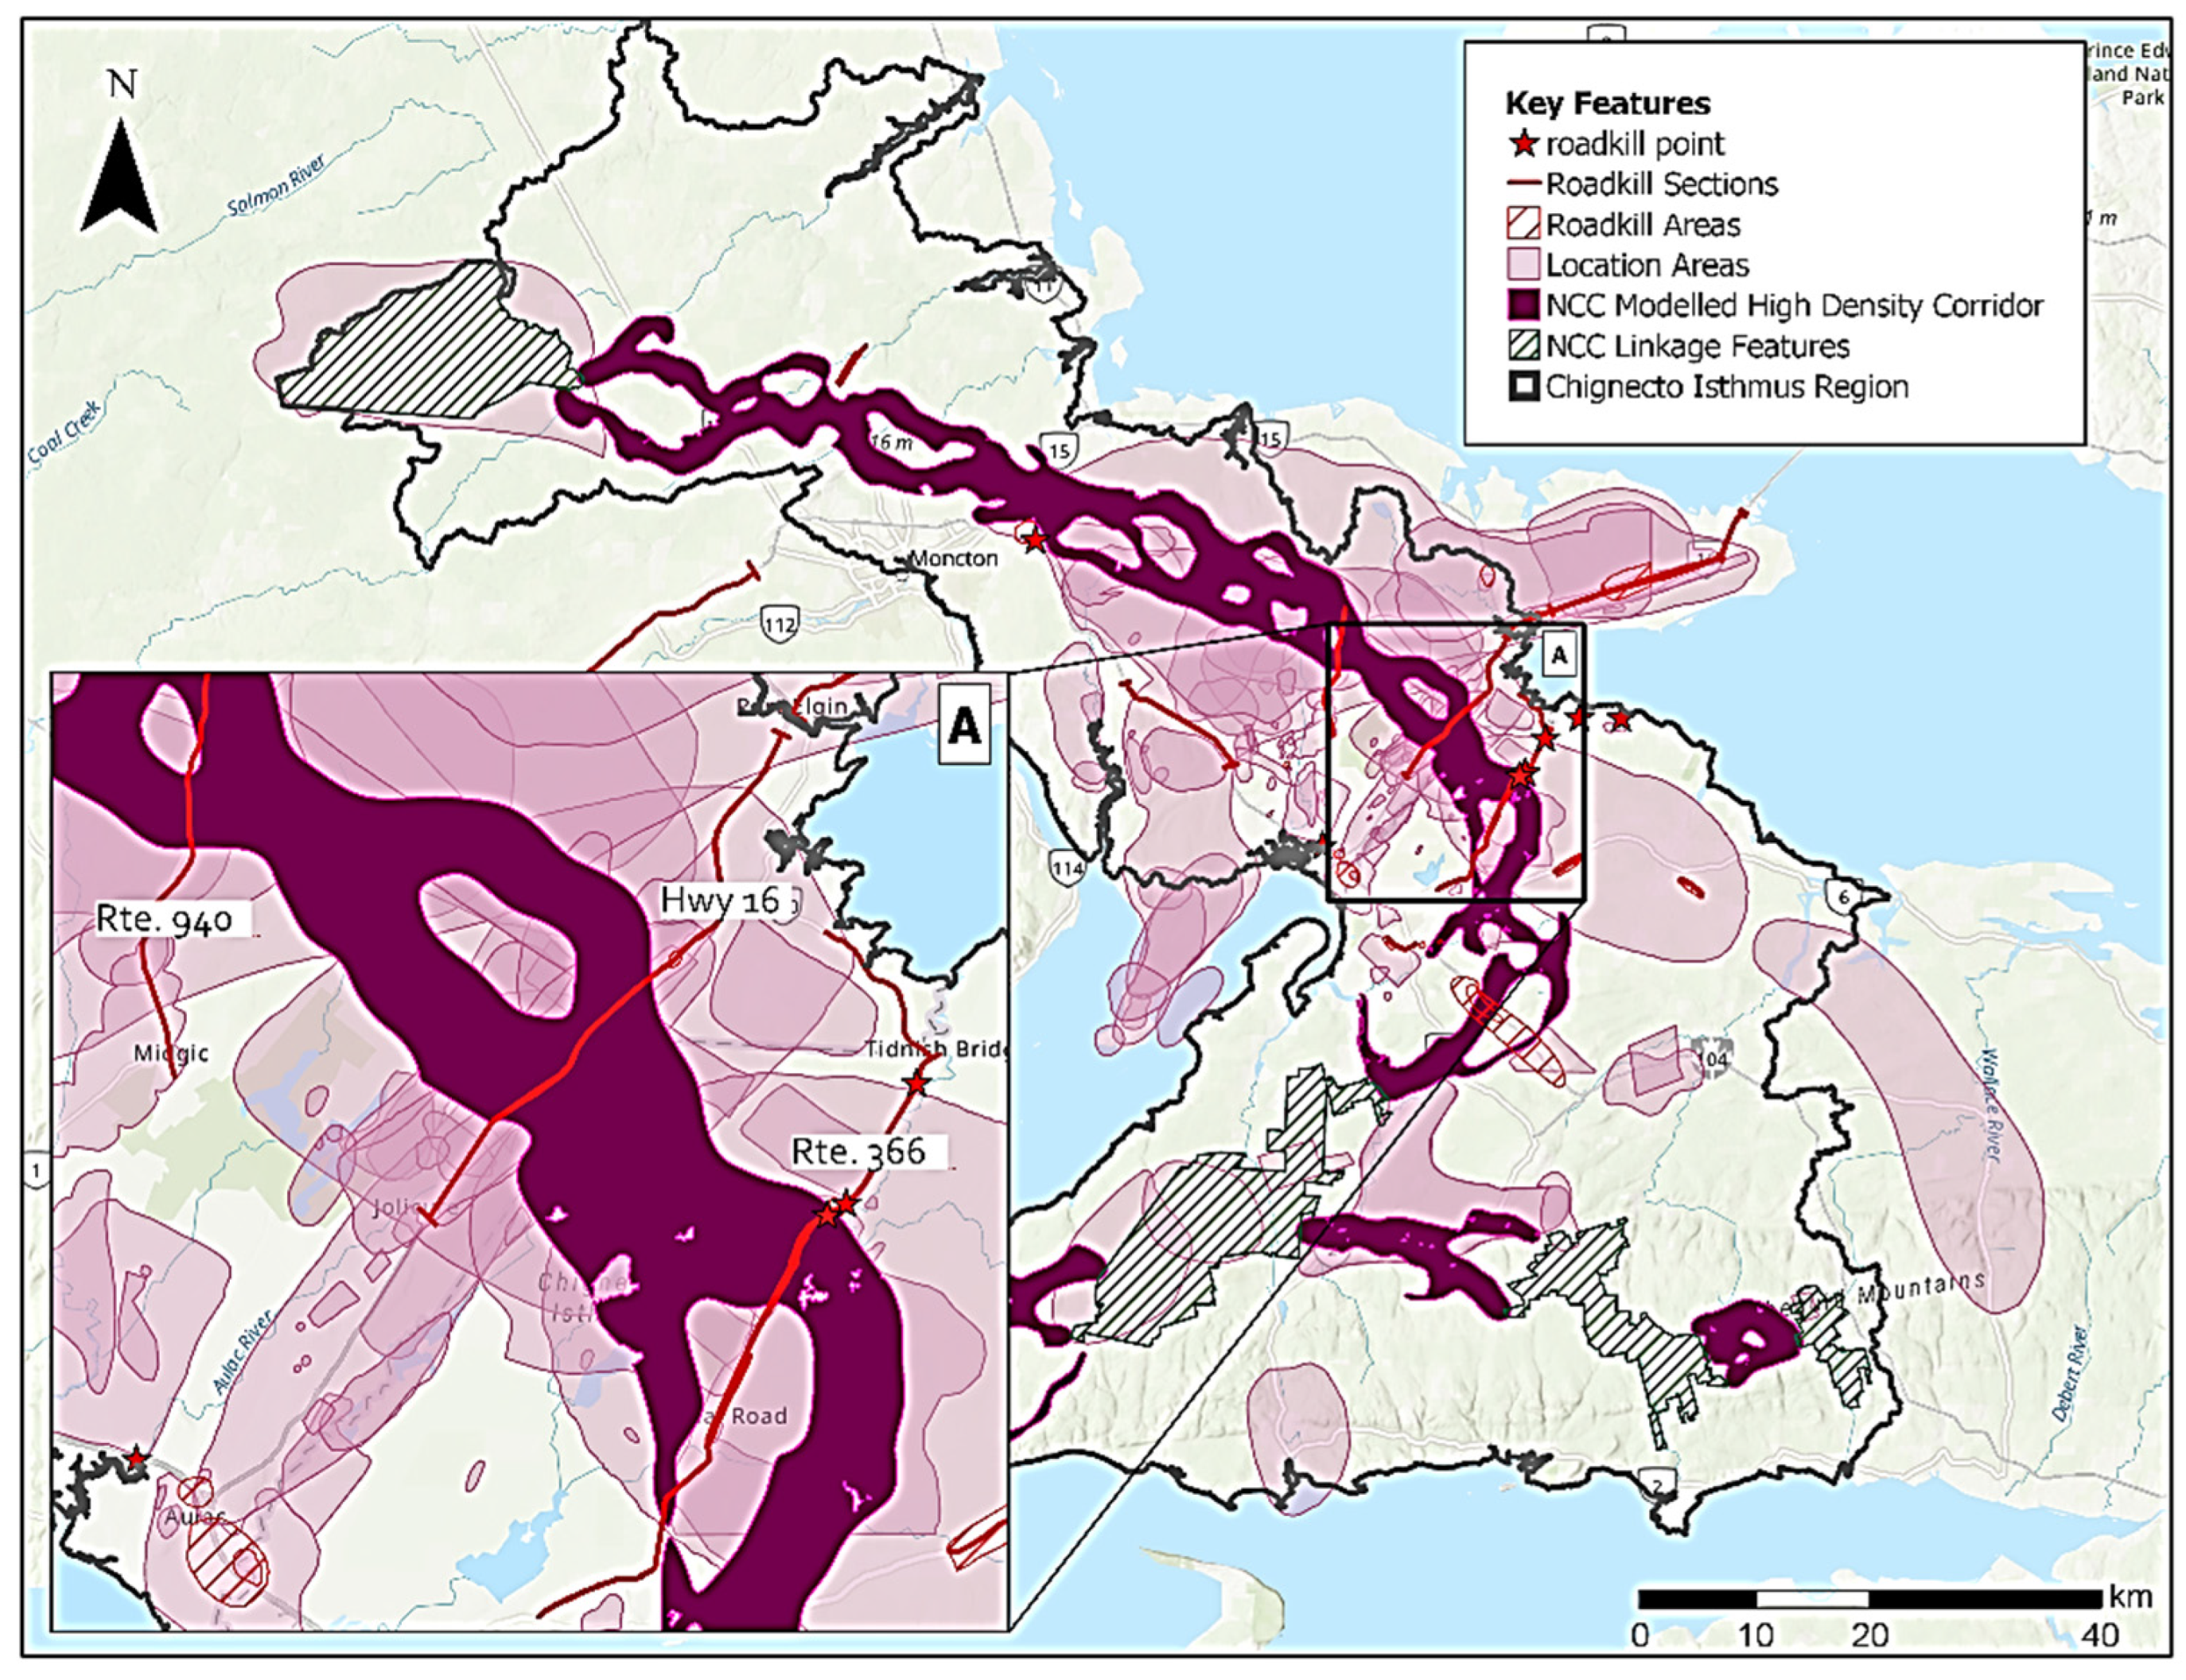
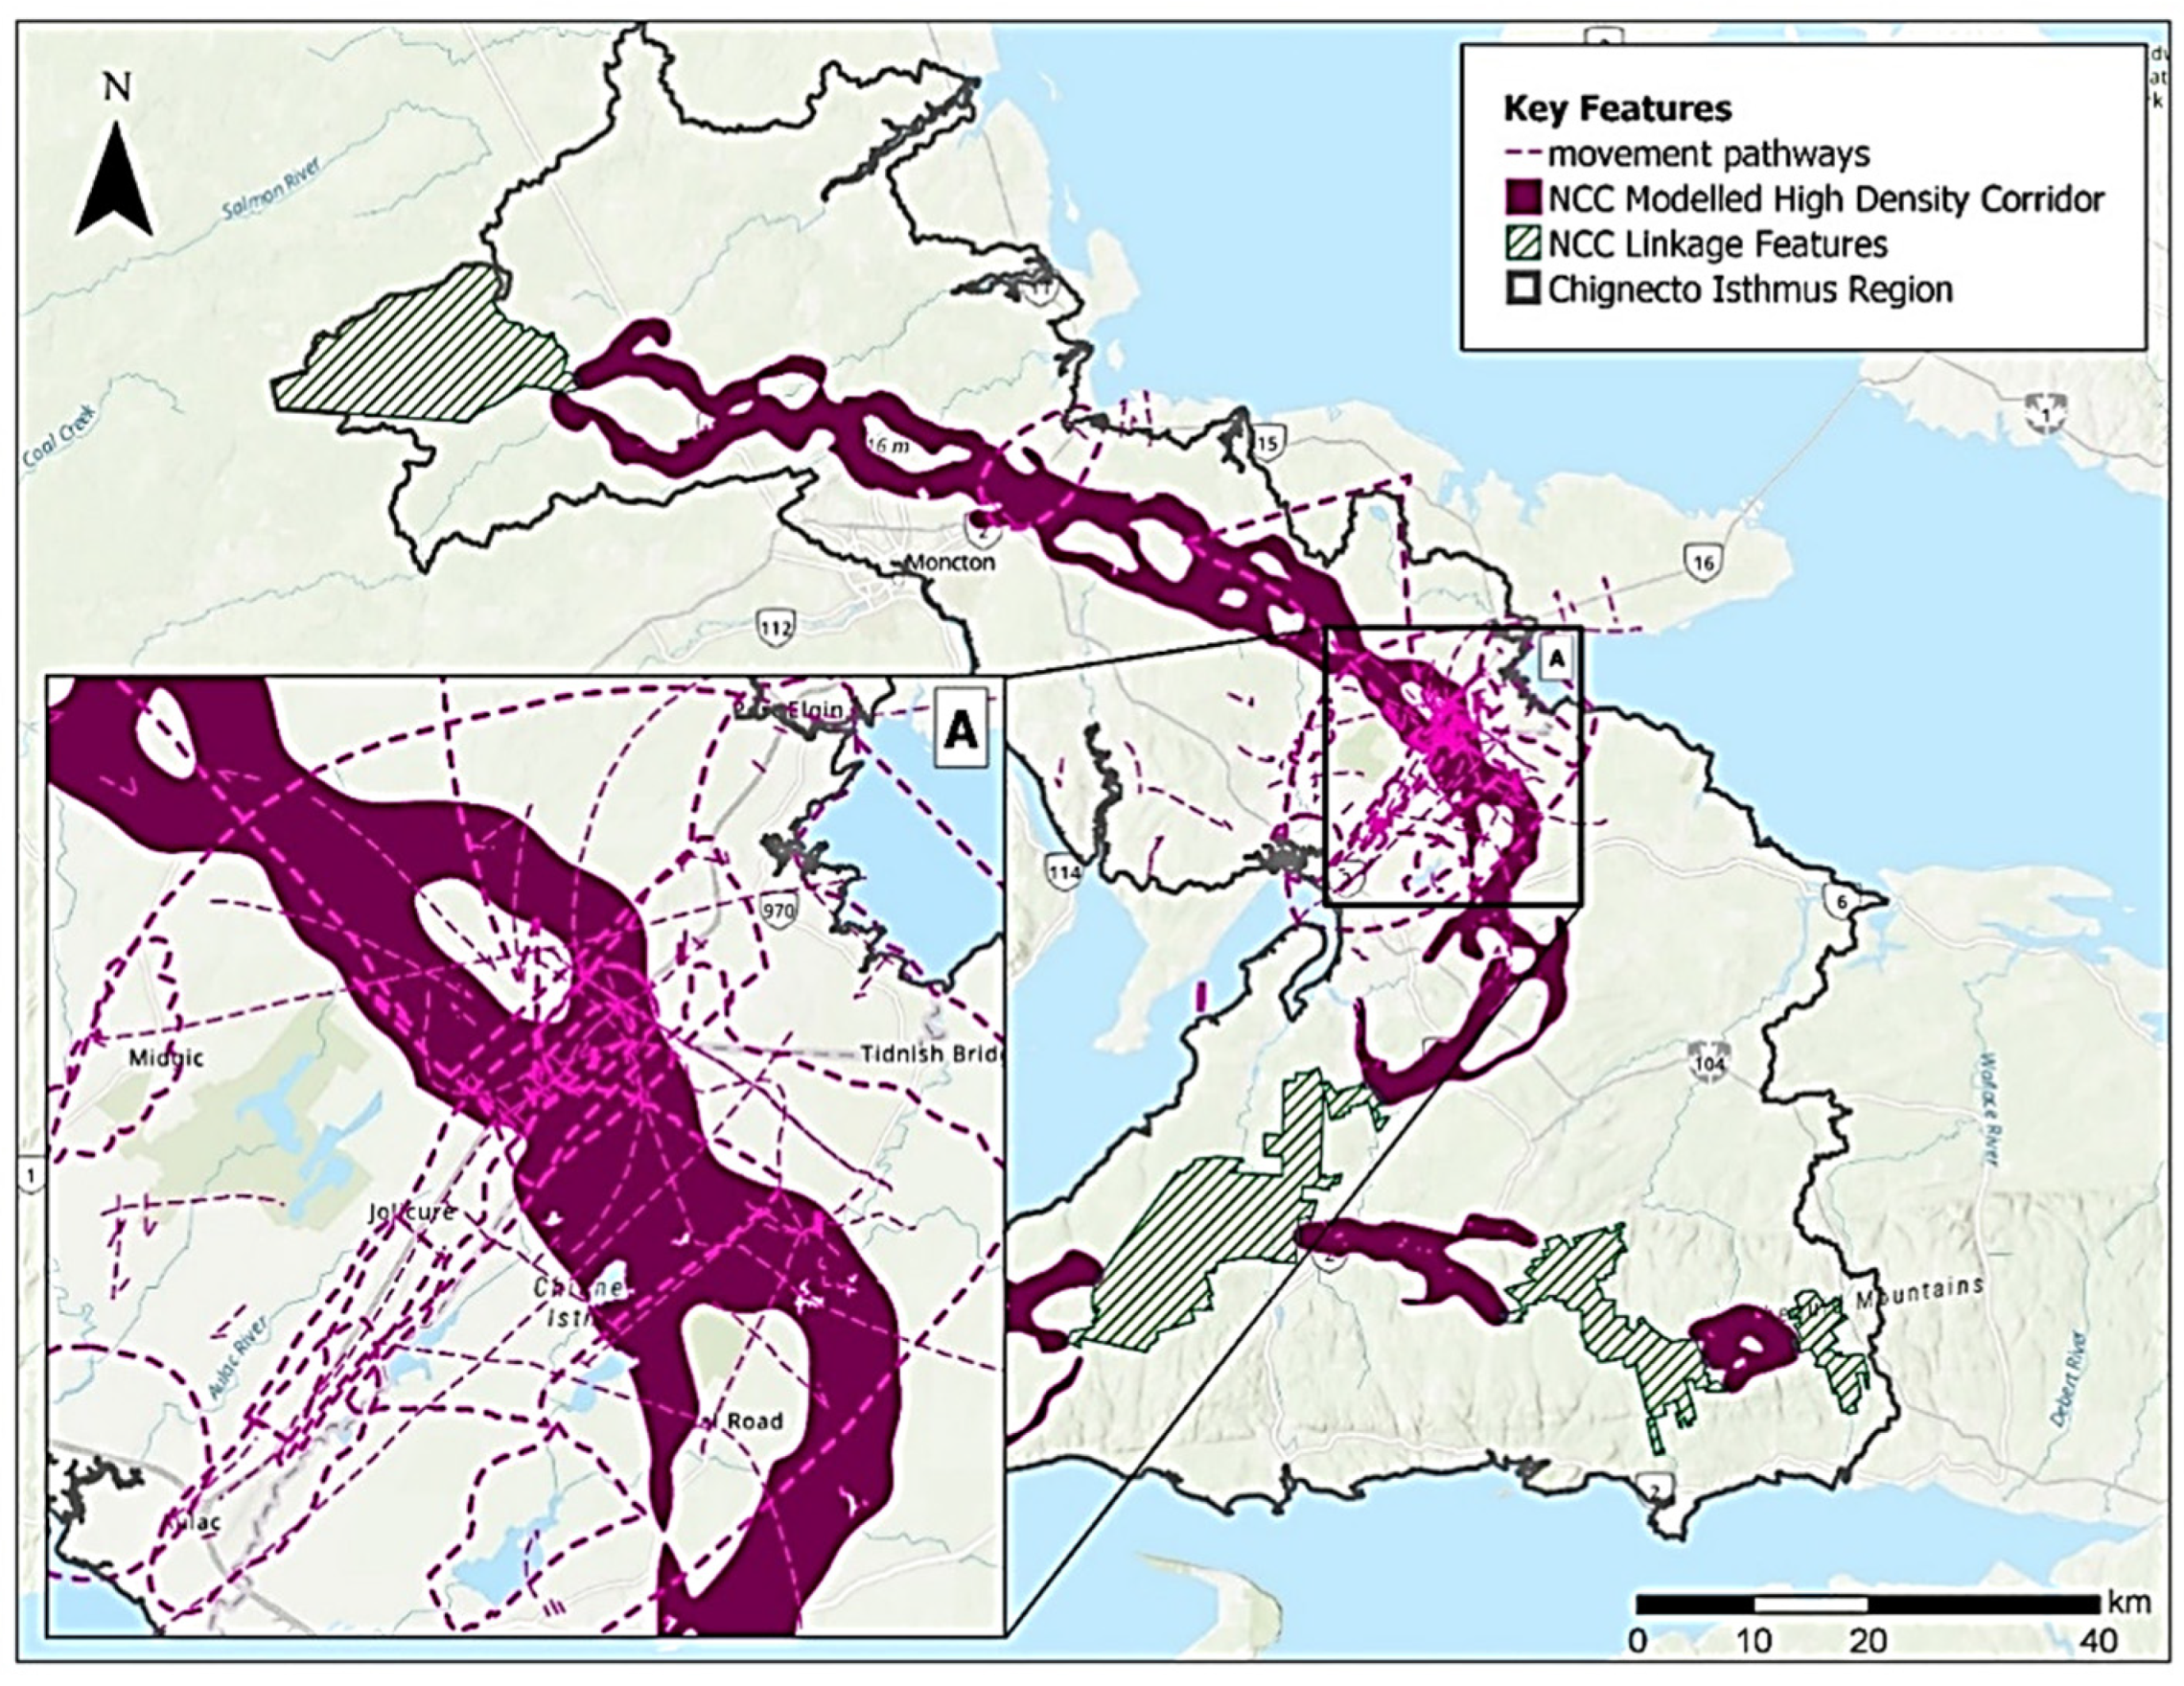
3.3. Comparison with Modeled Wildlife Movement Pathways and Roadkill Hotspots

Local, tacit knowledge maps were overlaid with NCC’s high-probability wildlife movement pathways [48]. This resulted in four additional maps being created and discussed at Workshop 2. Two maps overlaid participatory mapping for moose and bear with outputs from NCC’s population patch, breeding patch and least-cost-path models for these species (Figure 5a,b). Two other maps overlaid NCC’s modelled wildlife movement pathway with participatory mapping of roadkill, habitat, and species occurrence observations (Figure 6) and movement patterns for all species (Figure 7). Spatial similarities were evident when participants’ mapped data were compared to NCC’s modelled outputs for both moose and bear (Figure 5a,b). The existing protected areas used as ‘patches’ to be linked in NCC’s pathway modelling were also identified by participants as habitat areas for several species, including moose and bear. NCC’s modeled suitable habitat and breeding patches8 were also similar to areas captured by participants’ location, habitat, and movement pathway data. Nonetheless, the participants also noted other wildlife movement patterns lying outside of the high-probability movement pathway and other areas for species that were not modelled by NCC.
Participants had identified three major hotspots of roadkill across the NS-NB border that also fall within the NCC’s modelled high-probability wildlife movement pathway (Figure 6). These three major roadkill hotspots were along Hwys 940 and 16 for deer and the Tyndal Road (Hwy 366) for deer, porcupine, bear and coyote. These three major roads run parallel to each other and transect areas identified by both participants and the modelled data as areas of wildlife movement and habitat. Deer presence and abundance was noted to be concentrated along the NS-NB border in the agricultural belt along Hwy 16 between Point de Bute and Baie Verte as well as in another pocket East of Hwy 940. Deer movement was reported as heavy between habitat patches alongside Hwy 16, with increased roadkill occurring during spring movements from wintering areas. Roadkill hotspots identified through roadside field surveys conducted in the region in 2018 [49,50] revealed overlap with road sections that intersect with NCC’s modelled high-probability wildlife movement pathway. Some of these overlapping areas are also consistent with movement and roadkill observations indicated by participants including areas highlighted along Hwy 366 and Hwy 16 (Figure 6). Most of the species movements mapped by participants converge into a major pinch point across the border, as in NCC’s model (Figure 7). There was group consensus that their compiled spatial data bore strong similarities to the modelled outputs, with no outliers or glaring differences to address between the two sources of information. NCC’s modelled pathways aimed to optimize landscape conditions and minimize movement costs for the suite of species considered, including bear and moose, which participants also mapped. The similarity in patterns seems to suggest that the participants and the modellers have consistent understandings of the conditions favourable to these species and where they occur on the landscape. It likely also reflects the somewhat limited options for wildlife in making their way through the region.
The conversation transitioned to possible factors as to why the observed trends were occurring, particularly pertaining to the types of landscape changes impacting wildlife movement. Once again, forestry impacts dominated the conversation (i.e., excessive clearcutting, use of herbicides and logging roads). Participants reported increasing human access into once remote spaces through the development of access roads without restrictions on recreational users. Concerns were also raised about increased highway and road traffic in general, which they attributed in part to increased tourism. Little regard for speed limits by many drivers on some of the highways was noted, with participants recommending better outreach and mitigation in terms of signage to raise awareness of high vehicle-wildlife collision risk. Overall, landscape changes were considered the major driver of wildlife locations and movement patterns, most often as direct limiting factors and barriers, but also including indirect effects such as those related to increased disease and ticks.

3.4. Emergent Themes

3.4.1. Species of Conservation Concern

Participants agreed that moose are of conservation concern in NS, though plentiful in NB, and bear are increasing everywhere. They were relatively silent on conservation concern for other specific species, though concerned about general declines. Less clear, though a recurrent theme in conversations, was the question of whether deer are a nuisance or a species of conservation importance. A total of 126 points, lines and polygons were mapped during individual interviews to indicate habitat, locations, movement and roadkill for deer. While some viewed deer as pests who yard in their pastures and feed off their crops, in some cases these same participants also talked about deer in a positive light, indicating a complex relationship. Others simply enjoyed the sight of deer on their property and the opportunity to photograph them. Regardless, deer were talked about widely across all participants, who perceived the species as having the potential to shed light on key landscape changes and habitat fragmentation in the area. As noted by a local wildlife biologist, “…not that deer are endangered. That is not to say they’re not important … It [deer] became a symbol of the corridor and the deer told that story. I don’t know if you’d call it a keystone species, … but I think it’s a good indicator of why that corridor is important” (P15).
Participants also spoke to interactions between deer and moose, recognizing them as ‘competing’ species, and further, that they cannot inhabit the same space due to the detrimental impacts of a ‘brain worm’ on moose, which is a parasite (P. tenuis) carried by deer but deadly to moose (for a description, see [8]). They acknowledged that deer and moose have different habitat requirements and that landscape changes from agriculture, forestry, roads, and other activities have favoured deer and caused incursions into or overlaps with moose territory. At the same time, however, several noted that forestry activities also negatively impact deer, such as by interrupting their ability to move through areas or find suitable habitat and feed. As such, many saw deer as an indicator of the severity of the adverse impacts of landscape change and current forestry management practices for other, more sensitive species (P2, P4, P10, P20). These perceptions are consistent with those reported for these species more generally in NS and elsewhere (see, for example, [8,122,125,131,140]).

3.4.2. Species and Ecological Interrelationships

References to ‘totality’ and interconnections were prevalent among participants, who acknowledged that ecological systems are intricate and complex, and therefore you cannot focus on one component alone. For example, “So, in terms of the Isthmus—in terms of the ecological things you can think about—it is so important, eh? … [J]ust the … different species, and so on” (P3); and,
[I]f you get anybody out and then try to have a connection—let them have a connection and see that—what connects to what, like that salamander connects to that—it doesn’t matter how big a snake, … anything. It all starts down here. You know, moss and the grass and then, you know, like, you gotta look at the whole picture (P27).
Participants recognized that wildlife, resource management systems and social interactions do not act independently and are intricately connected in the landscape. Such observations are reflective of systems thinking [141] and social-ecological systems frameworks [82,142], in which humans are intertwined with their environment. They situated the wildlife patterns within the complex social-ecological systems of the region, enriching existing data and models. During an interview, one participant, a wildlife rehabilitation technician, remarked, “[F]ew biologists will sit down and look at these issues in their totality, … and that’s what a project like this can do, is bring some clarity to those kinds of issues” (P29). Recognizing what the project can do—situating formal data within broader local tacit forms of knowledge to bring context, clarity and utility to decision making—is consistent with social-ecological-systems thinking, as is its representation through participatory mapping [81]. The value of the larger story and inclusive knowledge mobilization was acknowledged by participants, such as in stating that “the problem is we have a lot of environmental groups and activists out there that don’t know what the story is …. So, what you’re doing is telling the story” (P29).
Participants are not naïve about the social-ecological complexities of the situation, however, and noted challenges associated with the geographical extent of the Chignecto Isthmus, recognizing it encompasses multiple jurisdictions. Not only do ecosystems vary across the region, but so do institutional mandates, policies and social relations, creating problems for conservation governance, as pointed out by [143]. The scale of the challenge, especially when considering the role of human values and pragmatic factors inherent to decision making, is recognized by participants:
I mean, it’s a massive undertaking. It’s so complex and distanced from the realities in nature. The arguments, like, should we stop spraying the forests to protect the deer, when in both instances they’re both invasive issues? … We’re no longer making choices of environmental stability; we’re making choices of preferences over things that will make it (P29).
Adding to the complexity and urgency of the situation are uncertainties and measures needed to adapt to sea-level rise in this mostly low-lying, coastal region, both for wildlife and human infrastructure.

3.4.3. Sea-Level Rise

At the outset, our study assumed sea-level rise as a ‘given’, rather than as a research question. Accordingly, we did not ask participants specifically about the effects of sea-level rise. Regardless, several participants spoke about ‘water’ levels being an impediment to wildlife movements due to the large extent of wetlands and marshes and many streams and undulating coastline in the area. At least one participant fully recognized the effects of climate change and sea-level rise on movement pathways, associating it with the funneling effect on wildlife movement visible in Figure 3.
And it’s also the highest point of land on this size of the Isthmus. This is 350-foot elevation. And that’s kind of important for looking at climate change and, you know, sea-level increases. Because, essentially, that elevation works like this: the elevations go from here, up through the top of this area here, which is the ridge—Jolicure. So, this is the highway and this is all, of course, relatively low compared to sea level, here. So, that kind of constitutes an important movement area, especially with the climate-change stuff happening (P27).
The ridge of higher elevation traversing the Isthmus was recognized as an important movement pathway for animals; participants recognized it as a safe passageway for animals who could not make their way through boggy or wet areas. Although not all participants linked it to sea-level rise, some went on to elaborate that part of the change on the Isthmus was associated with water levels and that these water levels affected not only human activity but also influenced animal movements and wildlife populations (influencing decline of some species while others became ‘overpopulated’). The importance of the higher elevation area for movements was linked with seasonal effects on wet areas at lower elevations. Observations associated most wildlife movements with the higher ridge of elevation, while recognizing that wetter areas are used in the winter when the water and land is frozen, facilitating traverse over firmer terrain: “… [T]here’s seasonal travel through this wet area, … Yeah, that would be of concern to some species. And once you get up to here [inland], I know there’s a rise in elevation, there’s more forest” (P12). Terrestrial ungulates (i.e., deer and moose) were reported to move through water on occasion but only in areas with adjacent habitat for landing and shelter. Participants widely noted the negative influences of forestry practices on cover habitat and associated this loss of habitat with influencing movement not only in the obvious ways (e.g., cutting out the forest, fragmenting the landscape) but also by no longer providing landing sites for possible movements through water, which may be further exacerbated by rising water levels in the region.
There’s definitely a seasonal component, actually, to the animal movement through here, in my opinion. I hear—people would tell me stories when I was doing the wind farm bird surveys, they were telling me that—this is a long time ago, probably in the 1960s—they had this moose going out to the, to the water and swimming over here to this peninsula. And they, they saw it …. But I don’t think it’s happening today (P12).
Other participants also recognized that changing water levels, particularly deeper levels, pose movement challenges for particular species (i.e., deer, bear, coyote, small mammals). Deeper water is recognized as a direct barrier to movement: “They [deer] could cross over [but] it’s pretty deep water, so they’re not likely going across here because of that barrier” (P8). Some observed increases in siltation and how this has influenced water levels in the region, especially pertaining to rivers and the Bay of Fundy. Participants noted fish populations and movements as being affected by receding waterlines and muddied shorelines. Impediments to deer movements along shorelines of rivers to cool off and to access food and water were also noted as of concern, with muddied shorelines affecting their ability to walk.
Into the Bay of Fundy. This is a tremendous change here, over the last 4 or 5 years.… I go down there every year … [W]e used to walk the shore. Can’t walk the shore anymore. There’s a tremendous influx of silt, here, and the only open water now is over by the fields on this side…. On this side, this is all silted in. There’s a tremendous amount of silt here, and that’s 4, 5 years.... We suspect—my friend and I—that it’s come down the Petitcodiac River after they opened the causeway. Yeah, and there was a lot of silt accumulated there …. [T]here’s a tremendous, tremendous change there. That’s probably going to be good for the shorebirds but it’s just muck. You can’t walk. It [deer] would be a fool to walk on it. But, uh, it’s changed tremendously. (P1)
One participant spoke directly to the tenuous circumstance provided by the prevalence of water, recognizing the importance of the land bridge and associated infrastructure such as dykes to maintain terrestrial connections through the Isthmus, for both social and ecological reasons.
Yeah, without it, NS would become an island …. [T]here are big parts of the Isthmus that are protected by dykes; and, uh, if the dykes fail or the dykes are breached, NS will very quickly run out of what they consume and buy in the store. The railway, the rail line, is right across the Isthmus and all the roads go across the Isthmus …. So, the only connection NS would have to the rest of us in the case of breached dykes would be by air! But also, there’s some very interesting wetlands up through the Isthmus. The Chignecto, … the Missaguash River and all the complex of lakes and so on. The Isthmus is—it’s an interesting canoe ride, to go from … Point de Bute … to Hall’s Hill. (P5)
Observations like this recognize that sea-level rise presents an important current and future context for wildlife in the region. They are consistent with studies showing that sea levels are rising, storm surges and flood events are increasing, and the land is subsiding due to post glaciation isostatic rebound [64,69,71,73]. As such, the already narrow land connection between NS and the remainder of North America is predicted to be much narrower and in instances of storm surges potentially severed completely, as has occurred at times in the past. Although our intention was not to address this issue explicitly, participants raised it nonetheless. It supports the rationale for generating local insights on current wildlife populations, locations, and movement pathways within the context of larger social-ecological contexts, to provide more inclusive knowledge systems as baseline data for various conservation and other planning responses to sea-level rise in the region.

4. Discussion

Knowledge creation such as in this study is important for conservation planning, particularly for connectivity conservation across broad landscapes of complex social-ecological systems. The use of local tacit knowledge and participatory mapping represents a rich contribution towards a unique and robust dataset for conservation planning, research and decision making. Using participatory research combined with geospatial technologies has provided a method to generate local tacit knowledge and represent its spatial components within a GIS, serving to enrich and address current gaps and limitations in formal-natural-science data and models. The contributed local knowledge provides insights into historical and current distributions, abundance and status of wildlife populations in the region, similar to findings elsewhere in NS [144]. The engagement of knowledgeable community members was effective for eliciting and incorporating social and ecological knowledge. As observed by a renowned farmer and naturalist in the region during the second workshop, the dataset that we have been able to create through the collaboration of a diverse group of local knowledge holders is probably “the best available data” for illustrating trends and patterns for this region (P5). There was overwhelming support and buy-in for the participatory process we used to collaborate with local knowledge holders. The process incorporated a bottom-up approach, allowing for local participation, consensus building and the inclusion of local knowledge in the research.
The multi-directional learning relationships facilitated through our approach has led to increased awareness among participants about wildlife locations, populations, habitats and movements and threats to their persistence within the region. It has fostered and enhanced participants’ interest and investment in conservation priorities across the Isthmus, providing a spatial focus for conserving key areas. Each participant created spatially referenced maps representing their lived, individual experience by employing overlay drawing onto topographic maps. Together they identified areas of combined experiences, noting strong, validating consensus, and thereby gaining confidence in their knowledge and its potential use in decision-making processes. Not only did the methods serve to elicit spatial data, but the maps served as a method to facilitate conservation knowledge sharing throughout the interviews and workshops. Participatory mapping has been commonly used to create ‘sketch maps’ for such purposes [145,146,147]. Our use of maps increased participant involvement during the interviews and workshops by providing an anchor for the dialogue to revolve around, furthering conversations, and stimulating memories through the process, as was found by Boschmann and Cubbon [145]. Participatory GIS methods such as ours have been identified as serving to democratize research and planning processes [148,149,150,151] and build consensus between stakeholders and land use managers [152,153]. Knowledge exchange plays a key role in conservation management by facilitating the social, environmental and economic impacts of research [29,30]. Not only is knowledge exchange critical to research during knowledge production and disseminating phases, but also during mobilization and translation for policy planning and decision making.
Inclusive knowledge systems and participatory mapping approaches such as those applied in this study can help to guide knowledge production and contribute to novel solutions to conservation challenges at the intersection of human and natural systems, consistent with findings in environmental management in general [28,83,84,85,154]. Significant work has been done in the realm of PPGIS to operationalize concepts that bring social-ecological systems into spatial mapping frameworks [81] and our study contributes to the field. Conservation planning approaches recognize the need to embrace local knowledge along with formal science data and models and to utilize participatory methods to not only increase local participation, but to improve the validity of knowledge across spatial scales [56]. A critical step to overcoming barriers to knowledge exchange is improving access to information to allow the co-production of knowledge for use by decision makers [29]. Research such as ours facilitates local knowledge exchange and provides the opportunity to contribute to evidence-based decision making in the region, responding within a timeline that can directly impact conservation planning, as urged by Lemieux, Groulx, Bocking, & Beechey [155].
Local engagement and findings generated through our study are timely for supporting on-going work of NCC and partners in the NS-NB Community-Nominated Priority Place [59], national efforts through the Pathway to Canada Target 1 Connectivity Working Group [156], the New England Governors and Eastern Canadian Premiers’ Resolution 40-39 Working Group [157] and the joint NS-NB and federal feasibility study on infrastructural adaptations to climate change [74] among others. Opportunities to put this information into the hands of the decision makers and have the voices of key local people from across the region included within the decision-making process have been heightened through the research. The relationship between knowledge and decision making has become increasingly important in scientific literature recognizing that there needs to be a convergence of disciplines in order to properly address complex environmental management problems [29]. Several contributions of the conservation social sciences, as outlined by Bennet et al. [79], are highlighted throughout our research including facilitated learning of conservation challenges and the innovation of novel models for conservation through engagement of local knowledge holders. Our methods represent a generative effort to better enable and improve conservation data, models and planning. Such applications are vital to guiding processes with the best available and robust set of information [79].
Collaborative approaches have been recommended to help improve evidence-based decision making and this extends to conservation planning. Often, however, there is a disconnect between research and planning for conservation. To address the disconnect, research should match the evidence needs for conservation priorities [155]. Our research comes at a timely manner to address current concerns in the Chignecto Isthmus region surrounding climate change, biodiversity conservation and infrastructural adaptations such as those to be addressed in the feasibility study on the transportation corridor. Sea-level rise poses a heightened predicament for the tenuous land bridge provided through the Isthmus to people and wildlife. This threat highlights the need to think proactively about conserving and restoring wildlife habitat connectivity through this restricted land base, especially in light of current projects aimed at ‘engineering solutions’ to safeguard and adapt highways and other human infrastructure. Adaptations are likely to entail in-land relocation of some infrastructure to higher elevations and raised levels of others in place, such as for roads and dykes to remain above water in flood events and coastal inundation scenarios. Such adaptations are likely to further fragment habitat and restrict wildlife movement. On the other hand, engineered solutions, if planned with wildlife in mind, may provide heightened opportunities to mitigate barrier effects and other threats that infrastructure such as roads, railways and wind farms currently pose to wildlife populations, habitat, and movements.
Many known social and ecological issues intersect in human-wildlife systems. Within the Chignecto landscape it is important to identify key wildlife features (populations, habitat and movement patterns) so that they may be considered in conservation planning and infrastructural adaptation studies. Local knowledge has been shown to improve understanding of species distributions and the factors that influence them, especially where recent shifts in these trends have occurred that are not yet captured in scientific data [88,144,158]. Such up-to-date knowledge is critical in situations when timely conservation planning is required, such as in response to imminent threats (e.g., sea-level rise), sudden opportunities (e.g., infrastructure adaptation studies) and urgent priorities such as recovery of endangered species (e.g., NS Mainland moose) [144,158]. In our study and others [158,159], local tacit knowledge has proven successful in identifying species distributions, movement patterns and influencing features and processes within the study region, offering valuable information for planning and management.
While scientific data and models can reveal high-probability wildlife movement pathways or barriers to movement through the region, underlying factors as to what may be attributing to these spatial patterns can sometimes be left to speculation. Model outputs such as maps are limited by the accuracy, relevance and completeness of the data and are influenced by the optimization rules that drive the analysis. Such model outputs are powerful tools, yet they largely remain out of context of the complex social-ecological systems. Local tacit knowledge can help to explain the underlying ‘why’ of certain phenomenon in a region: what external and acting factors are directly impacting wildlife movement pathways, pinch-point locations, roadkill hotspots and other phenomena? The local knowledge generated through this study therefore not only contributes to a more robust dataset but provides additional explanatory context for the patterns and changes. In the Chignecto Isthmus, for example, NCC’s model detected land-cover types and roads based on the best available georeferenced spatial data and projected habitat suitability and potential wildlife movement pathways based on these data. Local participants enriched and complemented these data, expanding upon the impacts of landscape changes on wildlife, such as due to forestry practices, road access and traffic, water levels and siltation, as well as human activities such as poaching and wildlife interactions, such as between moose and deer. Local knowledge also effectively reflected accelerated changes. One participant (P29) noted and another (P30) concurred that since moving to the Chignecto Isthmus,
[W]e have really been recognizing just how important this area is because of animal movement, thinking how much small little sections of land are responsible for having to move so much land-based animals, and when you think of the type of traffic that’s happening here …, the amount of change that we’ve seen in terms of development and car usage, it’s insane (P29).
Our findings provide cross-validated information for delineating priority wildlife habitat and connecting corridors within the Chignecto Isthmus. The process has fostered a diverse base of local champions for wildlife conservation. The next step is to disseminate and mobilize the findings to inform future decision making for conservation planning and land and resource management in the region for a long-term outcome of enhanced human-wildlife co-existence.

4.1. Limitations

Some limitations exist when using local knowledge in this study [108,115,160]. There were moments when participants were hesitant to draw on the base maps in fear that the spatial data they would provide wouldn’t be in the exact location or area or that they may be remembering certain events wrong. The ‘shifting baseline syndrome’, a concept coined to explain knowledge extinction, occurs when the knowledge of the past is lost and the human perception of biological systems changes [90]. As such the analysis may be limited by the accuracy and reliability of shared information. On the other hand, there was strong group consensus among the local participants and good agreement with NCC’s formal science model and roadkill hotspots identified through roadside surveys [49]. Insights from the Mi’kmaq, if participants had been recruited, may have provided longer term insights, and most certainly would have enriched the diversity and inclusiveness of the knowledge emerging from such co-production.
As the livelihoods of many of the participants are linked to their knowledge of the land for hunting, trapping, farming and logging, the data could be seen as inherently biased. This may lead certain participants to talk more about one species than another. For example, a wildlife photographer enjoyed photographing black bears and much of the data represented areas where black bears may be spotted. As such, there is potential over-representation of certain species due to factors also recognized by Loftus & Anthony [90]: personal preferences for certain species, strategic choices in locations of travel and the ease of seeing or noticing a species. When interpreting results for wildlife conservation planning, it is important to acknowledge that the species and habitats are directly connected to the livelihoods and pastimes of participants.
There are some limitations to using participatory methods to gather local spatial data [108,115,160]. Fuzzy boundaries are prevalent throughout the data and it was sometimes difficult to discern class boundaries between mapped spatial phenomenon. Inaccuracies in the spatial data collected may result in inaccurate definitions of classes and assignments of phenomena to a class, which may raise uncertainties about the precision of the data and ultimately impact decision making [160,161]. How participatory data represents participants’ and researchers’ interpretations of certainty and ambiguity is important: fuzzy data should not be misrepresented as being precise and accurate [160]. Spatial reality in PPGIS is always fuzzy, and the accuracy and precision of data collected through participatory mapping methods when drawing on maps will also be impacted by factors such as scale and resolution [115]. How to represent and interpret fuzziness was an important concept to frame for this study. A series of decision-making steps and guidelines were followed consistently when choosing how to classify points, lines, and polygons of mapped data into their categorical bins for mapping and representing spatial knowledge. Of course, this interpretation is unique to the classifier of data, using their best ability to accurately represent each participant’s individual data.
In studies such as ours that engage relatively small numbers of participants in in-depth and qualitative explorations, questions may be raised about the representativeness of the sample and the generalizability and validity of the results. In our study, 34 participants with deep long-term experience of the region’s land and wildlife shared their knowledge through interviews and participatory mapping. Eight of these individuals participated in two subsequent half-day mapping workshops. These participants likely represent a relatively large proportion of our target population—those with deep experiential knowledge of the land and wildlife—in this rural area: nearing the end of our recruitment phase, no additional referrals were emerging from our purposive, snowball sampling method. Near the end of the interviews, no new data were being contributed, which suggests that data saturation was reached. As a qualitative study, we were not aiming for statistically significant results or findings that may be stratified or generalized to the broader public. As such we are confident that the number of participants was sufficient to generate consensus-based insights about local knowledge on the subject. Although the participants represent a relatively small portion of the general public, their voices could potentially be disproportionately influential due to their knowledge base and locally recognized expertise. Now that they are more aware and confident in their insights as a consequence of participating in our research process, they are likely better positioned to influence local people and communities and related planning around wildlife, habitat and connectivity conservation in the region.

4.2. Future Research

While our study did not focus on assessing landscape changes due to climate change and related sea-level rise, some participants spoke to ‘water’ levels and temperature increases as potential reasons for wildlife declines and impediments to movements. Comprehensive studies assessing changes in water levels, temperatures and associated impacts on habitats and ecological corridors in the region do not exist. Similarly, impacts of forest clearcutting and forest roads on wildlife presence and movement pathways have not been assessed in the region, though many participants highlighted such relationships as a central concern, as did an independent review of forestry practices in NS [131]. Quantitative data on landscape changes, irrespective of cause, similarly are not readily available nor to our knowledge have they been previously assessed at this scale. It is certain that the clearing of forests and construction of roads and dykes over the 400 or so years since Euro-American settlement have dramatically affected landscapes in ways that are important to wildlife, yet these have not been quantified in the region. In a petition to the colonial government in 1853, however, Mi’kmaw leaders expressed their concern with widespread changes throughout Mi’kma’ki:
The woods have been cut down; the moose and the caribou, the beaver and the bear, and all other animals, have in most places nearly disappeared …. So that it is now utterly impossible for us to Obtain a livelihood in the way our creator trained us
([162] (n.p.) as cited in [141] (p. 9), citing [163] (p. 111)).
To our knowledge, roads and dykes have not often or recently been ‘relocated’, per se, as a result of sea-level rise. Such complex inter-relationships and impacts warrant further analyses and some may well comprise portions of the ‘engineering solutions’ study currently being conducted in the region. In the meantime, our findings serve to enrich the socio-ecological baseline data (while pointing out important gaps) so that future planning for road, dykes or other infrastructural relocation may avoid ecologically important lands, specifically those that are important to wildlife connectivity.
More proximately, the next steps in our study aim to further develop inclusive knowledge systems and their engagement in conservation efforts. To further understand the interrelationships and patterns in knowledge from diverse sources, future research will explore the local knowledge data in relation to element occurrence records for key wildlife species compiled by the Atlantic Canada Conservation Data Centre [164], forestry cover and roads, and model outputs of projected inundation due to sea-level rise. Forthcoming insights gained through our on-going qualitative, thematic text analyses of participant interview and workshop transcripts will be incorporated and shared. Improved understanding about how efforts such as ours that engage local knowledge can lead to local knowledge holders’ support for conservation decisions that emerge from the knowledge sharing process would be beneficial. Important questions also remain about how efforts to engage local knowledge can lead those knowledge holders to further contribute to and participate in conservation efforts. In collaboration with participants, NCC and other partners, we will seek avenues for engaging, disseminating and mobilizing the knowledge gathered through these processes for conservation planning initiatives in the region. Importantly, we will explore opportunities to build relationships and work with the Mi’kmaq, who have lived, deeply immersed, within regional ecologies of reciprocal sharing interrelationships for 15,000 years [165,166]. Their title, rights, laws, governance systems, responsibilities, stories, and ceremonies need to be honoured and their insights would greatly benefit us all [95,96,165]. As signatories to the Treaties of Peace and Friendship (1725–1779) between the Mi’kmaq and Canada, we are all Treaty people [167].

5. Conclusions

The Chignecto Isthmus is a critical land bridge between NS and continental North America, providing connectivity for wildlife populations and human infrastructure. Coastal inundation and flooding due to rising sea level and storm-induced tidal surges threaten this already tenuous connection. Existing wildlife data from formal-science sources are limited and insufficient on their own to support regional conservation planning and on-going studies exploring ‘engineering solutions’ for safeguarding and adapting human infrastructure. Accordingly, our study aimed to generate complementary data based on local tacit knowledge, while enhancing local understanding and capacity for engagement in these local planning processes. To do so, we engaged local people with strong, long-term experiential knowledge of the land and wildlife to participate in map-based interviews and workshops. Thirty-four local people who hunt, trap, log, farm, enjoy nature and others participated in individual interviews with map-based spatial elicitation tools to identify key areas of wildlife habitat and movement pathways across the Chignecto Isthmus. Individual mapped data were digitised, analysed and compiled into a thematic series of maps, which were refined by subgroups of 8–10 of the participants through consensus-based workshop processes.
Locations of key populations and movement patterns for several species were mapped, consisting predominantly of terrestrial mammals, primarily moose, black bear and white-tailed deer, along with a group of other fur-bearing mammals and migratory birds. Strong consistency was observed among the mapped elements, resulting in group consensus despite some uncertainty expressed by individuals about their precision in noting the exact locations. When comparing local tacit-knowledge-based maps with those derived from formal natural science data and models, a strong overlap was apparent. Not only did the local participants verify the formal data and model, but they highlighted areas and concerns outside of the model and their explanations lent complex social-ecological context to its mapped outputs. Further, their engagement in the process resulted in knowledge transfer within the group and increased confidence in their experiential knowledge and its value for decision making. The process also increased their support and buy-in for mobilization of the results for wildlife conservation and connectivity planning, particularly for addressing revealed threats to connectivity from forestry practices (clearcutting and herbicide spraying), roads, power lines, wind-energy farms and increased water intrusion and flooding.
As such, our study has generated spatial and other wildlife data representative of consensus in local tacit knowledge relevant to wildlife connectivity and other conservation planning in the Isthmus region. The process represents a contribution to conservation planning methodologies, in which combinations of scientific data and local tacit knowledge are critically needed, both to provide reliable and locally-supported information for planning and to open up the research and planning process to different ways of knowing and to local communities, in the spirit of inclusive knowledge systems. The findings are relevant to on-going decision-making processes and represent important wildlife information for incorporation into local planning initiatives, addressing gaps in existing formal science data and lending validity to the outputs of computer-based modeling of wildlife habitat and movement pathways. The consistency of data obtained from these local people represents an important outcome that demonstrates and supports calls for greater generation and mobilizing of local knowledge in the scholarly fields of conservation planning and participatory mapping.
Our findings contribute to the growing yet nascent body of literature at the intersection of conservation planning and participatory mapping as means of co-production of knowledge and inclusive knowledge systems. Importantly, it also accesses, generates and makes available local tacit knowledge for conservation planning in practice, particularly for wildlife connectivity in a key linkage area identified as critical at local national and international scales. The findings enrich and complement data from formal natural science models, helping to address their gaps and limitations while providing important explanatory context. At the same time, our participatory mapping approach served to build local participants’ confidence in their combined experiential knowledge and local support for conservation. It seems to have enhanced our participants capacity to serve as local champions for infusing local perspectives of wildlife and other ecological and social values that warrant consideration in conservation and other planning initiatives, such as for human infrastructural adaptations to climate change. Our study demonstrates a way to help build a more inclusive knowledge system grounded in the people and place. It illustrates an effective approach for representing differences and consensus among participants’ spatial indications of wildlife and habitat. It presents a means of co-producing knowledge in participatory mapping for conservation planning. Engagement of local people and their tacit, experiential knowledge of the land and its wildlife provides important insights and means to enrich natural science and foster conservation action for connectivity and human-wildlife co-existence, both of which are key to addressing the twin crises of precipitous biodiversity loss and climate change.

Supplementary Materials

The following are available online at https://www.mdpi.com/2073-445X/9/9/332/s1, Interview Guide S1.

Author Contributions

Conceptualization, K.F.B. and J.L.N.; methodology, K.F.B., J.L.N. and V.P.P.; original draft preparation, J.L.N.; writing, reviewing, and editing, J.L.N., K.F.B. and V.P.P.; supervision, K.F.B.; funding acquisition, K.F.B. All authors have read and agreed to the published version of the manuscript.

Funding

This research was funded by the Social Sciences and Humanities Research Council of Canada (Insight Development Grant #430-2018-00792) to K. F. Beazley and NCC collaborators, C. Smith and P. Noel, with in-kind support from NCC. Student funding was also provided by Faculty of Graduate Studies, Dalhousie University. Approval was received from Dalhousie University’s Social Sciences Research Ethics Board (2019-4763).

Acknowledgments

The authors thank the 34 local participants who contributed their time and insights and our NCC collaborators, C. Smith and P. Noel.

Conflicts of Interest

The authors declare no conflict of interest.

References

  1. Heller, N.E.; Zavaleta, E.S. Biodiversity management in the face of climate change: A review of 22 years of recommendations. Biol. Conserv. 2009, 142, 14–32. [Google Scholar] [CrossRef]
  2. Worboys, G.L.; Ament, R.; Day, J.C.; Lausche, B.; Locke, H.; McClure, M.; Peterson, C.H.; Pittock, J.; Tabor, G.; Woodley, S. (Eds.) Advanced Draft, Connectivity Conservation Area Guidelines; International Union for Conservation of Nature (IUCN), World Commission on Protected Areas: Gland, Switzerland, 2016. [Google Scholar]
  3. Woodley, S.; Bhola, N.; Maney, C.; Locke, H. Area-based conservation beyond 2020: A global survey of conservation scientists. Parks 2019, 25, 19–30. [Google Scholar] [CrossRef]
  4. Woodley, S.; Locke, H.; Laffoley, D.; MacKinnon, K.; Sandwith, T.; Smart, J. A review of evidence for area-based conservation targets for the post-2020 global biodiversity framework. Parks 2019, 25, 31–46. [Google Scholar] [CrossRef]
  5. Hilty, J.; Worboys, G.; Keeley, A.; Woodley, S.; Lausche, B.; Locke, H.; Carr, M.; Pulsford, I.; Pittock, J.; White, J.W.; et al. Guidelines for Conserving Connectivity through Ecological Networks and Corridors, Best Practice Protected Areas Guideline Series, No. 30; IUCN: Gland, Switzerland, 2020. [Google Scholar] [CrossRef]
  6. Watkinson, A.R.; Sutherland, W.J. Sources, Sinks and Pseudo-Sinks. J. Anim. Ecol. 1995, 64, 126. [Google Scholar] [CrossRef]
  7. Dias, P.C. Sources and sinks in population biology. Trends Ecol. Evol. 1996, 11, 326–330. [Google Scholar] [CrossRef]
  8. Beazley, K.; Ball, M.; Isaacman, L.; McBurney, S.; Wilson, P.; Nette, T. Complexity and Information Gaps in Recovery Planning for Moose (Alces Americana) in Nova Scotia, Canada. ALCES 2006, 42, 89–109. Available online: http://flash.lakeheadu.ca/~arodgers/Alces/Vol42/Alces42_89.pdf (accessed on 14 August 2020).
  9. Caprio, M.A. Source-sink dynamics between transgenic and non-transgenic habitats and their role in the evolution of resistance. J. Econ. Èntomol. 2001, 94, 698–705. [Google Scholar] [CrossRef]
  10. Beier, P. Determining Minimum Habitat Areas and Habitat Corridors for Cougars. Conserv. Biol. 1993, 7, 94–108. [Google Scholar] [CrossRef] [Green Version]
  11. Brussard, P.F. Minimum viable populations: How many are too few? Ecol. Restor. 1985, 3, 21–25. [Google Scholar] [CrossRef]
  12. Reed, J.M.; Doerr, P.D.; Walters, J.R. Determining minimum population sizes for birds and mammals. Wildl. Soc. Bull. 1986, 14, 255–261. [Google Scholar]
  13. Soulé, M.E. Thresholds for survival: Maintaining fitness and evolutionary potential. In Conservation Biology: An Evolutionary-Ecological Perspective; Soulé, M.E., Wilconx, M.E., Eds.; Sinauer Associates: Sunderland, MA, USA, 1980; pp. 151–169. [Google Scholar]
  14. Fahrig, L.; Merriam, G. Conservation of Fragmented Populations. Conserv. Biol. 1994, 8, 50–59. [Google Scholar] [CrossRef] [Green Version]
  15. Beissinger, S.R.; Westphal, M.I. On the Use of Demographic Models of Population Viability in Endangered Species Management. J. Wildl. Manag. 1998, 62, 821. [Google Scholar] [CrossRef]
  16. Haig, S.M. Molecular contributions to conservation. Ecology 1998, 79, 413–425. [Google Scholar] [CrossRef]
  17. O’Brien, S.J. A role for molecular genetics in biological conservation. Proc. Natl. Acad. Sci. USA 1994, 91, 5748–5755. [Google Scholar] [CrossRef] [Green Version]
  18. Wayne, R.K.; Lehman, N.; Allard, M.W.; Honeycutt, R.L. Mitochondrial DNA Variability of the Gray Wolf: Genetic Consequences of Population Decline and Habitat Fragmentation. Conserv. Biol. 1992, 6, 559–569. [Google Scholar] [CrossRef]
  19. Krosby, M.; Tewksbury, J.J.; Haddad, N.M.; Hoekstra, J. Ecological Connectivity for a Changing Climate. Conserv. Biol. 2010, 24, 1686–1689. [Google Scholar] [CrossRef]
  20. Chen, I.-C.; Hill, J.K.; Ohlemüller, R.; Roy, D.; Thomas, C.D. Rapid Range Shifts of Species Associated with High Levels of Climate Warming. Science 2011, 333, 1024–1026. [Google Scholar] [CrossRef]
  21. Lawler, J.; Ruesch, A.S.; Olden, J.D.; McRae, B.H. Projected climate-driven faunal movement routes. Ecol. Lett. 2013, 16, 1014–1022. [Google Scholar] [CrossRef]
  22. McGuire, J.L.; Lawler, J.J.; McRae, B.H.; Nuñez, T.A.; Theobald, D.M. Achieving climate connectivity in a fragmented landscape. Proc. Natl. Acad. Sci. USA 2016, 113, 7195–7200. [Google Scholar] [CrossRef] [Green Version]
  23. Hodgson, J.A.; Thomas, C.D.; Cinderby, S.; Cambridge, H.; Evans, P.; Hill, J.K. Habitat re-creation strategies for promoting adaptation of species to climate change. Conserv. Lett. 2011, 4, 289–297. [Google Scholar] [CrossRef]
  24. Margules, C.R.; Pressey, R.L. Systematic conservation planning. Nature 2000, 405, 243–253. [Google Scholar] [CrossRef] [PubMed]
  25. Groves, C.R.; Jensen, D.B.; Valutis, L.L.; Redford, K.H.; Shaffer, M.L.; Scott, J.M.; Baumgartner, J.V.; Higgins, J.V.; Beck, M.W.; Anderson, M.G. Planning for Biodiversity Conservation: Putting Conservation Science into Practice. BioScience 2002, 52, 499. [Google Scholar] [CrossRef] [Green Version]
  26. Pressey, R.L.; Visconti, P.; Ferraro, P.J. Making parks make a difference: Poor alignment of policy, planning and management with protected-area impact, and ways forward. Philos. Trans. R. Soc. B Biol. Sci. 2015, 370, 20140280. [Google Scholar] [CrossRef] [PubMed]
  27. Reed, J.; Deakin, L.; Sunderland, T.C. What are ‘Integrated Landscape Approaches’ and how effectively have they been implemented in the tropics: A systematic map protocol. Environ. Évid. 2015, 4, 2. [Google Scholar] [CrossRef] [Green Version]
  28. Virapongse, A.; Brooks, S.; Metcalf, E.C.; Zedalis, M.; Gosz, J.; Kliskey, A.; Alessa, L. A social-ecological systems approach for environmental management. J. Environ. Manag. 2016, 178, 83–91. [Google Scholar] [CrossRef] [Green Version]
  29. Cvitanovic, C.; Hobday, A.; Van Kerkhoff, L.; Wilson, S.K.; Dobbs, K.; Marshall, N. Improving knowledge exchange among scientists and decision-makers to facilitate the adaptive governance of marine resources: A review of knowledge and research needs. Ocean. Coast. Manag. 2015, 112, 25–35. [Google Scholar] [CrossRef] [Green Version]
  30. Cvitanovic, C.; Mc Donald, J.; Hobday, A.J. From science to action: Principles for undertaking environmental research that enables knowledge exchange and evidence-based decision-making. J. Environ. Manag. 2016, 183, 864–874. [Google Scholar] [CrossRef] [Green Version]
  31. Nguyen, V.M.; Cooke, S.J.; Young, N. A roadmap for knowledge exchange and mobilization research in conservation and natural resource management. Conserv. Biol. 2017, 31, 789–798. [Google Scholar] [CrossRef]
  32. Segan, D.B.; Bottrill, M.C.; Baxter, P.W.; Possingham, H.P. Using Conservation Evidence to Guide Management. Conserv. Biol. 2010, 25, 200–202. [Google Scholar] [CrossRef]
  33. Sutherland, W.J.; Bellingan, L.; Bellingham, J.R.; Blackstock, J.J.; Bloomfield, R.M.; Bravo, M.; Cadman, V.M.; Cleevely, D.D.; Clements, A.; Cohen, A.S.; et al. A Collaboratively-Derived Science-Policy Research Agenda. PLoS ONE 2012, 7, e31824. [Google Scholar] [CrossRef]
  34. Bennett, N.J.; Roth, R. Introducing the conservation social sciences. In the Conservation Social Sciences: What?, How? and Why? Routledge: New York, NY, USA; Available online: http://www.hwctf.org/resources/specialist-group/BennettNJandRRoth2015TheConservationSocialSciencesWhatHowAndWhy.pdf (accessed on 20 June 2020).
  35. Cvitanovic, C.; Cunningham, R.; Dowd, A.-M.; Howden, S.; Van Putten, E. Using Social Network Analysis to Monitor and Assess the Effectiveness of Knowledge Brokers at Connecting Scientists and Decision-Makers: An Australian case study. Environ. Policy Gov. 2017, 27, 256–269. [Google Scholar] [CrossRef]
  36. Fazey, I.; Evely, A.C.; Reed, M.S.; Stringer, L.C.; Kruijsen, J.; White, P.C.L.; Newsham, A.; Jin, L.; Cortazzi, M.; Phillipson, J.; et al. Knowledge exchange: A review and research agenda for environmental management. Environ. Conserv. 2012, 40, 19–36. [Google Scholar] [CrossRef]
  37. Desplanque, C.; Mossman, D.J. Tides and their seminal impact on the geology, geography, history, and socio-economics of the Bay of Fundy, eastern Canada. Atl. Geol. 2004, 40. [Google Scholar] [CrossRef] [Green Version]
  38. Forbes, D.L.; Parkes, G.; Ketch, L. Sea-level rise and regional subsidence in southeastern New Brunswick. In Impacts of Sea-Level Rise and Climate Change on the Coastal Zone of Southeastern New Brunswick; Daigle, R., Forbes, D., Parkes, G., Ritchie, H., Webster, T., Bérubé, D., Hanson, A., DeBaie, L., Nichols, S., Vasseur, L., Eds.; Environment Canada: Ottawa, Canada, 2006; pp. 24–610. [Google Scholar]
  39. Rahmstorf, S. A Semi-Empirical Approach to Projecting Future Sea-Level Rise. Science 2007, 315, 368–370. [Google Scholar] [CrossRef] [PubMed] [Green Version]
  40. Greenberg, D. Climate Change, Mean Sea Level and Tides in the Bay of Fundy. In Increased Flood Risk in the Bay of Fundy in Scenarios for Climate Change; CCAF Project S00-15-01; Bedford Institute of Oceanography: Dartmouth, NS, Canada, 2001; pp. 1–16. [Google Scholar]
  41. CBCL Limited. The 2009 State of Nova Scotia’s Coast: Technical Report; Dalhousie University: Halifax, NS, Canada, 2009. [Google Scholar]
  42. Webster, T.; McGuigan, K.; Crowell, N.; Collins, K. River Flood Risk Study of the Nappan River Incorporating Climate Change; Atlantic Climate Adaptation Solutions Association: Charlottetown, PE, Canada, 2012; Available online: https://atlanticadaptation.ca/en/islandora/object/acasa%3A688 (accessed on 19 August 2020).
  43. Beazley, K.; Smandych, L.; Snaith, T.; MacKinnon, F.; Austen-Smith, P.; Duinker, P. Biodiversity Considerations in Conservation System Planning: Map-Based Approach for Nova Scotia, Canada. Ecol. Appl. 2005, 15, 2192–2208. [Google Scholar] [CrossRef]
  44. Reining, C.; Beazley, K.; Doran, P.; Bettigole, C. From the Adirondacks to Acadia: A Wildlands Network Design for the Greater Northern Appalachians. 2006. Available online: http://conservationcorridor.org/cpb/Reining_et_al_2006.pdf (accessed on 7 June 2020).
  45. Trombulak, S.C.; Anderson, M.G.; Baldwin, R.F.; Beazley, K.; Ray, J.; Reining, C.; Woolmer, G.; Bettigole, C.; Forbes, G.; Gratton, L. Priority Locations for Conservation Action in the Northern Appalachian/Acadian Ecoregion. Two Countries, One Forest, Special Report 1. 2008. Available online: http://conservationcorridor.org/cpb/Trombulak_et_al_2008.pdf (accessed on 7 June 2020).
  46. Macdonald, A.; Clowater, R. Natural Ecosystem Connectivity across the Chignecto Isthmus—Opportunities and Challenges. 2005. Available online: https://www.cpawsnb.org/wp-content/uploads/2017/12/ChignectoFinalVersionJune06v2.pdf (accessed on 1 May 2020).
  47. Nussey, P. A Wildlife Connectivity Analysis for the Chignecto Isthmus Region: Final Report to the Habitat Conservation Fund. 2016. Available online: https://novascotia.ca/natr/wildlife/habfund/final15/NSHCF15_02_NCC_Wildlife-connectivity-on-the-Chignecto-Isthmus.pdf (accessed on 1 May 2020).
  48. Nussey, P.; Noseworthy, J. A Wildlife Connectivity Analysis for the Chignecto Isthmus. Nature Conservancy Canada (NCC), 2018. Available online: https://connectiviteecologique.com/sites/default/files/project_files/NCC_Chignecto_Isthmus_Connectivity_2018.pdf (accessed on 1 May 2020).
  49. Barnes, A. Implementing Multiple Sources of Evidence to Describe Wildlife-Road Interactions in the Chignecto Isthmus Region of Nova Scotia and New Brunswick, Canada (Dalhousie University). 2019. Available online: https://dalspace.library.dal.ca/handle/10222/76829 (accessed on 3 July 2020).
  50. Barnes, A.; Beazley, K.; Walker, T. Implementation of Roadkill Survey Data across a Large Regional-Scale Landscape to Ground-Truth Modelled Wildlife Movement Corridors at Locations where they Intersect Roads. In Proceedings of the International Association of Landscape Ecology, North American Conference, Toronto, ON, Canada, 10–14 May 2020. [Google Scholar] [CrossRef]
  51. Bennett, N.J.; Roth, R.; Klain, S.C.; Chan, K.M.A.; Clark, D.A.; Cullman, G.; Epstein, G.; Nelson, M.P.; Stedman, R.; Teel, T.L.; et al. Mainstreaming the social sciences in conservation. Conserv. Biol. 2016, 31, 56–66. [Google Scholar] [CrossRef] [Green Version]
  52. Brown, G.; Raymond, C.M. Methods for identifying land use conflict potential using participatory mapping. Landsc. Urban. Plan. 2014, 122, 196–208. [Google Scholar] [CrossRef]
  53. Charnley, S.; Fischer, A.P.; Jones, E.T. Integrating traditional and local ecological knowledge into forest biodiversity conservation in the Pacific Northwest. For. Ecol. Manag. 2007, 246, 14–28. [Google Scholar] [CrossRef]
  54. Failing, L.; Gregory, R.; Harstone, M. Integrating science and local knowledge in environmental risk management: A decision-focused approach. Ecol. Econ. 2007, 64, 47–60. [Google Scholar] [CrossRef]
  55. Gruby, R.L.; Gray, N.J.; Campbell, L.M.; Acton, L. Toward a Social Science Research Agenda for Large Marine Protected Areas. Conserv. Lett. 2015, 9, 153–163. [Google Scholar] [CrossRef]
  56. Raymond, C.M.; Fazey, I.; Reed, M.S.; Stringer, L.C.; Robinson, G.M.; Evely, A.C. Integrating local and scientific knowledge for environmental management. J. Environ. Manag. 2010, 91, 1766–1777. [Google Scholar] [CrossRef] [PubMed]
  57. Hilty, J.; Chester, C.; Cross, M. Climate and Conservation: Landscape and Seascape Science, Planning, and Action; Island Press: Washington, DC, USA, 2012. [Google Scholar]
  58. Lemmen, D.; Warren, F.; James, T.; Clarke, C. Canada’s Marine Coasts in a Changing Climate. 2016. Available online: https://www.nrcan.gc.ca/sites/www.nrcan.gc.ca/files/earthsciences/files/pdf/NRCAN_fullBook%20%20accessible.pdf (accessed on 1 May 2020).
  59. ECCC. Community-Nominated Priority Places Projects. 2019. Available online: https://www.canada.ca/en/environment-climate-change/news/2019/09/community-nominated-priority-places-projects.html (accessed on 23 July 2020).
  60. NCC. The Moose Sex Project. 2012. Available online: https://www.natureconservancy.ca/en/where-we-work/new-brunswick/featured-projects/other-projects/help-moose-cross-the-chignecto.html (accessed on 24 July 2020).
  61. Holland, A. Moose Sex Project Spreading like Wildfire! Land Lines. The Nature Conservancy of Canada Blog. 2014. Available online: https://www.natureconservancy.ca/en/blog/archive/moose-sex-project-spreading.html (accessed on 24 July 2020).
  62. MacKinnon, C.M.; Kennedy, A. Canada Lynx, Lynx canadensis, Use of the Chignecto Isthmus and the Possibility of Gene Flow between Populations in New Brunswick and Nova Scotia. Can. Field-Nat. 2008, 122, 166–168. [Google Scholar] [CrossRef] [Green Version]
  63. Government of Canada, Canadian Protected and Conserved Areas Database. 2019. Available online: https://www.canada.ca/en/environment-climate-change/services/national-wildlife-areas/protected-conserved-areas-database.html (accessed on 20 February 2020).
  64. Shaw, J.; Taylor, R.B.; Forbes, D.L.; Ruz, M.H.; Solomon, S. Sensitivity of the coasts of Canada to sea-level rise. Sensit. Coasts Can. Sea-Level Rise 1998, 505, 1–79. [Google Scholar] [CrossRef]
  65. Woolmer, G.; Trombulak, S.C.; Ray, J.C.; Doran, P.J.; Anderson, M.G.; Baldwin, R.F.; Morgan, A.; Sanderson, E.W. Rescaling the Human Footprint: A tool for conservation planning at an ecoregional scale. Landsc. Urban. Plan. 2008, 87, 42–53. [Google Scholar] [CrossRef]
  66. Abraham, J.; Parkes, G.; Bowyer, P. The transition of the “Saxby Gale” into an extratropical storm. In Proceedings of the 23rd Conference on Hurricanes and Tropical Meteorology, American Meteorological Society, Dallas, TX, USA, 10–15 January 1999; pp. 795–798. [Google Scholar]
  67. Parkes, G.; Ketch, L.; O’Reilly, C. Storm surge events in the Maritimes. In Proceedings of the Canadian Coastal Conference, Guelph, ON, Canada, 21–24 May 1997; Skafel, M.G., Ed.; pp. 115–129. [Google Scholar]
  68. Peltier, W. Global Glacial Isostasy and the Surface of the Ice-Age Earth: The ICE-5G (VM2) Model and Grace. Annu. Rev. Earth Planet. Sci. 2004, 32, 111–149. [Google Scholar] [CrossRef]
  69. Shaw, J.; Amos, C.L.; Greenberg, D.A.; O’Reilly, C.T.; Parrott, D.R.; Patton, E. Catastrophic tidal expansion in the Bay of Fundy, Canada. Earth Sciences Sector (ESS) Contribution 20090423. Can. J. Earth Sci. 2010, 47, 1079–1091. [Google Scholar] [CrossRef]
  70. Canadian Hydrographic Service. Canadian Station Inventory and Data Download, Tides and Water Levels, Atlantic; Fisheries and Oceans Canada: Ottawa, ON, Canada, 2006; Volume 1, Available online: http://isdm-gdsi.gc.ca/isdm-gdsi/twl-mne/inventory-inventaire/index-eng.htm (accessed on 20 June 2020).
  71. Greenberg, D.; Blanchard, W.; Smith, B.; Barrow, E. Climate Change, Mean Sea Level and High Tides in the Bay of Fundy. Atmos. Ocean 2012, 50, 261–276. [Google Scholar] [CrossRef]
  72. Butzer, K.W. French Wetland Agriculture in Atlantic Canada and Its European Roots: Different Avenues to Historical Diffusion. Ann. Assoc. Am. Geogr. 2002, 92, 451–470. [Google Scholar] [CrossRef]
  73. Webster, T.; Kongwongthai, M.; Crowell, N. An Evaluation of Flood Risk to Infrastructure Across the Chignecto Isthmus. Atlantic Climate Adaptation Solutions Association, 2012. Available online: https://atlanticadaptation.ca/en/islandora/object/acasa%3A450 (accessed on 19 June 2020).
  74. Smith, C. Mayors Pleased with Flood Study of Chignecto Isthmus, Land Connecting N.S. to N.B. Global News. Available online: https://globalnews.ca/news/6491487/mayors-flood-study-chignecto-isthmus/ (accessed on 31 January 2020).
  75. Fournier, P. Sackville Mayor Applauds Flooding Study for Chignecto Isthmus. 2020. Available online: https://www.cbc.ca/news/canada/new-brunswick/sackville-mayor-chignecto-isthmus-1.5445651 (accessed on 20 June 2020).
  76. Tutton, M. Bids Sought for Study on How to Protect Chignecto Isthmus from Rising Seas, Storms. The Globe and Mail. Available online: https://www.theglobeandmail.com/canada/article-bids-sought-for-study-on-how-to-protect-chignecto-isthmus-from-rising/ (accessed on 24 July 2019).
  77. Parnham, H.; Arnold, S.; Fenech, A. Using Cost–Benefit Analysis to Evaluate Climate Change Adaptation Options in Atlantic Canada. 2016. Available online: https://atlanticadaptation.ca/en/islandora/object/acasa:779 (accessed on 23 July 2020).
  78. Mascia, M.B.; Brosius, J.P.; Dobson, T.A.; Forbes, B.C.; Horowitz, L.S.; Mckean, M.A.; Turner, N.J. Conservation and the Social Sciences. Conserv. Biol. 2003, 17, 649–650. [Google Scholar] [CrossRef] [Green Version]
  79. Bennett, N.J.; Roth, R.; Klain, S.C.; Chan, K.M.A.; Christie, P.; Clark, D.A.; Cullman, G.; Curran, D.; Durbin, T.J.; Epstein, G.; et al. Conservation social science: Understanding and integrating human dimensions to improve conservation. Biol. Conserv. 2017, 205, 93–108. [Google Scholar] [CrossRef] [Green Version]
  80. Brymer, A.L.B.; Holbrook, J.D.; Niemeyer, R.J.; Suazo, A.A.; Wulfhorst, J.D.; Vierling, K.T.; Newingham, B.A.; Link, T.E.; Rachlow, J.L. A social-ecological impact assessment for public lands management: Application of a conceptual and methodological framework. Ecol. Soc. 2016, 21. [Google Scholar] [CrossRef] [Green Version]
  81. Karimi, A.; Brown, G.; Hockings, M. Methods and participatory approaches for identifying social-ecological hotspots. Appl. Geogr. 2015, 63, 9–20. [Google Scholar] [CrossRef]
  82. Ostrom, E. A General Framework for Analyzing Sustainability of Social-Ecological Systems. Science 2009, 325, 419–422. [Google Scholar] [CrossRef] [PubMed]
  83. Fry, G.L. Multifunctional landscapes—Towards transdisciplinary research. Landsc. Urban. Plan. 2001, 57, 159–168. [Google Scholar] [CrossRef]
  84. Reyers, B.; Roux, D.J.; Cowling, R.M.; Ginsburg, A.E.; Nel, J.L.; O’Farrell, P. Conservation planning as a transdisciplinary process. Conserv. Biol. 2010. [Google Scholar] [CrossRef] [PubMed]
  85. Harris, J.A.; Brown, V.A.; Russell, J.Y. (Eds.) Tackling Wicked Problems: Through the Transdisciplinary Imagination; Routledge: London, UK, 2010. [Google Scholar] [CrossRef]
  86. Fox, H.; Christian, C.; Nordby, J.C.; Pergams, O.R.W.; Peterson, G.D.; Pyke, C.R. Perceived Barriers to Integrating Social Science and Conservation. Conserv. Biol. 2006, 20, 1817–1820. [Google Scholar] [CrossRef] [PubMed]
  87. Jacobson, S.K.; Duff, M.D. Training Idiot Savants: The Lack of Human Dimensions in Conservation Biology. Conserv. Biol. 1998, 12, 263–267. [Google Scholar] [CrossRef]
  88. Anadón, J.D.; Giménez, A.; Ballestar, R.; Pérez, I. Evaluation of Local Ecological Knowledge as a Method for Collecting Extensive Data on Animal Abundance. Conserv. Biol. 2009, 23, 617–625. [Google Scholar] [CrossRef]
  89. Close, C.; Hall, G.B. A GIS-based protocol for the collection and use of local knowledge in fisheries management planning. J. Environ. Manag. 2006, 78, 341–352. [Google Scholar] [CrossRef]
  90. Loftus, A.; Anthony, B. Challenges and Opportunities of Integrating Local Knowledge into Environmental Management. In Principles of Environmental Policy: Local, Europeans and Global Perspectives; Pskov State University: Pskov, Russia, 2018; pp. 155–189. [Google Scholar]
  91. Gray, N.J. The role of boundary organizations in co-management: Examining the politics of knowledge integration in a marine protected area in Belize. Int. J. Commons 2016, 10, 1013. [Google Scholar] [CrossRef] [Green Version]
  92. Matsui, K. University of Tsukuba Problems of Defining and Validating Traditional Knowledge: A Historical Approach. Int. Indig. Policy, J. 2015, 6. [Google Scholar] [CrossRef]
  93. Widdowson, F.; Howard, A. Disrobing the Aboriginal Industry: The Deception behind Indigenous Cultural Preservation; McGill-Queen’s University Press: Montreal, QC, Canada, 2008. [Google Scholar]
  94. Wyborn, C. Connecting knowledge with action through coproductive capacities: Adaptive governance and connectivity conservation. Ecol. Soc. 2015, 20. [Google Scholar] [CrossRef] [Green Version]
  95. Zurba, M.; Beazley, K.; English, E.; Buchmann-Duck, J. Indigenous Protected and Conserved Areas (IPCAs), Aichi Target 11 and Canada’s Pathway to Target 1: Focusing Conservation on Reconciliation. Land 2019, 8, 10. [Google Scholar] [CrossRef] [Green Version]
  96. Artelle, K.A.; Zurba, M.; Bhattacharyya, J.; Chan, D.E.; Brown, K.; Housty, J.; Moola, F.; Bhattacharyya, J. Supporting resurgent Indigenous-led governance: A nascent mechanism for just and effective conservation. Biol. Conserv. 2019, 240, 108284. [Google Scholar] [CrossRef]
  97. Forman, R.; Sperling, D.; Bissonette, J.; Clevenger, A.; Cutshall, C.; Dale, V.; Fahrig, L.; Heanue, K.; France, R.; Goldman, C.; et al. Road Ecology: Science and Solutions; Island Press: Washington, DC, USA, 2003. [Google Scholar]
  98. Forman, R.T.T.; Friedman, D.S.; Fitzhenry, D.; Martin, J.D.; Chen, A.S.; Alexander, L.E. Ecological effects of roads: Toward three summary indices and an overview of North America. In Habitat Fragmentation and Infrastructure; Canter, K., Ed.; Minister of Transport and Public Works and Water Management: Delft, The Netherlands, 1997; pp. 40–54. [Google Scholar]
  99. Fudge, D.; Freedman, B.; Crowell, M.; Nette, T.; Power, V. Road-kill of Mammals in Nova Scotia. Can. Field-Nat. 2007, 121, 265–273. [Google Scholar] [CrossRef] [Green Version]
  100. Robinson, C.; Duinker, P.; Beazley, K. A conceptual framework for understanding, assessing, and mitigating ecological effects of forest roads. Environ. Rev. 2010, 18, 61–86. [Google Scholar] [CrossRef]
  101. Spanowicz, A.G.; Jaeger, J.A. Measuring landscape connectivity: On the importance of within-patch connectivity. Landsc. Ecol. 2019, 34, 2261–2278. [Google Scholar] [CrossRef]
  102. Thorne, J.H.; Huber, P.R.; Girvetz, E.H.; Quinn, J.; McCoy, M.C. Integration of Regional Mitigation Assessment and Conservation Planning. Ecol. Soc. 2009, 14, 1–27. [Google Scholar] [CrossRef] [Green Version]
  103. Van Der Ree, R.; Jaeger, J.A.; Van Der Grift, E.A.; Clevenger, A.P. Effects of Roads and Traffic on Wildlife Populations and Landscape Function: Road Ecology is Moving toward Larger Scales. Ecol. Soc. 2011, 16, 48. [Google Scholar] [CrossRef]
  104. Bager, A.; Rosa, C. Priority ranking of road sites for mitigating wildlife roadkill. Biota Neotropica 2010, 10, 149–153. [Google Scholar] [CrossRef] [Green Version]
  105. Gerow, K.; Kline, N.; Swann, D.; Pokorny, M. Estimating annual vertebrate mortality on roads at Saguaro National Park, Arizona. Hum. Wildl. Interact. 2010, 4, 283–292. [Google Scholar]
  106. Sieber, R. Public Participation Geographic Information Systems: A Literature Review and Framework. Ann. Assoc. Am. Geogr. 2006, 96, 491–507. [Google Scholar] [CrossRef]
  107. Lovett, A.; Appleton, K. GIS for Environmental Decision-Making; Dummond, J., Gittings, B., Joao, E., Eds.; CRC Press: Boca Raton, FL, USA, 2008. [Google Scholar]
  108. Brown, G.; Kyttä, M. Key issues and priorities in participatory mapping: Toward integration or increased specialization? Appl. Geogr. 2018, 95, 1–8. [Google Scholar] [CrossRef]
  109. Orban, F. Participatory Geographic Information Systems and Land Planning. Life Experiences for People Empowerment and Community Transformation. 2011. Available online: www.fundp.ac.be/asbl/pun (accessed on 17 August 2020).
  110. Brown, G.; Kyttä, M. Key issues and research priorities for public participation GIS (PPGIS): A synthesis based on empirical research. Appl. Geogr. 2014, 46, 122–136. [Google Scholar] [CrossRef]
  111. Joa, B.; Winkel, G.; Primmer, E. The unknown known—A review of local ecological knowledge in relation to forest biodiversity conservation. Land Use Policy 2018, 79, 520–530. [Google Scholar] [CrossRef]
  112. Brown, G.; Sanders, S.; Reed, P. Using public participatory mapping to inform general land use planning and zoning. Landsc. Urban. Plan. 2018, 177, 64–74. [Google Scholar] [CrossRef]
  113. Brown, G.; Strickland-Munro, J.; Kobryn, H.; Moore, S.; Brown, G. Mixed methods participatory GIS: An evaluation of the validity of qualitative and quantitative mapping methods. Appl. Geogr. 2017, 79, 153–166. [Google Scholar] [CrossRef]
  114. Karimi, A.; Brown, G. Assessing multiple approaches for modelling land-use conflict potential from participatory mapping data. Land Use Policy 2017, 67, 253–267. [Google Scholar] [CrossRef]
  115. McCall, M. How important is precision in PGIS mapping? Maps consist of different layers of spatial information—Such as roads, distances between places, boundaries, physical features or land uses. But how do maps represent fuzzy and imprecise spatial information? Particip. Learn. Action 2006, 54, 114–119. [Google Scholar]
  116. Beins, B.C.; Wenzel, A. Snowball Sampling. SAGE Encycl. Abnorm. Clin. Psychol. 2017, 10, 141–163. [Google Scholar] [CrossRef]
  117. Sedgwick, P.M. Snowball sampling. BMJ 2013, 347, f7511. [Google Scholar] [CrossRef]
  118. Huntington, H.P. Using traditional ecological knowledge in science: Methods and applications. Ecol. Appl. 2000, 10, 1270–1274. [Google Scholar] [CrossRef]
  119. CanVec Series—Topographic Data of Canada. 2017. Available online: https://open.canada.ca/data/en/dataset/80aa8ec6-4947-48de-bc9c-7d09d48b4cad (accessed on 19 August 2020).
  120. Nova Scotia Geographic Data Directory, Nova Scotia Road Network. 2020. Available online: https://nsgi.novascotia.ca/gdd/ (accessed on 22 August 2020).
  121. Geography of New Brunswick (Geo NB) New Brunswick Road Network. 2020. Available online: http://www.snb.ca/geonb1/e/DC/catalogue-E.asp (accessed on 22 August 2020).
  122. Parker, G. Status Report on the Eastern Moose (Alces alces americana Clinton) in Mainland Nova Scotia. 2003. Available online: https://novascotia.ca/natr/wildlife/biodiversity/pdf/statusreports/StatusReportMooseNSComplete.pdf (accessed on 18 August 2020).
  123. Natural Resource and Energy Development. 2020 Hunt & Trap 2020. Available online: https://www2.gnb.ca/content/dam/gnb/Departments/nr-rn/pdf/en/Wildlife/HuntTrap.pdf (accessed on 17 August 2020).
  124. Climate Change Nova Scotia. Adapting to a Changing Climate in NS: Vulnerability Assessment and Adaptation Options. 2005. Available online: https://climatechange.novascotia.ca/sites/default/files/uploads/Adapting_to_a_Changing_Climate_in_NS.pdf (accessed on 19 August 2020).
  125. Snaith, T.; Beazley, K.; MacKinnon, F.; Duinker, P. Preliminary Habitat Suitability Analysis for Moose in Mainland Nova Scotia, Canada. Alces 2004, 38, 73–88. [Google Scholar]
  126. Nova Scotia Department of Natural Resources. Recovery Plan for Moose (Alces alces Americana) in Mainland Nova Scotia. 2007. Available online: https://novascotia.ca/natr/wildlife/biodiversity/pdf/recoveryplans/MainlandMooseRecoveryPlan.pdf (accessed on 12 May 2020).
  127. McGregor, P. From High Overhead, a Sobering Look at a Moose Population in Deep Trouble. 2019. Available online: cbc.ca/news/canada/nova-scotia/mainland-moose-nova-scotia-decline-1.5148572 (accessed on 25 May 2019).
  128. Beazley, K.; Snaith, T.V.; MacKinnon, F.; Colville, D. Road Density and Potential Impacts on Wildlife Species such as American Moose in Mainland Nova Scotia. Proc. Nova Scotian Inst. Sci. (NSIS) 2004, 42, 339–357. [Google Scholar] [CrossRef]
  129. Boer, A.H. Spatial distribution of moose kills in New Brunswick. Wildl. Soc. Bull. 1990, 18, 431–434. [Google Scholar]
  130. Cunningham, C.; Beazley, K.F.; Bush, P.; Brazner, J. Forest Connectivity in Nova Scotia. NS Lands and Forestry: Halifax, NS, Canada. 2020; unpublished, submitted. [Google Scholar]
  131. Lahey, W. An Independent Review of Forest Practices in Nova Scotia—Executive Summary Conclusions and Recommendations; Dalhousie University: Halifax, NS, Canada, 2018; Available online: https://novascotia.ca/natr/forestry/Forest_Review/Lahey_FP_Review_Report_ExecSummary.pdf (accessed on 19 August 2020).
  132. Committee on the Status of Endangered Wildlife in Canada (COSEWIC). COSEWIC Assessment and Status Report on the Wood Turtle Glyptemys Insculpta in Canada; COSEWIC: Ottawa, ON, Canada, 2018. [Google Scholar]
  133. Environment Climate Change Canada (ECCC). Recovery Strategy for the Wood Turtle (Glyptemys insculpta) in Canada. Species at Risk Act Recovery Strategy Series; Environment Canada: Ottawa, ON, Canada, 2016. [Google Scholar]
  134. Manfredo, M.J. Who Cares about Wildlife? Social Science Concepts for Exploring Human Wildlife Relationships and Conservation Issues; Springer: New York, NY, USA, 2008. [Google Scholar]
  135. Messmer, T.A. The emergence of human–wildlife conflict management: Turning challenges into opportunities. Int. Biodeterior. Biodegrad. 2000, 45, 97–102. [Google Scholar] [CrossRef]
  136. Peters-Guarin, G.; McCall, M.K.; Van Westen, C.J. Coping strategies and risk manageability: Using participatory geographical information systems to represent local knowledge. Disasters 2011, 36, 1–27. [Google Scholar] [CrossRef]
  137. Sjöberg, L. Explaining risk perception: An empirical evaluation of cultural theory. Risk Decis. Policy 1997, 2, 113–130. [Google Scholar] [CrossRef]
  138. Manfredo, M.J.; Vaske, J.J.; Brown, P.J.; Decker, D.J.; Duke, E.A. Wildlife and Society: The Science of Human Dimensions; Island Press: Washington, DC, USA, 2009. [Google Scholar]
  139. Letterick, K. Jump in Moose Collisions Worries Shediac Fire Department. CBC News, 29 June 2017. Available online: https://www.cbc.ca/news/canada/new-brunswick/moose-collisions-shediac-1.4182363(accessed on 25 August 2020).
  140. Snaith, T.V.; Beazley, K.F. Application of population viability theory to moose in mainland Nova Scotia. Alces 2004, 38, 193–204. [Google Scholar]
  141. Prosper, K.; McMillan, L.J.; Davis, A.A.; Moffitt, M. Returning to Netukulimk: Mi’kmaq cultural and spiritual connections with resource stewardship and self-governance. Int. Indig. Policy J. 2011, 2, 4. [Google Scholar] [CrossRef]
  142. Kittinger, J.N.; Finkbeiner, E.M.; Ban, N.C.; Broad, K.; Carr, M.H.; Cinner, J.E.; Gelcich, S.; Cornwell, M.L.; Koehn, J.Z.; Basurto, X.; et al. Emerging frontiers in social-ecological systems research for sustainability of small-scale fisheries. Curr. Opin. Environ. Sustain. 2013, 5, 352–357. [Google Scholar] [CrossRef]
  143. Wyborn, C.; Bixler, R.P. Collaboration and nested environmental governance: Scale dependency, scale framing, and cross-scale interactions in collaborative conservation. J. Environ. Manag. 2013, 123, 58–67. [Google Scholar] [CrossRef] [PubMed]
  144. Cosham, J.A.; Beazley, K.; McCarthy, C. Local Knowledge of Distribution of European Green Crab (Carcinus maenas) in Southern Nova Scotian Coastal Waters. Hum. Ecol. 2016, 44, 409–424. [Google Scholar] [CrossRef]
  145. Boschmann, E.E.; Cubbon, E. Sketch Maps and Qualitative GIS: Using Cartographies of Individual Spatial Narratives in Geographic Research. Prof. Geogr. 2013, 66, 236–248. [Google Scholar] [CrossRef]
  146. Chingombe, W.; Pedzisai, E.; Manatsa, D.; Mukwada, G.; Taru, P. A participatory approach in GIS data collection for flood risk management, Muzarabani district, Zimbabwe. Arab. J. Geosci. 2014, 8, 1029–1040. [Google Scholar] [CrossRef]
  147. Dunn, C.E. Participatory GIS—A people’s GIS? Prog. Hum. Geogr. 2007, 31, 616–637. [Google Scholar] [CrossRef]
  148. Barnett, A.; Wiber, M.G.; Rooney, M.P.; Maillet, D.G.C. The role of public participation GIS (PPGIS) and fishermen’s perceptions of risk in marine debris mitigation in the Bay of Fundy, Canada. Ocean Coast. Manag. 2016, 133, 85–94. [Google Scholar] [CrossRef]
  149. Brandt, K.; Graham, L.; Hawthorne, T.; Jeanty, J.; Burkholder, B.; Munisteri, C.; Visaggi, C. Integrating sketch mapping and hot spot analysis to enhance capacity for community-level flood and disaster risk management. Geogr. J. 2019, 186, 198–212. [Google Scholar] [CrossRef]
  150. Canevari-Luzardo, L.; Bastide, J.; Choutet, I.; Liverman, D. Using partial participatory GIS in vulnerability and disaster risk reduction in Grenada. Clim. Dev. 2015, 9, 95–109. [Google Scholar] [CrossRef]
  151. Cutts, B.B.; White, D.D.; Kinzig, A.P. Participatory geographic information systems for the co-production of science and policy in an emerging boundary organization. Environ. Sci. Policy 2011, 14, 977–985. [Google Scholar] [CrossRef]
  152. Chung, M.-K.; Lu, D.-J.; Tsai, B.-W.; Chou, K.T. Assessing Effectiveness of PPGIS on Protected Areas by Governance Quality: A Case Study of Community-Based Monitoring in Wu-Wei-Kang Wildlife Refuge, Taiwan. Sustainability 2019, 11, 4154. [Google Scholar] [CrossRef] [Green Version]
  153. Irvine, R.J.; Fiorini, S.; Yearley, S.; McLeod, J.E.; Turner, A.; Armstrong, H.; White, P.C.L.; Van Der Wal, R.; Irvine, R.J. Can managers inform models? Integrating local knowledge into models of red deer habitat use. J. Appl. Ecol. 2009, 46, 344–352. [Google Scholar] [CrossRef]
  154. Berkes, F.; Arce-Ibarra, M.; Armitage, D.; Charles, A.; Loucks, L.; Makino, M.; Satria, A.; Seixas, C.; Abraham, J.; Berdej, S. Analysis of Social-ecological Systems for Community Conservation; Community Conservation Research Network: Halifax, NS, Canada, 2016. Available online: https://www.comunityconservation.net/resources/social-ecolgical-systems-guidebook/ (accessed on 20 June 2020).
  155. Lemieux, C.J.; Groulx, M.W.; Bocking, S.; Beechey, T.J. Evidence-based decision-making in Canada’s protected areas organizations: Implications for management effectiveness. Facets 2018, 3, 392–414. [Google Scholar] [CrossRef]
  156. Canada Parks Council. No Date. Pathway to Canada Target 1. Available online: https://www.conservation2020canada.ca/home (accessed on 25 July 2020).
  157. New England Governors and Eastern Canadian Premiers (NEG-ECP). Resolution 40-3—Resolution on Ecological Connectivity, Adaptation to Climate Change, and Biodiversity Conservation. In Proceedings of the 40th Conference of New England Governors and Eastern Canadian Premiers, Boston, MA, USA, 28–29 August 2016; Available online: https://scics.ca/en/product-produit/resolution-40-3-resolution-on-ecological-connectivity-adaptation-to-climate-change-and-biodiversity-conservation/ (accessed on 25 July 2020).
  158. Austin, Z.; Cinderby, S.; Smart, J.C.R.; Raffaelli, D.; White, P.C.L. Mapping wildlife: Integrating stakeholder knowledge with modelled patterns of deer abundance by using participatory GIS. Wildl. Res. 2009, 36, 553–564. [Google Scholar] [CrossRef] [Green Version]
  159. Silvano, R.A.M.; Begossi, A. What can be learned from fishers? An integrated survey of fishers’ local ecological knowledge and bluefish (Pomatomus saltatrix) biology on the Brazilian coast. Hydrobiologia 2009, 637, 3–18. [Google Scholar] [CrossRef]
  160. Corbett, J.; Rambaldi, G.; Kyem, P.; Weiner, D.; Olson, R.; Muchemi, J.; Chambers, R. Overview: Mapping for 1 Change—The emergence of a new practice. Particip. Learn. Action 2006. [Google Scholar] [CrossRef]
  161. ESRI. Applying Fuzzy Logic to Overlay Rasters. 2016. Available online: http://desktop.arcgis.com/en/arcmap/10.3/tools/spatial-analyst-toolbox/applying-fuzzy-logic-to-overlay-rasters.htm (accessed on 28 November 2019).
  162. Paul, F.; Paul, G.; Paul, L. Petition to Queen Victoria, Public Archives of Nova Scotia: Halifax, NS, Canada, 14 December 1932; C0127/213.ff.8-25,@19, PANS m/f 13.
  163. Allen, A. The Mi’kmaq of the Nineteenth Century & the Early Twentieth Century: A Part of the Aboriginal Title Claim of the Mi’kmaq First Nation of Nova Scotia; Treaty & Aboriginal Rights Research Centre: Shubenacadie, NS, Canada, 2000. [Google Scholar]
  164. Atlantic Canada Conservation Data Centre. 2020. Available online: http://accdc.com// (accessed on 24 July 2020).
  165. Young, T. L’nuwita’simk: A Foundational Worldview for a L’nuwey Justice System. Indig. Law J. 2016, 13, 75–102. [Google Scholar]
  166. Young, T. Ko’wey Net “Biodiversity”? 2018, pp. 10–11. Available online: https://ecologyaction.ca/sites/default/files/images-documents/Ecology%20&%20Action%20-%20Spring%202018%20-%20Online.pdf (accessed on 17 August 2020).
  167. Nova Scotia Archives. Peace and Friendship Treaties at the Nova Scotia Archives. Mi’kmaq Holdings Resource Guide. Province of Nova Scotia. Updated August 2020. Available online: https://novascotia.ca/archives/mikmaq/results.asp?Search=AR5&SearchList1=all&TABLE2=on (accessed on 30 August 2020).
1
NS and NB—‘A community of practice to protect and recover species at risk on the Chignecto Isthmus’: Nature Conservancy of Canada and partners (e.g., Birds Canada, Community Forests International, Fort Folly Habitat Recovery Program, Confederacy of Mainland Mi’kmaq-Mi’kmaw Conservation Group) aim ‘to build and strengthen community relationships, develop a conservation plan, build public awareness and deliver programs benefiting species at risk. The project will benefit 20 listed species at risk … and 20 additional species of concern. It will occur in the Chignecto Isthmus region of both Nova Scotia and New Brunswick, covering 739,596 hectares.’ [59].
2
An average measure from tide gauge records at Saint John, NB, estimates sea-level rise as 22 cm over the past century in the Bay of Fundy. This suggests that the current level is approximately 32 cm higher that at the time of the Saxby Gale when a storm surge breached the dykes, causing flooding that temporarily severed NS from NB [73] (p. 9). Historic trends and modelled projections show that even in the absence of climate change an increase in tidal high water in the order of 0.3 m can be expected in the Bay of Fundy over the next century. Combined with the influence of climate change, “high water in the Bay of Fundy is predicted to rise on the order of 0.5 m over the next 50 years, and on the order of 1 m by the end of the century” [71] (p. 274).
3
The 15 focal species in NCC’s Chignecto Isthmus connectivity analysis are moose, black bear, red fox, bobcat, snowshoe hare, fisher, northern flying squirrel, Barred Owl, Northern Goshawk, Pileated Woodpecker, Yellow Warbler, Brown Creeper, Ruffed Grouse, Boreal Chickadee and Blackburnian Warbler [48].
4
Terms such as ‘validate’ and ‘verify’ can be contentious when talking about bringing together formal science and local tacit knowledge. Such words can imply a privileging of one form of knowledge over the other in terms of veracity, value, etc. What we mean by ‘verify’ is a form of ‘ground truthing’ based on local experiential and tacit knowledge, to identify areas of agreement and disagreement, which may then be further explored. In light of such concerns, we at times use ‘verify’ and at others ‘ground truth’, although we have not done ground checks in the field.
5
We assume that by ‘essentially’ the participant meant ‘almost’, as wolf, eastern cougar, woodland caribou and other historically present species have been extirpated over the past few centuries since Euro-American settlement.
6
Participant numbers (e.g., P27, P22) are used in reporting our results to de-identify individuals, consistent with our approved research ethics procedure for confidentially attributing paraphrases and quotes.
7
The native moose species (A. alces Americana) in NS was officially listed as provincially endangered in 2003 and remains only in small localized groups distributed across the mainland portion of NS, where hunting of this species has been prohibited since 1981; non-native moose introduced from Alberta in 1948–49 proliferate in Cape Breton Island, NS, where hunting of this introduced species is allowed (i.e., in Victoria County and Inverness County) [8,122]
8
A population patch is the minimum area which can sustain a breeding pair for ten years and a breeding patch is the minimum area needed for a breeding pair [10,48].
9
Resolution on Ecological Connectivity, Adaptation to Climate Change and Biodiversity Conservation [157].
Figure 1. The Chignecto Isthmus Region in NS and NB, Canada. The region is delineated as a level 2 watershed [48]. Protected areas are from the Canadian Protected and Conserved Areas Database [63] for terrestrial protected areas and other effective area-based conservation measures, compiled by Environment and Climate Change Canada.
Land 09 00332 g001
Figure 2. Observed and known locations, movement pathways and roadkill areas for (a) black bear and (b) moose collected and compiled from individual participatory mapping data collected in July and August 2019. Road data collected from Government of NS Geographic Data Directory [120] and GeoNB Open Data Licence catalogue [121].
Land 09 00332 g002aLand 09 00332 g002b
Figure 3. Movement pathways recorded and compiled from individual participatory mapping interviews (July and August 2019) identifying areas and pathways for terrestrial and avian species across the Chignecto Isthmus. Road data collected from Government of NS Geographic Data Directory [120] and GeoNB Open Data Licence catalogue [121].
Land 09 00332 g003
Figure 4. Points, lines and polygons of recorded areas of roadkill for various species, compiled from individual participatory mapping interviews, July and August 2019. Road data collected from Government of NS Geographic Data Directory [120] and GeoNB Open Data Licence catalogue [121].
Land 09 00332 g004
Figure 5. NCC modelled connectivity data [48] overlaid with participatory GIS data for (a) black bear and (b) moose.
Land 09 00332 g005
Figure 6. Species location and roadkill data for all species mapped and compiled from individual interviews (July and August 2019) overlaid with NCC’s modelled high-probability wildlife movement pathway. Inset A highlights the 5-km wide pinch point along the NS-NB border identified in the NCC report [48].
Land 09 00332 g006
Figure 7. Movement pathway data for all species mapped and compiled from individual interviews (July and August 2019) overlaid with NCC’s modelled high-probability wildlife movement pathway. Inset A highlights the 5-km wide pinch point along the NS-NB border identified by participants and in the NCC report [48].
Land 09 00332 g007

