Article

Effects of Hierarchical City Centers on the Intensity and Direction of Urban Land Expansion: A Case Study of Beijing

1
School of Geography, Faculty of Geographical Science, Beijing Normal University, Beijing 100875, China
2
College of Urban and Environmental Sciences, Peking University, Beijing 100871, China
3
Center for Urban Future Research, Peking University, Beijing 100871, China
*
Author to whom correspondence should be addressed.
Land 2020, 9(9), 312; https://doi.org/10.3390/land9090312
Submission received: 26 July 2020 / Revised: 1 September 2020 / Accepted: 2 September 2020 / Published: 3 September 2020

Abstract

:
Worldwide urban spatial expansion has become a hot topic in recent decades. To develop effective urban growth containment strategies, it is important to understand the spatial patterns and driving forces of urban sprawl. By employing a spatial analysis method and land use survey data for the years 1996–2010, this study explores the effects of hierarchical administrative centers on the intensity and direction of urban land expansion in a Beijing municipality. The results are as follows: (1) land development intensity and expansion speeds are both affected significantly by the municipal and district and county centers where the governments hold a lot of administrative, public, and economic resources. (2) The distances to the administrative centers are determinant factors for the direction of urban land expansion. Except for several subregions adjacent to the municipal center, the closer the area is to an administrative center, the more likely it is that the expansion direction points toward the center. (3) The spatial patterns of urban land development are shaped jointly by governments at different levels, and transportation lines also play a role in remote areas. These findings are expected to have consulting value for future policymaking on urban land use and management in mega-cities, especially those with strong local government powers in other transition economies and developing countries.

1. Introduction

Metropolitan regions worldwide have experienced great changes in urban spatial structure over the past few decades [1,2,3,4]. Urban spatial structure is becoming increasingly complex and polycentric, along with the transformations of urban territory, population, and social economy [5,6,7,8,9], which have also led to continuous urban spatial expansion [10,11,12,13].Global urban spatial expansion has not only caused the massive conversion of rural and natural land into cities, but has also increased the demand for new natural resources that are crucial for the smooth functioning of the global climate and environment [14,15,16,17]. To develop effective urban growth containment strategies, it is important to understand the spatial characteristics and driving forces of urban sprawl [3,18,19].
In the past few decades, China’s urban spatial structure has experienced a complex reshaping from highly mixed and disorganized land use in the planning economy era to the dominance of the monocentric spatial pattern in the 1980s and then to an increasingly polycentric spatial structure driven jointly by the marketization of urban land and the guidance of various land policies [18,20,21,22,23,24]. Urban land in Chinese cities has expanded at an unprecedented rate, owing to the combined effects of suburbanization in monocentric agglomerations and multi-center scatter in the outer areas of metropolises [18,20,21,22,23,24]. Compared with Western cities, the powers of central and local governments have played a much more important role in driving urban land expansion, despite the growing market factors such as urban population growth and economic development in this process [18,20,24,25]. Although some European countries are also typical transitional economies like China, cities therein, as revealed by case studies in Prague, Budapest, Warsaw, Bucharest etc., have commonly experienced a slow pace of urbanization [26,27,28]. The roles of state and market forces in forming the geography of urban expansion can hardly be demonstrated in these cases. Therefore, rapidly urbanizing China provides us with a great case to explore how government has played a role in shaping the spatial patterns of land development and urban restructuring.
Previous studies have demonstrated that urban planning and development policies have had significant influence on urban land expansion [18,23,24]. The spatial patterns of Chinese cities have similar trends with those of Western cities in terms of the common shift from a monocentric to a polycentric structure [22,29]. However, there are obvious differences between Western and Chinese cities in the factors underlying this transition. Edge cities have often grown into subcenters in Western cities such as Chicago and Los Angeles [30,31,32]. In contrast, studies have showed that subcenters in China’s metropolitan areas have usually evolved from administrative centers at lower levels [22,33]. In other words, the administrative forces of municipalities and districts are crucial in shaping the spatial pattern of urban sprawl in Chinese cities.
The metropolitan area in the Western context often refers to the economic city [34]. There are many cities or towns in statistically metropolitan areas such as Chicago and Los Angeles [35,36]. Each city or town has its own administrative power [34]. However, urban areas in China can be divided into multiple administrative levels, namely, centrally administrated cities, sub-provincial cities, prefecture level cities, county-level cities, and towns [37,38]. The “city administering counties system” is used to empower central cities in China to play a leading role in economic development [37]. These cities are called “municipalities with districts”. Centrally administrated cities, sub-provincial cities, and prefecture-level cities fall under the category of “municipalities with districts”. They are similar to administrative systems, that is, the city administers districts or counties, and the district or county administers streets, towns, or townships [37] (Figure 1). While previous studies have found that governments with higher administrative ranks have greater policy-making power, administrative jurisdiction, and land-use planning power [38,39], few studies explore the impact of local governments at different administrative levels on urban land growth in municipalities with districts. In other words, although it has been widely acknowledged that political and administrative factors play a central role in China’s urban growth, little is known about the effect of urban administrative hierarchy on the patterns of urban land expansion. Thus, this study attempts to contribute to the literature by empirically examining the role played by administrative centers at various levels in shaping the landscape of urban land expansion in large cities. By taking Beijing as a case study, two specific questions will be answered: (1) how has the possibility of suburban land to be developed into urban use been affected jointly by administrative centers at different levels? (2) What effects do the hierarchical administrative centers have on the direction of urban land expansion?
This study examines the influence of hierarchical administrative centers on the intensity and direction of urban land expansion in metropolitan areas by using Beijing as a case study. Beijing, as the capital city of the country and the economic center of North China, has experienced rapid urban expansion in the past few decades. It is a typical case in terms of the importance of administrative powers in shaping the geography of urban development and the coaction of the municipal center and a relatively large number of district centers in this process. The rest of this article is organized as follows: Section 2 presents the background and analytical framework; Section 3 presents an account of the research area, data used, and the methods adopted; Section 4 presents the results; and the final section presents the conclusions and discussion.

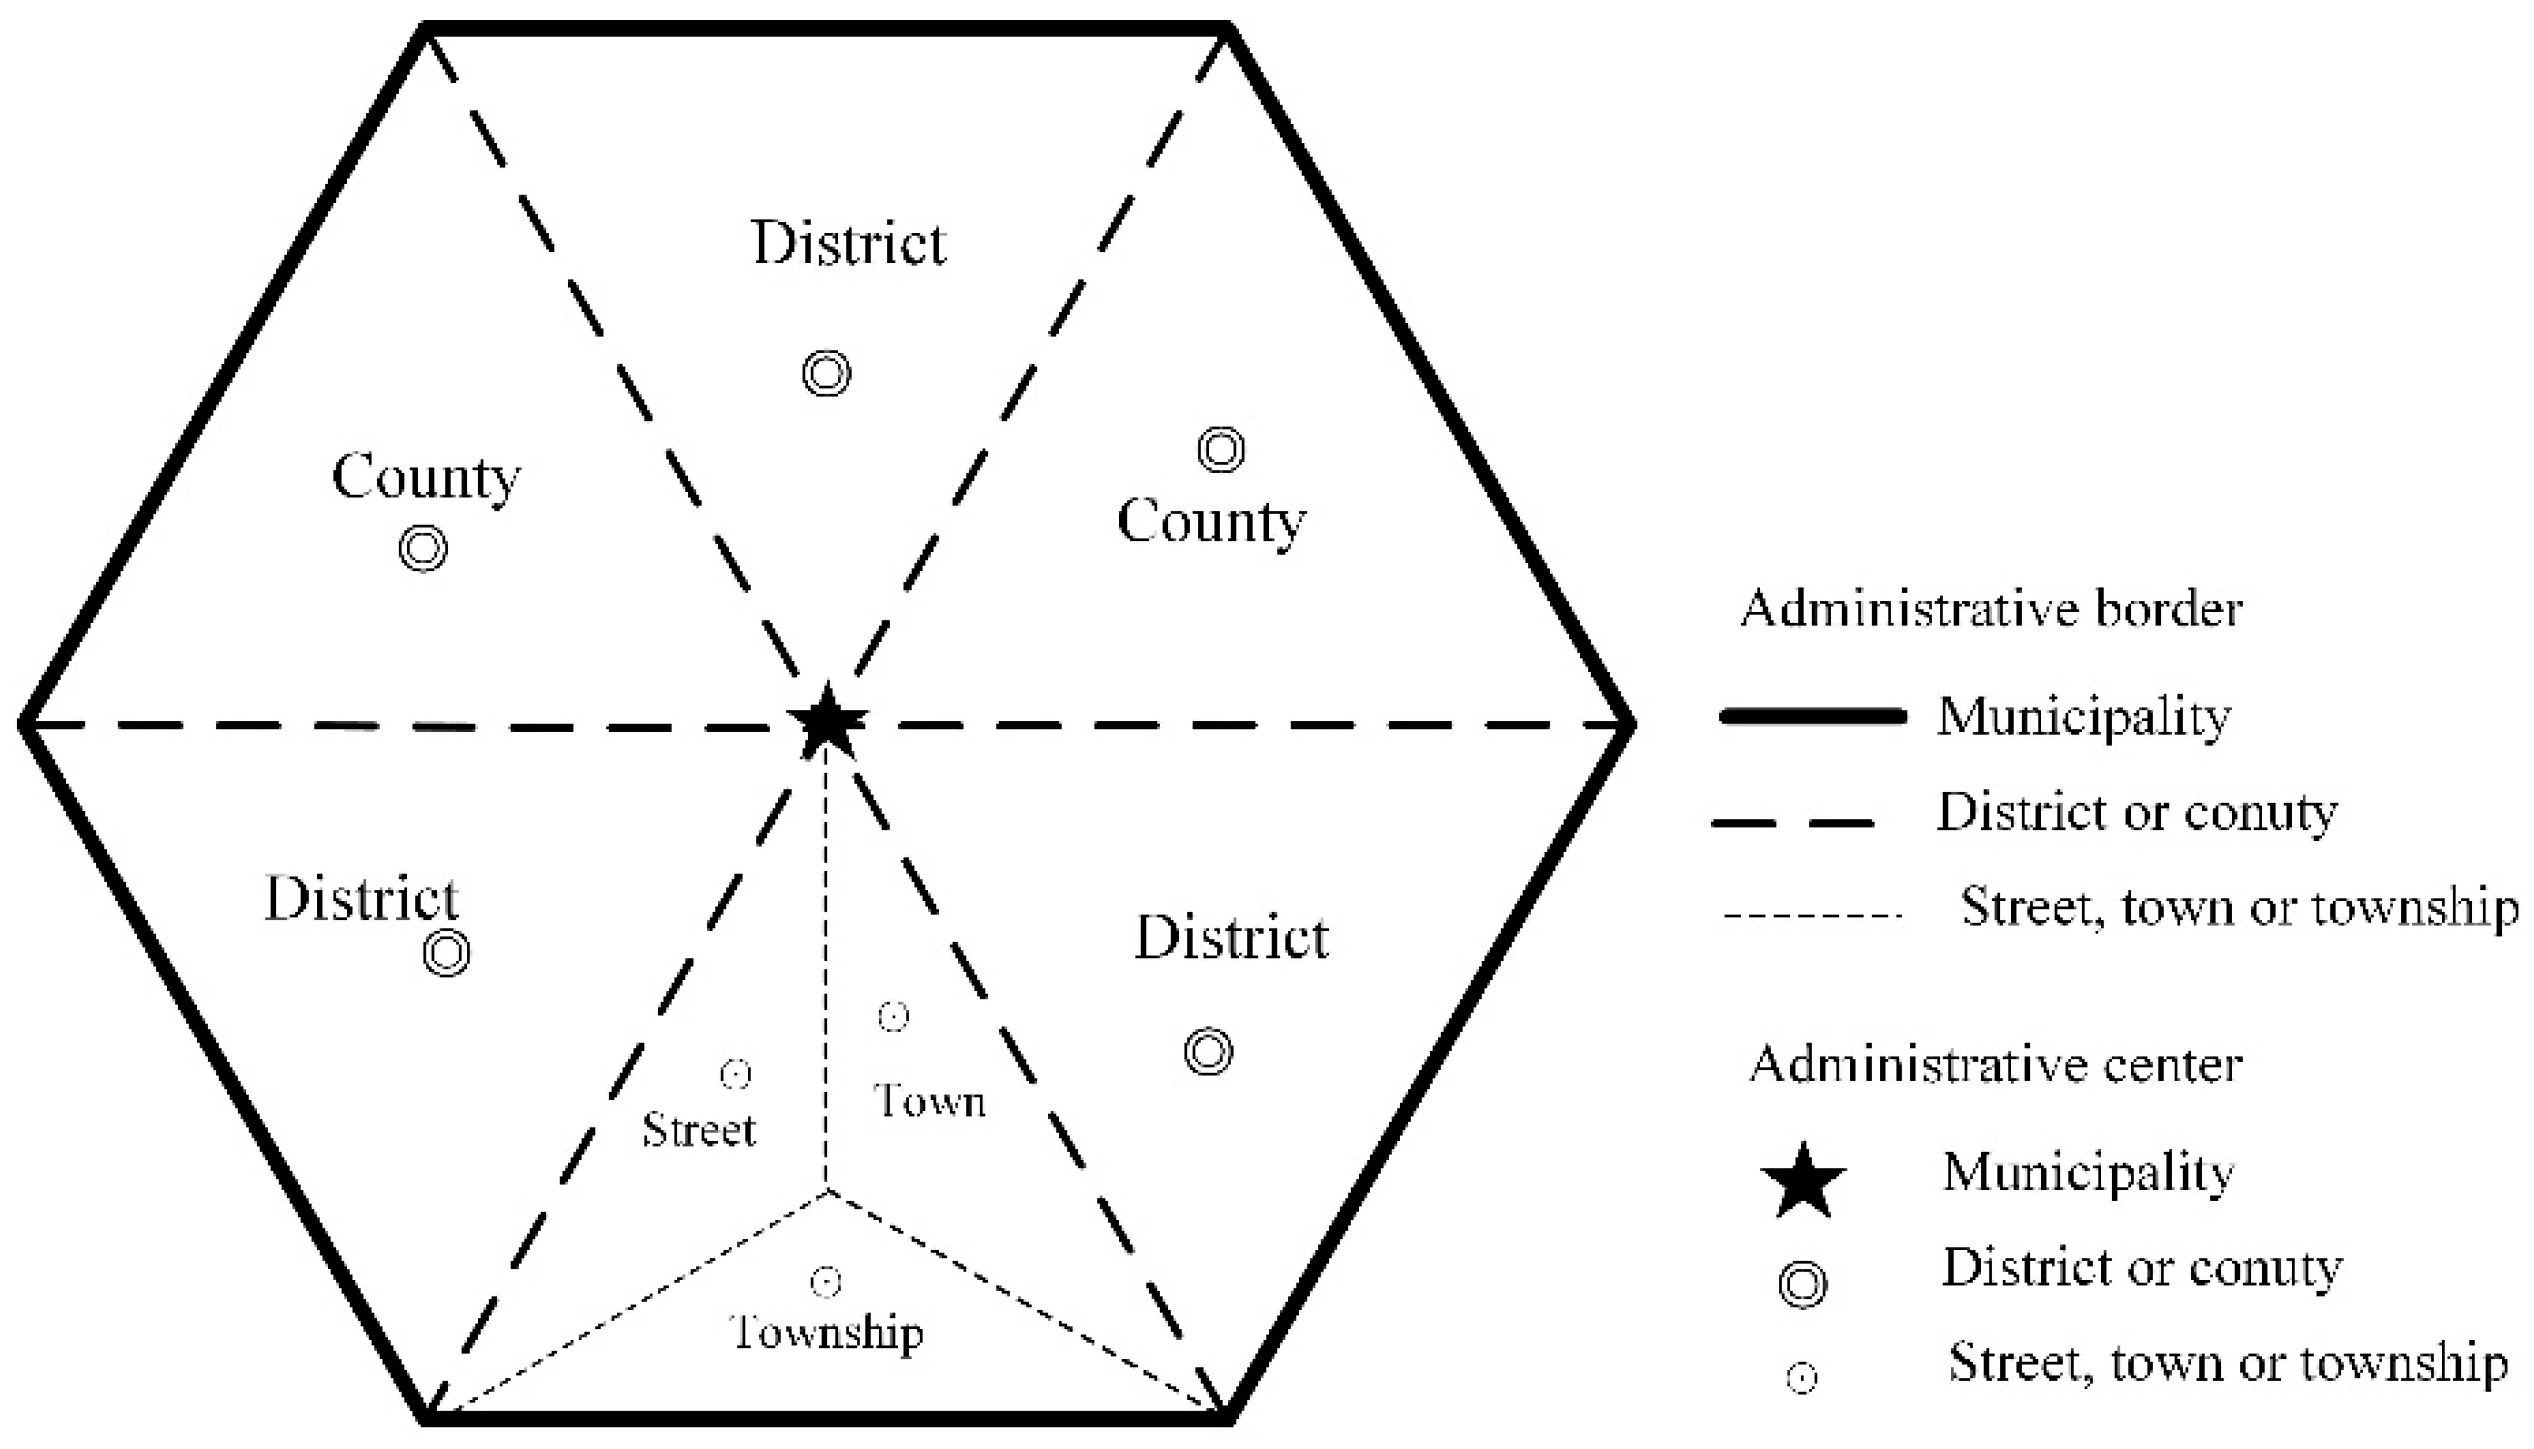
2. Background and Analytical Framework

Previous studies have demonstrated the central role of land development in the fiscal system of China’s local governments and the importance of this fiscal concern in the spatial restructuring of Chinese metropolises from a monocentric pattern to a polycentric one [22,23,33].Therefore, it is important to comprehend China’s fiscal decentralization and political centralization processes in exploring the influence of hierarchical administrative centers on the intensity and direction of urban land expansion.
Fiscal decentralization requires local governments to provide various public goods to its citizens, which is central in the administrative promises of local governments. Tiebout’s [40] theory of voting with the feet posits that the objective basis of governmental decentralization lies in public goods because local states can optimize the allocation of public resources and provide better local public goods. The transfer of financial power and responsibility to local governments at all levels helps improve economic efficiency, for local governments in comparison to central governments enjoy informational advantages in resource allocation [41]. In this sense, the main goal of China’s fiscal decentralization is to distribute the fiscal power and responsibility of the central government to local ones and simultaneously mobilize the initiative of the latter in public affairs [42,43,44].
However, the tax-sharing reform between the central government and local governments in China has changed the fiscal revenue and expenditure structure of local governments, leading to a fiscal arrangement of “strong central and weak local.” This means that the financial and administrative powers of local governments are mismatched [42,45,46]. This mismatched fiscal structure has forced local governments to seek new financial resources to fulfill the expenditure of administrative tasks [43,44]. Land is the key resource that can be controlled and used by local governments to generate extra revenue. In the competition for land control, local governments successfully monopolize the land market by using their political and administrative capacities [46]. According to land administration law and the urban real estate administration law, the rights of land administration, land-use planning, and conveyance of state-owned urban land belong to local governments [47,48]. Under China’s unique urban–rural dual land system, local governments are the sole suppliers of urban land [49]. By utilizing their control over land, local governments rely greatly on the input of land resources to promote urban economic growth. More specifically, the development of local economies is supported largely through the construction of new cities, developmental zones, industrial parks, and university towns [25,50]. Thus, China’s dramatic urban economic growth has been closely associated with the rapid expansion of urban land [51,52]. Numerous empirical studies have also confirmed that Chinese fiscal decentralization is a key reason for the rapid urban expansion and excessive occupation of agricultural land [53,54,55].
Fiscal decentralization and political centralization in China are determined by an authoritarian system [43,44,46,50]. The lower-level government officials are appointed and evaluated by higher-level government officials, which means that a higher-level government has credible administrative authority over a lower-level government, and that the central government holds absolute administrative and judicial control over the local governments [56]. In China’s nationally unified political labor market, there is only one employer, namely, the Chinese government. Once local officials leave this political market, it is impossible for them to find other political opportunities [57]. Some scholars believe that the miracle of China’s economic development is more successful than that of Russia and other post-communist countries because China maintains political concentration and the potency of its central government to reward and punish local officials along with economic decentralization at the same time [58]. The political promotion incentive, with GDP as the main assessment index, has been conceived to promote competition among local governments for economic growth [59], which will in turn motivate local government officials to put in efforts to attract land investment [60]. This gradually pushes local governments to move towards the developmental mode of land acquisition, land development, and land transfer, persuading land finance to push forward the expansion of urban land [52,59].
Administrative division refers to the division of administrative regions for the convenience of administrative management, including administrative ranks, administrative jurisdiction, administrative centers, and other elements. The administrative division system of China traces its origin from the county system of ancient Qin and Han Dynasties. It has developed into the traditional regional division system, the urban division system, and the autonomous division system of minority areas [61]. Under the urban division system, although the administrative rankings of centrally administrated cities, sub-provincial cities, and prefecture-level cities are different, they are similar to the following three-level administrative structures: municipality-district or county-street and town or township [37]. All levels of local governments have their own administrative and economic powers [62] (Figure 2).
The administrative center is the government’s residence of administrative units and other public management agencies. It is the political core of a municipality or district and one of the basic elements of administrative divisions [63]. It is expected to have a significant impact on urban land expansion. It has been widely agreed that cities with political elites tend to receive preferential policies [64]. Thus, it is fair to say that political centers are more likely to develop into mega cities because of their political and economic significance and more developmental resources compared with those of other cities [65]. Some studies reveal that the difference in urban administrative rank is the key reason for the differences in urban scale and growth [62]. Similarly, as the administrative center of China, Beijing has the unique advantage of being the capital of the country. Beijing receives extra care from the central government and strong support from other provinces and cities, enriching it with abundant public resources, considerable information, and the ability to establish a large number of institutions concerning education, research, and health care. All of these make Beijing a huge attraction for enterprises and talents [66]. Owing to a long history of development, provincial capital cities and county cities, as local administrative centers, are symbols of urban political culture and urban cohesion in China [67].
The administrative center is often the best-developed city in a region; its location often plays a strong guiding role in urban land expansion [68]. Under China’s decentralizing administrative and financial systems, local governments at different levels have their own power to allocate certain resources. They both possess strong motivation and abilities to prioritize the development of the administrative center and develop an area for the establishment of an administrative center, which may bring about a certain agglomeration and scale benefits to the population and economy. The administrative center would gradually become an urban center and would play a critical role in driving the development of the entire region. Moreover, subregions closer to the administrative centers are easier than remote ones to attract industrial investment and population on the one hand and to receive more quotas of land development in the top-down distribution system of land development rights. The administrative division in China can be understood as the projection of national power and benefit distribution in geographical space [69]. The administrative level is highly related to the administrative power of the government. Administrative centers at different levels hold different status, responsibilities, authorities, and jurisdiction. Thus, the closeness to administrative centers at different levels is expected to have different impacts on the density and direction of land development in the suburbs. In this sense, the actual land development of townships in suburban Beijing is affected jointly by the distance between the city center and the city center.
Based on the above analysis, the following hypotheses are proposed:
Hypothesis 1. 
Given the crucial role played by administrative power in Chinese cities, distances to administrative centers at various levels have significant effects on the possibility of suburban land to be developed for urban use.
Hypothesis 2. 
The direction of urban land expansion in the suburb is affected jointly by hierarchical administrative centers.
Hypothesis 3. 
Under the effects of hierarchical administrative centers and suburban transportation lines, urban land expansion in metropolises like Beijing is likely to show a mixed pattern.

3. Research Area, Data, and Methods
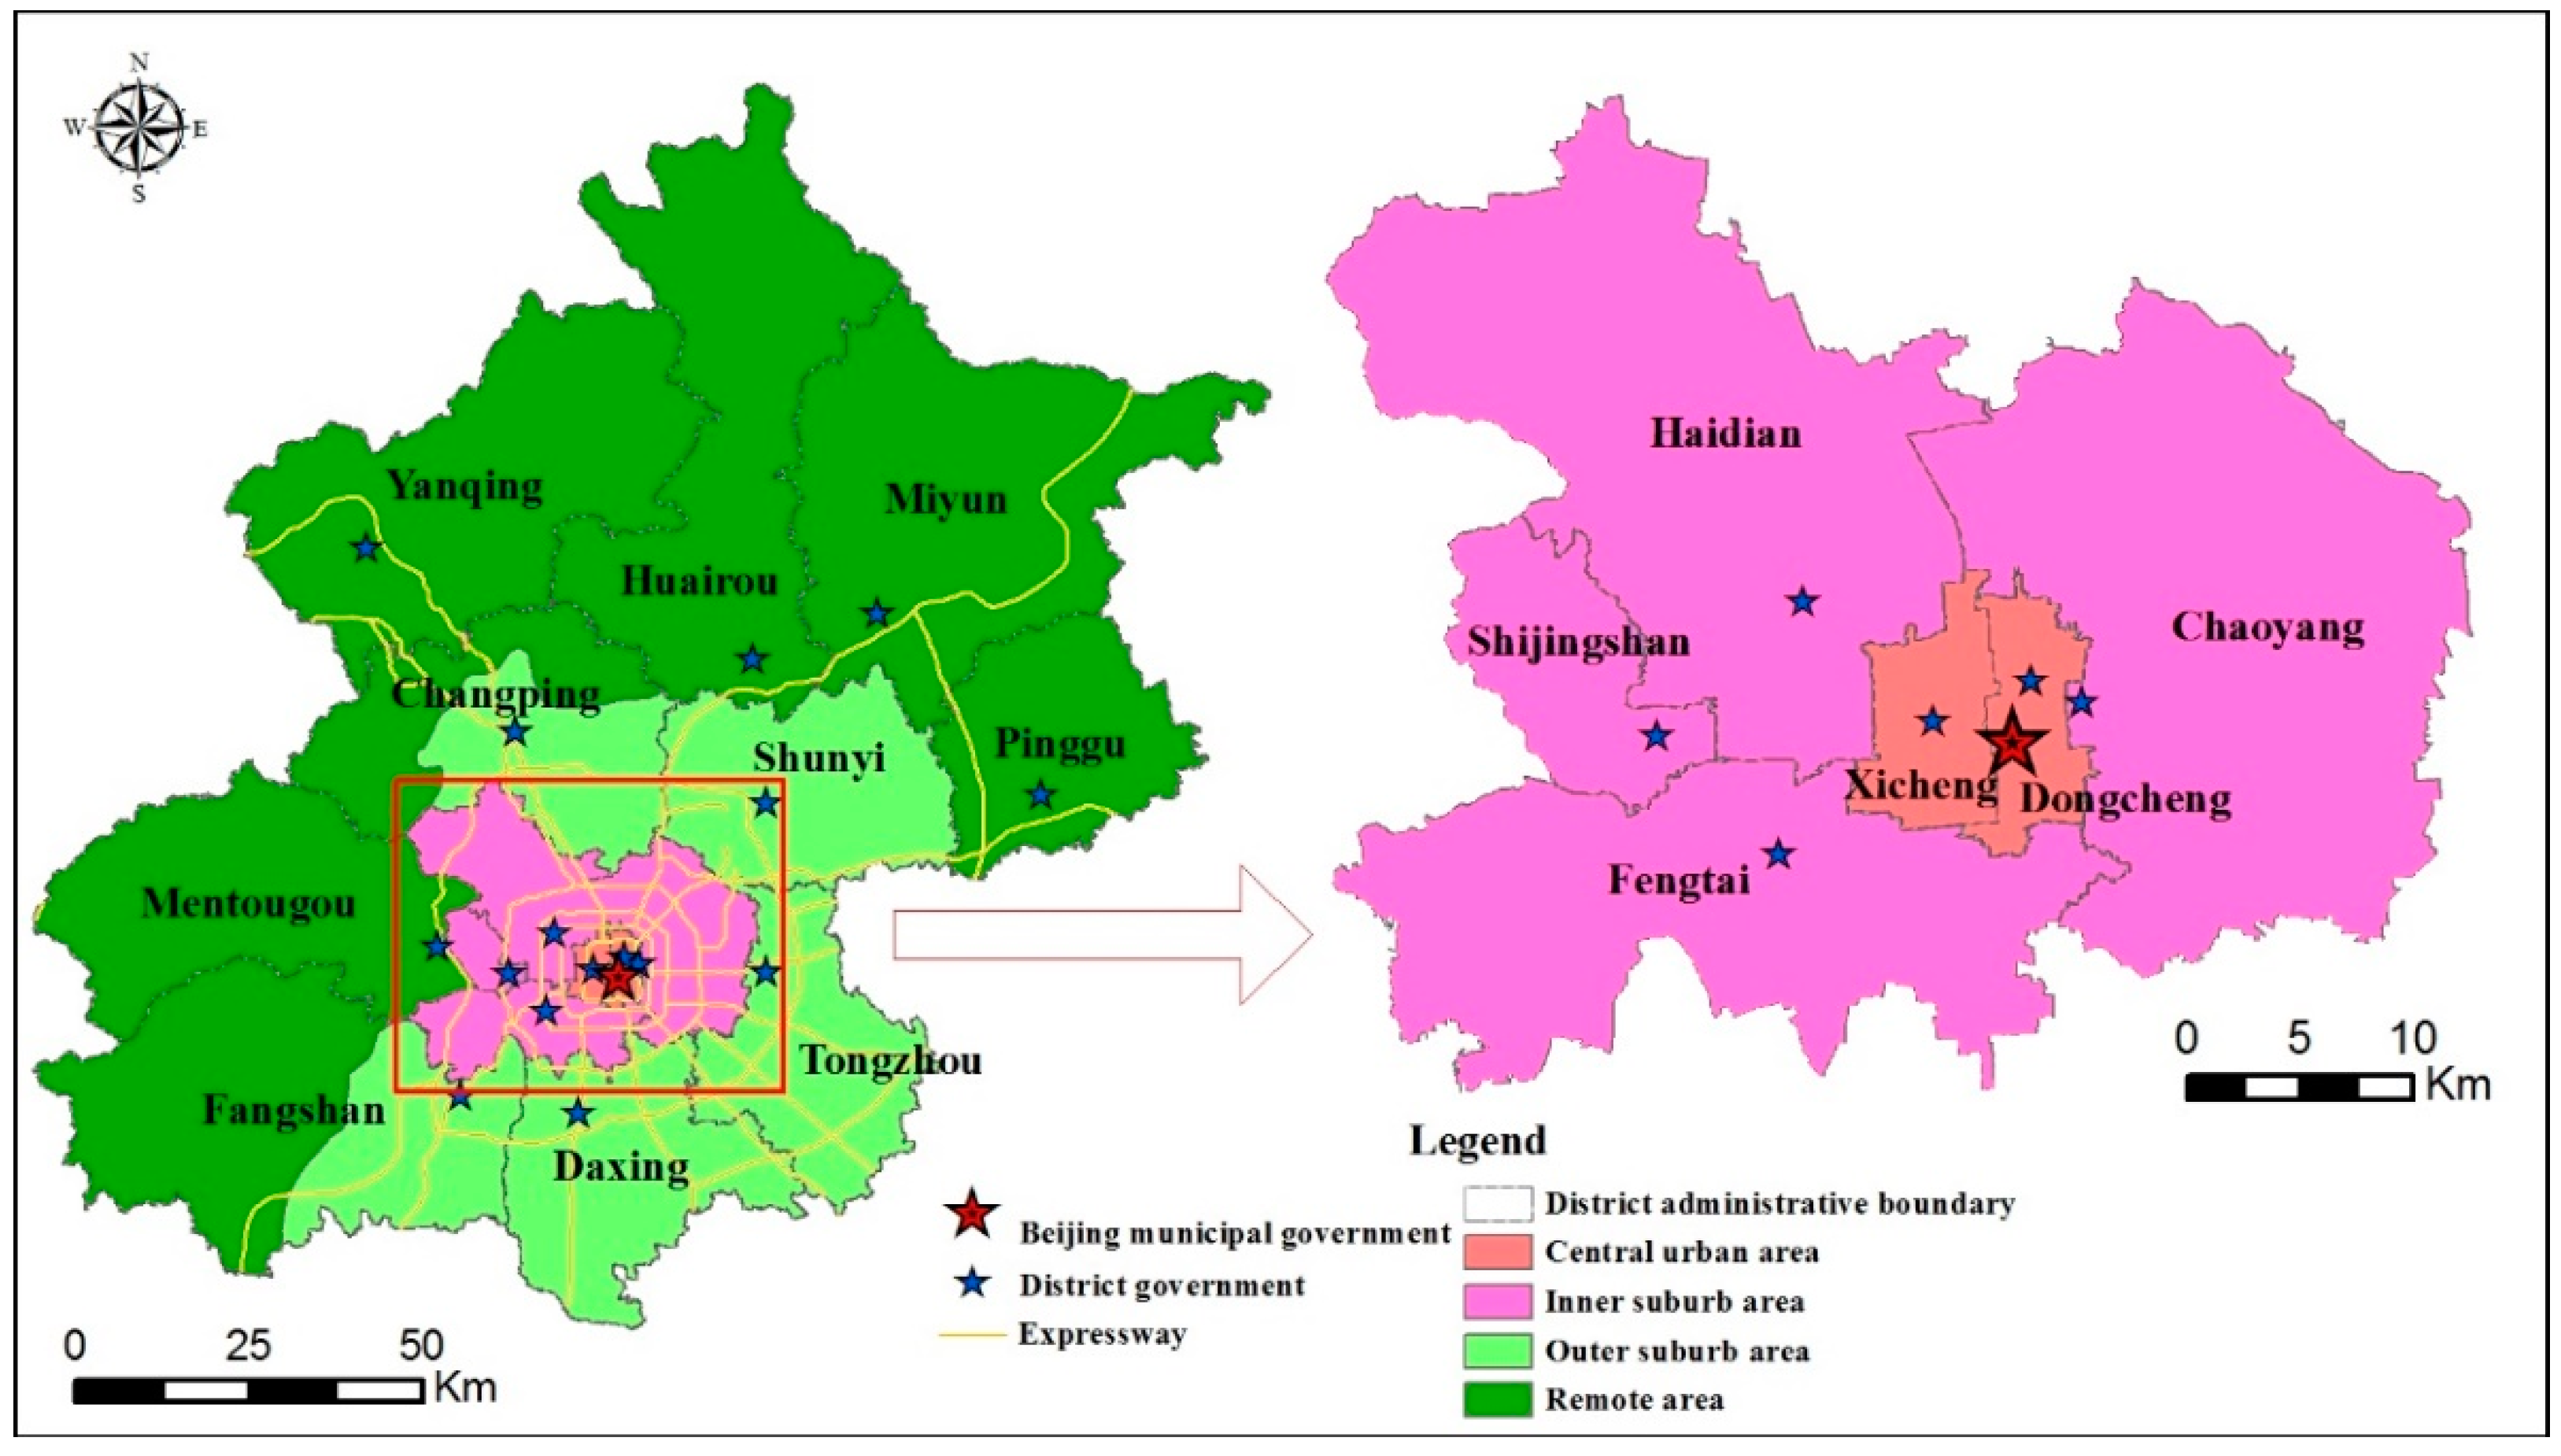
3.1. Research Area

Beijing has a land area of 16,410 km2, of which the plain area is 6338 km2, accounting for 38.6%. It governs 16 districts and counties. Among them, Xicheng and Dongcheng are the central urban areas; Haidian, Chaoyang, Fengtai, and Shijingshan are the inner suburbs; Daxing, Tongzhou, Fangshan, Shunyi, and Changping are the outer suburban plains; and Huairou, Miyun, Pinggu, Yanqing, and Mentougou are the remote mountain areas. There are 331 township-level units under the administration of districts and counties, including 150 streets, 143 towns, and 38 townships (Figure 3).
The reasons for selecting Beijing as the case study are as follows. First, one of the salient features of the administrative system of China’s cities is that cities administer districts or counties. As a centrally administrated city, Beijing is typical of municipalities with a relatively large number of districts. Second, as the capital city of the country and the economic center of North China, Beijing is a typical representative of large cities on the North China Plain. Third, Beijing has witnessed rapid urban expansion in the past few decades. This might also be the reason why a number of studies on the subject area have selected Beijing as the case study [25,70,71,72].

3.2. Data

The land data were derived from land use surveys held in 1996, 2003, and 2010 (Figure 4). The urban land area was found to be 1993.7 km2 in 1996, accounting for 12.2% of Beijing’s total land area; 2507.5 km2 in 2003, accounting for 15.3%; and 3080.4 km2 in 2010, accounting for 18.8% (Table 1). The urban land saw an annual growth of 73.4 km2 or 3.3% during the period 1996–2003 and then 81.8 km2 or 3.0% in the following seven-year period. Although the majority of the newly developed urban land was located in the inner and outer suburbs, it could be found almost everywhere within the administrative boundary of the Beijing municipality with only some mountainous remote areas as exceptions.

3.3. Methods

We used a multi-ring buffer zone analysis to explore the impact of administrative centers on urban land expansion. To identify the main expansion direction of the research unit, three measures were applied: land development intensity was used to measure the level of development in a given time point, the average annual expansion intensity was used to measure the speed of urban land expansion, and sector-shaped zoning was used to calculate the average annual expansion intensity in each direction.

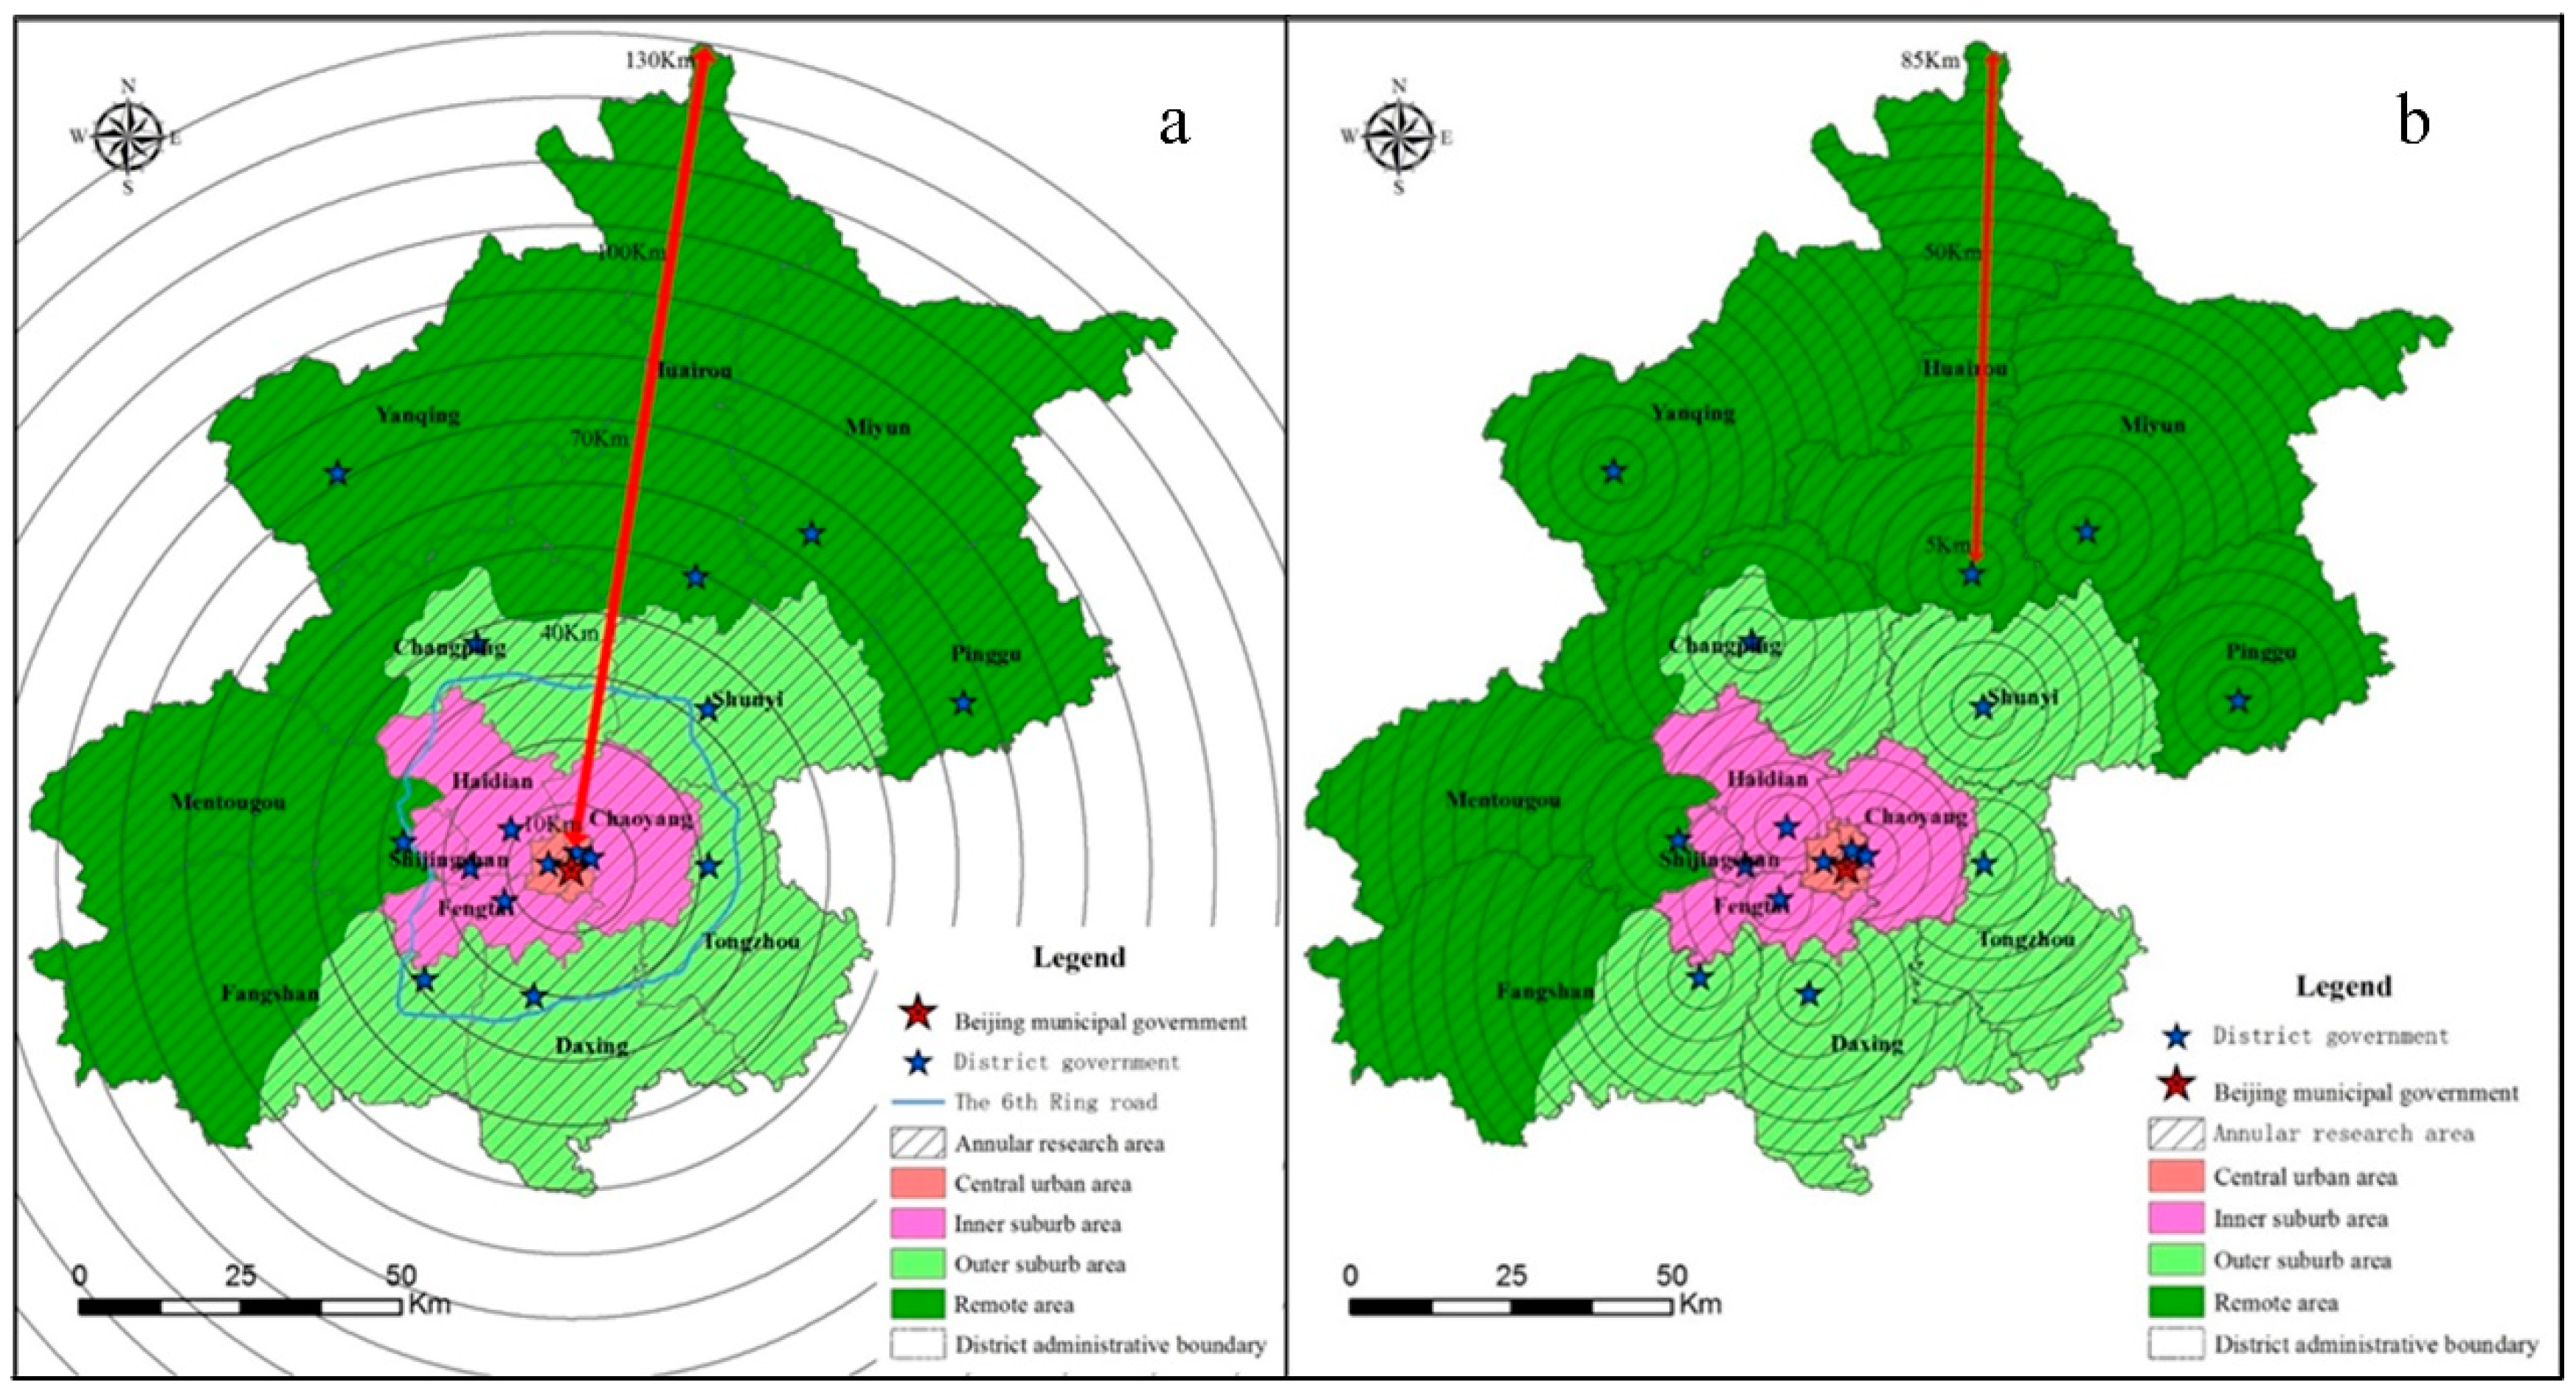
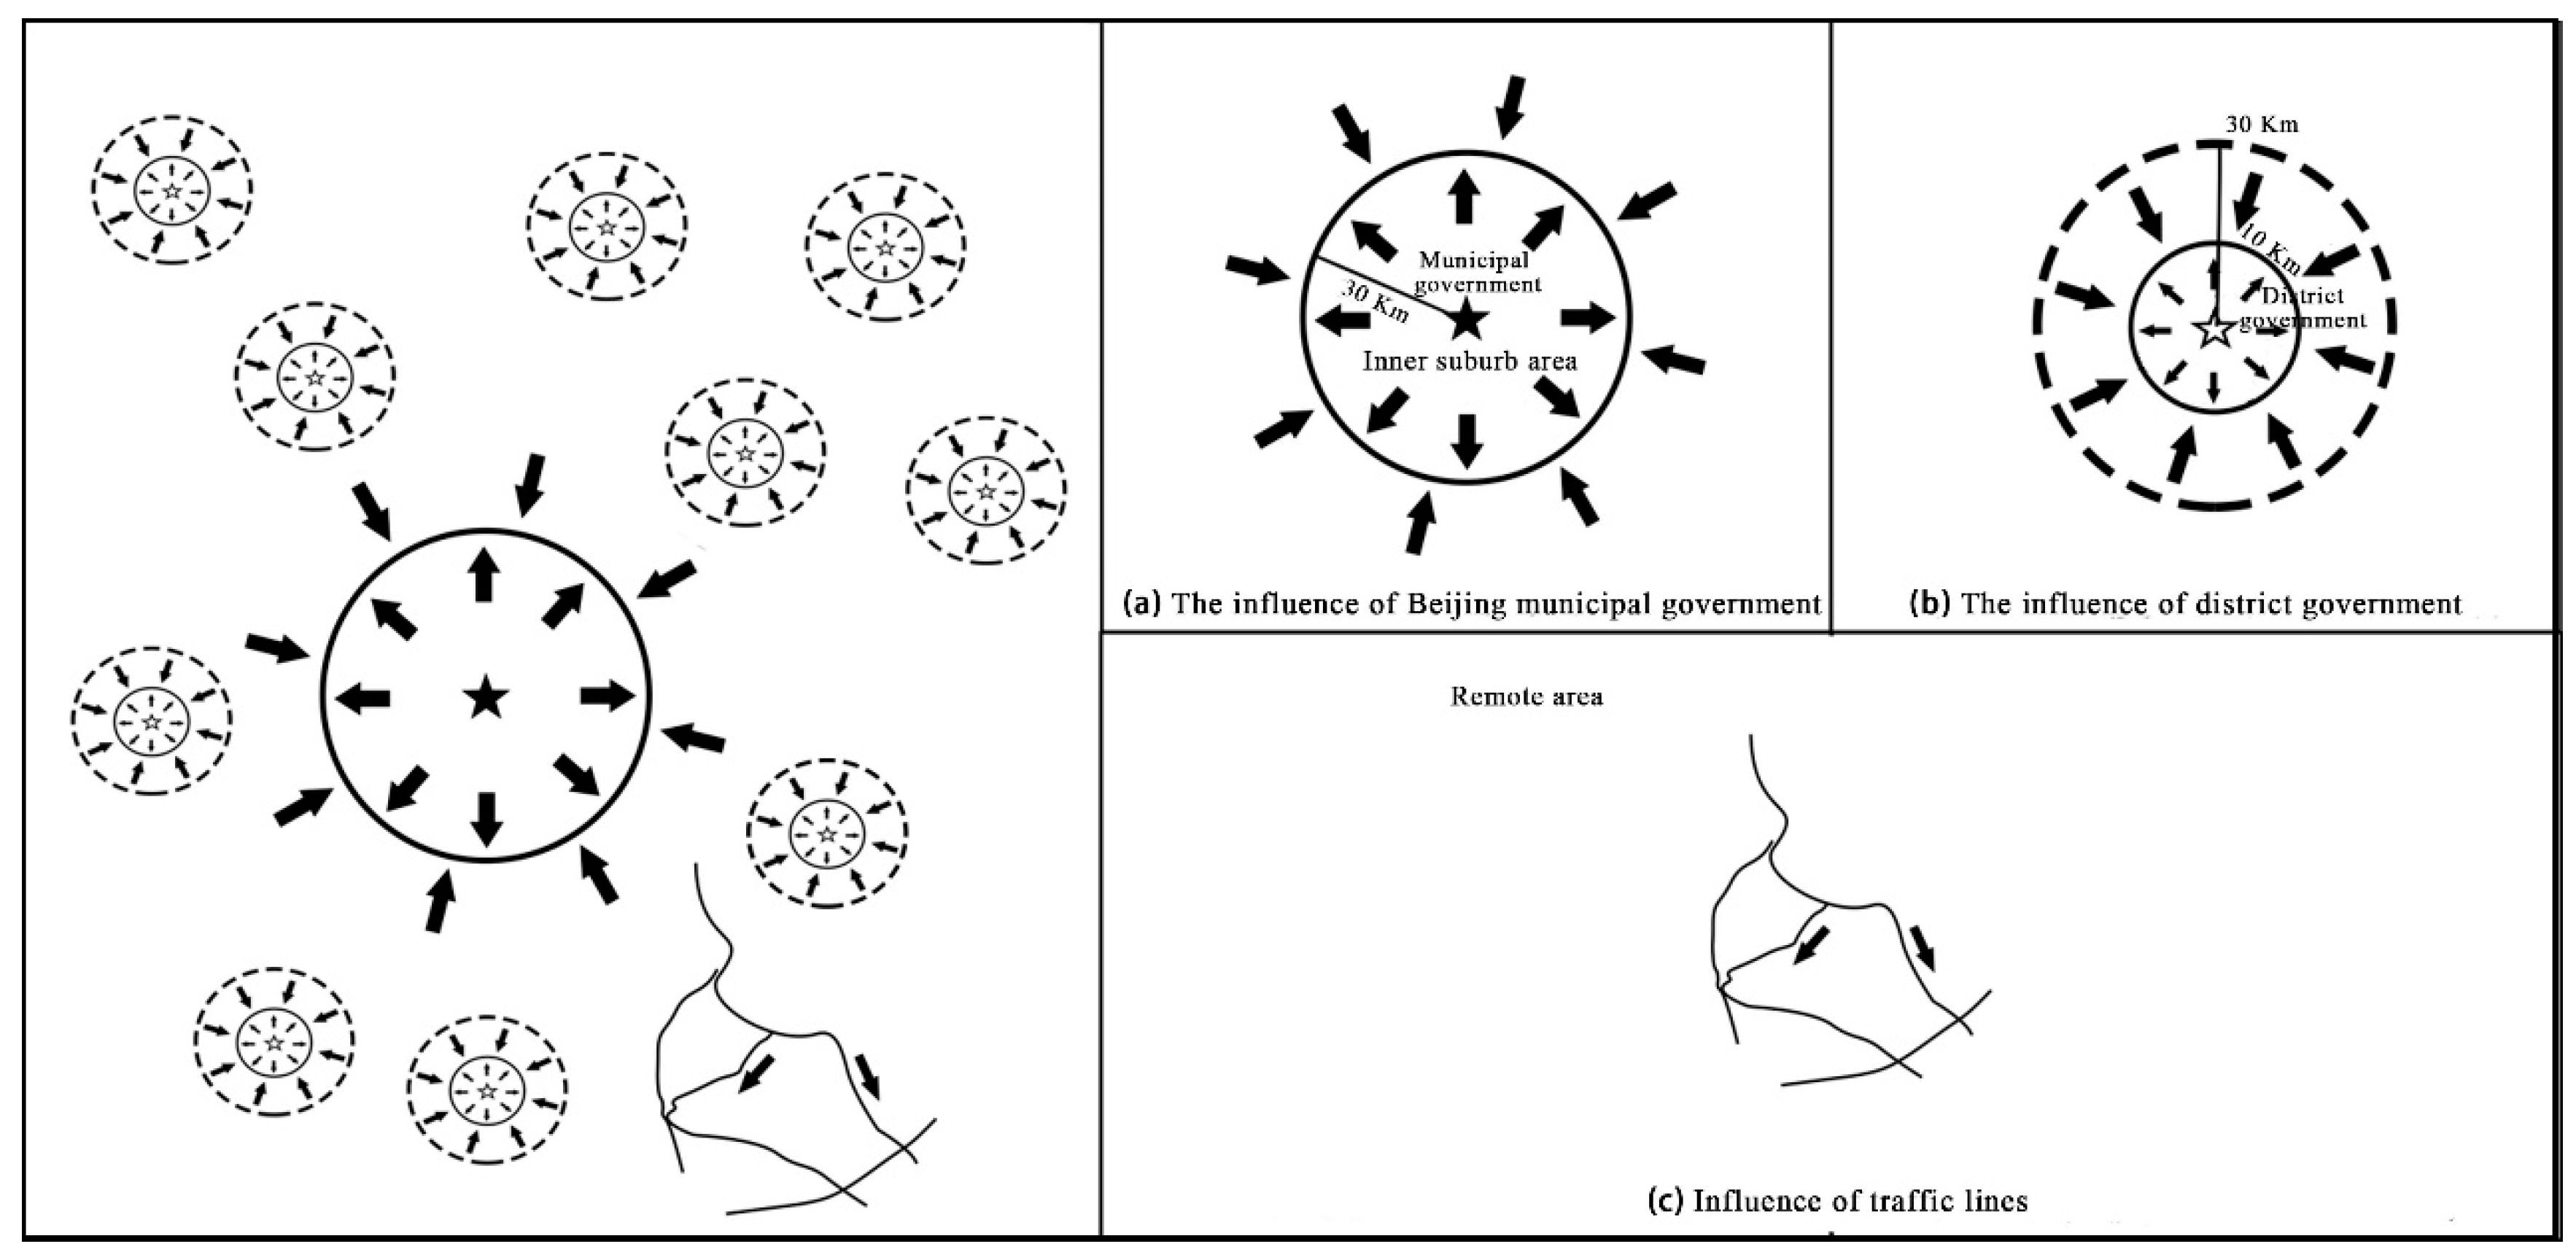
3.3.1. Analysis of Multi-Ring Buffer Zones

The multi-ring buffer zone analysis was adopted to explore the impact of administrative centers on urban land expansion. The location of the municipal government, as of the municipal center, made a buffer zone every 10 km, ranging 10–130 km, with a total of 13 ring buffer zones to deal with urban land expansion at the municipality level (Figure 5a).
The location of each district and county government (as the district centers) made a buffer zone every 5 km to show urban land expansion at the district level, ranging 5–85 km. Among them, Huairou District has a maximum of 17 buffers (Figure 5b).

3.3.2. Urban Land Expansion Intensity

The land development intensity was used to measure the level of development and average annual expansion intensity to measure the urban land expansion speed [14,73,74]. The calculation formula for the land development intensity is as follows:
D i , t = U L A i , t T L A i
In the formula, D i , t represents the land development intensity of space units i in the year t , U L A i , t represents the urban land area of space units i in the year t , and T L A i represents the total land area of space unit i .
The calculation formula for the average annual expansion intensity is as follows:
U i , t t + n = U L A i , t + n U L A i , t T L A i n 100
where U i , t t + n represents the average annual expansion intensity of space units i from the year t to the year t + n , U L A i , t + n represents the urban land area of space unit i in the year t + n , and n represents the time interval.

3.3.3. Urban Land Expansion Direction

Using sector-shaped zoning to calculate the average annual expansion, intensity in each direction was applied to determine the main expansion direction of the research unit. The methods adopted were as follows: (1) administrative centers are set as the center for labeling the expansion direction of the research unit; (2) 22.5° north by west is set as the starting point, and each research unit is divided into eight fan-shaped areas with equal included angles in the north, northeast, east, southeast, south, southwest, west, and northwest directions; (3) annual average expansion intensity is calculated for each sector; (4) the average annual expansion intensity values of the 8 sectors are compared to find the sector with the largest value, and the direction it represents is the expansion direction of the research unit; (5) the arrow symbol is used to indicate the expansion direction of the research unit; (6) finding the geographical location, the administrative boundary, and the direction of the arrow of the research unit to analyze the relationship between the expansion direction of the urban land and the administrative center, and to mark them with arrows of different colors. There are three kinds of relationships: pointing to the administrative center, deviating from the administrative center, and having little to do with the administrative center. Again, the administrative center here may indicate the city center and district centers.

4. Results

4.1. Administrative Centers and Intensity of Urban Land Expansion

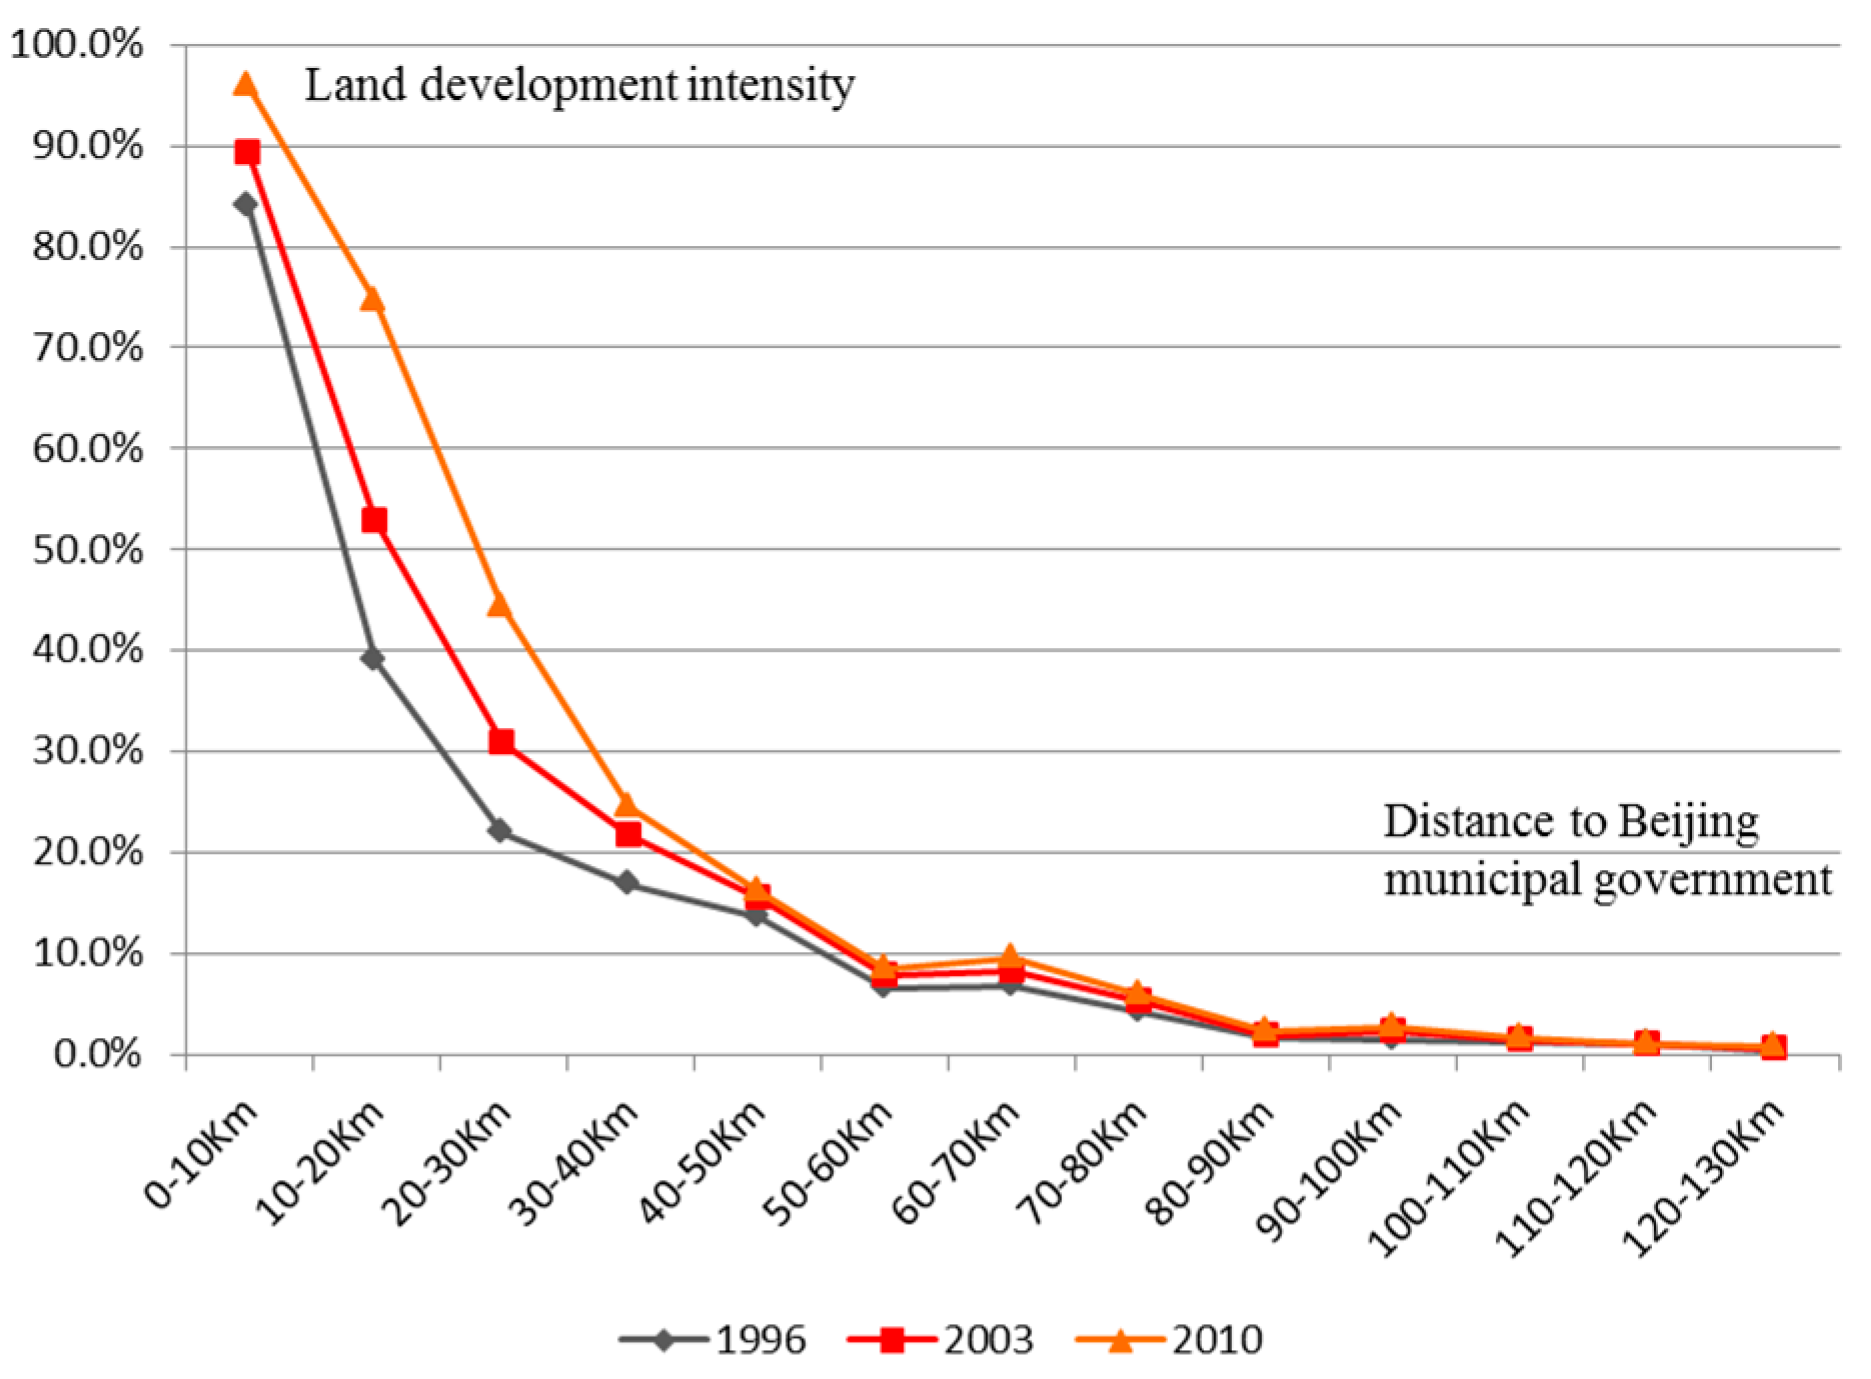
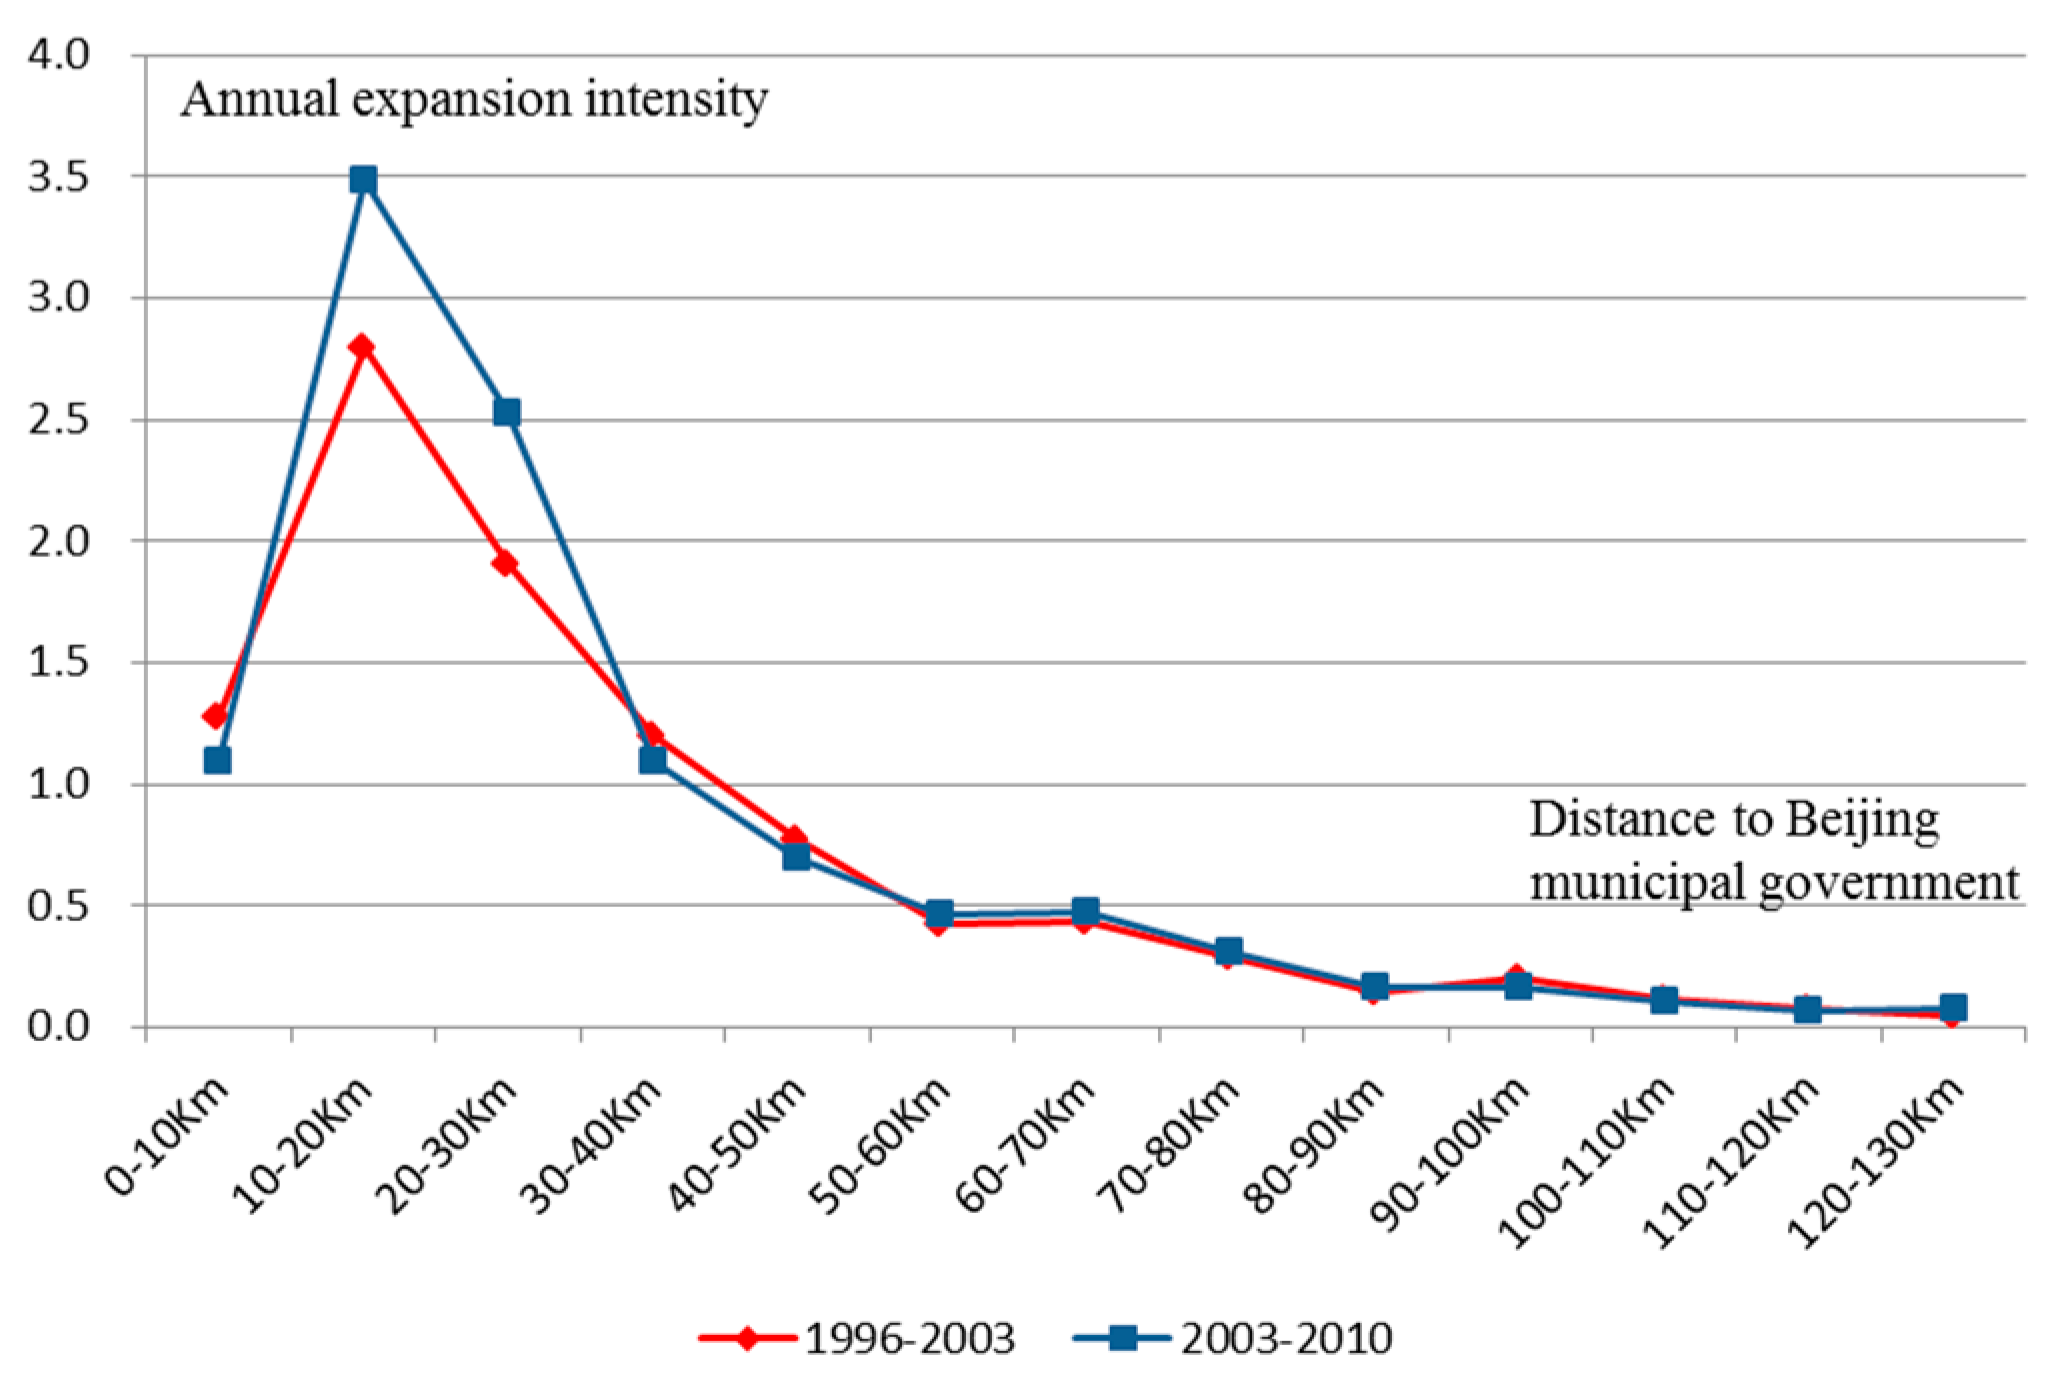
4.1.1. Effect of Municipal Center

At the municipality level, the results show that the municipal government has a significant impact on urban land expansion. The closer a township is to the municipal center, the higher the intensity of land development in the township (Figure 6). Moreover, the rate of urban land expansion increases initially and then decreases with distance to the city center as the influence of the center weakens (Figure 7). In general, the influence area of the municipal government is about 50 km, which mainly covers the plain area of the Beijing municipality.
The urban land area increased continuously in almost every buffer ring area from 1996 to 2010 (Figure 5a). In streets and towns close to where the municipal government is located, the area of urban land increases with the distance to the center for the rapid growth of the total area of annuli coupled with a moderate decreasing trend of urban land share in these annuli. In contrast, urban land area decreases continuously with distance as the decline of urban share surpasses the growth of total land in annuli. Given this logic, the buffer zone 0–30 km is the area with the largest distribution of urban land, and the total area of urban land in this area accounts for half of the entirety of Beijing. Within 0–30 km, urban land was found to be 977.0 km2 in 1996, 1264.1 km2 in 2003, and 1699.9 km2 in 2010, accounting for 49.0%, 50.4%, and 55.2% of the total urban land area in Beijing, respectively (Table 2). The distance to buffer 30 km happens to be the distance from Beijing’s sixth ring road to the municipal government, and it is the core region of metropolitan Beijing, including the central urban area, the inner suburb, and part of the outer suburb. Thus, the location of municipal government is spatially attractive for urban land development, leading to a typical spatial mode of concentric expansion. The central urban area and the suburbs within the sixth ring road of Beijing are areas with the largest urban land distribution.
The land development intensity decreased continuously with distance to the city center, while it increased in each buffer ring from 1996 to 2010 (Figure 6). The closer to the Beijing municipal government, the higher the intensity of land development. The land development intensity is highest within the 10 km buffer zone, and more than 80% of land within this area has been developed for urban use. The 10 km buffer zone is the central urban area where the Beijing municipal government is located. In buffer zone 60–70 km, the land development intensity is higher than the surrounding areas. The reason for this is that the district and county governments of Pinggu, Huairou, Miyun, and Yanqing are located in this buffer zone. These results show that the locations of the Beijing municipal government and district and county governments have affected land use, and the lands around these locations are easier to develop for urban use.
As the distance to the municipal center increased, the expansion speed of urban land increased initially and then decreased from 1996 to 2010 (Figure 7). The area within the 50 km buffer is the main area of urban land expansion in Beijing, which includes the central urban area, inner suburbs, and outer suburbs. Owing to the highest level of land development in the central urban area within the 10 km buffer zone, there is very limited vacant land available for development, resulting in low intensity of urban land expansion. A buffer 10–30 km area has the fastest expansion speed of urban land. This area has the highest annual expansion intensity because the location near the city center makes it easier for residents to get access to public facilities and profitable for enterprises enjoying agglomeration economies in the city center. In contrast, the expansion speed of urban land around 30–50 km decreased rapidly because of the weakened influence of the municipal government.

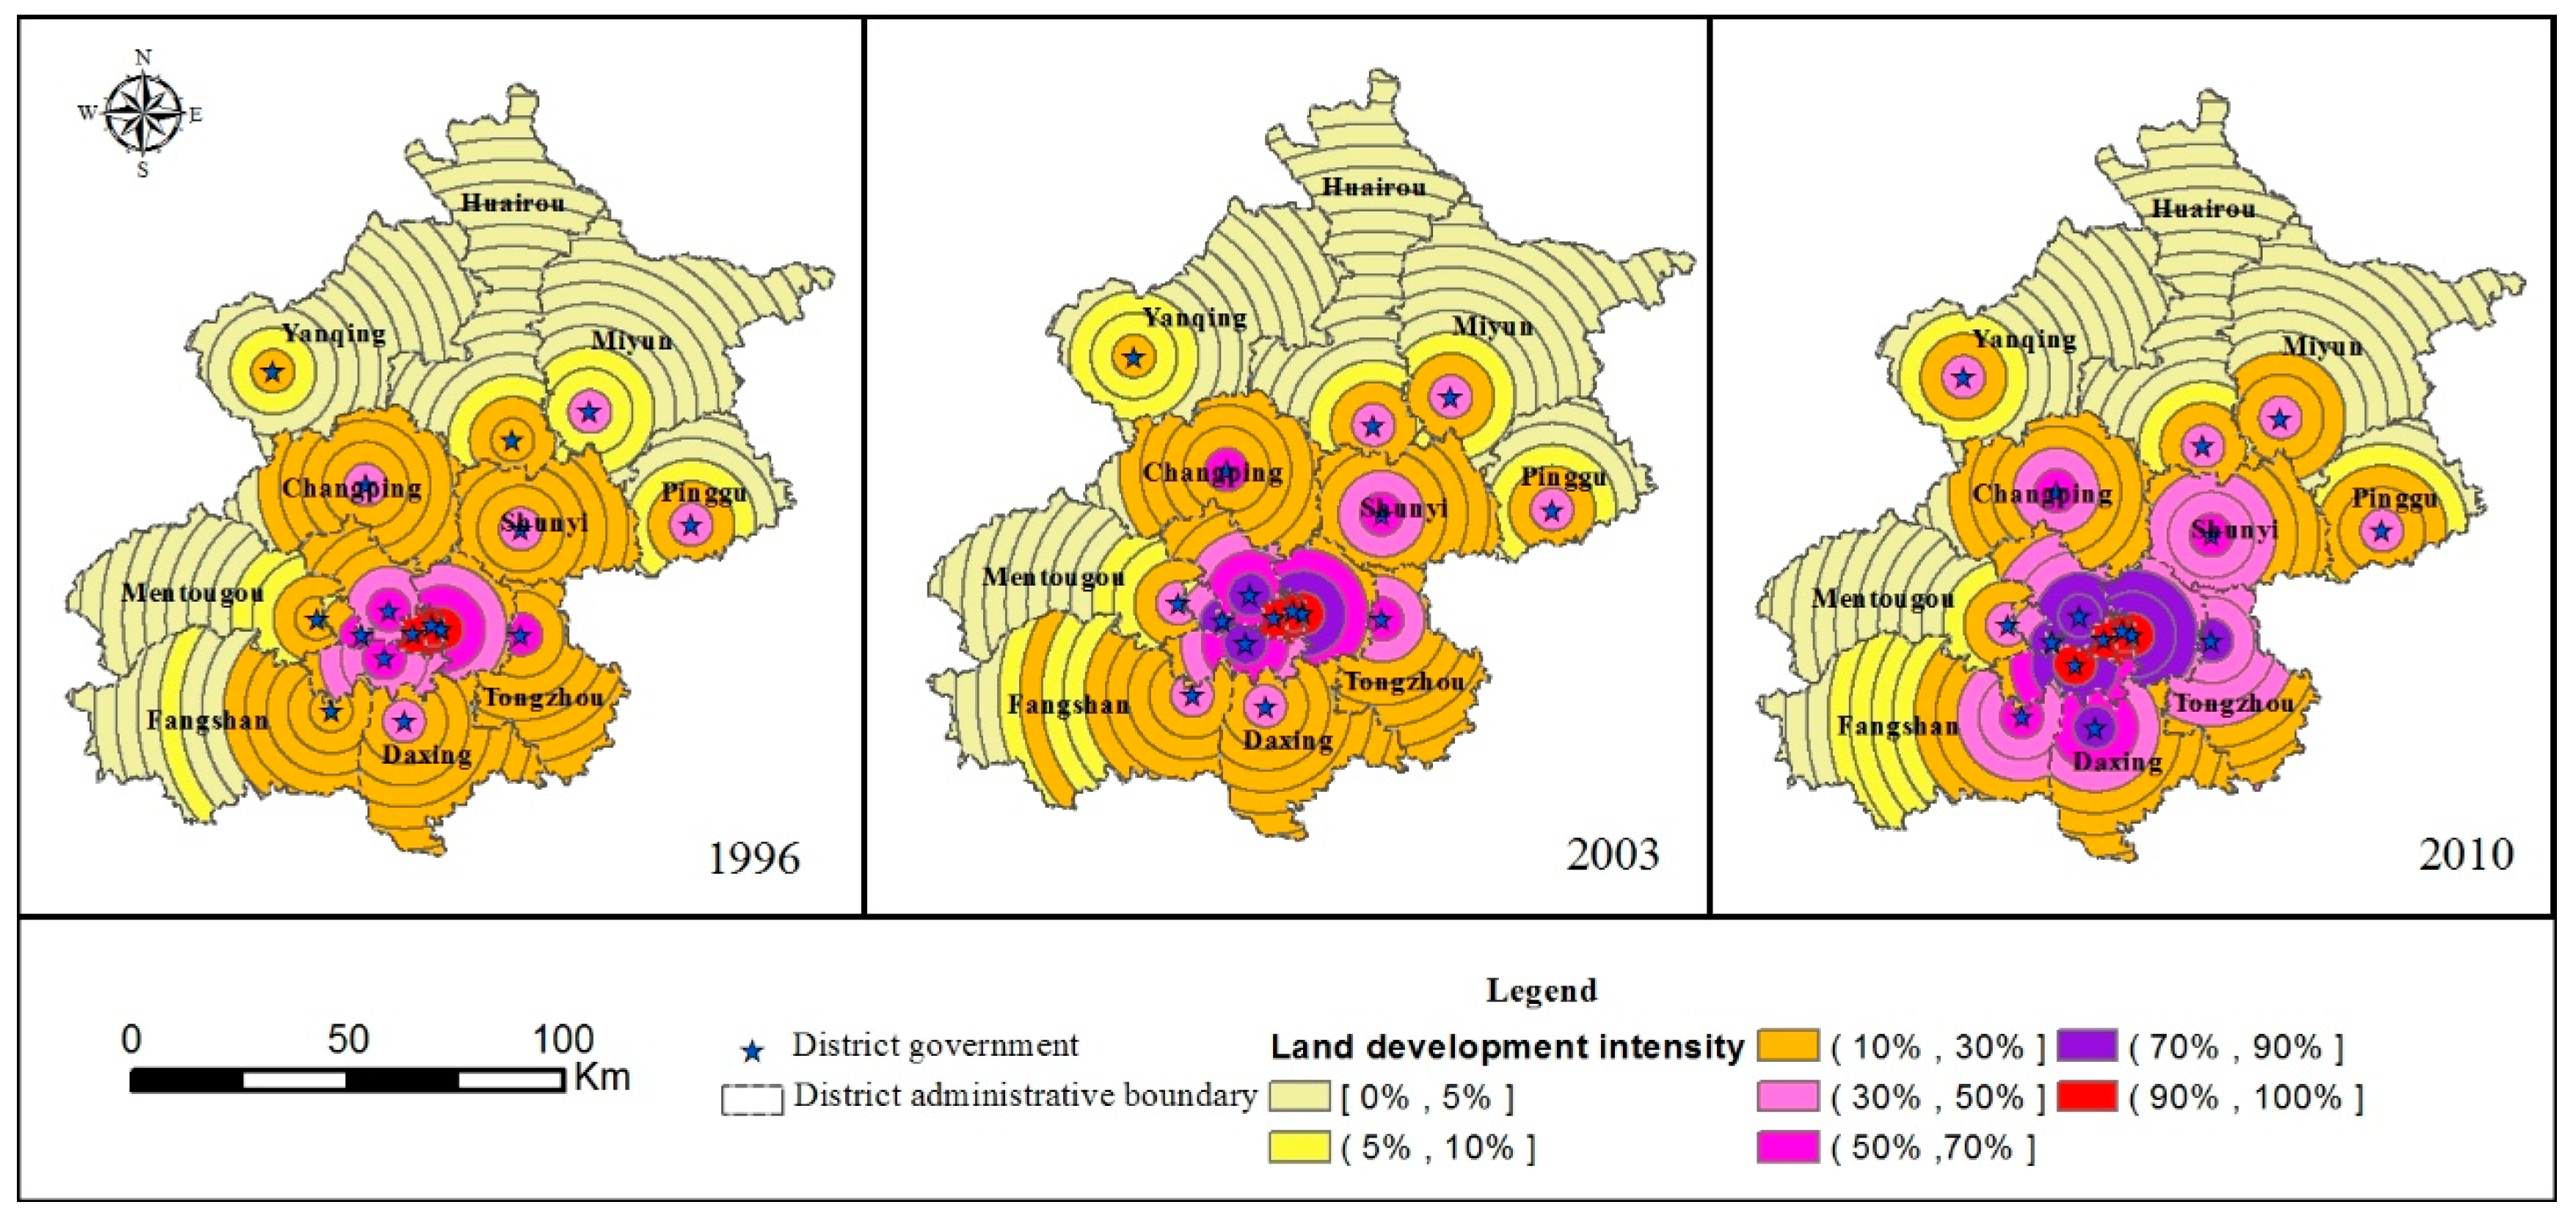
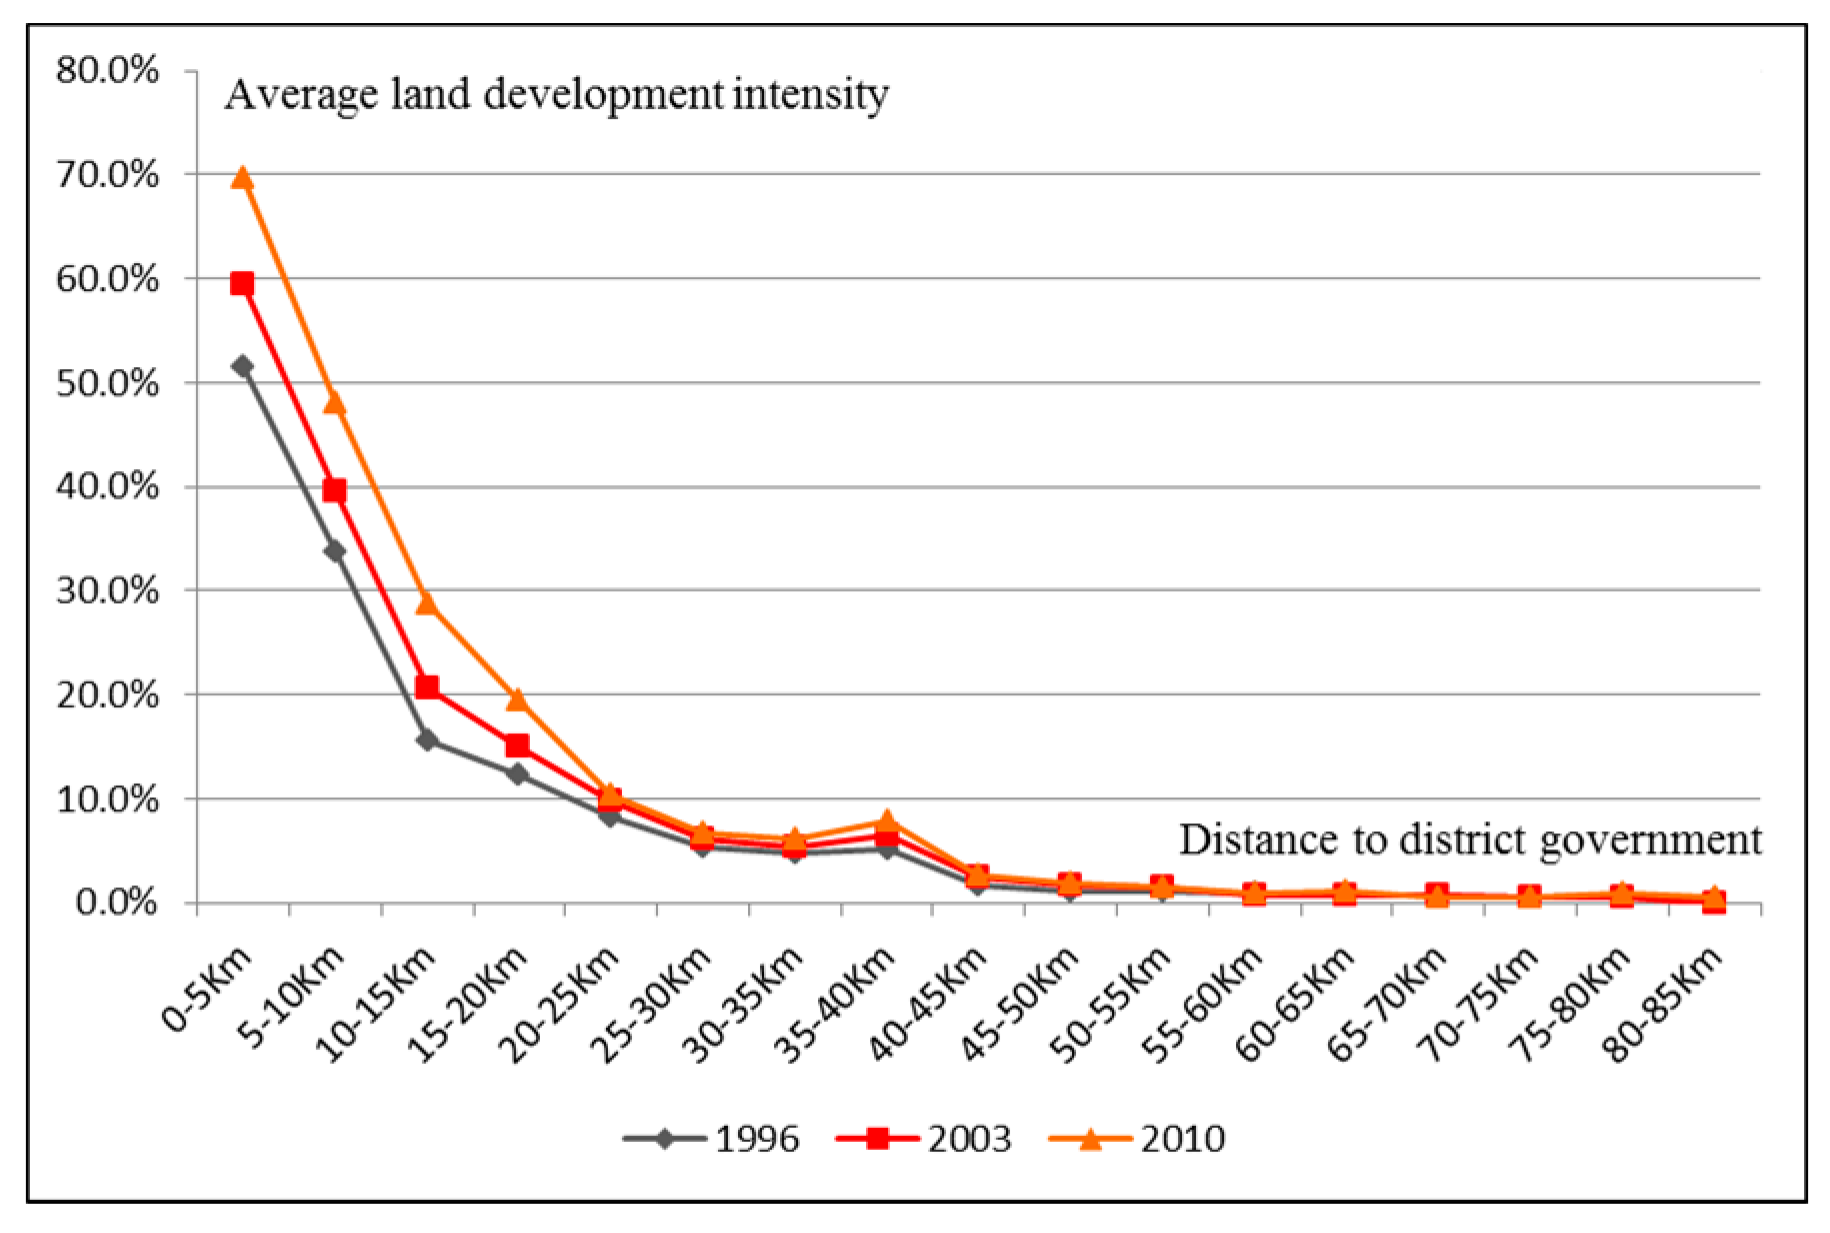
4.1.2. Effect of District or County Centers

The closer to the district and county governments, the higher the intensity of land development and the faster the expansion of urban land. The influence area of the district and county governments reaches about 20 km, which is significantly smaller than that of the municipal government (Figure 8 and Figure 9). However, the influence of the district and county governments on the expansion of urban land within the jurisdiction is also influenced by the distance from the district and county governments to the municipal government.
Figure 8 and Figure 9 show the impact of district and county governments on the distribution of urban land. The closer to the district or county government, the more land was developed, and the intensity of land development within the 20 km buffer zone was relatively high, with an average value exceeding 10% (Figure 9). The intensity of land development was the highest within the 5 km buffer zone, with an average of more than 50%. From 1996 to 2010, the trend became increasingly remarkable as the slope got larger and larger. In this sense, the district and county governments are spatially attractive to urban land development within the jurisdiction.
Figure 10 shows different patterns of spatial gradient in the inner and outer suburb. For counties and districts in the outer suburb and remote regions, urban land expands the fastest in areas close to the district and county centers and the growth speed declines gradually with the distance to the centers. In districts near the city center, however, the expansion of urban land is relatively small within 10 km of the district and county governments owing to the high level of land development. The Buffer zone 10–15 km from the district and county governments has the greatest urban land expansion intensity among the near suburbs.
The expansion of urban lands at the district and county levels is affected by the dual influence of the locations of municipal government and the district and county governments. In general, the closer the area to the district and county governments, the faster the expansion of urban land. Moreover, the closer the distance from district and county governments to the municipal government, the smaller the influence of district and county governments on the expansion speed of urban land. (1) In the central urban area closest to the municipal government, most of the land has been developed owing to the long-term influence of the municipal government. (2) In the inner suburbs, the district and county governments are close to the municipal government. The urban land in this area is more affected by the municipal government than the district and county governments, and a large amount of land has been developed in the area close to the municipal government. Thus, the closer to the district and county governments, the expansion intensity of urban land increases initially and then decreases, and the area with the largest expansion intensity is the 10–15 km buffer zone from the district and county governments. (3) In the outer suburbs and remote areas, which are far away from the municipal government, the district and county governments can independently affect the expansion of urban land; thus, the closer to the district and county governments, the greater the expansion intensity of urban land.

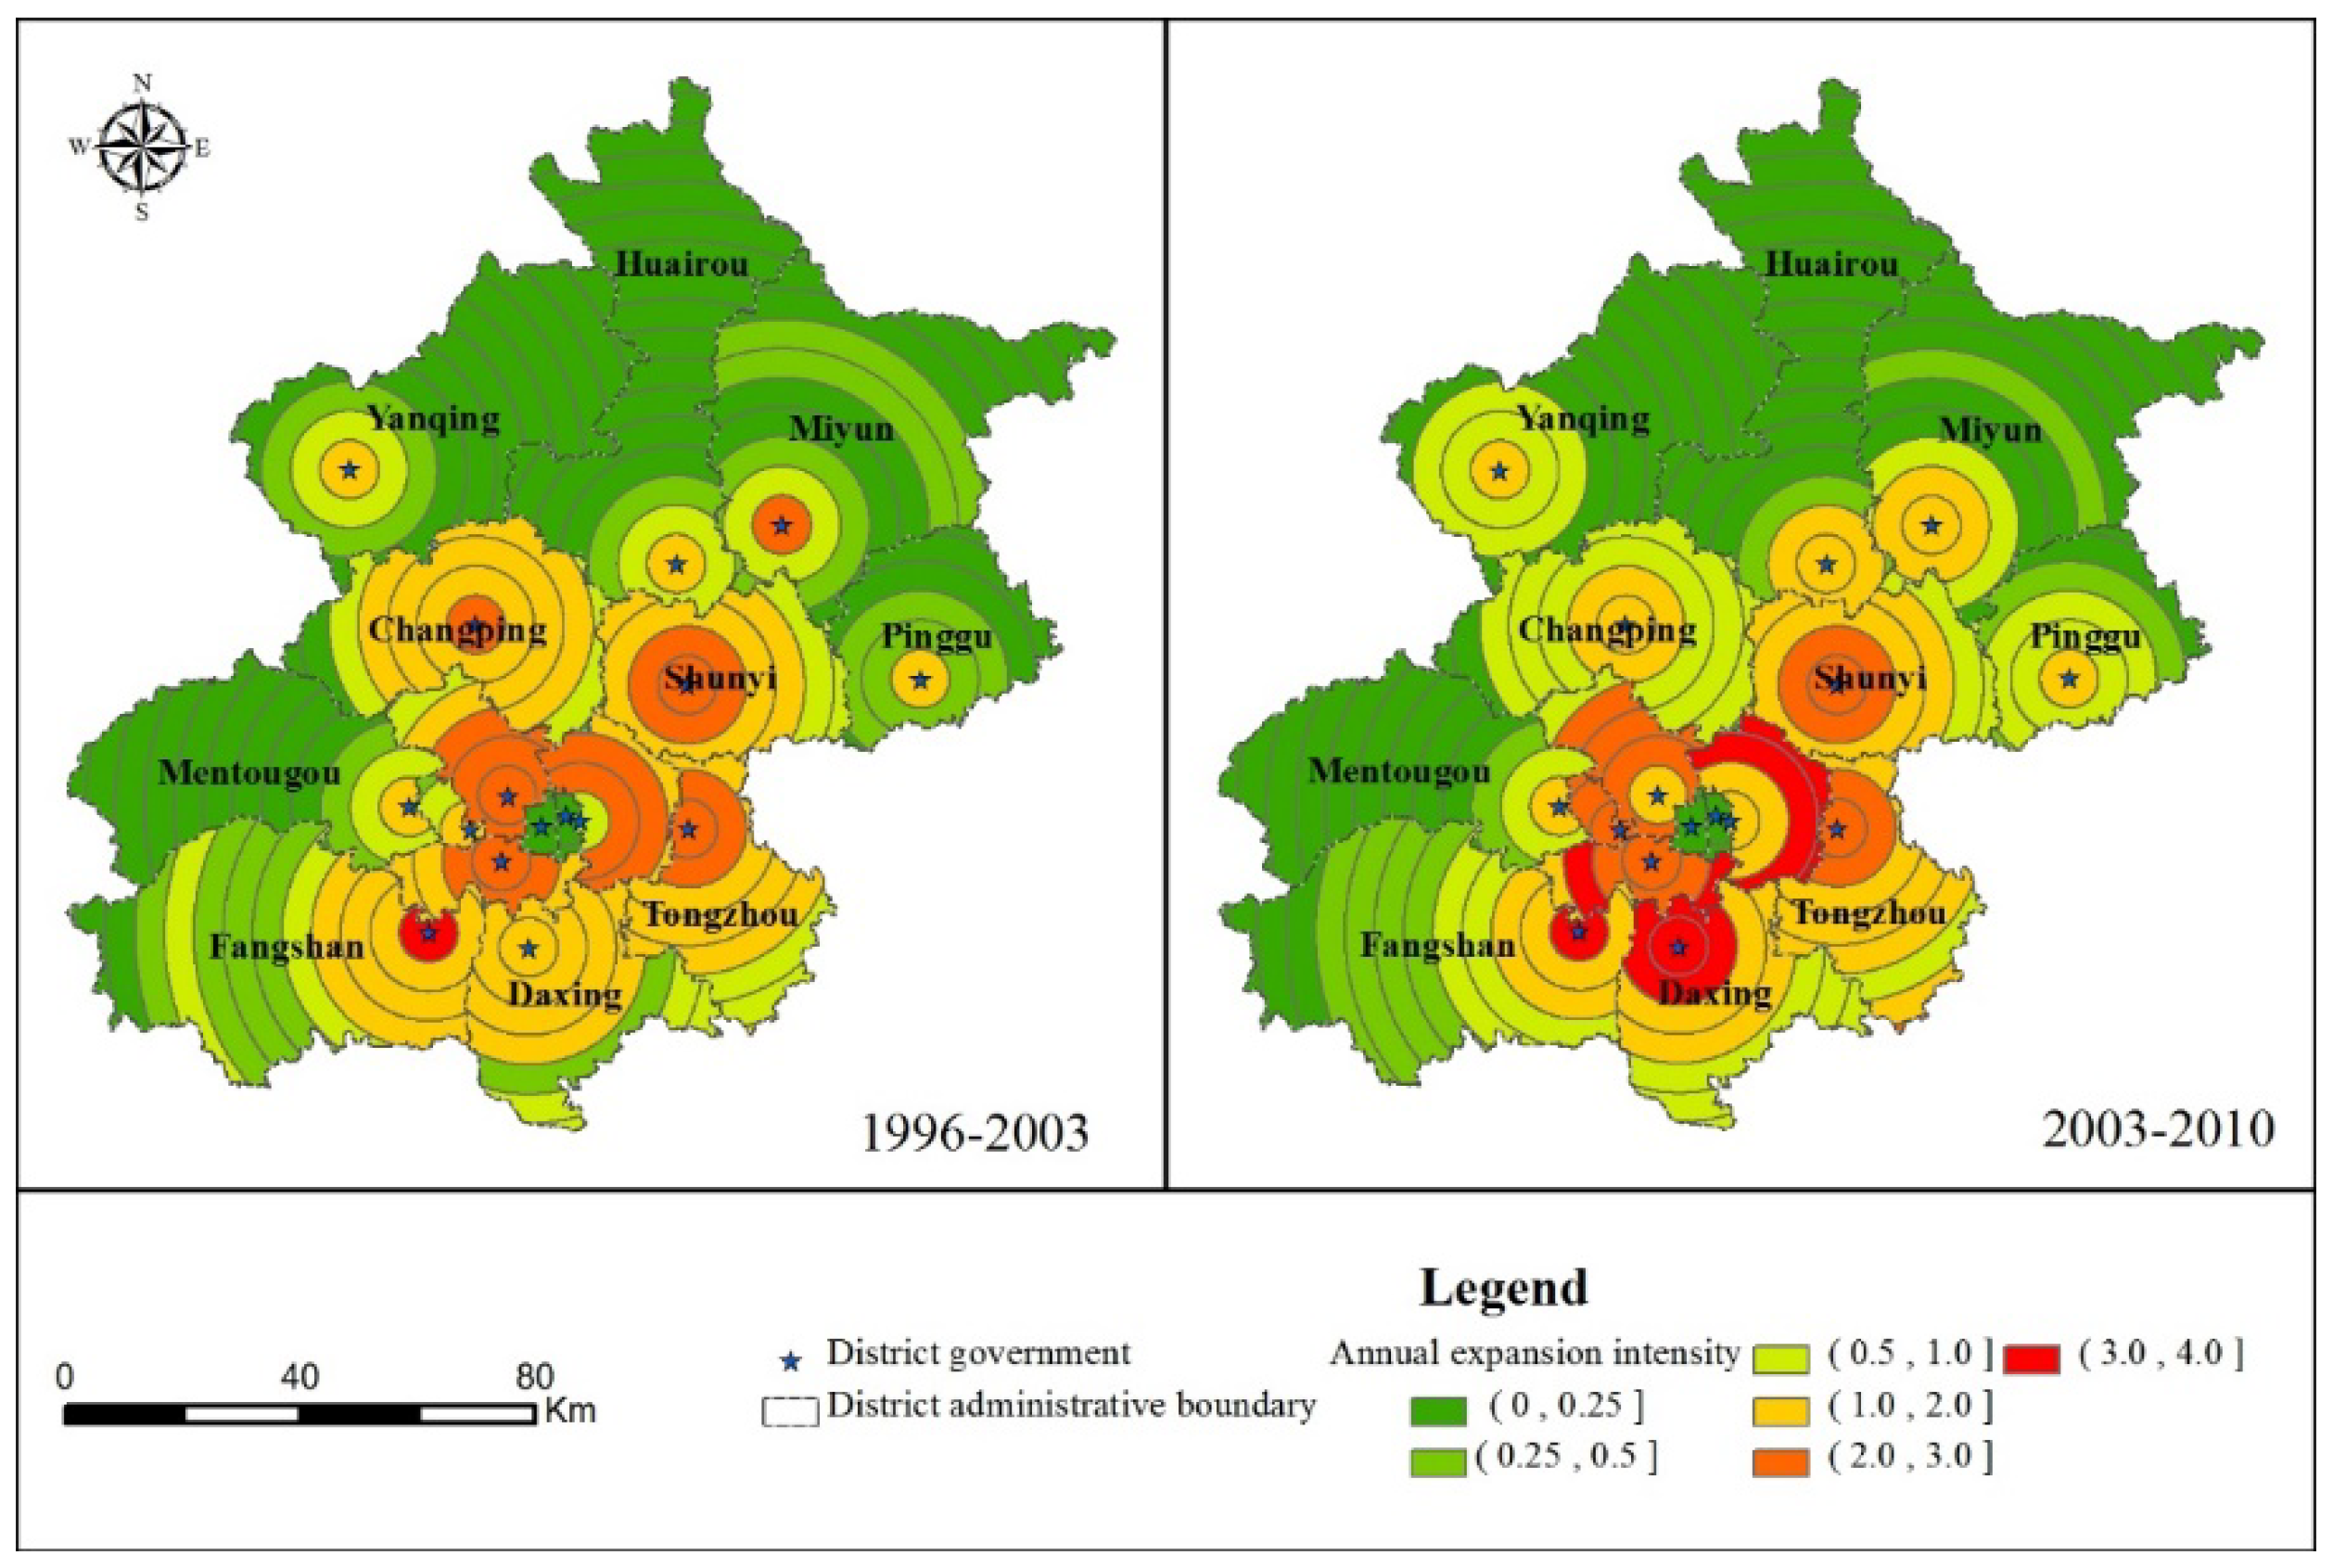
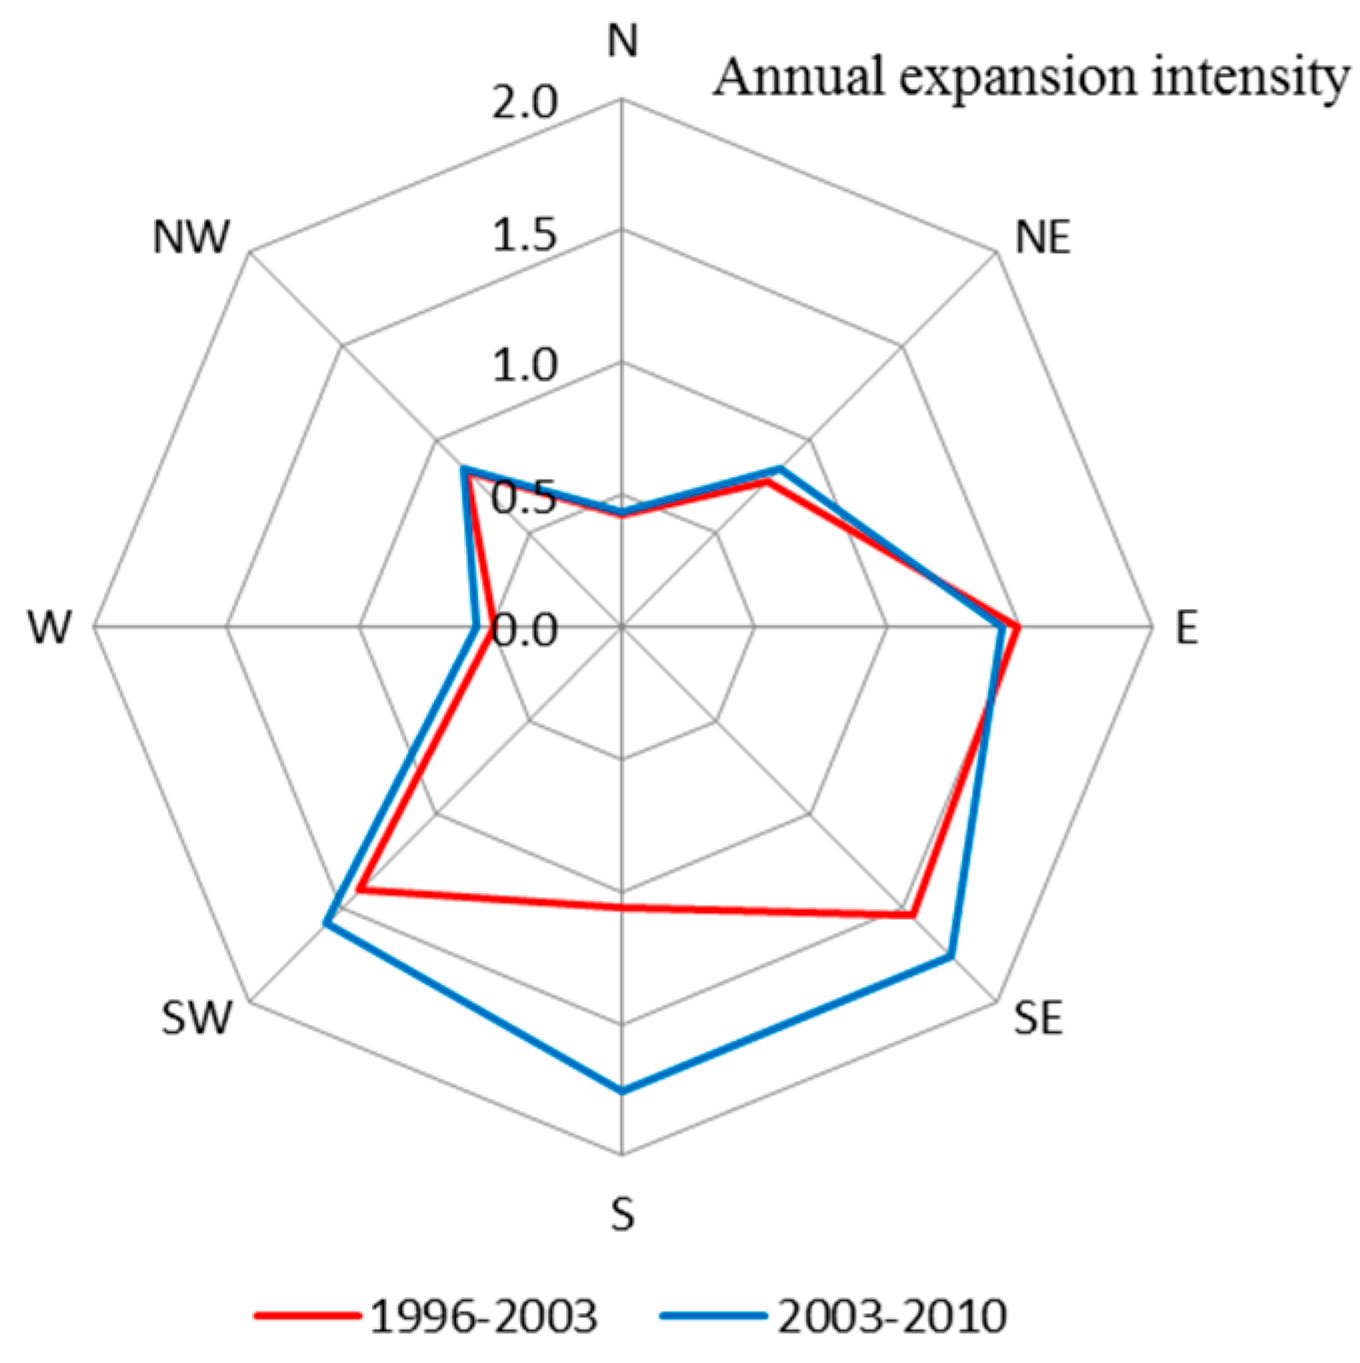
4.2. Administrative Centers and the Direction of Urban Land Expansion

Figure 11 shows that the main direction of urban land expansion in Beijing has kept relatively stable but has shifted slightly from the southeast to the south. (1) From 1996 to 2003, the construction land in Beijing expanded mainly to the southeast and the southwest with the southeast as the primary direction. (2) From 2003 to 2010, the main directions of expansion were southwest, south, southeast, and east; the dominant direction of expansion was southeast. (3) The overall expansion direction did not change much before and after 2003. However, the expansion direction was more prominent to the south, there was a southeast expansion, and a growth zone was formed. Thus, it is fair to state that the main expansion direction of urban land in Beijing from 1996 to 2003 was southeast and the main expansion direction from 2003 to 2010 was south.
Three color arrows were used for the visualization between the Beijing municipal government and the urban expansion direction of districts and counties. The red arrow represents the direction of expansion in the map and points to the city center, a green arrow represents deviation from the city center, and black arrows represent other directions.
The city center plays a crucial role in urban expansion in suburban areas. Figure 12 shows that the expansion direction of each district and county maintained a similar expansion pattern during 1996–2003 and 2003–2010. There are two different patterns of urban land expansion. In the near suburbs (Chaoyang, Haidian, Fengtai, Shijingshan), the urban expansion direction deviates from the city center. On the contrary, the urban expansion direction in the outer suburbs and remote areas points to the city center. The reason for this is that land development in areas closer to the city center is already very high; thus, it cannot expand centripetally. It can only expand away from the city center. The outlying districts and counties all hope to develop towards the city center, thus showing a centripetal pattern. While the near suburbs expand outwards, the surrounding districts and counties expand inwards, reflecting the tremendous role of the city center. It can be foreseen that the monocentric urban sprawl will continue because of the centrifugal expansion in the near suburbs. At the same time, there will be a “filled” development pattern between the city center and outer districts and counties.
Five color arrows were used to reflect the relationship between the expansion direction of urban land in each town, municipality, district, and county governments. If the expansion direction points to the district and county governments, it is indicated by a pink arrow; if it deviates from the district and county center, it is indicated by a dark green arrow; if it points to the municipal government, it is indicated by a red arrow; if it deviates from the city center, it is indicated by a light green arrow, and expansion towards other directions is indicated by a black arrow.
Figure 13 shows the characteristics of the urban land expansion direction at the town and township level. (1) In the near suburban area (about 30 km away from the municipal government), the urban land expansion directions in most of the towns are outward, with only a few directions inward. Urban development is characteristic of monocentric urban sprawl. (2) In the outer suburbs, the expansion directions in towns close to the near suburbs are inward, which is due to the attraction to the municipal government. (3) In the outer suburbs and remote areas, the expansion directions of some towns within 10 km from the district and county governments deviate from the government; the expansion directions of most towns within 30 km from the district and county governments point to the government. The expansion direction of an area beyond 30 km is not towards the district and county governments, but mostly along the direction of the transportation axis (Figure 14). In the outer suburbs and remote areas, while the influences of municipal government are weak, the influences of district and county governments are strong. Traffic lines are more influential in areas far away from the district and county governments.

4.3. Expansion Mode of Urban Land in the Suburb of Mega-Cities

The results reveal that the expansion of urban land in Beijing is affected jointly by the locations of the Beijing municipal government (Table 2, Figure 6 and Figure 7), the district and county governments (Figure 8 and Figure 9), and the transportation lines (Figure 14), forming a mixed spatial expansion pattern of “monocentric-sprawl + leapfrog + strip” (Figure 15). This is likely to be a general pattern in many mega-cities in developing countries like China.
The Beijing Municipal Government is located at the center of the municipal jurisdiction. It is the most important center in shaping the landscape of urban land expansion because of its political and economic powers and its abundant developmental resources. Located on a vast plain and with a long tradition of monocentric development, Beijing has a typical ring-like expansion style. There is vast built-up or potential urban land surrounding the municipal center. The radius of this area is about 30 km, roughly that within the sixth ring road, which shares 55.2% of the total urban land area (Figure 15a). Owing to the attraction of the municipal center, the near suburb within this area is the place where urban land grows the fastest, showing a clear and continuous trend of ring-like outward expansion. In the outer suburbs and remote areas outside this area, however, the urban land expands toward the direction of the municipal center for agglomeration economies, better public services, and infrastructure. Given this logic, urban land development forms a monocentric sprawl pattern because of the influence of the municipal government.
The district and county governments are secondary centers. Although their impacts on urban land expansion are quite limited compared to those of the municipal center, their role in shaping the patterns of urban expansion at the local scale cannot be ignored. In fact, the impact of district and county governments on surrounding land development is similar to that of the Beijing municipal government. Within the 10 km area, urban land expands outwards. Within the scope 10–30 km area, urban land is attracted by the district and county governments and expands toward the direction of the government. Because of the spatial effect of scale, the impact of district and county governments dominates in the outer suburbs and remote areas, leading to the spatial development of construction land (Figure 15b).
Figure 15c shows that, in the remote areas, that is, areas 30 km away from the district and county governments, the influence of powers of municipal and district centers are both limited. The impact of major traffic lines is more important for urban development because of the lower cost of land development and the higher accessibility to city and district centers near traffic lines. As a result, the expansion along suburban traffic lines shows a "strip" feature.
The results also show that the spatial pattern of Beijing’s urban land development is still characterized by the dominance of the monocentric pattern but a mixed polycentric spatial structure is also emerging [22]. The Municipal Government as the main administrative center of Beijing remains a huge attraction within a radius of 30 km, appearing with suburbanization in monocentric agglomerations. The district and county governments as the increasing subcenters have accelerated land development within a radius of 10 km, leading to a multi-center scatter of land development in the outer areas and causing the leapfrog pattern of metropolitan land expansion. The strip expansion along the main transportation lines also plays a role in shaping the mixed spatial pattern of urban expansion in Beijing. It is also demonstrated that despite the dominant control of administrative centers, suburbanization in Beijing’s surroundings is progressing spontaneously by following the market mechanism at the micro level.

5. Conclusions and Discussion

Using Beijing as a case study, this study analyzed the characteristics of the speed and direction of urban land expansion during 1996–2003 and 2003–2010, and then explored the impact of different ranks of administrative centers on the intensity and direction of urban land expansion. We arrived at the following conclusions: (1) land development intensity and expansion speed are affected jointly by the municipal and district and county centers where the governments hold many administrative, public, and economic resources. (2) Distance to administrative centers has a significant effect on the direction of urban land expansion. Except for several subregions adjacent to the center, the closer the area is to an administrative center, the more likely it is that the expansion direction points toward the center. (3) The direction of urban land expansion is affected jointly by three factors: the distances to the municipal government and district and county governments and transportation lines, resulting in a mixed spatial expansion pattern of “monocentric-sprawl + leapfrog + strip”.
The policies of economics and administrative decentralization are important reasons for the success of China’s economic reform. The process of decentralization enables local governments to possess the power to allocate and use resources to develop economies. However, the power held by different ranks of government to allocate resources varies, with higher ranks of government possessing greater power than the lower ranks. Thus, the control of urban sprawl and the formulation of urban development policy should not only be based on the consideration of the development of the urban economy and population, but also on the consideration of the influence of the urban administrative level on urban development.
The results of the qualitative spatial analysis confirm that the direction of urban land expansion is indeed closely related to the administrative centers at various scales. Administrative centers at different levels have different extents and modes of influence. Although this paper puts forth this consideration, it has only conducted a qualitative and single-angle study and has only used the land data of two time periods. In future work, we will conduct an in-depth analysis by using quantitative models and data of a longer time series.
Beijing’s urban sprawl is impacted jointly by market forces and administrative powers of multi-level governments through direct investments and indirect policies. Local centers intensify the trend of multi-center scatter in the outer areas of metropolises. These findings are expected to have a consulting value for future policymaking on urban land use and management in mega-cities, especially those with strong local government powers in other transition economies and developing countries.

Author Contributions

Conceptualization, D.H. and T.L.; methodology, D.H., T.L. and X.T.; software, X.T. and E.C.; validation, D.H., X.T., and F.K.; formal analysis, X.T. and E.C.; resources, D.H.; data curation, D.H. and X.T.; writing—original draft preparation, X.T. and E.C.; writing—review and editing, T.L. and D.H.; visualization, X.T. and E.C.; supervision, D.H. and T.L.; project administration, D.H.; funding acquisition, D.H. and T.L. All authors have read and agreed to the published version of the manuscript.

Funding

This research was funded by the National Key Research and Development Program of China (2018YFD1100803).

Conflicts of Interest

The authors declare no conflict of interest.

References

  1. Hortas-Rico, M.; Sole-Olle, A. Does urban sprawl increase the costs of providing local public services? Evidence from spanish municipalities. Urban Stud. 2010, 47, 1513–1540. [Google Scholar] [CrossRef] [Green Version]
  2. Vasanen, A. Functional polycentricity: Examining metropolitan spatial structure through the connectivity of urban sub-centres. Urban Stud. 2012, 49, 3627–3644. [Google Scholar] [CrossRef]
  3. Salvati, L.; Zambon, I.; Chelli, F.M.; Serra, P. Do spatial patterns of urbanization and land consumption reflect different socioeconomic contexts in Europe? Sci. Total Environ. 2018, 625, 722–730. [Google Scholar] [CrossRef] [PubMed]
  4. Sýkora, L.; Stanilov, K. The challenge of postsocialist suburbanization. In Confronting Suburbanization: Urban Decentralization in Postsocialist Central and Eastern Europe; Sýkora, L., Stanilov, K., Eds.; Wiley & Sons: Hoboken, NJ, USA, 2014; pp. 1–32. [Google Scholar]
  5. Garcia-López, M.-À.; Muñiz, I. Employment decentralisation: Polycentricity or scatteration? The case of Barcelona. Urban Stud. 2010, 47, 3035–3056. [Google Scholar] [CrossRef]
  6. Veneri, P. The identification of sub-centres in two Italian metropolitan areas: A functional approach. Cities 2013, 31, 177–185. [Google Scholar] [CrossRef] [Green Version]
  7. Fernandez-Maldonado, A.M.; Romein, A.; Verkoren, O.; Paula Pessoa, R.P. Polycentric structures in latin american metropolitan areas: Identifying employment sub-centres. Reg. Stud. 2014, 48, 1954–1971. [Google Scholar] [CrossRef]
  8. Aguilar, A.G.; Hernandez, J. Metropolitan change and uneven distribution of urban sub-centres in Mexico City, 1989–2009. Bull. Lat. Am. Res. 2016, 35, 191–209. [Google Scholar] [CrossRef] [Green Version]
  9. Angel, S.; Blei, A.M. The spatial structure of American cities: The great majority of workplaces are no longer in CBDs, employment sub-centers, or live-work communities. Cities 2016, 51, 21–35. [Google Scholar] [CrossRef]
  10. Carruthers, J.I.; Ulfarsson, G.F. Urban sprawl and the cost of public services. Environ. Plan. B Plan. Des. 2003, 30, 503–522. [Google Scholar] [CrossRef]
  11. Haase, D.; Kabisch, N.; Haase, A. Endless urban growth? On the mismatch of population, household and urban land area growth and its effects on the urban debate. PLoS ONE 2013, 8, e66531. [Google Scholar] [CrossRef] [Green Version]
  12. Ermini, B.; Santolini, R. Urban sprawl and property tax of a city’s core and suburbs: Evidence from Italy. Reg. Stud. 2017, 51, 1374–1386. [Google Scholar] [CrossRef]
  13. Firman, T.; Fahmi, F.Z. The Privatization of metropolitan Jakarta’s (Jabodetabek) urban fringes: The early stages of “post-suburbanization” in Indonesia. J. Am. Plan. Assoc. 2017, 83, 68–79. [Google Scholar] [CrossRef]
  14. Seto, K.C.; Fragkias, M.; Gueneralp, B.; Reilly, M.K. A meta-analysis of global urban land expansion. PLoS ONE 2011, 6, e23777. [Google Scholar] [CrossRef] [PubMed]
  15. Martellozzo, F.; Amato, F.; Murgante, B.; Clarke, K.C. Modelling the impact of urban growth on agriculture and natural land in Italy to 2030. Appl. Geogr. 2018, 91, 156–167. [Google Scholar] [CrossRef] [Green Version]
  16. Sturck, J.; Levers, C.; van der Zanden, E.H.; Schulp, C.J.E.; Verkerk, P.J.; Kuemmerle, T.; Helming, J.; Lotze-Campen, H.; Tabeau, A.; Popp, A.; et al. Simulating and delineating future land change trajectories across Europe. Reg. Environ. Chang. 2018, 18, 733–749. [Google Scholar] [CrossRef] [Green Version]
  17. Tomaszewska, M.; Henebry, G.M. Urban-rural contrasts in central-eastern european cities using a MODIS 4 micron time series. Remote Sens. 2016, 8, 924. [Google Scholar] [CrossRef] [Green Version]
  18. Cheng, H.; Liu, Y.; He, S.; Shaw, D. From development zones to edge urban areas in China: A case study of Nansha, Guangzhou City. Cities 2017, 71, 110–122. [Google Scholar] [CrossRef]
  19. Heffner, K.; Gibas, P. Functional areas in the regions and their links to scope sub-regional centres impact. Stud. Reg. 2016, 46, 27–39. [Google Scholar] [CrossRef]
  20. Ding, C.R. Urban spatial development in the land policy reform era: Evidence from Beijing. Urban Stud. 2004, 41, 1889–1907. [Google Scholar] [CrossRef]
  21. Zheng, S.; Kahn, M.E. Land and residential property markets in a booming economy: New evidence from Beijing. J. Urban Econ. 2008, 63, 743–757. [Google Scholar] [CrossRef]
  22. Huang, D.; Liu, Z.; Zhao, X. Monocentric or polycentric? The urban spatial structure of employment in Beijing. Sustainability 2015, 7, 11632–11656. [Google Scholar] [CrossRef] [Green Version]
  23. Huang, D.; Liu, Z.; Zhao, X.; Zhao, P. Emerging polycentric megacity in China: An examination of employment subcenters and their influence on population distribution in Beijing. Cities 2017, 69, 36–45. [Google Scholar] [CrossRef]
  24. Wu, F. Adding new narratives to the urban imagination: An introduction to ‘New directions of urban studies in China’. Urban Stud. 2020, 57, 459–472. [Google Scholar] [CrossRef]
  25. Deng, F.F.; Huang, Y.Q. Uneven land reform and urban sprawl in China: The case of Beijing. Prog. Plan. 2004, 61, 211–236. [Google Scholar] [CrossRef]
  26. Hudecek, T.; Hnilicka, P.; Dlouhy, M.; Leno Cutakova, L.; Leno, M. Urban structures, population density and municipal expenditures: An empirical study in the Czech Republic. Urban Stud. 2019, 56, 3450–3465. [Google Scholar] [CrossRef]
  27. Kukulska-Koziel, A.; Szylar, M.; Cegielska, K.; Noszczyk, T.; Hernik, J.; Gawronski, K.; Dixon-Gough, R.; Jombach, S.; Valanszki, I.; Kovacs, K.F. Towards three decades of spatial development transformation in two contrasting post-Soviet cities-Krakow and Budapest. Land Use Policy 2019, 85, 328–339. [Google Scholar] [CrossRef]
  28. Burian, J.; Macku, K.; Zimmermannova, J.; Netek, R. Sustainable spatial and temporal development of land prices: A case study of Czech cities. ISPRS Int. J. Geo Inf. 2020, 9, 396. [Google Scholar] [CrossRef]
  29. Liu, X.; Wang, M. How polycentric is urban China and why? A case study of 318 cities. Landsc. Urban Plan. 2016, 151, 10–20. [Google Scholar] [CrossRef]
  30. Giuliano, G.; Small, K.A. Subcenters in the Los Angeles region. Reg. Sci. Urban Econ. 1991, 21, 163–182. [Google Scholar] [CrossRef] [Green Version]
  31. McDonald, J.F.; Prather, P.J. Suburban employment centres: The case of Chicago. Urban Stud. 1994, 31, 201–218. [Google Scholar] [CrossRef]
  32. Anas, A.; Arnott, R.; Small, K.A. Urban spatial structure. J. Econ. Lit. 1998, 36, 1426–1464. [Google Scholar]
  33. Hu, L.; Sun, T.; Wang, L. Evolving urban spatial structure and commuting patterns: A case study of Beijing, China. Transp. Res. Part D Transp. Environ. 2018, 59, 11–22. [Google Scholar] [CrossRef]
  34. O’Sullivan, A. Urban Economics, 7th ed.; The McGraw-Hill Companies, Inc.: New York, NY, USA, 2009. [Google Scholar]
  35. McDonald, J.F. The identification of urban employment subcenters. J. Urban Econ. 1987, 21, 242–258. [Google Scholar] [CrossRef]
  36. Heikkila, E.; Gordon, P.; Kim, J.I.; Peiser, R.B.; Richardson, H.W.; Dale-Johnson, D. What happened to the CBD-distance gradient? Land values in a policentric city. Environ. Plan. A 1989, 21, 221–232. [Google Scholar] [CrossRef]
  37. Ma, L.J.C. Urban administrative restructuring, changing scale relations and local economic development in China. Political Geogr. 2005, 24, 477–497. [Google Scholar] [CrossRef]
  38. Li, H.; Wei, Y.D.; Liao, F.H.; Huang, Z. Administrative hierarchy and urban land expansion in transitional China. Appl. Geogr. 2015, 56, 177–186. [Google Scholar] [CrossRef]
  39. Wang, C.; Liu, H.; Zhang, M. The influence of administrative boundary on the spatial expansion of urban land: A case study of Beijing-Tianjin-Hebei urban agglomeration. Geogr. Res. 2016, 35, 173–183. [Google Scholar]
  40. Tiebout, C.M. A pure theory of local expenditures. J. Political Econ. 1956, 64, 416–424. [Google Scholar] [CrossRef]
  41. Bardhan, P. Decentralization of governance and development. J. Econ. Perspect. 2002, 16, 185–205. [Google Scholar] [CrossRef] [Green Version]
  42. Lin, Y.; Liu, Z. China’s fiscal decentralization and economic growth. J. Peking Univ. (Hum. Soc. Sci.) 2000, 5, 5–17. [Google Scholar]
  43. Jin, H.H.; Qian, Y.Y.; Weingast, B.R. Regional decentralization and fiscal incentives: Federalism, Chinese style. J. Publ. Econ. 2005, 89, 1719–1742. [Google Scholar] [CrossRef]
  44. Xu, C. The fundamental institutions of China’s reforms and development. J. Econ. Lit. 2011, 49, 1076–1151. [Google Scholar] [CrossRef]
  45. Oi, J.C. Fiscal reform and the economic foundations of local state corporatism in China. World Politics 1992, 45, 99–126. [Google Scholar] [CrossRef]
  46. Hsing, Y.-T. Land and territorial politics in urban China. China Quart. 2006, 187, 575–591. [Google Scholar] [CrossRef]
  47. NPC. The National People’s Congress, Land Administration Law. Available online: http://f.mnr.gov.cn/201909/t20190906_2464343.html (accessed on 2 September 2020).
  48. NPC. The National People’s Congress, Urban Real Estate Administration Law. Available online: http://www.npc.gov.cn/npc/c30834/201909/54daabc2a4014a3f8d3097bfaaf88f96.shtml (accessed on 2 September 2020).
  49. Huang, D.; Huang, Y.; Zhao, X.; Liu, Z. How do differences in land ownership types in China affect land development? A case from Beijing. Sustainability 2017, 9, 123. [Google Scholar] [CrossRef] [Green Version]
  50. Cao, G.; Feng, C.; Tao, R. Local “land finance” in China’s urban expansion: Challenges and solutions. China World Econ. 2008, 16, 19–30. [Google Scholar] [CrossRef]
  51. Wang, J.; He, C. Chinese urban land expansion issues in transition period: Empirical test based on muth-mill model. Urban Stud. 2009, 41, 24–30. [Google Scholar]
  52. Sun, X.; Zhou, F. Land finance and the tax-sharing system: An empirical interpretation. Soc. Sci. China 2014, 35, 47–64. [Google Scholar]
  53. Lichtenberg, E.; Ding, C. Local officials as land developers: Urban spatial expansion in China. J. Urban Econ. 2009, 66, 57–64. [Google Scholar] [CrossRef] [Green Version]
  54. He, C.; Zhou, Y.; Huang, Z. Fiscal decentralization, political centralization, and land urbanization in China. Urban Geogr. 2016, 37, 436–457. [Google Scholar] [CrossRef]
  55. Wang, J.; Lin, Y.; Glendinning, A.; Xu, Y. Land-use changes and land policies evolution in China’s urbanization processes. Land Use Policy 2018, 75, 375–387. [Google Scholar] [CrossRef]
  56. Yang, F. Local government and local town dev elopment. City Plan. Rev. 2003, 32, 19–23. [Google Scholar]
  57. Chen, Y.; Li, H.; Zhou, L.-A. Relative performance evaluation and the turnover of provincial leaders in China. Econ. Lett. 2005, 88, 421–425. [Google Scholar] [CrossRef]
  58. Blanchard, O.; Shleifer, A. Federalism with and without political centralization: China versus Russia. IMF Staff Pap. 2001, 48, 171–179. [Google Scholar]
  59. Xue, H.; Shi, X.; Tang, P. The impact of chinese decentralization on the deviation of land granting prices. Res. Sci. 2013, 35, 1134–1142. [Google Scholar]
  60. Zhang, L.; Wang, X.; Xu, X. Fiscal incentive, political incentive and local officials’ land supply. China Ind. Econ. 2011, 116, 35–43. [Google Scholar]
  61. Liu, J. China’s administrative division evolution. Science 1992, 17, 38–41. [Google Scholar]
  62. Wei, H. Administrative hierarchy and growth of city scale in China. Urban. Environ. Stud. 2014, 1, 4–17. (In Chinese) [Google Scholar]
  63. Zhang, J.; Cui, Y. Spatial and scale characteristics of administrative center in America and its cause of formation. Econ. Geogr. 2011, 31, 477–497. [Google Scholar]
  64. Ades, A.F.; Glaeser, E.L. Trade and circuses-explaining urban giants. Quart. J. Econ. 1995, 110, 195–227. [Google Scholar] [CrossRef] [Green Version]
  65. Moomaw, R.L.; Shatter, A.M. Urbanization and economic development: A bias toward large cities? J. Urban. Econ. 1996, 40, 13–37. [Google Scholar] [CrossRef] [PubMed] [Green Version]
  66. Wang, S. Soft power: A study on Beijing’s comparative advantage in economic development. J. Beijing Adm. Coll. 2007, 21, 57–61. [Google Scholar]
  67. Xiang, K.; Jiang, L. The open-oriented pattern of contemporary administrative centerconstruction: The critically research of contemporary administrative center. Urban. Stud. 2005, 12, 17–22. [Google Scholar]
  68. Lv, X.; Huang, X. Research progress and prospect of construction land expansion. Geogr. Geo Inf. Sci. 2013, 29, 51–58. [Google Scholar]
  69. Hu, D.; Liu, J. The relationship between administrative hierarchy, power and regional economy: The spatial process of Chinese government power and its influence. Chin. Publ. Adm. 2007, 135, 11–13. [Google Scholar]
  70. Zhu, J.; Hu, T. Disordered land-rent competition in China’s periurbanization: Case study of Beijing Township, Beijing. Environ. Plan. A Econ. Space 2009, 41, 1629–1646. [Google Scholar] [CrossRef]
  71. Kuang, W. Spatio-temporal patterns of intra-urban land use change in Beijing, China between 1984 and 2008. Chin. Geogr. Sci. 2012, 22, 210–220. [Google Scholar] [CrossRef]
  72. Huang, D.; Jin, H.; Zhao, X.; Liu, S. Factors influencing the conversion of arable land to urban use and policy implications in Beijing, China. Sustainability 2015, 7, 180–194. [Google Scholar] [CrossRef] [Green Version]
  73. Liu, S.W.; Chuanjun, S.; Hongquan, A. GIS based model of urban land use growth in Beijing. Acta Geogr. Sin. 2000, 55, 407. [Google Scholar]
  74. Zhao, S.; Zhou, D.; Zhu, C.; Qu, W.; Zhao, J.; Sun, Y.; Huang, D.; Wu, W.; Liu, S. Rates and patterns of urban expansion in China’s 32 major cities over the past three decades. Landsc. Ecol. 2015, 30, 1541–1559. [Google Scholar] [CrossRef]
Figure 1. Administrative and spatial structure system of China’s municipality.
Land 09 00312 g001
Figure 2. The administrative structure of a municipality in China.
Land 09 00312 g002
Figure 3. The research area.
Land 09 00312 g003
Figure 4. Urban land expansion from 1996 to 2010 in Beijing.
Land 09 00312 g004
Figure 5. Multi-ring buffer zones in the municipality (a) and districts (b).
Land 09 00312 g005
Figure 6. The land development intensity in buffer rings around the municipal government in Beijing.
Land 09 00312 g006
Figure 7. Annual expansion intensity in buffer rings around the municipal government in Beijing.
Land 09 00312 g007
Figure 8. Land development intensity in buffer rings around the district and county governments.
Land 09 00312 g008
Figure 9. The land development intensity in buffer rings around the distract and county governments.
Land 09 00312 g009
Figure 10. The annual expansion intensity in buffer rings around district and county governments.
Land 09 00312 g010
Figure 11. Annual expansion intensity in Beijing.
Land 09 00312 g011
Figure 12. Expansion directions and annual expansion intensity at district level.
Land 09 00312 g012
Figure 13. Urban land expansion directions at town level.
Land 09 00312 g013
Figure 14. Urban land expansion directions in Changyang, Tongzhou, and Huairou.
Land 09 00312 g014
Figure 15. Urban land spatial expansion pattern in Beijing. (a) the influence of Beijing municipal government; (b) the influence of district governments; and (c) the influence of traffic lines.
Land 09 00312 g015
Table 1. Urban land area changes in Beijing.
Item199620032010
Construction land area (km2)1993.72507.53080.4
Share of total land area (%)12.2%15.3%18.8%
Table 2. Distribution of urban land area in multiple buffer rings circling the municipal government.
Buffer
Regions
Area
(km2)
Urban Land Area (km2)Growth (km2)Growth Rate (%)
1996200320101996–20032003–20101996–20101996–20032003–20101996–2010
0–10 km314.2263.9280.4300.916.520.537.06.37.314.0
10–20 km942.5367.0497.8702.3130.8204.5335.335.641.191.4
20–30 km1570.8346.1485.9696.8139.8210.9350.740.443.4101.3
30–40 km2010.9338.4437.5493.899.156.3155.429.312.945.9
40–50 km2028.3276.0316.8329.240.812.453.214.83.919.3
50–60 km1893.5124.9149.2162.724.313.537.819.59.030.3
60–70 km2017.8137.2166.3195.329.129.058.121.217.442.3
70–80 km1998.586.6105.5120.518.915.033.921.814.239.1
80–90 km1566.326.231.537.25.35.711.020.218.142.0
90–100 km898.013.921.424.57.53.110.654.014.576.3
100–110 km690.99.110.712.21.61.53.117.614.034.1
110–120 km377.23.84.04.20.20.20.45.35.010.5
120–130 km92.50.50.50.80.00.30.30.060.060.0

