Article

Assessing Sustainable Rural Development Based on Ecosystem Services Vulnerability

by
Pascual Fernández Martínez
1,
Mónica de Castro-Pardo
2,*,
Víctor Martín Barroso
1 and
João C. Azevedo
3
1
Department of Applied Economics I and History and Economic Institutions, Faculty of Law and Social Sciences, Universidad Rey Juan Carlos, Campus of Vicálvaro, Tulipan, 28933 Móstoles, Madrid, Spain
2
Department of Business Economics, Faculty of Law and Social Sciences, Universidad Rey Juan Carlos, Campus of Vicálvaro, Tulipan, 28933 Móstoles, Madrid, Spain
3
Centro de Investigação de Montanha, Instituto Politécnico de Bragança, Campus de Santa Apolónia, 5300-253 Bragança, Portugal
*
Author to whom correspondence should be addressed.
Land 2020, 9(7), 222; https://doi.org/10.3390/land9070222
Submission received: 16 June 2020 / Revised: 2 July 2020 / Accepted: 6 July 2020 / Published: 9 July 2020

Abstract

:
Sustainable Rural Development is essential to maintain active local communities and avoid depopulation and degradation of rural areas. Proper assessment of development in these territories is necessary to improve decision-making and to inform public policy, while ensuring biodiversity conservation and ecosystem services supply. Rural areas include high ecological value systems but the vulnerability of environmental components in development indicators has not been sufficiently pinpointed. The main objective of this work was to propose a new sustainable rural development composite indicator (nSRDI) while considering an environmental dimension indicator based on ecosystem services vulnerability and social and economic dimension indicators established using a sequentially Benefit of the Doubt-Data Envelopment Analysis (BoD-DEA) model. It aimed also to test effects of weighting methods on nSRDI. The composite indicator was applied to 10 regions (comarcas) in the Huesca province, Spain, producing a ranking of regions accordingly. The indicator was further tested through the analysis of the effect of an equal and optimum weighting method on scores and rankings of regions. Results showed substantial differences in nSRDI scores/rankings when vulnerability was added to the process, suggesting that the environmental dimension and the perspective from which it is conceived and applied matters when addressing sustainable rural development.

1. Introduction

Depopulation of rural areas is a major development challenge in Europe. Rural regions currently account for 28% of Europe’s population (cities account for 40%; towns and suburbs account for 32%) [1] but, by 2050, more than 50% of the population of Europe will live in urban areas due to an expected increase of 24.1 million persons, as the population of rural regions is predicted to decrease by 7.9 million [2]. These demographic processes are not, however, homogeneous across Europe. The strength and persistence of rural depopulation trends in recent decades in countries in the south of Europe such as Portugal, Spain and Italy, has increased the number of rural regions of low population density in these countries. Until the 1990s, the major direct cause of depopulation was immigration to other countries (the Americas, Central Europe) and within-country rural-to-urban migration but since then, aging became the main cause of rural depopulation. The Spanish provinces of Aragon, Extremadura and Castilla-León, for example, have experienced levels of depopulation so severe that several villages are now uninhabited, while rates of aging and population loss in other provinces jeopardize their future [3]. The recent return of migrants and newcomers in rural areas, in particular during the 2010–2014 financial crisis and the current COVID-19 pandemic, is insufficient to mitigate ongoing depopulation.
In addition to social, economic and cultural effects, rural depopulation has negative consequences over nature conservation. In South European countries, one of the major effects of depopulation, while simultaneously affecting biodiversity, supply of ecosystem services and environmental quality, is an increase in wildfire hazards. Land abandonment related to depopulation changes the vertical and horizontal fuel structure in ecosystems and landscapes, thereby increasing fire hazards [4]. Abandoned landscapes tend to exhibit higher fire spread and intensity due to the spatial pattern of fuel load and to the reduction of fuel breaks (managed areas) in the landscape [5,6]. The consequences of fires of higher severity in abandoned landscapes becomes an even more serious issue when these landscapes contain systems of high ecological value which have been maintained through moderate levels of management intensity over periods of centuries to thousands of years. Several reports show a recent increase in forest fires in conservation areas. During the summer of 2009, approximately 30% of the burned areas in Europe were in Natura 2000 sites that were seriously affected and now face great challenges of recovering the original conditions [7].
Rural areas globally suffer from endemic poverty. International Fund for Agricultural Development—IFAD [8] estimated that over 60% of the poor will still be in rural areas, even in 2025. Rural poverty is perpetuated by the lack of access to essential assets like basic infrastructure, education or knowledge to access technologies and markets that could improve their productivity and income [9]. In Europe poverty is not exclusive to rural areas, but most of its poverty is found in rural areas [1]. Both poverty and degradation of high ecological value sites in rural areas need to be taken into account when rethinking rural development and defining the priority criteria to be considered in the development of tools to support rural regions and the corresponding improved assessment mechanisms in order to preserve biodiversity and increase welfare in local communities.
In Europe, the reversion of degradation processes, such as those mentioned above, and the development of rural areas have become important objectives in policy-making. Although support to low productivity agriculture dates back to 1972, strong efforts oriented towards rural development have been put forward by European institutions since early 1990s, assuming the most relevance in terms of financial support from Common Agricultural Policy (CAP) measures and the corresponding European Structural and Investment funds [10]. From a conservation perspective, European Union policies, such as CAP, have been progressively reformed, increasingly stressing goals directly and indirectly related to biodiversity and the environment. In early stages, CAP encouraged intensive farming and this caused the loss of habitats and species during the 20th century [11]. The first agri-environmental payments were introduced by the McSharry reform in 1992 [12]. However, it was not until the 2013 CAP reform that substantial changes were introduced. These were oriented towards conservation of nature, such as greening payments, to support sustainable farming, sustainable management of natural resources, climate action and balanced territorial development focused on rural areas with expected impacts on semi-natural habitats and wild species across Europe [13]. Other European Union initiatives, such as LEADER, INTERREG or LIFE programs have channeled important investments towards vulnerable regions of low productivity and low income agriculture, weak industry and weak services sectors, all of which are highly dependent on public policy [14,15]. Although these efforts have apparently been well directed and their effects positive [10], socioeconomic and conservation goals in EU policy have not always been easy to integrate. Conflicts between stakeholders with different interests in rural areas make it difficult to establish locally consensual and coordinated planning and management instruments [16] and this difficulty also affects European policies and their application. Despite efforts, integration of goals has not been sufficiently achieved [17], which requires methodological developments in particular to pinpoint and consider environmental components in decision-making processes.
The complexity and multi-functionality of rural socioecological systems, including latent and active conflicts among actors and stakeholders, make decision-making in rural areas difficult. In this context, composite indicators (CIs) can provide powerful tools to aid decision-making processes [18]. However, the way CIs are structured and built is relevant to these processes and choices concerning the right models to use depend chiefly on the desires and preferences of the analyst [19]. For this reason, it is important that the decision-maker has the possibility to choose from several indicator alternatives according to the most suitable method to apply in different decisional contexts. In this work, we aim to overcome challenges discussed early regarding the assessment of sustainable development in complex rural systems.
The objective of this paper is twofold: (i) to propose a new sustainable rural development index (nSRDI) considering vulnerability of ecosystem services as part of its environmental dimension and using a sequential BoD-DEA model for its development; and (ii) to test the effect of different weighting methods on sustainable rural development index scores and rankings resulting from its application.
The added value of this study lies on providing a composite indicator to improve assessment and decision-making processes in sustainable rural development policies, allowing ranking regions according to social and economic aspects while considering environmental value according to the vulnerability of ecosystem services.

2. Background and Hypotheses

Rural development is “the set of activities and actions of diverse actors that taken together leads to progress in rural areas” [20]. The term progress, in its diverse meanings, is in this definition key to understand the evolution of the concept and practice of rural development over time and can be used as a reference to classify the different composite indicators proposed so far. Rural development has changed considerably from its origins in early 1900s up to the 1990s, when it was guided mostly by profitability according to a technocratic and technical, exclusive, big corporation oriented model, to the late 20th century concept(s) directed to sustainability of agriculture and other activities and based on a holistic, inclusive and participatory local and territorial model [21,22]. Rural policy has changed accordingly and the conceptual framework supporting rural development has also been reviewed in the last two decades, in close connection with the development and implementation of the concept of sustainability in political and sectorial areas. Over time, rural policies have been changing from a unifunctional agricultural model focused on food production to a multifunctional agricultural model producing a range of private and public goods, (positive) environmental and cultural impacts, agreeable landscapes and quality and safe products [22]. This new model integrates agriculture and the environment.
Today, making agriculture sustainable is a global challenge and European institutions have provided scope for enhanced sustainability in instruments like the CAP. In the draft of the European Green Deal (EGD) one of the fields proposed for improvement was related to the insufficient set of indicators available and the development of indicators addressing nature conservation [23]. To align CAP with the principles of sustainability, multifunctionality and payments for public goods, 10 urgent action points were proposed in the EGD. Action 7, 8, 9 and 10 are related to the review of indicators, strengthening environmental monitoring, identification and addressing global impacts of the CAP as well as improving the governance of the CAP and its reforms [24]. Regarding the improvement of indicators, the EGD makes a particular mention to the relevance to maintaining conceptual references such as the Sustainable High Nature Value (HNV) Farming framework. One of the specific measures in Action 7 (“Revise the set of indicators”) is to “reintroduce the HNV indicator”. Sustainable High Nature Value (HNV) Farming is based on the importance that some rural/agriculture landscapes have for biodiversity conservation and identify, as key elements of sustainable HNV farming: socio-economic typology of HNV farmers, sustainable agricultural systems, aspects related with communities of NHV farmers as identity, motivation or social recognition and finally, the economic concept of profitability [25].
Numerous indicators have been proposed to assess “development” and “rural development”. The World Bank and the OECD are among the international institutions that have dedicated efforts to measuring progress of rural areas [26] through the establishment and use of comprehensive systems of indicators. The OECD grouped a set of basic indicators in four development dimensions: Population and migration, Social well-being and equity, Economic structure and performance and Environment and sustainability [22]. The most important issues regarding rural development by the OECD tended to discard the Environmental and sustainability group and selected all the other three dimensions as key groups to define rural development indicators [22]. This has, however, changed with the adoption of new concepts regarding rural development, such as the OECD Rural Policy 3.0 framework, and the use of indicators such as the Green Development index [27].
The World Bank [28] uses a core set of indicators that captures a myriad of components of rural development and poverty. These indicators are classified in five dimensions: Basic data, Enabling environment for rural development, Broad based economic growth for rural poverty reduction, Natural resource management and biodiversity and Social well-being. This system includes a specific dimension related to natural resources.
Few works address specifically the design of indicators related to the environmental domain in the construction of rural development CIs that use vulnerability as part of environmental indicators. Environmental indicators have been defined in multiple ways and used from diverse approaches in the construction of sustainability CIs. The broad definition of sustainable development of the Brundtland Report in 1987, based on an intergenerational equity principle, and sustainability sciences based on the social dependence on natural resources but not exactly specifying ways of operationalization [29,30] have opened the field for a high variety of composite indicators developed and tested with the goal of measuring sustainability from different approaches [18,19,31,32,33,34,35,36]
The Ecosystem Service (ES) approach sets the foundations for a new way of assessing sustainability emphasizing the rational exploitation of the environment and resources vs the most strict non-use conservation idea [37]. This citation of [29] effectively describes the role of the ES science in dealing with sustainability: “In much of the world, conserving nature out of moral obligation is a luxury most simply cannot afford. Nevertheless, human well-being is intimately linked to the immediate environment and natural capital is a vital part of the economic base. In the face of a sea of poverty, demonstrating the ignored links between nature and elements of well-being safe drinking water, food, fuel, flood control, and aesthetic and cultural benefits that contribute to dignity and satisfaction, is the key to making conservation relevant and, if we are lucky, possible”. In recent years ES-based indicators have been developed and applied to address sustainability. Mononen et al. [37] described the process of establishing a national ES indicator framework for Finland directed to social-ecological sustainability. Chen et al. [38] proposed an ecosystem service-based sustainability CI for the urban agglomeration of the Lake Biwa region in Japan based on 22 indicators. Díaz-Balteiro et al. [39] proposed a methodology to the dynamic aggregation of indicators of sustainable forest management based on six climate change scenarios considering five ESs: timber production, carbon sequestration, habitat and biodiversity conservation, recreation and game habitat quality in Central Spain. Chen et al. (2020) proposed a method to develop a CI to assess sustainability in eight ESs (soil retention, biodiversity maintenance, food provision, raw-material production, climate regulation, hydrological regulation, recreation services and landscape aesthetics) through value, vulnerability and spatial scale analyzing of the effect of different calculation methods on the index behavior.
Some studies remarked specifically on the importance of vulnerability of ecological components to assess sustainability [31,39,40,41] but only a few recent works consider specific measures of vulnerability to develop sustainability composite indicators. Li et al. [42] proposed a sustainability CI based on livelihood considering indicators of natural capital, such as land capital or drinking water quality, to develop an evaluation index system of livelihood sustainability in rural destinations in the Wuhan area in China. To identify weights of sub-indicators they used a degree of coupling between livelihood and ecosystems. After that, they used a weighted summation to aggregate each livelihood dimension and the entropy method used to weight them.
From a theoretical perspective, all previous research has added relevant value to the background of CI in the context of sustainability and it can be assumed, from the literature, that multifunctionality as part of the rural development concept and its assessment requires consideration of environmental aspects when constructing rural development indicators. The vulnerability of these environmental aspects has not been included in this type of CIs.
From an operational/methodological perspective, it is also necessary to emphasize the great diversity of approaches and methods used in the development of sustainability CIs. Singh et al. [43] found 18 different schemes of weighting indicators and 16 different aggregation methods in 41 studies to construct sustainability CIs. Díaz-Balteiro et al. [39] and Giménez et al. [32] used Goal Programming methods to rank sustainability of forest plantations in Spain. They proposed four Goal Programming models to aggregate sustainability indicators considering preferences of decision makers using a pairwise survey and applied them to rank 30 industrial forest plantations. Castellani et al. [44] applied a Sustainable Performance Index to measure welfare and development at local scales under the framework of the European Charter for Sustainable Tourism in Protected Areas. This CI was defined as the sum of the values of 20 indicators in six groups: population, housing, services, economy and labor and finally environment and tourism. Caschili et al. [45] proposed the Composite Index of Rurality (CIR) to assess rurality in the region of Sardinia (Italy) firstly studying accessibility using an indicator constructed by a doubly constrained spatial interaction model and then proposing CIR to evaluate rurality in a regional setting employing multivariate analysis. CIR was obtained as an unweighted sum of descriptors of three pillars: demography, economics and settlement.
One of the most significant challenges in sustainable development planning is to obtain information economically, ensuring that it is thematically, spatially and temporally relevant to support policy analysis and decision-making [46]. The usefulness of CIs to improve the management of complex problems and support decision-making processes has been demonstrated in different contexts, particularly in cases related to environmental problems [18,47]. CIs based on sustainability and ecosystem services have been commonly used in the assessment of complex problems related to rural development [47]. However, the development of CIs is not straightforward. CIs development faces methodological challenges related to the process of aggregating heterogeneous information. The use of different aggregation methods can lead to very different outputs. Thereby, an erroneous decision regarding aggregation methods can fundamentally alter how CIs perform. To aggregate simple indicators, weights are often used as measures of perceived importance of each analyzed subgroup. However, due to the lack of available information about subgroup importance and unwillingness to prioritize one subgroup above another, it is common to use equal weight methods. Although this procedure is seen as being neutral, it is still a weighting decision [47].
In connection to the objectives of this research, and based on the previous literature review and the identified research gaps related to the addition of vulnerability of environmental issues in rural development assessments and the effects of weighting methods on the behavior of composite indices, two hypotheses were tested:
  • The inclusion of vulnerability of ecosystem services in a new sustainable rural development index (nSRDI) affects the way as regions (comarcas) score and rank in terms of sustainable rural development.
  • The process of aggregation of sustainability components of rural development affects the ranking of regions according to their level of rural development and can emphasize divergences among regions.
Testing these hypotheses can indicate whether vulnerability should be included in the assessment of rural development and whether weighting methods can substantially impact regional rural development rankings. The first hypothesis deals with a conceptual challenge regarding the role of environmental components in the assessment of sustainable rural development and the second hypothesis with a weighting methodological issue.

3. Materials and Methods

3.1. Study Area

This research was applied in Huesca, a province of Spain located in the autonomous community of Aragon in the northeast of the country. The province comprises 202 municipalities distributed over 10 comarcas: Alto Gallego, Bajo Cinca, Cinca Medio, Hoya of Huesca, La Jacetania, La Litera, La Ribagorza, Los Monegros, Sobrarbe and Somontano de Barbastro (Figure 1). Overall, population density (220,000 inhabitants, 15,626 km2) is 14 inhabitants per km2 but many municipalities show densities much lower than average. Absolute population per municipality ranges from 100 to 500 inhabitants in 48% of the area of the province. Only 13 municipalities out of 202 present population levels higher than 2000 inhabitants. In this study, only the rural municipalities with a population density lower than 150 inhabitants per km2 following OECD criteria were addressed [48]. Moreover, only municipalities with less than 2000 inhabitants were considered to deal with the problem of definition of rural areas in some Spanish municipalities. Indicators were collected or calculated at the rural municipality level, later grouped into comarcas. The rural municipalities cover 1,236,976 ha, which represents 79.16% of the area of the province [49].
Although the majority of the area comprised by comarcas corresponds to rural municipalities, rural municipalities represent just a small proportion of the population of comarcas. Depopulation is a major socio-economic problem of these rural areas [50]. High and constant rates of depopulation have led numerous rural municipalities to extremely low demographic densities [3], currently less than 4 inhabitants/km2 in many of these. A rural exodus in the 20th century and consequent land abandonment have contributed to the current landscape structure and functioning in these rural areas. One of the consequences of depopulation/abandonment was the decline of traditional land-use/land-cover systems and the expansion of shrubland and forest regeneration systems and the impoverishment of cultural landscapes, among others [50].
In general, Huesca can be characterized by a high degree of rurality and a high ecological value. The economy of the rural areas in the region is based on agriculture, cattle raising and nature tourism. Farmland in the rural area is around 661,600 ha, which represents 42.3% of the area of Huesca. Irrigated crops, such as alfalfa, corn and fruit tree orchards, are very important in La Litera, Cinca Medio and Bajo Cinca comarcas while in Somontano and Monegros vineyards, fruit tree orchards and forage crops are the dominant systems. Rural municipalities contain 63,460 ha of grasslands supporting extensive cattle and sheep grazing systems, i.e., 5.13% of their area [49]. In addition to grazing, grasslands provide a multitude of environmental services, such as carbon sequestration and storage or regulation of the water cycle [51]. Although sheep are more important in terms of the number of animals, in recent years they have declined in favor of cattle. In mountainous areas, cattle still persist extensively based in meadows. Today, local communities in rural areas are strongly dependent of tourism, as the main activity of families or as the secondary activity of farmers, breeders and small entrepreneurs whose activity is focused on local products.
Mountains dominate the landscape in Huesca to a large extent. Most of the area of the province is located in the Aragonese Pyrenees, to the north, and the Iberian System to the south. In the south of the province forests of conifers are abundant and small woodlands of Juniperus sabina and Quercus ilex emerge in semi-arid areas with crops and extensive meadows. Overall, forest and shrubland cover in the Huesca province is around 714,500 ha including 567,750 ha (45.90%) in the rural municipalities addressed in this study [49].
Regarding natural value, 25.24% of the area of the Huesca province has been classified as Sites of Community Importance (SCI) and 23.64% as Special Protection Areas (SPA) [49] under the Natura 2000 network, and nearly 9% of the province has also been classified as protected areas under national and regional conservation systems [48]. These figures are still more relevant when presented in terms of rural area of comarcas. For instance, 67.67% of the rural area in the comarca of La Jacetania is SCI, of which 44.66% is protected area, and 50.69% of the rural area of Sobrarbe is SCI, of which 30.06% is protected area [49]. One of the most important protected areas in the study area is the Ordesa and Monte Perdido National Park (OMPNP). Located in the Sobrarbe comarca (municipalities of Bielsa, Broto, Fanlo, Puértolas, Tella-Sin and Torla), the OMPNP was established in 1918 and expanded in 1982 to its present limits. The National Park comprises a core area of 15,608 ha and a buffer zone of 19,679 ha. This National Park includes the most singular and representative ecological values in the study area and for this reason it was selected as the reference area for the assessment of vulnerability of ecosystem services in this study.

3.2. Indicators

Initially, a set of 21 indicators distributed by the three sustainability dimensions (social, economic and environmental) were selected for this study (Table 1) based on the published data available for the Huesca province, taking into consideration the dimensions of sustainability and the use of sustainability indicators of sustainable rural development in the literature, following the extensive review in Section 2. These indicators were classified according to impacts on sustainable development in two forms: indicators with a positive impact (+) and indicators with negative impact (−). All indicators were positively related to sustainable development, with the exception of the Aging Index and Burned area that were considered to be negatively related to social and economic development indicators and some environmental indicators (I12, I13, I15, I16, I20 and I21) were collected from the Government of the Aragón database [49]. Indicator I14 was obtained from a review of terrestrial vertebrate species registered on the Terrestrial Vertebrate Database of the Ministry of Environment of the Government of Spain [53], I15 from the CSIC herbarium and Government of Aragon spatial databases [54], I18 from the CORINE Land Cover database in Aragon [49], and I19 was calculated using Equation (1):
E C r = 1 ( i = 1 n L S i 100 i = 1 n E S i ) 100    
where ECr is the erosion control index in comarca r, LSi is the area (ha) with more than 25 t/ha/y of soil loss in municipality I and ESi is the erodible soil in municipality i when comarca r is formed by n municipalities. LS and ES were calculated from data of the National Inventory of Soil Erosion in Spain [55].
The selection of the environmental indicators was supported by the identification of key ecosystem services in the Ordesa y Monte Perdido National Park (OMPNP) by [49] based on a coarse correspondence established as follows: Cultivated terrestrial plants represented by I12; Reared animals by I13; Wild animals and Genetic material for animals, grouped in a single class (ESs provided by wild animals), by I14; Wild plants and Genetic material for plants, grouped in a single class (ESs provided by wild plants), by I15; Surface water and Ground water grouped in the class Water, by I16; Regulation of extreme events by I17; Bioremediation, Mediation of nuisances, Lifecycle maintenance, Water conditions and Atmospheric conditions, grouped in a single class (Regulation ESs provided by natural environments), by I18; Soil quality by I19; Physical, Intellectual and Spiritual interactions, grouped in the class Leisure of nature, by I20; and Non-use value (landscape) by I21. The correspondence between ecosystem services and the selected indicators is supported by ecosystem functions and services classification systems and indicators established for their assessment [56,57].

3.3. Aggregation

The new Sustainable Rural Development Index (nSRDI) proposed in this work was obtained in a sequential process. The first step consisted of aggregating individual indicators in independent dimension indicators (DI) for the social and economic dimensions of sustainability based on an efficiency approach using a Benefit of Doubt-Data Envelopment Analysis (BoD-DEA) model. For the environmental dimension, aggregation was based on a vulnerability approach. The second step consisted of aggregating social, economic and environmental dimension indicators into single composite index using a modified BoD-DEA model. Aggregation was conducted after a correlation analysis with the set of indicators in Table 1 was performed to look for possible linear relationships between pairs of indicators [19]. When correlations were statistically significant, one of the indicators was removed from the analysis, reducing the dimensionality of the data. Calculations were made in SPSS v15.0 (SPSS Inc., Chicago, IL, USA) (correlation analysis) and Lingo v18.0 (Lindo Systems Inc., Chicago, IL, USA) (BoD-DEA models).

3.3.1. Social and Economic Dimension Indicators

The construction of composite indicators requires a multidimensional approach to aggregate heterogeneous information in a structured manner. Data Envelopment Analysis (DEA) is used to optimize variables in complex scenarios based on efficiency. It is a linear programing technique used to assess a set of productive units using input and output variables in an uncertainty context, where the weights of these variables and the production function that relates them are unknown. There is conceptual similarity between that problem and the construction of CIs, in which quantitative sub-indicators are available but the actual knowledge of weights is not [58]. Therefore, DEA can be applied in the construction of CIs from the Benefit of the Doubt approach (BoD) [58]. The main objective of BoD models is to obtain the most suitable weights to each compared assessment of a decision unit from the available data for each unit [59]. Thus, BoD models assess the performance of each decision unit regarding other decision units, therefore allowing the definition of the most suitable weights for each unit. The only difference between BoD models and traditional DEA models is that the only fixed variables are output variables, considering only one dummy input variable that assumes the value 1 for each decision unit. This approach has been used frequently in the construction of CIs (e.g., [58,60]). In particular, Cherchye et al. [61] used a BoD model to construct sustainability CIs.
In the case of this research, the underlying idea is that a good relative performance of a particular comarca in one specific dimension indicator indicates that for that comarca, this dimension is relatively important. The model proposed here to aggregate a set of selected individual indicators into each of the sustainability dimension indicators is formulated as described in Equations (2)–(5):
D I c = m a x   i = 1 m w c , i I c , i
s.t.,
i = 1 m w c , i I j , i     1
(n constraints, one for each comarca j),
w i I j , i i = 1 m w i I j , i α i
w c , i     0
(m constraints, one for each indicator i),
where j = 1, 2, ……, n and I = 1, 2, ……, m, D I c is the dimension indicator of decision unit c,   w c , i is the weight of the decision unit c regarding indicator i, Ic,i is the indicator i for each decision unit c, Ij,i is the indicator i for each comarca j and i is a bound parameter that represents the contribution of indicator i to each comarca j, regarding all indicators. This constraint was added to improve the discriminatory power of the model and to avoid extreme results. The use of proportions has been successfully applied in DEA-models to avoid extreme scenarios, i.e., that all the relative weight can be assigned to a single CI, which would contribute exclusively to the overall performance value, while the other indicators would assume zero as their relative weight [58]. This process was applied to the social and economic dimensions, resulting in two independent dimension indicators.

3.3.2. Vulnerability Assessment

Vulnerability can be defined as “the degree to which a system, subsystem, or system component is likely to experience harm due to exposure to a hazard, either a perturbation or a stress/stressor” [62]. In essence, vulnerability refers to the potential for loss deriving from natural or other hazards and changes [63]. There is not a consensus regarding the best method to assess vulnerability but there is agreement on the need for using vulnerability to assess environmental components of socio-ecological systems [64]. The quantification of vulnerability is structured in 3 stages:
(i)
Selection of participants, design of questionnaire and collection of individual preferences. Participants were selected in the Ordesa and Monte Perdido National Park according to their representativeness and knowledge of the area. Representativeness means the ability of participants to provide the point of view of a group of people with common interests. Participants must have good knowledge of the environment and the territory in order to provide accurate inputs to the process. A panel of experts related to the National Park was formed with this purpose, comprising 5 technicians of the OMPNP, the mayor of one of the main municipalities in the National Park, a delegate of an NGO active in the National Park and a representative of the regional government of Aragón. A Saaty-type paired comparison survey was used to collect inputs for the assessment of the vulnerability of ecosystem services (Supplementary Material S1). Each participant was offered the option of assessing intensity of preference on a Saaty’s 1–9 scale [65], for pairs of ecosystem services according to their vulnerability (a score of 1 meaning that two ecosystem services are perceived as having the same vulnerability, while a score of 9 indicated that the vulnerability of one ecosystem over another was the highest possible). The Analytic Hierarchy Process (AHP), a multi-criteria decision-making method based on individual preferences and valuations of the relative importance of criteria via value judgement, was used with the data from the survey to quantify the relative vulnerability of each ecosystem service. AHP is a very commonly used method [66] with many applications in natural resources planning.
(ii)
Treatment of inconsistencies in individual ratings. A Consistency Ratio (CR) was calculated for each pairwise matrix once individual assessments were obtained for the reason that AHP requires consistency assessments (CR < 0.10) to aggregate individual results to calculate the relative importance for each criterion [65]. To solve inconsistent primary results, a Goal Programming (GP) model was used. GP is a linear programming technique useful to solve complex problems regarding optimization of natural resources. GP finds compromise solutions that may not fully satisfy all the goals but do reach certain satisfaction levels set by the decision-maker. For this purpose, an objective function and some constraints were defined. The constraints of the model were established by the relationship between each attribute, the achievement level for each attribute and negative and positive deviations of the goal. Additional constraints were applied so that the model could provide real solutions to the problem [67]. The Archimedean GP model based on [68] was applied using Equations (6)–(10).
Let M = ( m i j ) i j be a general matrix of positive numbers mij representing the importance of an item i over another item j given by a participant. There is a set of positive numbers w l w n ,   such that m i j = w i w j   for   every   i , j = 1 , , n .
Min   l ( n l ( 1 ) + p l ( 1 ) ) p + s ( n s ( 2 ) + p s ( 2 ) ) p + t ( n t ( 3 ) + p t ( 3 ) ) p
s.t.,
w i j m i j + n l ( 1 ) p l ( 1 ) = 0 , l = 1 ,   2 , ,   n ( n 1 ) ,
w i j w j i + n s ( 2 ) p s ( 2 ) = 1 , s = 1 , 2 , , n ( n 1 ) 2 ,
w i j w j k w i k + n t ( 3 ) p t ( 3 ) = 0 ,             t = 1 ,   2 , . ,   n ( n 1 ) ( n 2 ) ,
0.11 w i j 9         i , j .
where n l ( 1 ) and p l ( 1 ) are the negative and positive deviations of the goal, respectively, for the constraints that ensure the condition of similarity in the position l;   n s ( 2 ) and p s ( 2 ) are the negative and positive deviations of the goal, respectively, for constraints that ensure the condition of reciprocity in the position s; and n t ( 3 ) and p t ( 3 ) are the negative and positive deviations of the goal, respectively, for constraints that ensure the condition of consistency at position t; m i j are the components of the matrix M for each pair of criteria; w i j are the components of matrix W formed by the weights that represent the most similar weights to the components of the original M matrix for each pair of criteria ij.
This model has already been successfully applied to correct inconsistencies in paired matrices for planning in protected areas [16]. After application of the GP model, consistent matrices were obtained that are as similar as possible to the original ones, while ensuring the conditions of similarity, consistency and reciprocity required by matrices built using pairwise comparisons.
(iii)
Aggregation. After inconsistency correction, each matrix was normalized and aggregated into a single matrix using a geometric mean. Final weights were obtained using the eigenvalue method. These weights represent the relative vulnerability of each ecosystem service. Once vulnerability weights were quantified, environmental dimension indicators were generated as a weighted sum.

3.3.3. The nSRDI Composite Indicator

The indicator nSRDI is the result of the aggregation of social, economic and environmental dimension indicators obtained in the previous steps of the process (Section 3.3.1 and Section 3.3.2), using a modified BoD-DEA model (Equations (11)–(14)). Aggregation follows therefore a mixed efficiency-vulnerability approach, optimizing social and economic weights but fixing the environmental vulnerability dimension indicator (EVDIC). As a result, nSDRI was calculated for each comarca, making it possible to rank these territorial units in the entire province of Huesca, as follows:
n S R D I c = m a x   i = 1 m w c , i D I c , i   + E V D I c
s.t.,
i = 1 m w c , i D I j , i     1
w i D I j , i i = 1 m w i D I j , i α i
w c , i     0
where j = 1, 2, ……, n and i = 1, 2, ……, m, DIc,i is the socioeconomic dimension indicator i for decision unit c, EVDIC is the environmental vulnerability dimension indicator for decision unit c, DIj,i is the dimension indicator i for comarca j, w c , i is the weight of the decision unit c regarding dimension indicator i, and i is a bound parameter that represents the contribution of indicator i for comarca j, regarding all the indicators.
DIj,i are obtained through Equations (2)–(5). EVDIC is calculated as:
E V D I   c = i = 1 m w i I c , i
where wi is the vulnerability weight related to each ecosystem service and Ic,i is the environmental indicator i for decision unit c.
In order to test the effect of adding vulnerability based indicators in nSRDI, the index was also calculated removing vulnerability from the assessment and calculated weights for indicators in Table 1, after removal of redundancy, using two approaches: optimal and equal. In the optimal approach, since vulnerability was not considered, the process described in Section 3.3.2 was not included in the calculation of the index and social, economic and environmental dimension indicators were all obtained from Equation (2). Therefore, the BoD-DEA model applied did not consider a priori fixed weights. In this case, the weights in all the dimensions (social, economic and environmental) are the most efficient in order to achieve the best score of the DI. In the equal approach, an average was applied to aggregate dimension indicators. This is one of the most common aggregation methods used to construct CIs when weights are unknown.
Finally, an inter-comarca divergence analysis was conducted to analyze the sensitivity of nSRDI to the weighting method applied. This analysis was based on regional pairwise matrices of Euclidean distances in percentage (Equation (16)) between nSRDI values for the three methods (vulnerability, equal, optimal), resulting in three n × n diagonal and symmetric matrices when n comarcas were compared. Analyses were conducted in Excel 2010.
d s t = ( ( C I s C I t ) 2 ) × 100

4. Results and Discussion

4.1. Indicator Selection

As a result of the correlation analysis, I1, I3, I5, I13, I14 and I20 were removed from the set of indicators due to high correlation with other indicators. I1 was correlated with I2 (−0.707; p < 0.05), I3 was correlated with I5 (0.935; p < 0.01) and I7 (0.746; p < 0.05) and I5 was correlated with I7 (0.863; p < 0.01). Regarding the environmental dimension, I12 was correlated with I13 (0.832; p < 0.01), I14 (−0.778; p < 0.01) and I18 (−0.720; p < 0.05), I13 was correlated with I14 (−0.947; p < 0.01), I18 (−0.766; p < 0.01), I20 (0.680; p < 0.05) and I21 (−0.641; p < 0.05), I14 was correlated with I15 (0.656; p < 0.05), I18 (0.637; p < 0.05) and I21 (0.684; p < 0.05), I18 was correlated with I20 (0.668; p < 0.05) and I20 was correlated with I21 (0.765; p < 0.05). Selected indicators were then normalized (Min-Max scaling) for each of the comarcas (Table 2).

4.2. Vulnerability Weights

As a result of the individual assessment of vulnerability of ecosystem services based on indicators, 64 pairwise comparison matrices were obtained. Of these, 32 were inconsistent and corrected with the GP model described in Equation (3) by recovering 50% of the information, after which weights were calculated for selected indicators. The most vulnerable ecosystem services were Wild plants and Genetic material for plants (ESs provided by wild plants) which correspond to the indicator Plant richness (27.62%) and Bioremediation, Mediation of nuisances, Lifecycle maintenance, Water conditions and Atmospheric conditions, grouped in class Regulation ESs provided by natural environments, represented by indicator Forest Cover (24.76%) while the less vulnerability were Cultivated terrestrial plants represented by indicator Agriculture cover (3.81%) (Table 3).

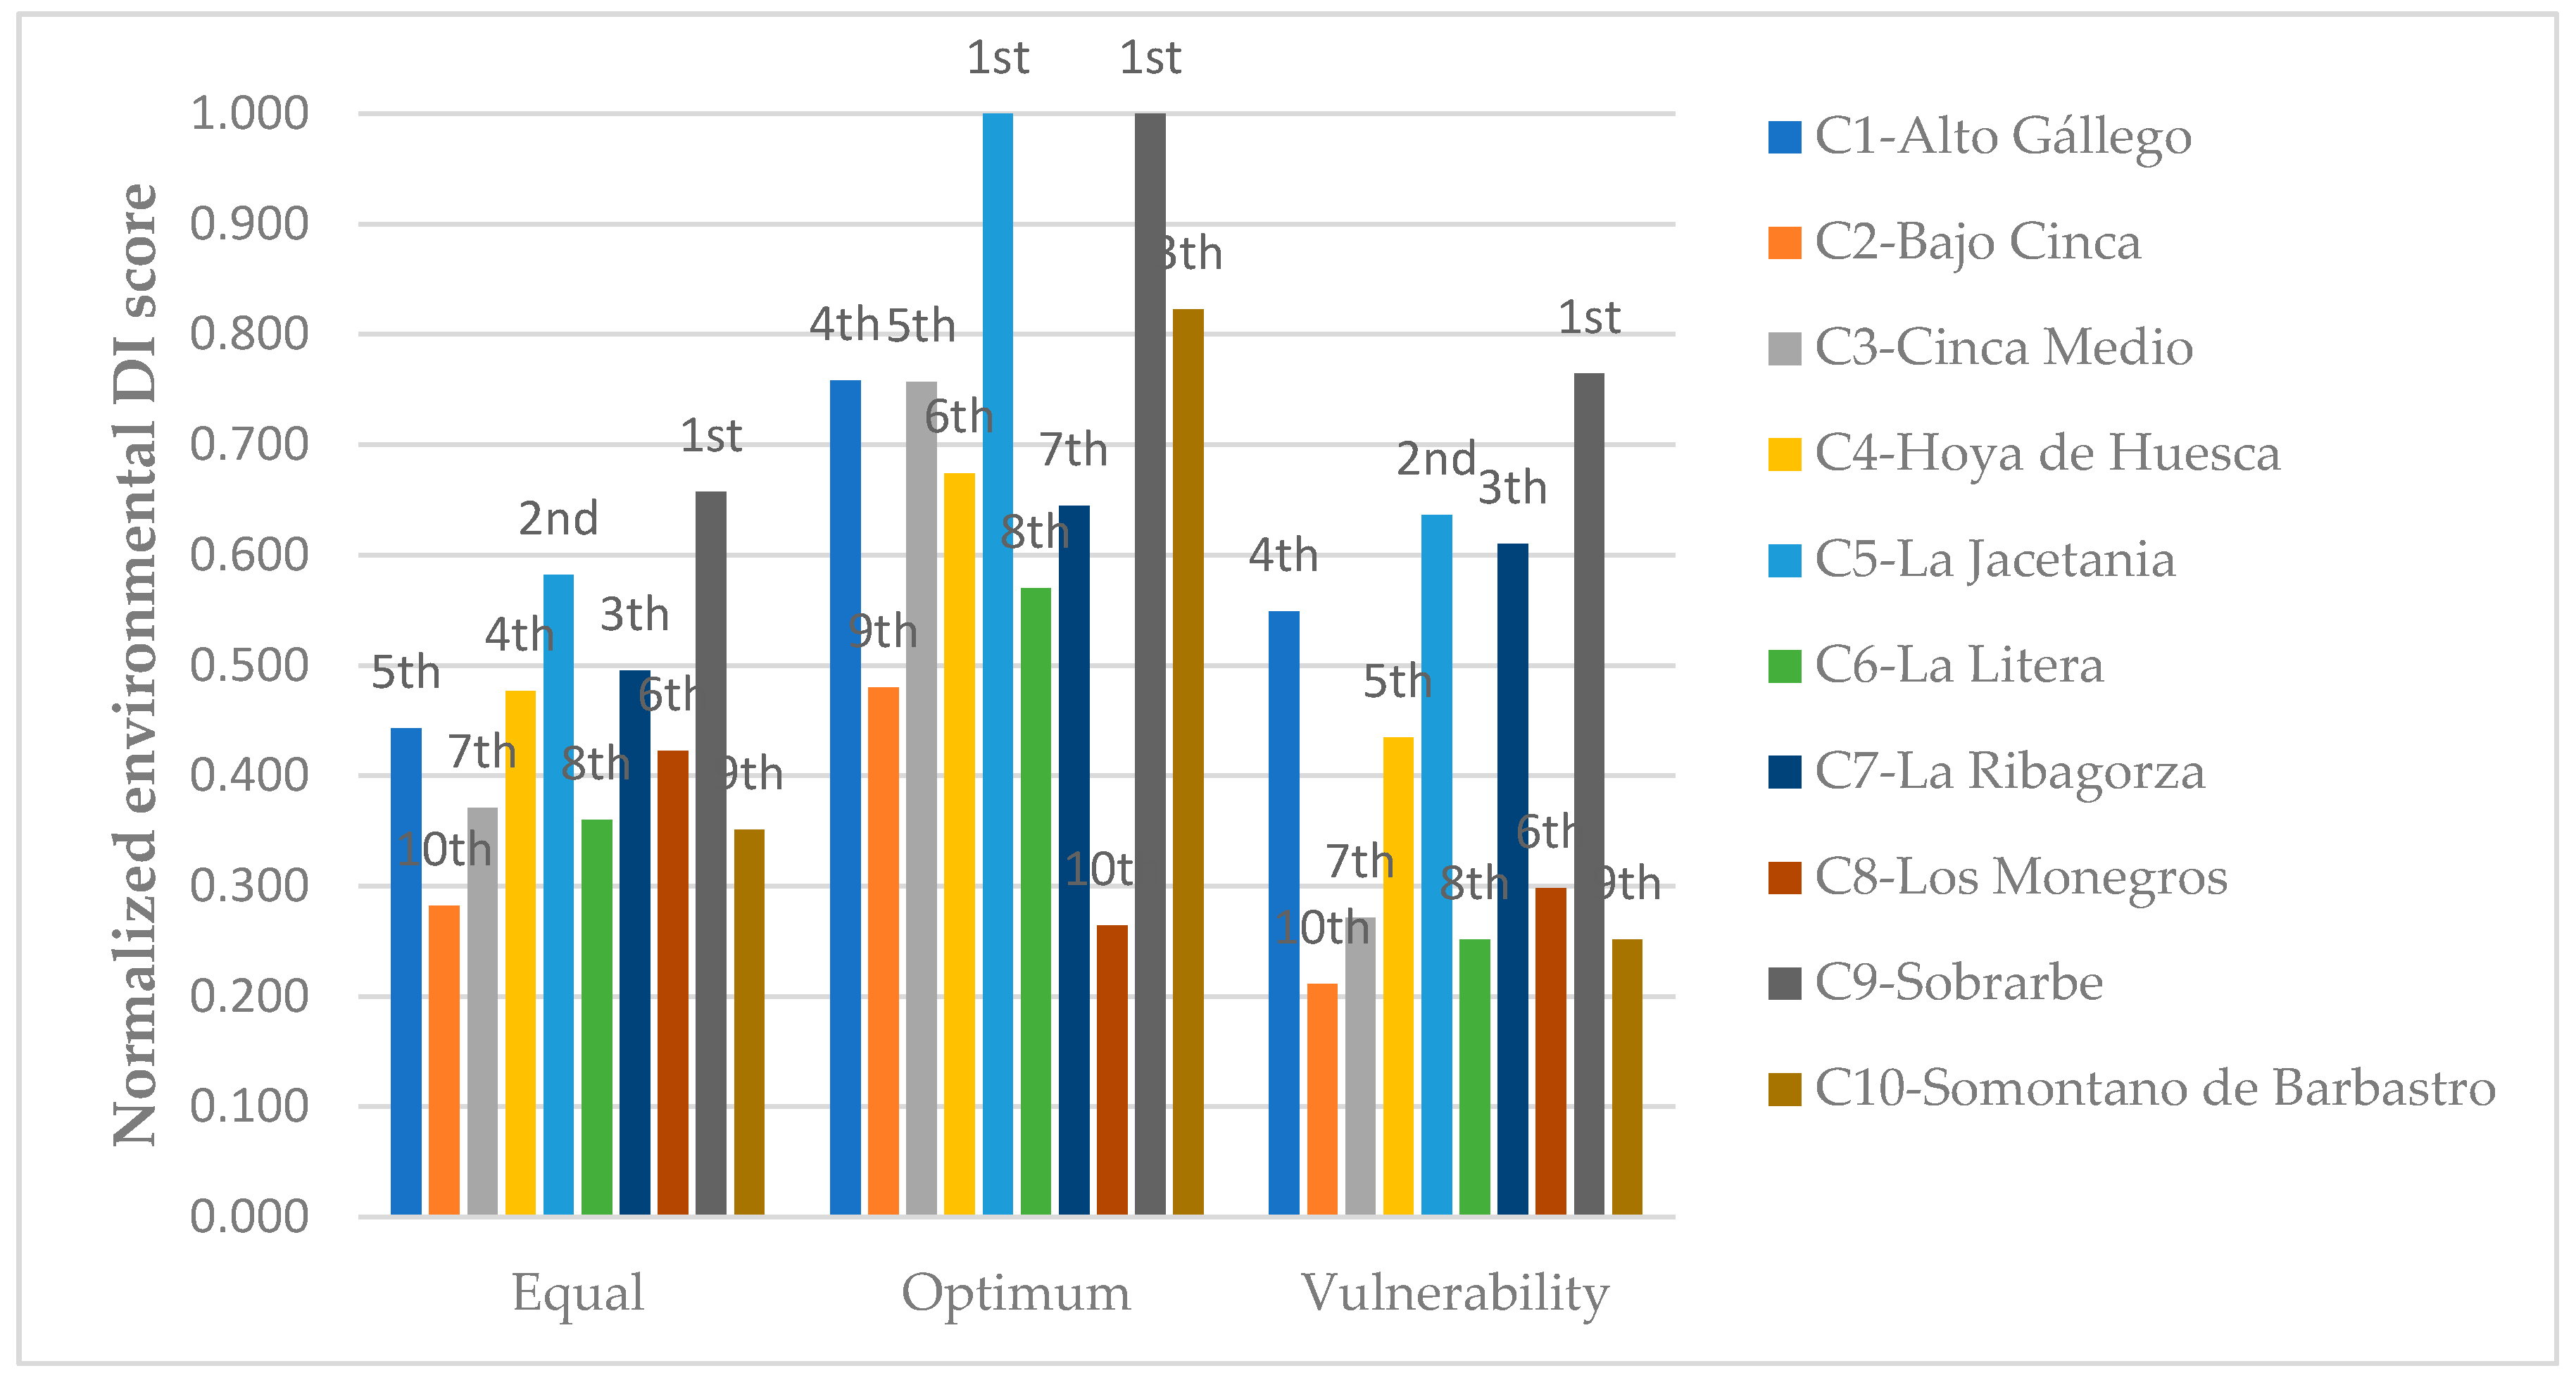
4.3. Effect of Vulnerability on the Environmental Dimension

Assessment of the environmental dimension indicator quantified according to the three different weighting methods (vulnerability, equal, optimal) indicates that the process of weighting affects the score of the dimension indicator (Figure 2) as well as the ranking of comarcas in Huesca. The application of the process involving vulnerability of ecosystem services ranks Sobrarbe (C9) first, followed by La Jacetania (C5) and La Ribagorza (C7) (Figure 2). Sobrarbe (C9) ranked first also for the other two methods but the order of the remaining regions differs among methods. In terms of scores, the weights assigned through the optimal approach resulted in indicator scores higher than when the other two methods were used. This happens because the optimal approach provides the most favorable values of the weights, while the equal and vulnerability methods share the weights for all the considered indicators. Equal weights assign the same relative importance to each indicator causing divergences between comarcas to depend only on the differences of indicator values. When weights are not equal, the relative importance of each indicator can change the score and ranking of comarcas above the original indicators. For this reason, the vulnerability approach provides higher divergences than equal weights (see Section 4.4). This effect is more relevant when vulnerability weights rely on few indicators, as is the case in this study. Optimal weights caused the highest differences among comarcas due to the benchmarking nature of the optimization process that assign the best punctuation to the most efficient indicators regarding all the others. As such, when the optimal approach was followed, the highest distance observed was between La Jacetania (C5) or Sobrarbe (C9), and Los Monegros (C8), that received the best score. The differences between best and worst scores were very small when equal weights were used. The vulnerability approach provided a balanced solution relative to the other two approaches and produced the largest distance between Sobrarbe and Somontano de Barbastro comarcas.
Although, apparently, equal weights produced scores closer to vulnerability than optimum weights, so the regional rankings based on this dimension indicator differ. Alto Gállego (C1) and Hoya de Huesca (C4) swapped positions 4 and 5. Sobrarbe (C9), La Jacetania (C5) and La Ribagorza (C7) comarcas were better ranked when vulnerability was added, while Bajo Cinca (C2), Somontano de Barbastro (C10) and La Litera (C6) have lower positions. This is due to the higher weights of indicators that represent high vulnerability regarding forest area and plant richness. When the optimum approach was used, the ranking changed dramatically as compared to the vulnerability approach, although the two best positions were maintained. Considering vulnerability, comarcas such as Somontano de Barbastro (C10) dropped from 3th to 9th in the rankings. Contrarily, La Ribagorza (C7) and Los Monegros (C8) climbed from 7th to 3th, and from the last to 6th, respectively. In the case of Sobrarbe, the score is so high that it is not affected by changes in the environmental dimension indicator.

4.4. Global Ranking Using Optimum, Equal and Vulnerability Weights

Results of the composite indicator (nSRDI) for all sustainability dimensions considering vulnerability weights as part of the environmental dimension indicator showed La Jacetania (C5), Sobrarbe (C9) and La Ribagorza (C7) comarcas to be the regions of higher sustainable regional development in the Huesca province (Table 4). These results were obtained through the application of Equations (2)–(5) for the social and economic dimensions with the bound parameter α i = 0.05 (constraint 4) in a first round followed by a tie break (second round) of the comarcas with maximum scores that ranked first (score of 1) with the bound parameter set to α i = 0.2 to increase the discriminatory power of the model and to solve ties (indicated with asterisk in Table 4).
The effect of different weighting methods on nSRDI was assessed comparing comarca rankings obtained with the indicator under equal, optimal and vulnerability approaches (Table 4) and by the inter-comarca divergence matrices of nSRDI pairwise distances in the first round of the calculation, i.e., before tie-break (Figure 3) calculated with Equation (15), which helped us identifying the most relevant divergences among regions based on weighting method.
Divergences between comarcas were identified when vulnerability was added in the calculation of nSRDI. For instance, divergence between C8 and C5 and between C8 and C9 was 64.12%. This means that comarca Los Monegros (C8) presented the highest distance in score of nSRDI for these 2 regions when vulnerability was considered as part of the environmental dimension. However, as observed in the previous subsection, the strongest disparities among highest and lowest scores were observed when the optimum approach was applied (Figure 3). The highest distances observed (74.99%) were between C8 and C1, C5 and C7, comarcas in the highest positions in the ranking. With this method, the first round of calculations resulted in four ties for the top ranked comarcas. Moreover, all comarcas, with the exception of C2 and C8, had a score above 0.8, keeping a great distance from other comarcas. The lowest divergences occurred when equal weights were used. Here the highest divergence was 25.04% (C2 and C7). As already seen for the environmental indicator, the vulnerability approach provides a balanced solution between the equal and optimum approaches in the calculation of the composite index nSRDI. This means that, after the ties solved, this approach offers nSRDI results with enough discriminatory power to support a useful ranking of sustainable rural development for regions.

4.5. Hypotheses Assessment

Results of this research support the two hypotheses presented initially (Section 2). The first, that the inclusion of vulnerability of ecosystem services in nSRDI affects comarcas sustainable rural development score and ranking position, is supported by results in Section 4.3 and Section 4.4. This contributes to clarifying the importance of methods of describing and addressing quantitatively the environmental component in constructing composite sustainability indices. When vulnerability was added to the composite index calculation process, the scores of the environmental dimension indicator and nSRDI changed in comparison to the cases where the model excluded vulnerability. Moreover, rural sustainable development rankings also changed which suggest that the changes caused by the introduction of vulnerability were relevant. In particular, the most affected regions in the global ranking were comarcas with the highest ecological value in the Huesca province, as is the case of Sobrarbe (C9). This comarca was better ranked when vulnerability was considered. Also, La Jacetania (C5) scores were in the highest position when vulnerability was added, in comparison with equal weights, although it was also top with the optimum approach. The two comarcas with the highest percentage of SCI area were 67.17% (83,951 ha) in La Jacetania and 50.69% (97,318 ha) in Sobrarbe.
Economic development of rural areas with conservation areas lays mainly on tourism, often related to natural areas or sites with high nature value. Despite opportunity costs derived from land use and land cover limitations, it is likely that rural areas presenting a higher presence of conservation areas show higher levels of development which is related to the tourism industry. In fact, tourism is one of the main economic drivers of rural economies in Europe. Directly and indirectly it accounts for around 10% of European GDP and 20 million jobs [69]. In Spain, rural tourism drew 1.57 million tourists in 2016, growing 86.36% in 11 years [70,71]. In particular, nature-based tourism provides very important sources of income all over the world. Balmford et al. [72] estimated that the world’s terrestrial protected areas together receive nearly 8 billion visits a year and these visits generate around US $600 billion per year in direct in-country expenditure and US $250 billion/year in consumer surplus. Vulnerability of ecosystem services in Huesca comarcas such as Sobrarbe (C9) or La Jacetania (C5), is particularly important because their main driver of development is tourism with a strongly dependency on nature conservation [73]. Increasing vulnerability jeopardizes the supply of ecosystem services over time and their contribution to local development in particular affects the cases of high ecological value sites.
Changes in the regional rankings due to the inclusion of vulnerability in the evaluation process can affect decisions over rural policies in particular when regions with high ecological value and more vulnerable ecosystem services do not receive enough institutional relevance as other rural areas. Adding vulnerability to the assessment of rural areas can improve the quality of decisions and guide resources management recognizing and boosting development of the rural areas that better provide social and economic development while conserving high ecological value and vulnerable sites.
The second hypothesis addressed, according to which the method of aggregation of sustainability components of rural development affects the ranking of regions according to their level of rural development and can emphasize divergences between regions, received support from results in Section 4.3 and Section 4.4, contributing to guide the use of the most suitable decision-making tools regarding rural policies, in particular weighting methods. This hypothesis, more focused on a methodological issue, was put forth in order to analyze the effect of three weighting methods on indicators.
Despite their usefulness and increasing use in assessing complex and multidimensional problems, CIs still generate controversy. The dependency to a preliminary normalization stage and the disagreement among decision-makers on the specific weighting scheme used to aggregate indicators or dimension indicators, are the main problems that analysts face [61]. It is therefore relevant the information that can be extracted from the use of three weighting methods applied in this particular study.
Results showed that the optimum weighting approach produced the lowest discriminatory power among nSRDI scores resulting in three comarcas (La Jacetania, La Ribagorza and Alto Gállego) at the top of the corresponding ranking with the highest score. The vulnerability process also showed limited discriminatory power with Sobrarbe and La Jacetania ranking first with the highest index score. The main weakness of the optimization models used for constructing CIs lay in the low discriminatory power and this could be a serious problem with basic BoD-DEA models because their capacity to rank units is weak. Fortunately, [74] found that adding constraints limiting the relative contribution of criteria can solve this problem. By imposing intuitive, widely accepted normative weight bounds, the discriminatory power increases. When these constraints are added, the value of the objective function decrease and only the decision units that have a minimum contribution in all the criteria can reach the maximum score. Thus, the bound parameter α i can be changed to add or remove flexibility to the model. [58,74] and [75] used this type of extended DEA models in the construction of CIs. In the present case study, the optimum and vulnerability weights were obtained setting the bound parameter α i to 0.05 for all the criteria (constraints in Equations (4) and (13)). When ties were observed, the model was reapplied over tied regions, increasing the parameter up to 0.2. The equal approach presented the highest discriminatory power. However, this method does not allow considering efficiency to build nSRDI, since it assigns the same weights to all criteria.
In the case of this study, the model proposed fills the information gap in the “right” set of weights by generating flexible BoD-weights for social and economic assessment and expert opinion AHP-GP-weights for the environmental assessment for each comarca. The vulnerability approach initially provided ties for the two best positions in the ranking, but, as Figure 3 shows, provided a higher frequency of large distances (red cells) than the equal and optimum approaches. This shows wider regional distances among nSRDI values that represent robust positions in the ranking. Once ties were solved increasing the bound parameter, this method provided a complete ranking which presented the most efficient regions in terms of economic and social elements and vulnerability in terms of ecosystem services, simultaneously.
The assessment of both hypotheses emphasizes the relevance to make efforts to accurately define the relative importance of each assessed component in SRDIs.
The prominence of the resources directed to improve rural areas through the development of national and international policies requires rigorous and reliable tools to support decision-making processes. The challenge is to develop an integrated systems approach to sustainable rural development evaluation systems to support decision-processes that are effective in making sure public policy choices are well informed. The proposed model contributes to the achievement of this objective by providing a novel approach to the accurate assessment of sustainable rural development.

5. Conclusions

In this paper, a novel approach has been provided to accurately assess sustainable rural development with a potential strong contribution in the improvement of integrated system analysis and in the support of effective and informed decision-making processes and public policies.
The weighting method used in the construction of composite indicators was found to be not neutral. The proposed model presented a solution for problems of unknown information regarding weights by generating flexible BoD-weights for social and economic assessment and expert-opinion based AHP-GP-weights based on ecosystem services vulnerability for the environmental assessment.
When vulnerability of ecosystem services was added into the environmental DI, positions in the ranking changed dramatically and only the highest position was maintained. In this study, some comarcas, such as La Ribagorza and Los Monegros, obtained a much better score for the environmental DI based on vulnerability. Divergences between comarcas were identified when vulnerability was added in the calculation of nSRDI. The highest distances observed were between Los Monegros and Alto Gállego, and between La Jacetania and La Ribagorza. The vulnerability approach developed here provided a balanced solution in comparison to equal and optimum approaches in the calculation of the composite index nSRDI.
The inclusion of vulnerability of ecosystem services in nSRDI affected the comarcas’ sustainable rural development score and ranking positions. Increasing vulnerability jeopardizes local development, especially in the areas with high ecological value sites, whose development depends greatly on nature-based tourism. Adding vulnerability in the assessment of rural areas can improve the quality of decisions and guide resources management promoting the regions that better address social and economic development while conserving high ecological value and vulnerable sites.
Based on the results obtained in this study, useful recommendations can be presented to institutions in order to improve the assessment of the sustainable rural development. One of the most relevant practical implications of this study is the finding that to obtain information regarding the analyzed indicators it is not only relevant, but also necessary to define accurately the relative importance of the assessed topics. This means that the concept of sustainability should be very well defined and structured in order to assign the proper importance to each of its dimensions: social, economic and environmental. Assigning the same relative importance to all the criteria is not a neutral decision and it may not correspond to the particular objectives of the assessment process or the political strategy, or even the interests of the analyst. Similarly, absolute flexibility regarding the relative importance of components may not be adequate when some criteria need to be limited.
This study showed some limitations related to the availability of quantitative information of vulnerability, which was solved by including expert opinion-based information in the model. This entails the need to carefully select the experts to be involved in the assessment, considering their diversity, know-how and the full knowledge of the analyzed problem. Moreover, future researcher lines should be oriented to the development of models that consider the feedback of stakeholders in different steps of the assessment process, using collaborative/participative methods, such as Delphi, in order to identify conflicts and achieve consensus in decision-making processes.

Supplementary Materials

The following are available online at https://www.mdpi.com/2073-445X/9/7/222/s1, Supplementary material S1: Questionnaire used in the Assessment of the Vulnerability of Ecosystem Services in The Ordesa and Monte Perdido National Park (originally in Spanish).

Author Contributions

Conceptualization, P.F.M. and M.d.C.-P.; methodology, P.F.M., M.d.C.-P. and V.M.B.; validation, J.C.A.; formal analysis, M.d.C.-P. and J.C.A.; investigation, M.d.C.-P. and V.M.B.; resources, M.d.C.-P. and V.M.B.; data curation, P.F.M., V.M.B., M.d.C.-P. and J.C.A.; writing—original draft preparation, M.d.C.-P.; writing—review and editing, M.d.C.-P. and J.C.A.; supervision, J.C.A.; project administration, P.F.M.; funding acquisition, P.F.M. All authors have read and agreed to the published version of the manuscript.

Funding

This research is partially funded by the Cátedra de Parques Nacionales UPM-URJC-UAH.

Acknowledgments

The authors would like to acknowledge “Organismo Autónomo de Parques Naturales” (OAPN), its director, the entire staff, and the stakeholders of the Ordesa and Monte Perdido National Park for their support in this endeavor. The authors would like also to acknowledge the valuable comments and recommendations made by four reviewers.

Conflicts of Interest

The authors declare no conflict of interest.

References

  1. Eurostat. Urban Europe–Statistics on Cities, Towns and Suburbs; Publications office of the European Union: Luxembourg, 2016.
  2. ESPON. Shrinking Rural Regions in Europe. Policy Brief. Edit. Ilona Raugze, Gavin Daly, Marjan van Herwijnen; ESPON EGTC: Luxembourg, 2017. [Google Scholar]
  3. Pinilla, V.; Ayuda, M.I.; Sáez, L.A. Rural depopulation and the migration turnaround in Mediterranean Western Europe: A case study of Aragon. J. Rural Community Dev. 2008, 3, 1–22. [Google Scholar]
  4. Sil, Â.; Azevedo, J.C.; Fernandes, P.M.; Regos, A.; Vaz, A.S.; Honrado, J.P. (Wild)fire is not an ecosystem service. Front. Ecol. Environ. 2019, 17, 429–430. [Google Scholar] [CrossRef]
  5. Azevedo, J.C.; Moreira, C.; Castro, J.P.; Loureiro, C. Agriculture abandonment, land use change and fire hazard in mountain landscapes in northerastern Portugal. In Landscape Ecology in Forest Management and Conservation: Challenges and Solutions for Global Change; Li, C., Lafortezza, R., Chen, J., Eds.; Springer: New York, NY, USA, 2011; pp. 329–351. [Google Scholar]
  6. Sil, Â.; Fernandes, P.M.; Rodrigues, A.P.; Alonso, J.M.; Honrado, J.P.; Perera, A.; Azevedo, J.C. Farmland abandonment decreases the fire regulation capacity and the fire protection ecosystem service in mountain landscapes. Ecosyst. Serv. 2019, 36, 100908. [Google Scholar] [CrossRef] [Green Version]
  7. Pereira, P.; Mierauskas, P.; Úbeda, X.; Mataix-Solera, J.; Cerda, A. Fire in protected areas-the effect of protection and importance of fire management. Environ. Res. Eng. Manag. 2012, 59, 52–62. [Google Scholar] [CrossRef] [Green Version]
  8. IFAD. Rural Poverty Report 2001: The Challenge of Ending Rural Poverty; Oxford University Press for IFAD: Oxford, UK, 2001. [Google Scholar]
  9. FAO. 2020. Available online: http://www.fao.org/policy-support/policy-themes/rural-poverty-reduction/en/ (accessed on 1 May 2020).
  10. Fernández Martínez, P. Los Fondos Estructurales Europeos y el desarrollo regional. Informacion Comercial Española 1997, 766, 135–145. [Google Scholar]
  11. Stoate, C.; Báldi, A.; Beja, P.; Boatman, N.D.; Herzon, I.; Van Doorn, A.; de Snoo, G.R.; Rakosy, L.; Ramwell, C. Ecological impacts of early 21st century agricultural change in Europe—A review. J. Environ. Manag. 2009, 91, 22–46. [Google Scholar] [CrossRef] [PubMed]
  12. Simoncini, R.; De Groot, R.; Correia, T.P. An integrated approach to assess options for multi-functional use of rural areas: Special issue “Regional Environmental Change”. Reg. Environ. Chang. 2009, 9, 139–141. [Google Scholar] [CrossRef] [Green Version]
  13. Concepción, E.D.; Aneva, I.; Jay, M.; Lukanov, S.; Marsden, K.; Moreno, G.; Oppermann, R.; Pardo, A.; Piskol, S.; Rolo, V.; et al. Optimizing biodiversity gain of European agriculture through regional targeting and adaptive management of conservation tools. Biol. Conserv. 2020, 241, 108384. [Google Scholar] [CrossRef]
  14. Nieto Masot, A.; Gurría Gascón, J.L. El modelo rural y el impacto de los programas LEADER y PRODER en Extremadura (Propuesta metodológica). Scr. Nova. Rev. Electrónica De Geogr. Y Cienc. Soc. 2010, 14. [Google Scholar]
  15. Nieto Masot, A.; Cárdenas Alonso, G.; Costa Moreno, L.M. Principal Component Analysis of the LEADER Approach (2007–2013) in South Western Europe (Extremadura and Alentejo). Sustainability 2019, 11, 4034. [Google Scholar] [CrossRef] [Green Version]
  16. De Castro-Pardo, M.; Pérez-Rodríguez, F.; Martín-Martín, J.M.; Azevedo, J.C. Modelling stakeholders’ preferences to pinpoint conflicts in the planning of transboundary protected areas. Land Use Policy 2019, 89, 104233. [Google Scholar] [CrossRef] [Green Version]
  17. Navarro, A.; López-Bao, J.V. Towards a greener common agricultural policy. Nat. Ecol. Evol. 2018, 2, 1830–1833. [Google Scholar] [CrossRef]
  18. Camaioni, B.; Coderoni, S.; Esposti, R.; Pagliacci, F. Drivers and indicators of the EU rural development expenditure mix across space: Do neighbourhoods matter? Ecol. Indic. 2019, 106, 105505. [Google Scholar] [CrossRef]
  19. Díaz-Balteiro, L.; Alfranca, O.; González-Pachón, J.; Romero, C. Ranking of industrial forest plantations in terms of sustainability: A multicriteria approach. J. Environ. Manag. 2016, 180, 123–132. [Google Scholar] [CrossRef]
  20. Shepherd, A. Sustainable Rural Development; Macmillan International Higher Education: New York, NY, USA, 1998. [Google Scholar]
  21. Calatrava-Requena, J. Origin and evolution of Rural Development concept and policies: From rural communities to territories. In Proceedings of the Old and New Worlds: The Global Challenges of Rural History, International Conference, Lisbon, Portugal, 27–30 January 2016; Serrão, J.V., Freire, D., Fernández Prieto, L., Santos, R., Eds.; Lisbon, ISCTE-IUL: Lisbon, Portugal, 2016. Available online: https://lisbon2016rh.files.wordpress.com/2015/12/onw-02461.pdf (accessed on 1 May 2020).
  22. Bryden, J. Rural development indicators and diversity in the European Union. In Proceedings of the Conference on Measuring Rural Diversity, Washington, DC, USA, 21–22 November 2002; Available online: http://citeseerx.ist.psu.edu/viewdoc/download?doi=10.1.1.199.4439&rep=rep1&type=pdf (accessed on 1 March 2020).
  23. Pe’Er, G.; Zinngrebe, Y.; Moreira, F.; Sirami, C.; Schindler, S.; Müller, R.; Bontzorlos, V.; Clough, D.; Bezák, P.; Bonn, A.; et al. A greener path for the EU Common Agricultural Policy. Science 2019, 365, 449–451. [Google Scholar] [CrossRef]
  24. Pe’Er, G.; Bonn, A.; Bruelheide, H.; Dieker, P.; Eisenhauer, N.; Feindt, P.H.; Hagedorn, G.; Hansjürgens, B.; Herzon, I.; Lomba, A.; et al. Action needed for the EU Common Agricultural Policy to address sustainability challenges. People Nat. 2020, 2, 305–316. [Google Scholar] [CrossRef]
  25. EIP-AGRI Focus Group. Sustainable High Nature Value (HNV) Farming (Final Report). Report, Brussels, Belgium. 2016. Available online: https://ec.europa.eu/eip/agriculture/sites/agri-eip/files/eip-agri_fg_hnv_farming_final_report_2016_en.pdf (accessed on 1 March 2020).
  26. Bhattacharyya, S.; Burman, R.R.; Sharma, J.P.; Padaria, R.N.; Paul, S.; Singh, A.K. Model Villages Led Rural Development: A Review of Conceptual Framework and Development Indicators. J. Community Mobilization Sustain. Dev. 2018, 13, 513–526. [Google Scholar]
  27. Zhou, B.; Liu, W.; Lu, W.; Zhao, M.; Li, L. Application of OECD LSE Framework to Assess Spatial Differences in Rural Green Development in the Arid Shaanxi Province, China. Int. J. Environ. Res. Public Health 2020, 17, 286. [Google Scholar] [CrossRef] [Green Version]
  28. World Bank. Rural Development Indicators Handbook; World Bank: Washington, DC, USA, 2000. [Google Scholar]
  29. Armsworth, P.R.; Chan, K.M.; Daily, G.C.; Ehrlich, P.R.; Kremen, C.; Ricketts, T.H.; Sanjayan, M.A. Ecosystem-service science and the way forward for conservation. Conserv. Biol. 2007, 21, 1383–1384. [Google Scholar] [CrossRef]
  30. Gómez-Baggethun, E.; De Groot, R.; Lomas, P.L.; Montes, C. The history of ecosystem services in economic theory and practice: From early notions to markets and payment schemes. Ecol. Econ. 2010, 69, 1209–1218. [Google Scholar] [CrossRef]
  31. Chen, H.; Tang, L.; Qiu, Q.; Hou, L.; Wang, B. Construction and case analysis of an index for the sustainability of ecosystem services. Ecol. Indic. 2020, 115, 106370. [Google Scholar] [CrossRef]
  32. Giménez, J.C.; Bertomeu, M.; Diaz-Balteiro, L.; Romero, C. Optimal harvest scheduling in Eucalyptus plantations under a sustainability perspective. For. Ecol. Manag. 2013, 291, 367–376. [Google Scholar] [CrossRef]
  33. Gregory, R.D.; Van Strien, A.; Vorisek, P.; Gmelig Meyling, A.W.; Noble, D.G.; Foppen, R.P.; Gibbons, D.W. Developing indicators for European birds. Philos. Trans. R. Soc. B Biol. Sci. 2005, 360, 269–288. [Google Scholar] [CrossRef] [Green Version]
  34. Reig-Martínez, E.; Gómez-Limón, J.A.; Picazo-Tadeo, A.J. Ranking farms with a composite indicator of sustainability. Agric. Econ. 2011, 42, 561–575. [Google Scholar] [CrossRef]
  35. Sabiha, N.E.; Salim, R.; Rahman, S.; Rola-Rubzen, M.F. Measuring environmental sustainability in agriculture: A composite environmental impact index approach. J. Environ. Manag. 2016, 166, 84–93. [Google Scholar] [CrossRef] [Green Version]
  36. Wolfslehner, B.; Vacik, H. Evaluating sustainable forest management strategies with the analytic network process in a pressure-state-response framework. J. Environ. Manag. 2008, 88, 1–10. [Google Scholar] [CrossRef]
  37. Mononen, L.; Auvinen, A.P.; Ahokumpu, A.L.; Rönkä, M.; Aarras, N.; Tolvanen, H.; Kamppinen, N.; Viirret, E.; Kumpula, T.; Vihervaara, P. National ecosystem service indicators: Measures of social–ecological sustainability. Ecol. Indic. 2016, 61, 27–37. [Google Scholar] [CrossRef]
  38. Chen, X.; Chen, Y.; Shimizu, T.; Niu, J.; Nakagami, K.I.; Qian, X.; Baoju, J.; Nakajima, J.; Han, J.; Li, J. Water resources management in the urban agglomeration of the Lake Biwa region, Japan: An ecosystem services-based sustainability assessment. Sci. Total Environ. 2017, 586, 174–187. [Google Scholar] [CrossRef] [PubMed]
  39. Díaz-Balteiro, L.; Alonso, R.; Martínez-Jaúregui, M.; Pardos, M. Selecting the best forest management alternative by aggregating ecosystem services indicators over time: A case study in central Spain. Ecol. Indic. 2017, 72, 322–329. [Google Scholar] [CrossRef]
  40. Skondras, N.A.; Karavitis, C.A.; Gkotsis, I.I.; Scott, P.J.B.; Kaly, U.L.; Alexandris, S.G. Application and assessment of the Environmental Vulnerability Index in Greece. Ecol. Indic. 2011, 11, 1699–1706. [Google Scholar] [CrossRef]
  41. Toro, J.; Duarte, O.; Requena, I.; Zamorano, M. Determining vulnerability importance in environmental impact assessment: The case of Colombia. Environ. Impact Assess. Rev. 2012, 32, 107–117. [Google Scholar] [CrossRef]
  42. Li, H.; Nijkamp, P.; Xie, X.; Liu, J. A New Livelihood Sustainability Index for Rural Revitalization Assessment—A Modelling Study on Smart Tourism Specialization in China. Sustainability 2020, 12, 3148. [Google Scholar] [CrossRef] [Green Version]
  43. Singh, R.K.; Murty, H.R.; Gupta, S.K.; Dikshit, A.K. An overview of sustainability assessment methodologies. Ecol. Indic. 2019, 9, 189–212. [Google Scholar] [CrossRef]
  44. Castellani, V.; Sala, S. Sustainable performance index for tourism policy development. Tour. Manag. 2010, 31, 871–880. [Google Scholar] [CrossRef]
  45. Caschili, S.; De Montis, A.; Trogu, D. Accessibility and rurality indicators for regional development. Computers, Environ. Urban Syst. 2015, 49, 98–114. [Google Scholar] [CrossRef]
  46. Schultink, G. Critical environmental indicators: Performance indices and assessment models for sustainable rural development planning. Ecol. Model. 2000, 130, 47–58. [Google Scholar] [CrossRef]
  47. Burgass, M.J.; Halpern, B.S.; Nicholson, E.; Milner-Gulland, E.J. Navigating uncertainty in environmental composite indicators. Ecol. Indic. 2017, 75, 268–278. [Google Scholar] [CrossRef]
  48. Goerlich, F.J.; Reig, E.; Cantarino, I. Delimitación y características de las áreas rurales españolas. In Proceedings of the International Conference on Regional Science. Thirty years of integration in Europe from a Regional Perspective: Balance and New Challenges, Santiago de Compostela, Spain, 16–18 November 2016. [Google Scholar]
  49. IAEST. Instituto Aragonés de Estadística. 2018. Available online: https://www.aragon.es/ (accessed on 1 March 2020).
  50. De Castro-Pardo, M.; Fernández Martínez, P.; Guaita Martínez, J.M.; Martín Martín, J.M. Modelling Natural Capital: A Proposal for a Mixed Multi-criteria Approach to Assign Management Priorities to Ecosystem Services. Contemp. Econ. 2020, 14, 22–37. [Google Scholar]
  51. García, S. Beneficios Económicos de la RED NATURA 2000 en España; Ministerio para la Transición Ecológica: Madrid, Spain, 2019; 366p.
  52. Mapa de Comarcas de Huesca. Available online: https://www.mapasmurales.es/municipios-huesca/ (accessed on 2 May 2020).
  53. MITECO. Inventario Español de Especies Terestres. 2018. Available online: https://www.miteco.gob.es/es/biodiversidad/temas/inventarios-nacionales/inventario-especies-terrestres/inventario-nacional-de-biodiversidad/bdn-ieet-default.aspx (accessed on 1 March 2020).
  54. Gobierno de Aragón, CSIC. Atlas Florístico de Aragón. 2005. Available online: http://floragon.ipe.csic.es (accessed on 1 March 2020).
  55. MITECO. Inventario Nacional de Erosión de Suelos. Huesca. 2015. Available online: https://www.mapa.gob.es (accessed on 1 March 2020).
  56. Burkhard, B.; Santos-Martín, F.; Nedkov, S.; Maes, J. An operational framework for integrated Mapping and Assessment of Ecosystem and their Services (MAES). One Ecosyst. 2018, 3, e22831. [Google Scholar] [CrossRef] [Green Version]
  57. Maes, J.; Teller, A.; Erhard, M.; Murphy, P.; Paracchini, M.L.; Barredo, J.I.; Grizzetti, B.; Cardoso, A.; Somma, F.; Petersen, J.E.; et al. Mapping and Assessment of Ecosystems and their Services: Indicators for Ecosystem Assessment under Action 5 of the EU Biosiversity Strategy to 2020; Publications office of the European Union: Luxembourg, 2014.
  58. Cherchye, L.; Moesen, W.; Rogge, N.; Van Puyenbroeck, T. Constructing composite indicators with imprecise data: A proposal. Expert Syst. Appl. 2011, 38, 10940–10949. [Google Scholar] [CrossRef]
  59. Cherchye, L.; Moesen, W.; Rogge, N.; Van Puyenbroeck, T. An introduction to ‘benefit of the doubt’composite indicators. Soc. Indic. Res. 2007, 82, 111–145. [Google Scholar] [CrossRef]
  60. Verbunt, P.; Rogge, N. Geometric composite indicators with compromise Benefit-of-the-Doubt weights. Eur. J. Oper. Res. 2018, 264, 388–401. [Google Scholar] [CrossRef]
  61. Cherchye, L.; Kuosmanen, T. Benchmarking Sustainable Development: A Synthetic Meta-Index Approach (No. 2004/28); WIDER Research Paper UNU-WIDER: Helsinki, Finland, 2004. [Google Scholar]
  62. Kasperson, J.X.; Kasperson, R.E.; Turner, B.L.; Hsieh, W.; Schiller, A. Vulnerability to global environmental change. In Social Contours of Risk; Routledge: New York, NY, USA, 2014; pp. 261–301. [Google Scholar]
  63. Cutter, S.L. Vulnerability to environmental hazards. Prog. Hum. Geogr. 1996, 20, 529–539. [Google Scholar] [CrossRef]
  64. Barnett, J.; Lambert, S.; Fry, I. The hazards of indicators: Insights from the environmental vulnerability index. Ann. Assoc. Am. Geogr. 2008, 98, 102–119. [Google Scholar] [CrossRef]
  65. Saaty, T.L. Fundamentals of the Analytic Hierarchy Process. In The Analytic Hierarchy Process in Natural Resource and Environmental Decision Making; Schmoldt, D.L., Kangas, J., Mendoza, G.A., Pesonen, M., Eds.; Springer: Berlin/Heidelberg, Germany, 2001; pp. 15–35. [Google Scholar]
  66. Cegan, J.C.; Filion, A.M.; Keisler, J.M.; Linkov, I. Trends and applications of multi-criteria decision analysis in environmental sciences: Literature review. Environ. Syst. Decis. 2017, 37, 123–133. [Google Scholar] [CrossRef]
  67. Jones, D.; Romero, C. Advances and new orientations in Goal Programming. In New Perspectives in Multiple Criteria Decision Making; Springer: Cham, Switzerland, 2019; pp. 231–246. [Google Scholar]
  68. González-Pachón, J.; Romero, C. A method for dealing with inconsistencies in pairwise comparisons. Eur. J. Oper. Res. 2004, 158, 351–361. [Google Scholar] [CrossRef]
  69. Europarc Federation. Sustainable Tourism Working Group 2013–2014. Final Report. 2015. Available online: https://www.europarc.org/library/europarc-events-and-programmes/european-charter-for-sustainable-tourism/ (accessed on 2 May 2020).
  70. Guaita, J.M.; Martín, J.M.; Salinas, J.A.; Mogorrón-Guerrero, H. An analysis of the stability of rural tourism as a desired condition for sustainable tourism. J. Bus. Res. 2019, 100, 165–174. [Google Scholar] [CrossRef]
  71. Martín, J.M.; Salinas, J.A.; Rodríguez, J.A.; Jiménez, J.D. Assessment of the tourism’s potential as a sustainable development instrument in terms of annual stability: Application to Spanish rural destinations in process of consolidation. Sustainability 2017, 9, 1692. [Google Scholar] [CrossRef] [Green Version]
  72. Balmford, A.; Green, J.M.; Anderson, M.; Beresford, J.; Huang, C.; Naidoo, R.; Walpole, M.; Manica, A. Walk on the wild side: Estimating the global magnitude of visits to protected areas. PLoS Biol. 2015, 13, e1002074. [Google Scholar] [CrossRef] [PubMed] [Green Version]
  73. Gómez Loscos, A.; Horna Jimeno, G. El Sector Turístico En Las Comarcas Aragonesas; Documento de trabajo 25/2006; Fundación Economía Aragonesa: Zaragoza, Spain, 2006. [Google Scholar]
  74. Wong, Y.H.; Beasley, J.E. Restricting weight flexibility in data envelopment analysis. J. Oper. Res. Soc. 1990, 41, 829–835. [Google Scholar] [CrossRef]
  75. Guaita, J.M.; Martín, J.M.; Ostos, M.S.; de Castro-Pardo, M. Constructing knowledge economy composite indicators using an MCA-DEA approach. Econ. Res.-Ekon. Istraz. 2020, in press. [Google Scholar]
Figure 1. Comarcas in Huesca and location of Huesca province in Spain and in the autonomous community of Aragon (left), Source: [52]; Protected areas in the Huesca province (right), Source: [49].
Land 09 00222 g001
Figure 2. Normalized environmental dimension indicator scores by comarca and corresponding ranking position according to the process of calculating weights: vulnerability based weights and equal and optimal approaches.
Land 09 00222 g002
Figure 3. Pairwise comarca new Sustainable Rural Development Index—nSRDI divergence matrices by weighting approach (equal, optimal and vulnerability) based on distances between scores of the indicator. Dark red indicates high divergence and dark blue indicates low divergence. Values are in percentages.
Land 09 00222 g003
Table 1. Description of indicators used for comarcas in the Huesca province by dimension and type.
CodeDimensionIndicatorDescriptionType
I1SocialAging Index (%)Ratio of the population 65 years or older to population 15 year older or younger
I2SocialCumulative population growth rate (%)Cumulative growth rate of the population during the last decade+
I3SocialMedium-high education ratio (%)Ratio of the population with medium or higher education to the overall population+
I4SocialSchools/libraries per inhabitant (%)Number of schools and libraries over total population+
I5SocialHealth centers per inhabitant (%)Number of health centers over total population+
I6SocialWorkers in the commerce sector (%)Workers in the retail and wholesale trade sector over total population+
I7SocialVacancies in nursing homes (%)Number of vacancies available in nursing homes over total population+
I8EconomicEmployment rate (%)Ratio of number of workers to labor force+
I9EconomicActivity rate (%)Ratio of active to total population+
I10EconomicArea of retail trades (m2)Area assigned to retail trades+
I11EconomicWorking licenses on the services sector (%)Ratio of working licenses in the services sector to total population+
I12EnvironmentalAgriculture cover (%)Ratio of agriculture land uses to the total area+
I13EnvironmentalNumber of reared animals (number)Absolute number of reared animals+
I14EnvironmentalAnimal richness (number)Average number of animal species by 10 × 10 km UTM grid cell+
I15EnvironmentalPlant richness (number)Average number of vascular plant species by 10 × 10 km UTM grid cell+
I16EnvironmentalWater bodies (ha)Summation of areas of all water bodies+
I17EnvironmentalBurned area (ha)Total burned area due to wildfires
I18EnvironmentalForest area (ha)Area of all forests land uses+
I19EnvironmentalErosion control index (unitless)Calculated according to Equation (1)+
I20EnvironmentalProtected Areas (%)Ratio of area of protected areas to total area+
I21EnvironmentalSCI area (%)Ratio of area of Sites of Community Importance to total area+
Table 2. Final indicators by comarca and dimension. Sign within parentheses indicates type of indicator: (+) when having a positive impact and (−) when having a negative impact on development. Maximum values are in bold.
ComarcaSocial DimensionEconomic DimensionEnvironmental Dimension
I2(+)I4(+)I7(+)I8(+)I9(+)I10(+)I11(+)I12(+)I15(+)I16(+)I17(−)I18(+)I19(+)I21(+)
C10.8600.7230.5090.4220.2950.7881.0000.0481.0000.2581.0000.3620.0000.431
C20.7550.3240.1310.2370.5200.3950.0010.4690.2480.2350.8040.0330.1850.000
C31.0000.3660.4191.0000.9660.6440.1050.6810.4560.0000.8010.0000.5980.060
C40.9260.0000.1170.1500.3100.5080.0000.3010.0461.0000.6540.5660.5760.194
C50.6240.3630.2110.4130.2661.0000.5600.1810.7110.3000.9940.6060.2831.000
C60.2171.0000.8020.0000.5520.1560.1340.3610.2000.1040.9970.0930.6930.071
C70.5050.3711.0000.3691.0000.7160.9120.0370.6410.5970.0000.9921.0000.202
C80.0000.1710.0000.0080.7090.9310.0251.0000.2890.0150.5450.1580.5540.397
C90.9260.5060.0000.0440.0000.3690.7150.0000.8580.3360.9611.0000.7230.723
C100.5290.3260.1780.1630.7810.0000.2290.3030.0000.1360.7860.2870.7230.222
Table 3. Environmental indicators and vulnerability weights calculated for Ordesa and Monte Perdido National Park based on expert opinion.
Environmental IndicatorVulnerability Weight (%)
I15-Plant richness27.62
I18-Forest area 24.76
I16-Water bodies14.77
I21-SCI area13.33
I17-Burned area08.57
I19-Erosion control index07.14
I12-Agriculture cover03.81
Table 4. Global new Sustainable Rural Development Index—nSRDI rankings of comarcas for weights calculated with the vulnerability, equal and optimal approaches.
ComarcaGlobal nSRDI Ranking
VulnerabilityOptimumEqual
C1-Alto Gállego42 *3
C2-Bajo Cinca9910
C3-Cinca Medio655
C4-Hoya de Huesca577
C5-La Jacetania1 *1 *2
C6-La Litera766
C7-La Ribagorza33 *1
C8-Los Monegros10107
C9-Sobrarbe2 *44
C10-Somontano de Barbastro889
* Tied in the first round.

