Article

Soil Properties and Biomass Attributes in a Former Gravel Mine Area after Two Decades of Forest Restoration

by
Frederick Gyasi Damptey
1,*,
Klaus Birkhofer
1,
Paul Kofi Nsiah
2 and
Enrique G. de la Riva
1
1
Department of Ecology, Brandenburg University of Technology, 03046 Cottbus, Senftenberg, Germany
2
Department of Environmental Management, University of Energy and Natural Resources, Sunyani 00233, Ghana
*
Author to whom correspondence should be addressed.
Land 2020, 9(6), 209; https://doi.org/10.3390/land9060209
Submission received: 3 June 2020 / Revised: 22 June 2020 / Accepted: 23 June 2020 / Published: 26 June 2020
(This article belongs to the Special Issue Landscape Transformation and Changes in Land Use Intensity)

Abstract

:
The ongoing global deforestation resulting from anthropogenic activities such as unsustainable agriculture and surface mining threatens biodiversity and decreases both soil carbon and above-ground biomass stocks. In this study, we assessed soil properties and below- and above-ground biomass attributes in a restored former gravel mine area in Ghana two decades after active restoration with potted plants and fresh topsoil. We compared conditions to four alternative land-use types (unrestored abandoned gravel mine, arable land, semi-natural forest, and natural forest) representing pre- and post-disturbance as well as natural reference states. We hypothesized that soil properties and related levels of below- and above-ground biomass in the restored area share similarities with the natural reference systems and thereby are indicative of a trajectory towards successful restoration. Eight replicated subareas in each land-use type were assessed for a set of soil parameters as well as below- and above-ground biomass attributes. The soil properties characteristic for the restored area differed significantly from pre-restoration stages, such as the abandoned gravel site, but did not differ significantly from properties in the natural forest (except for bulk density and base saturation). Above-ground biomass was lower in the restored area in comparison to the reference natural forests, while differences were not significant for below-ground biomass. Silt and effective cation exchange capacity were closely related to above-ground biomass, while below-ground biomass was related to soil organic carbon, bulk density, and potassium concentration in soils. Our results suggest that major steps towards successful restoration can be accomplished within a relatively short period, without the wholesale application of topsoil. Improving soil conditions is a vital tool for the successful development of extensive vegetation cover after surface mining, which also affects carbon sequestration by both above- and below-ground biomass. We emphasize that the use of reference systems provides critical information for the monitoring of ecosystem development towards an expected future state of the restored area.

1. Introduction

The global reduction in forest cover following anthropogenic activities such as unsustainable agriculture, mining, and construction threatens biodiversity, alters soil properties, and decreases both soil carbon and above-ground biomass stocks [1,2,3]. Ecological restoration aims to enhance the ecological properties of an ecosystem that has previously been degraded, damaged, or destroyed to its pre-disturbance state [4]. Ecological restoration should also enhance the provision of ecosystem services from restored sites [5]. Degraded ecosystems, once restored, need to be monitored and assessed as such assessment will help to minimize problems resulting from the weak implementation of restoration activities [6]. That is, results from these assessments further help to advise decision-makers and land managers about future restoration activities and possible changes [7].
Evaluating the success of restoration projects has traditionally relied on descriptors of vegetation parameters [8,9]. However, there is a growing recognition that other descriptors, such as soil attributes, can give important additional insights into restoration success and associated levels of ecosystem services [10,11,12]. The ability of a particular soil to provide critical functions and ecosystem services (e.g., nutrient cycling, carbon sequestration, production of food, or physical stability) is usually assessed when evaluating restoration projects [13,14]. For example, levels of soil organic carbon, total nitrogen, and available potassium play an essential role in maintaining soil quality and fertility status [15,16] as well as vegetation recovery [17]. Nitrogen is an essential nutrient for plant growth, while soil texture correlates with hydrological processes such as run-off, infiltration rate and water holding capacity (e.g., [18]). Thus, the development of soil properties at restoration sites has profound effects on the structure and functioning of the ecosystem [17,19]. Restoration activities hold the potential to enhance soil conditions by retaining and supplying nutrients to plants [20], creating a positive soil carbon budget and ultimately increasing biodiversity through changes in soil properties [21]. Vegetation benefits from physical support and other essential soil physical properties while soils benefit from vegetation-related functions such as nutrient cycling or erosion control [22,23,24]. These feedbacks link vegetation properties tightly to soil development, and vice versa, often resulting in a positive plant–soil feedback loop [25].
Tropical forests and their biodiversity are facing persistent threats due to deforestation and forest alterations [2]. The high forests of Ghana have lost about 4.9 million hectares (as of 2010), with an annual deforestation rate of approximately 2 % [26]. This loss is mainly caused by anthropogenic factors (e.g., logging, farming, mining, and construction) and wildfires [27,28,29] and has motivated the implementation of restoration projects in the last few decades.
In this study, we aim at assessing the recovery of ecosystem functions and services in a restored area by comparing the status of its soil properties and below- and above-ground biomass attributes with four different alternative land-use types from surrounding areas: (I) a former gravel mine without human intervention for the last 20 years; (II) smallholder arable fields representing the historic pre-mining conditions in some sections of the restored area; (III) semi-natural forest (Bosomkese Forest Reserve), which has been subjected to illegal logging, encroachment for farming, and wildfires as well as afforestation interventions; and (IV) natural forest (Asukese Forest Reserve), which has been under strict protection for the last 86 years. Although reference ecosystems may offer an important baseline for restoration projects, since they represent a pre-disturbance state of an ecosystem [30], few studies have addressed this question experimentally using comparative analyses (e.g., [31]), and, to our knowledge, no studies have addressed whether the soil attributes and their associated carbon stock evolve after restoration with regard to alternative land-use types in a tropical forest. The co-occurrence of these alternative land-use types and the restored area at relatively small spatial scales offer ideal conditions to compare soil properties and below- and above-ground biomass to understand the outcome of restoration activities 20 years after their implementation. Under this framework and based on previous studies in tropical regions of Africa, we hypothesized that the intervention adopted by Newmont Gold Ghana Limited to restore and manage a formally abandoned gravel mine area has improved soil conditions and vegetation development towards levels observed in the semi-natural and natural forest ecosystems in the study area. We further hypothesized that the observed levels of soil properties have a significant positive influence on carbon sequestration and that we expect to find strong correlations between soil properties and attributes related to carbon sequestration (e.g., organic root carbon and above-ground biomass).

2. Materials and Methods
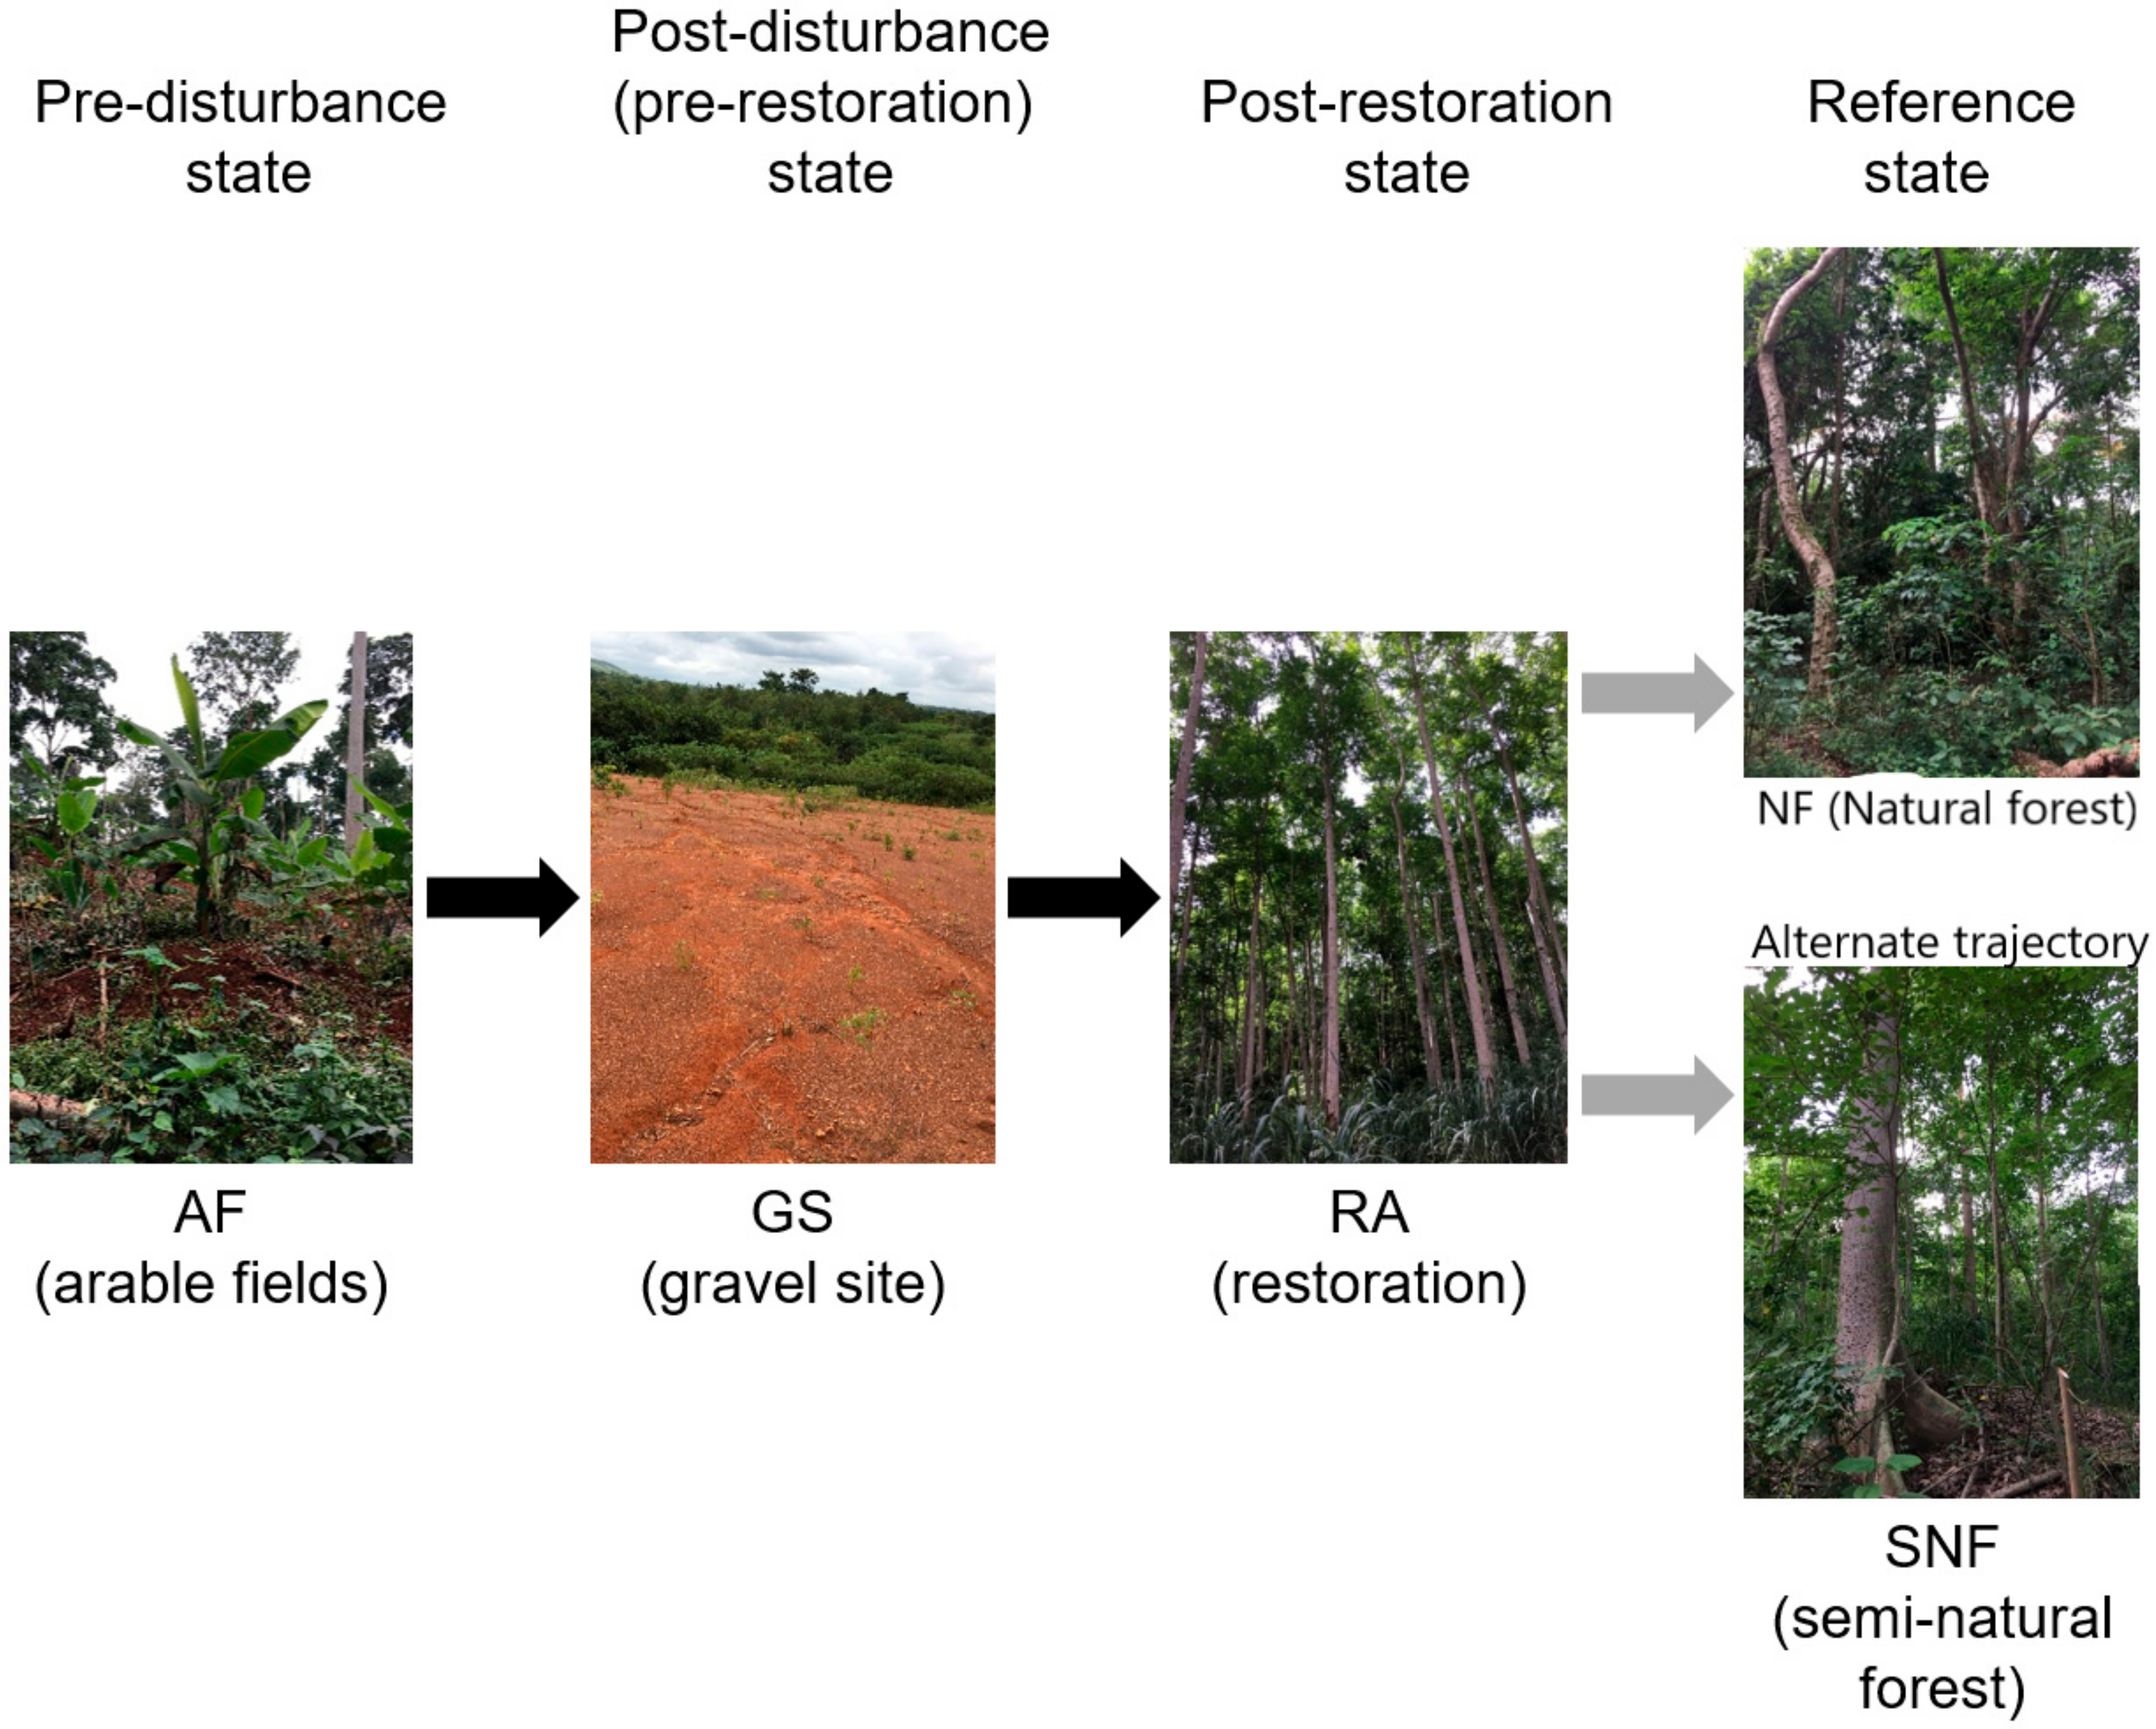
2.1. Study Area

The following land-use types were selected, each with eight replicated study plots for a system comparison: unrestored gravel mine site (GS) as a post-disturbance state, arable lands (AF) as pre-disturbance state, semi-natural forest (SNF) as alternate trajectory, and natural forest (NF) as reference state and restored area (RA) (Figure 1).
The RA covers an area of 15.4 ha and is located at Terchire in the Ahafo Region of Ghana (longitude 7°14.075′ N, latitude 2°10.842′ W). The GS covers an area of about 4 ha and is located 1.8 kilometers from the RA (longitude 7°14.150′ N, latitude 2°9.602′ W). The GS has been abandoned since 1995 and colonized by few Chromolaena odorata and Pennisetumi purpureum. The AFs are located in the surrounding areas of the RA and are cultivated with maize, plantain, cassava, cocoa, among others. Two managed forests reserves, the Asukese Forest Reserve (natural forest, NF) and the Bosomkese Forest Reserves (semi-natural forest, SNF), were included as forest reference systems in the study area. The NF is located in the moist semi-deciduous north-west forest zone (latitude 7°8.469′ N, longitude 2°31.107′ W). The SNF is located in the semi-deciduous south-east forest zone (latitude 7°6.338′ N, longitude 2°14.782′ W). The soils of the five land-use types are classified according to the United States Department of Agriculture (USDA) Soil Taxonomy and the Food and Agriculture Organization (FAO) World Reference Base as Ultisols (Acrisols and Nitisols) on the uplands and Fluvents (Fluvisols) and Inceptisols (Cambisols) in the lowlands [32]. Climatic conditions are very similar for all the five land-use types because of their nearby geographic location (maximum distance between the study sites = 10.8 Km). Mean annual precipitation ranges between 900 to 1500 mm with two distinct seasons: a wet season (April–October) and a dry season (November–March). The mean daily temperature in the study region is 25°C [29].
At the time of mining operations at the GS (from 1994 to 1995), the topsoil was stripped but was not stockpiled. The subsoil was removed for road construction, leaving the area severely degraded and open. To initiate and assist the recovery of the degraded condition, fertile soil was brought from elsewhere to fill the mine-out pits, followed by the planting of potted seedlings of some selected tree species in 1999. Both indigenous and fast growing exotic nitrogen fixing trees (e.g., Leucaena leucocephala) were planted at a planting distance of 2 × 2 m and a density of 1111 seedlings per each hectare. In 2000, NGGL started to manage the planted trees to create an ecosystem that could be capable of providing basic ecosystem goods and services to society.

2.2. Sampling Design

In each of the five land-use types under assessment, eight plots with sizes of 20 × 20 m were demarcated for sampling. All trees with a diameter ≥ 10 cm at breast height (dbh) were identified to species level and counted with the assistance of a local botanist and a field manual [33] in the RA, NF, and SNF plots (the GS and AF plots did not have trees; hence, they were excluded for this measurement). The dbh of all stands was measured with a Vernier caliper, and individual tree height was estimated based on trigonometric calculations [34]. Above-ground biomass (AGB) for individual trees was determined using the measured dbh, the height, and wood density values obtained from the global wood density database [35] based on an improved allometric equation for the pantropical regions [36]. Roots were sampled using the soil core method [37] at a depth of 30 cm. Sampling for soil parameters was based on five replicated samples (four from each corner and one at the center) in each plot with a soil auger (diameter = 6.4 cm). All replicated samples from the same plot were then pooled and thoroughly mixed to form a single composite sample, which was later analyzed for chemical properties. Three replicated undisturbed soil cores for each plot were collected with a 100 cm3 metal ring and further analyzed in the laboratory for bulk density.

2.3. Laboratory Analyses of Soil and Root Samples

Except for the determination of bulk density, soil samples used for the determination of all other parameters were air-dried, crushed, and sieved through a 2 mm mesh. The recipient sample (< 2 mm) was analyzed for pH, soil organic matter/soil organic carbon (SOM/SOC; %), N (%), P (mg kg−1), Na (Cmol kg−1), K (Cmol kg−1), Mg (Cmol kg−1), Ca (Cmolc kg−1), H (Cmolc kg−1), and Al (Cmolc kg−1) concentrations as well as particle size distribution. Soil pH was electrochemically determined using a multi-parameter PC 300 series electrode at a ratio of 5:1 soil to water suspension [38]. Organic matter was estimated by the loss of weight on ignition method using a muffle furnace model L9/S, at 550 °C for four hours, whereas total nitrogen concentration was determined by the Kjeldahl method [38].
Total phosphorus (P) was measured by the blue complex molybdate and thiophosphate method in acid solution and analyzed using the Buck Scientific Spectrophotometer (BSS) model 280 G. The volumetric sodium tetraphenyl boron method was employed in estimating exchangeable Na and K, after dry ash digestion, and analyzed with a Jenway flame photometer model PFP7, while Mg and Ca were determined with the aid of a Spectrophotometer (BSS 280 G), after extraction by ammonium acetate [38]. Exchangeable acidity due to hydrogen (H) and aluminum (Al) was extracted using a 0.1N KCl solution and the filtrate titrated with 0.05N NaOH to a colorless endpoint. Exchangeable acidity (Al and H) was determined by adding 4ml of 3N to the extract and titrated with 0.05N HCl to a pink endpoint. The effective cation exchange capacity (ECEC) was estimated through the summation of base cations (Na, K, Mg, and Ca) and acidic cations (H and Al), while base saturation (BS) was calculated as a percentage of the base cations of ECEC [39].
For the physical parameters, bulk density (g cm−3) was analyzed by using undisturbed soil cores collected in a 100 cm3 metal ring and weight determination after oven-drying [40]. The hydrometer method [41] was employed for particle size analysis, and the textural class was determined through the textural triangle diagram according to the USDA soil texture classification system. Before analyzing root samples in the laboratory, samples were refrigerated at 4 °C for a week. Root biomass determination (%) followed the direct method [42].

2.4. Data Analysis

All plant biomass data were square-root transformed while data on soil properties were log-transformed (Log(X + 1)). Prior to transformation, data were normalized to improve the homogeneity of variances and to reduce any possible weight that may be due to differences in scale (units) as well as making the model more robust [43,44]. To minimize the issue of multiple testing of soil properties, a global analysis was first performed with permutational multivariate analysis of variance (PERMANOVA) [45] based on Euclidian distance of the normalized data. Univariate PERMANOVA models were used to analyze the data for below- and above-ground biomass. The models for soil properties and below-ground biomass used the factors “land-use type” with the five levels RA, GS, NF, SNF, and AF and the eight individual study plots as replicates. The model for the above-ground biomass only used the levels RA, NF, and SNF as GS and AF plots did not contain any trees. All analyses were based on unrestricted permutation of raw data and 9999 permutations. Bootstrap means for the multivariate soil property data in all land-use types were calculated to provide means and ellipses shown in a non-metric multi-dimensional scaling (n-MDS) ordination based on Euclidean distance [46]. The goodness of fit of the n-MDS ordination is reflected by its stress value [47]. Plymouth Routines in Multivariate Ecological Research (PRIMER 7 and the PERMANOVA add-on) [48] were used for these statistical analyses.
General linear mixed models (GLMMs) were used to test for an effect of soil properties on below-ground biomass. We used the factor “land-use type” as a random effect in these models. To avoid any bias induced by including highly correlated predictors [49], we excluded one variable from each pair of variables with a correlation coefficient larger than 0.70 [50]. To avoid the overestimation of the models with spurious parameters with very poor weights on the models [51], we only fitted three-factor models in which the factors were added either additively or multiplicatively. We used the dredge function in the MuMIn package to generate the set of models based on maximum likelihood (ML) estimation and then ranked models following the Akaike information criterion corrected (AICc) for a small sample size [52]. We then calculated marginal R2m and conditional R2c [53] values. In the case of above-ground biomass, we did not use “land-use type” as a random factor as it only had three levels [49]. The relationship between environmental variables and above-ground biomass attributes was therefore assessed with a General Linear Model (GLM), using the factor “land-use type” as a block factor. Again, the best model was selected based on AICc, followed by post-hoc multiple pairwise comparisons (Tukey’s test) to test the differences between land-use types. The R software [54] was used for these statistical analyses.

3. Results

3.1. Physicochemical Soil Properties

In general, the soil properties of the RA showed similar values to the NF and SNF, which suggested a positive development of soil properties as a result of the restoration interventions. Specifically, the RA showed similar pH, nitrogen (Na), phosphorus (P), sodium (Na), calcium (Ca), magnesium (Mg), soil organic matter (SOM), effective cation exchange capacity (ECEC), and carbon to nitrogen ratio (C/N) to the NF and SNF (Table 1). However, significant differences were observed for bulk density, showing higher values for the RA and lower values for GS. N, P, and K concentrations were extremely low for the GS in comparison to the RA. Except for the GS (which had a C/N ratio of 32, which is considered above the ideal threshold [25] for plant growth), all other land-use types were below this threshold, with the lowest C/N values in NF.
The calculated ECEC from the base cations (Na, K, Mg, and Ca) and acidic cations (H and Al) at the RA, NF, and SNF had values above 15, and no significant difference was observed among these sites. The ECEC value of the RA was, however, significantly higher than both the GS and the AF. Base saturation was extremely high for all five sites (> 80 %) despite the exhibition of statistical differences. Soil pH was near neutral at SNF and AF, slightly acidic at RA and NF, and acidic at the GS. In terms of physical parameters, the particle size distribution for all the sites exhibited relatively high sand contents (> 60 %) and low clay and silt contents, yielding texture of sandy - loam for RA, NF, and NSF as well as AF, but sandy - clay loam for the GS.
PERMANOVA results showed significant differences in soil properties between the five land-use types (Sites − F 4,35 = 5.28, p < 0.001). Pairwise comparison between the five land-use types further revealed significant differences between the NF and the SNF (p < 0.001), the NF and AF (p < 0.001), the NF and the GS (p < 0.001), the SNF and the AF (p = 0.009), the SNF and the GS (p < 0.001), the RA and the GS (P < 0.001) and AF and the GS (p < 0.001). No statistically significant difference was, however, established between the NF and the RA, the SNF and the RA, and the RA and the AF (p > 0.05). Distinct and well-defined groups (land-use types) based on soil properties were also displayed by the ordination of the bootstrap averages with a 2D stress value of 0.08. The GS is completely separated from the other land-use types, while a small marginal overlap is displayed between the NF and the RA. The three forest sites (NF, SNF, and RA) are closely clustered away from the AF and the GS (Figure 2).

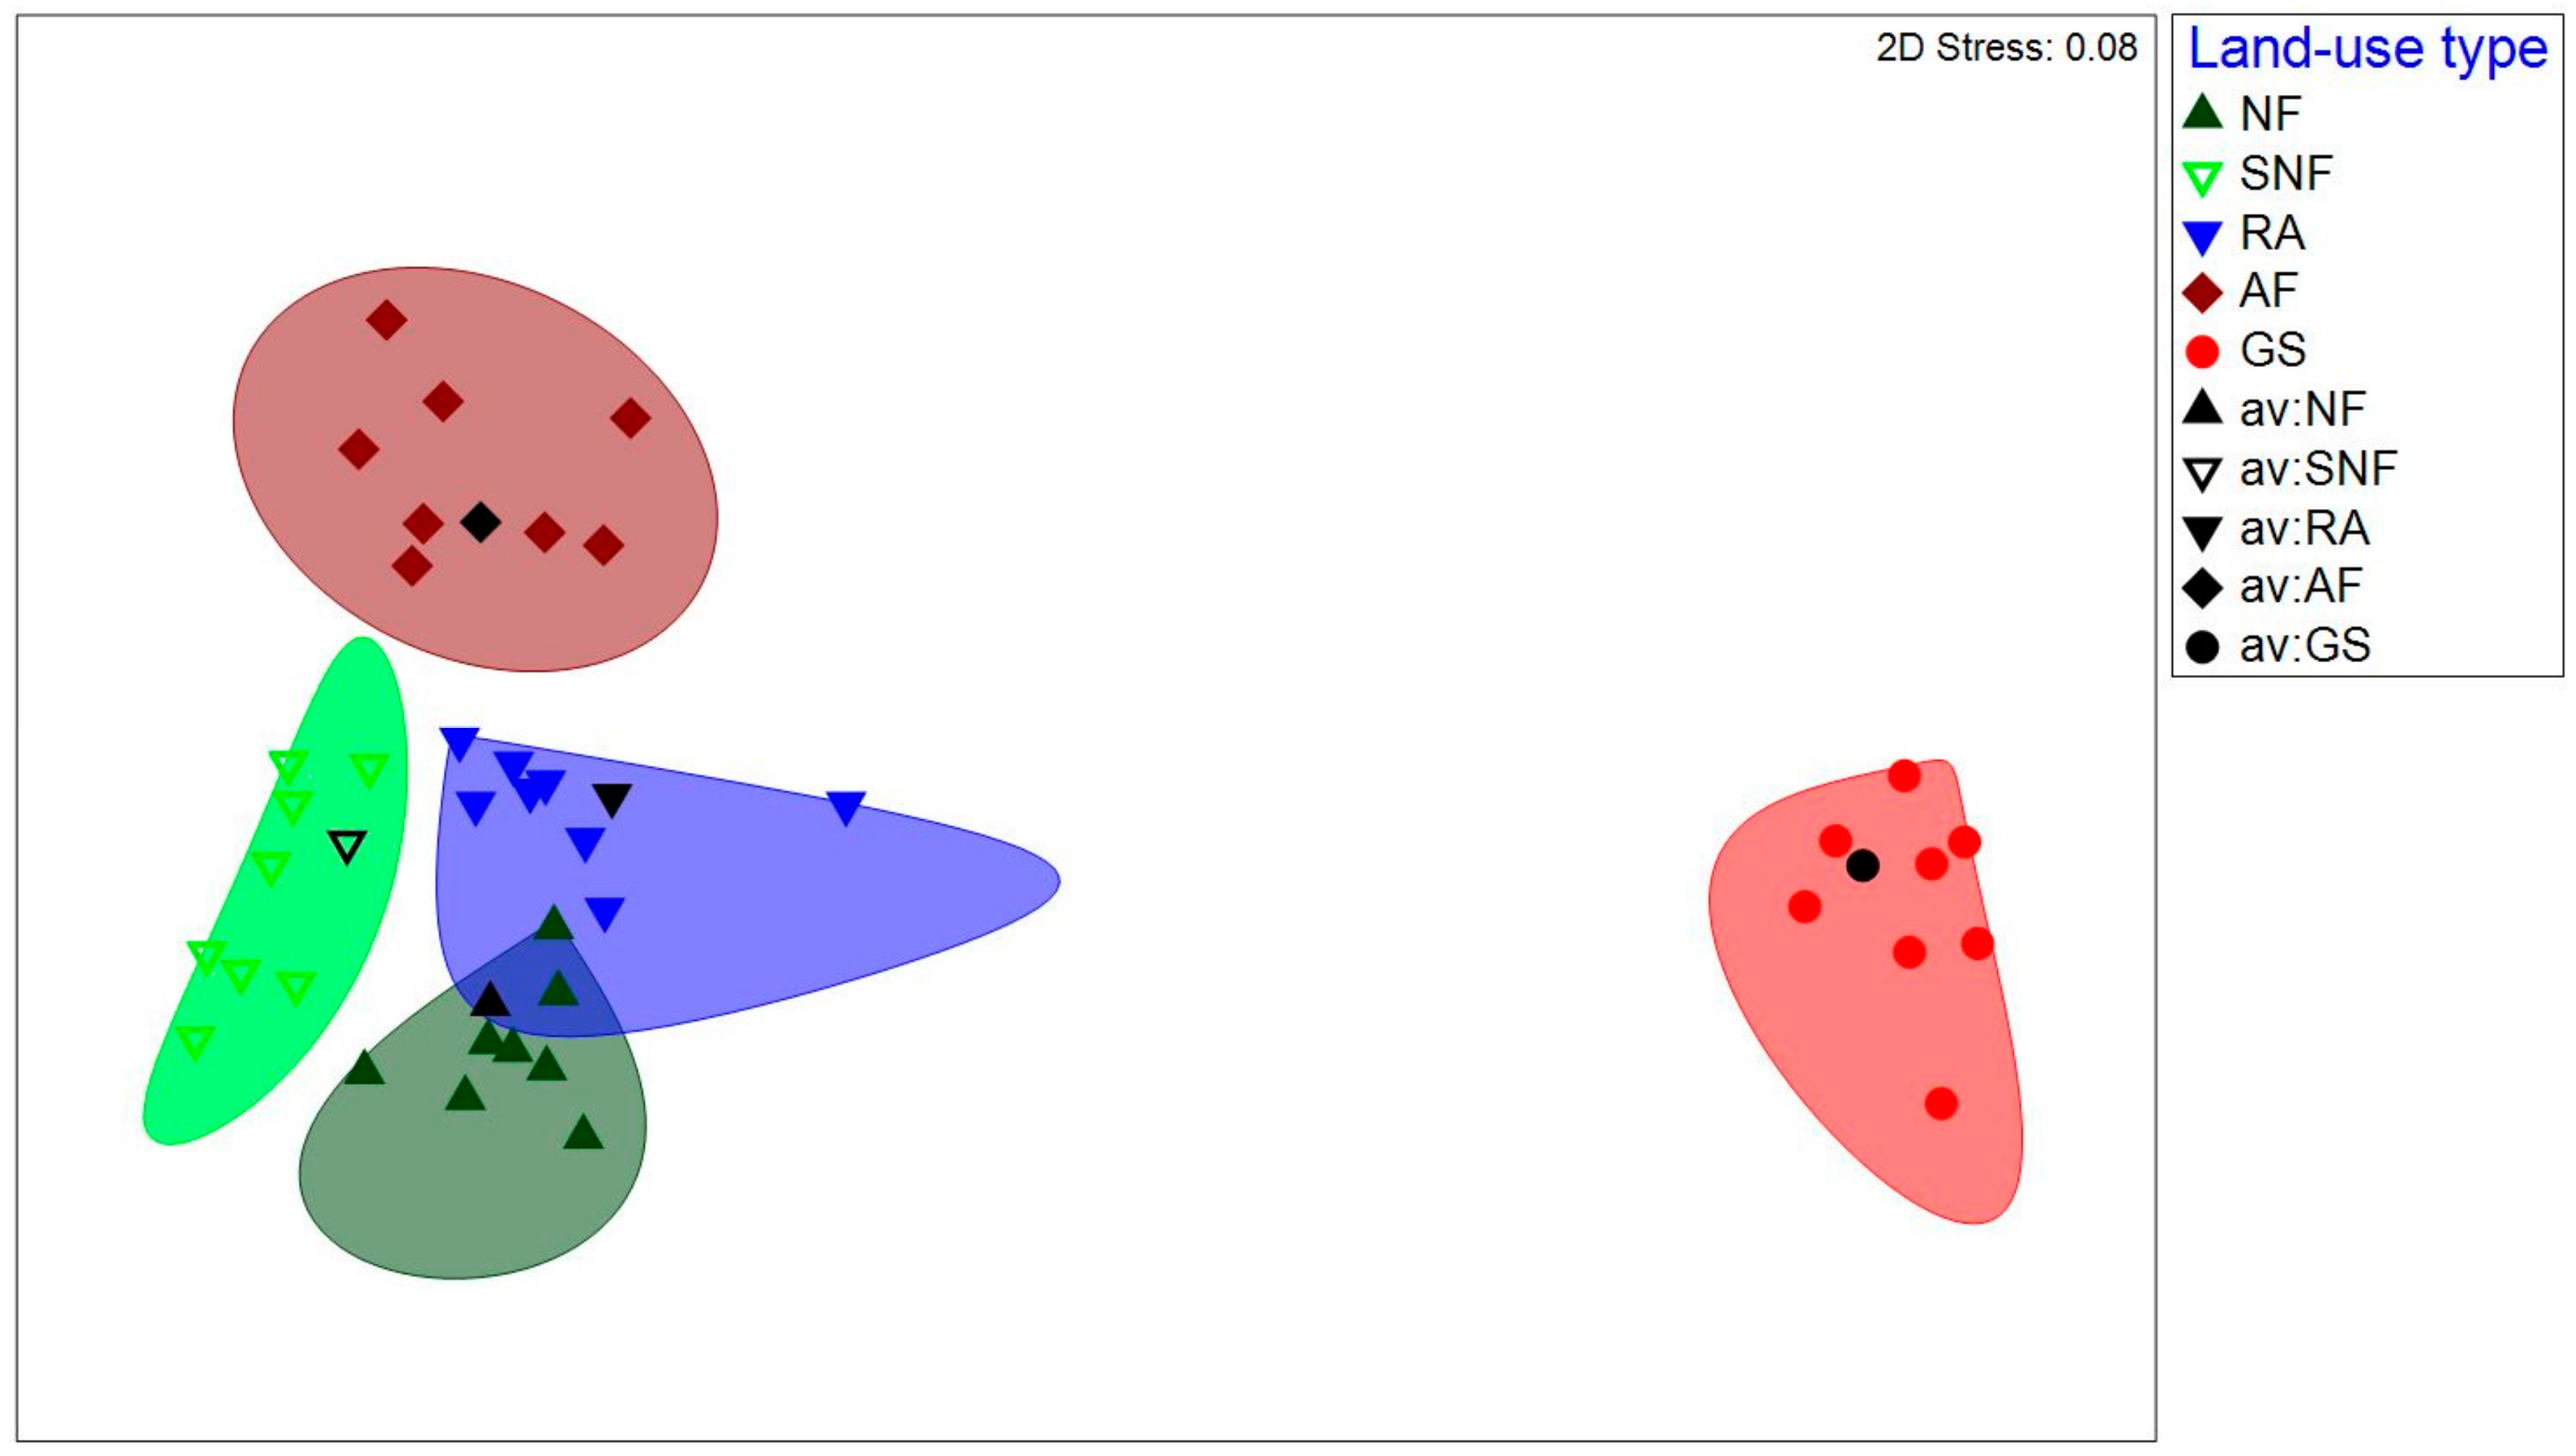
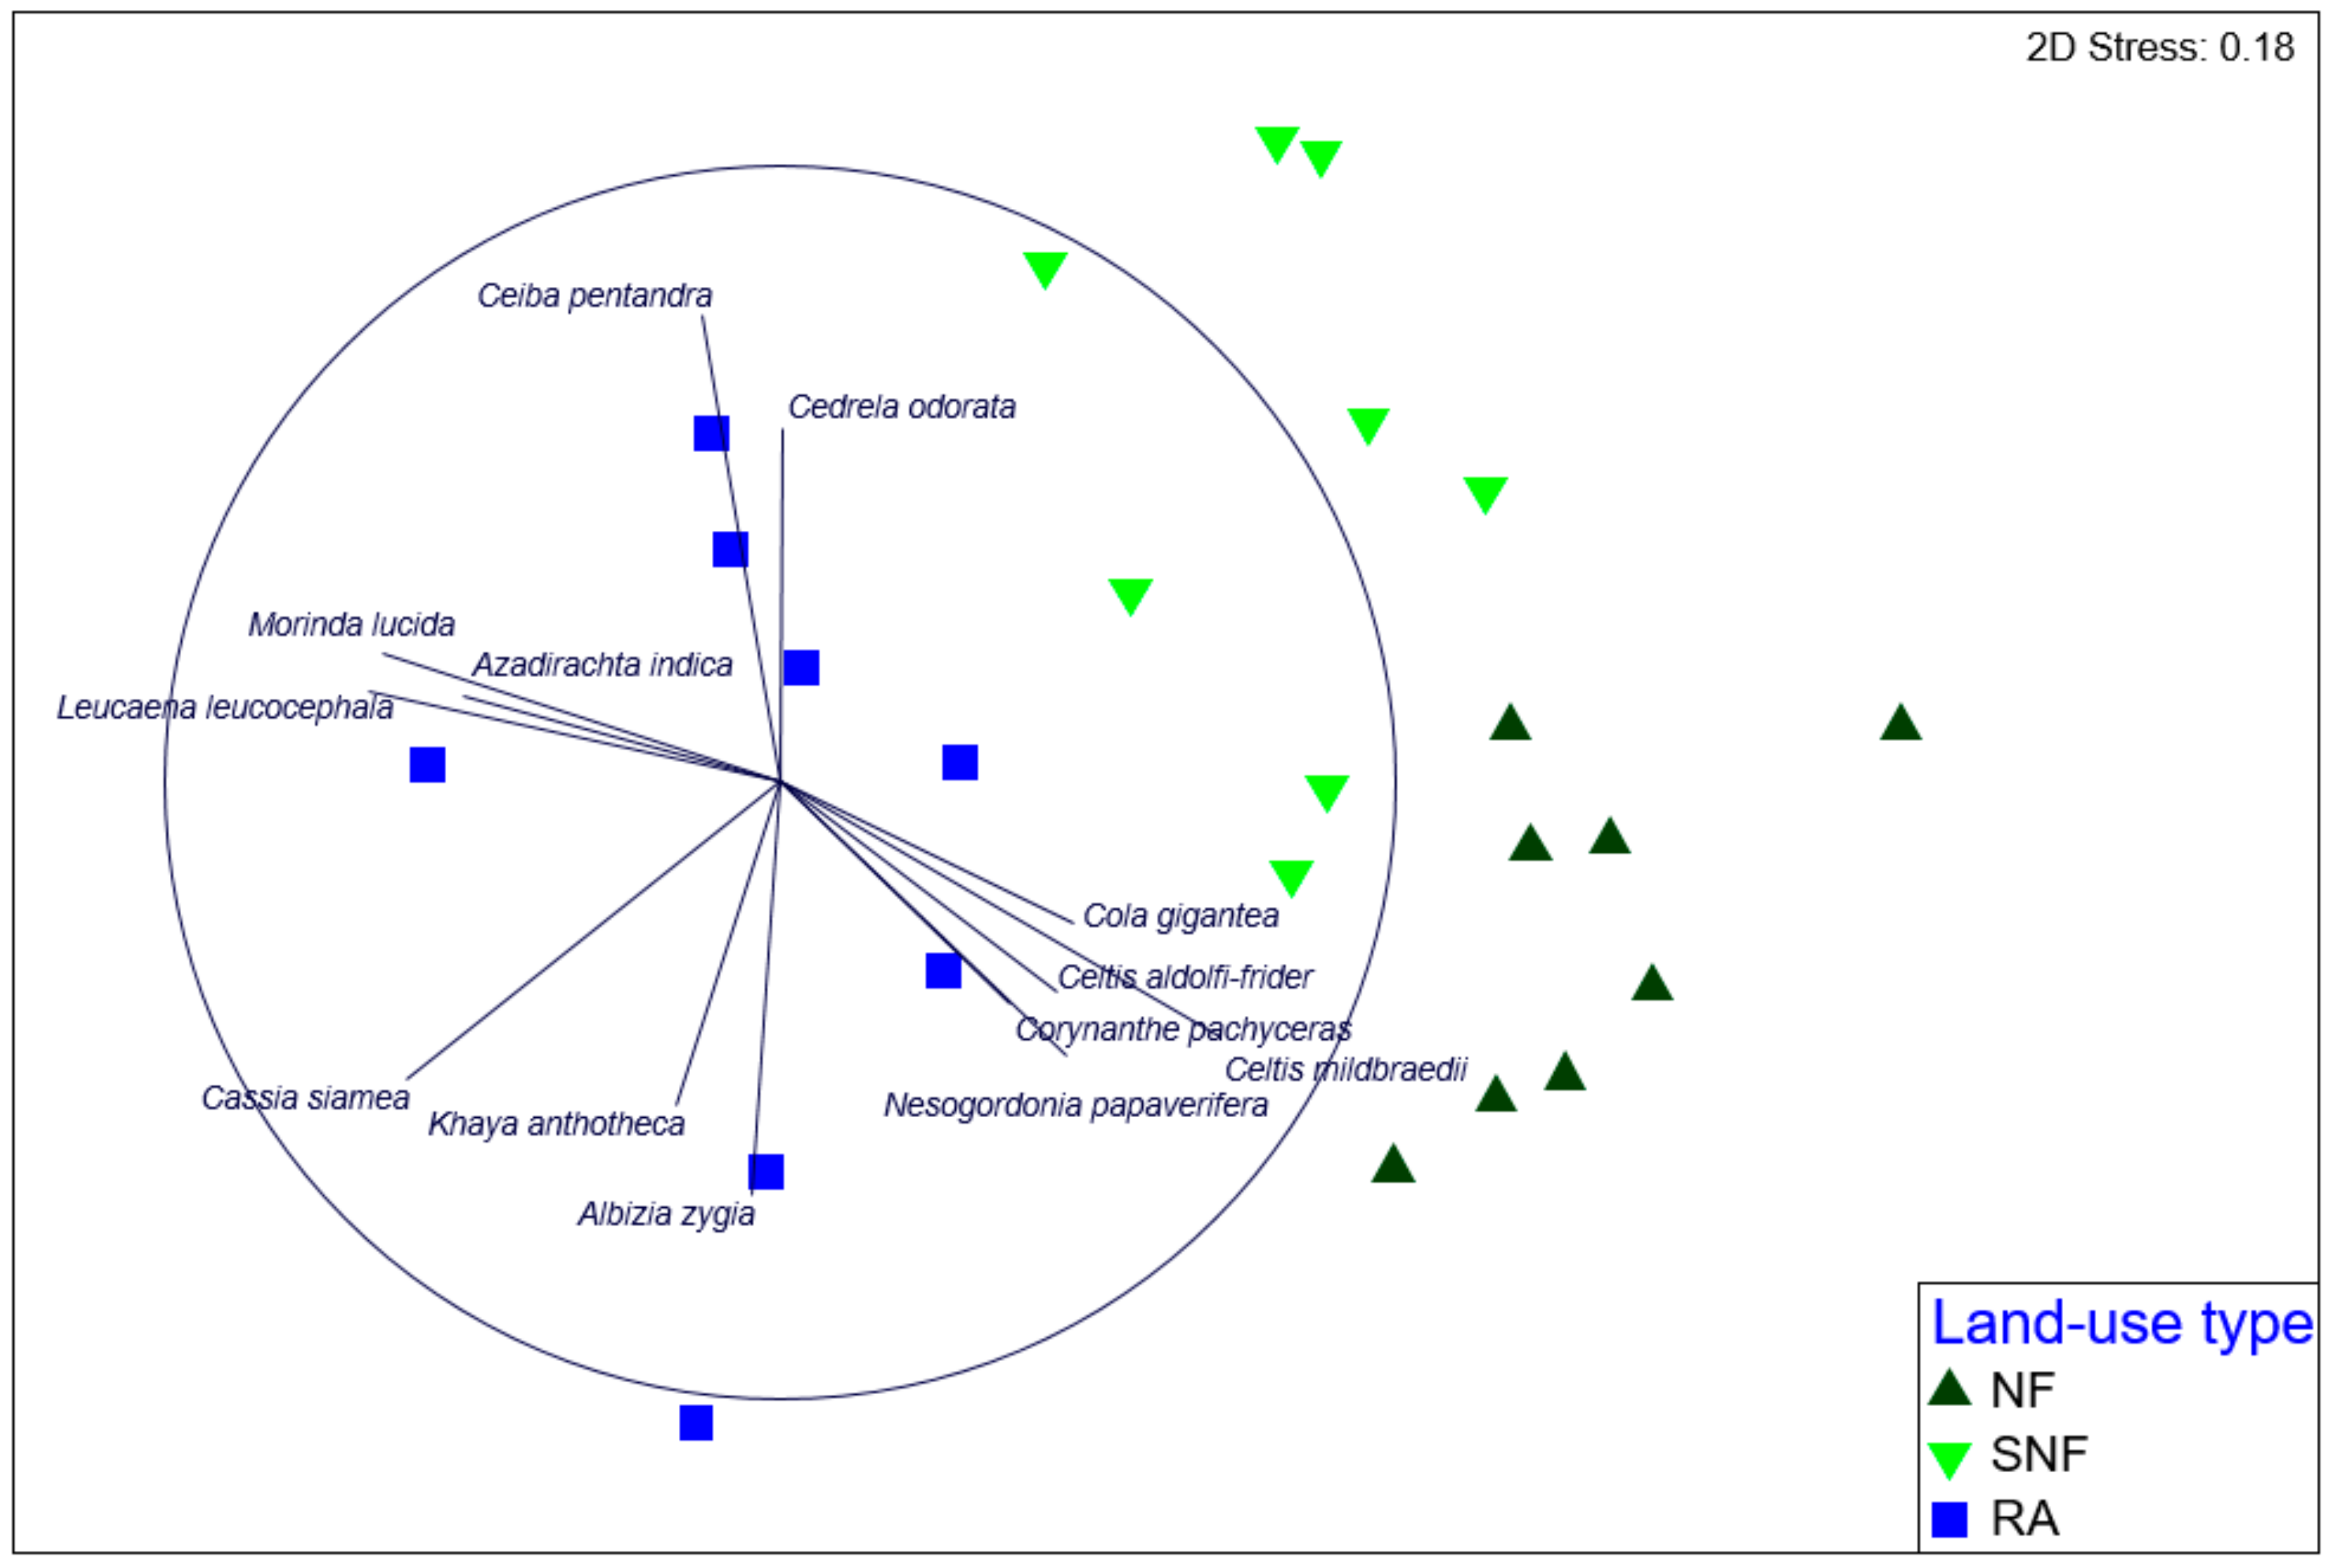
3.2. Species Composition and Abundance

n-MDS ordination revealed three distinct clusters when species composition among the three land-use types was compared with stress = 0.18 (Figure 3). Simper analysis confirmed mostly exotic tree species (Leucaena leucocephala, Cassia siamea) to be associated with RA, contributing about 30 % of the average similarity within the RA. Species composition for the SNF consisted of both indigenous and exotic tree species (Ceiba pentandra, Cedrela odorata) while the NF was made up of only indigenous species.

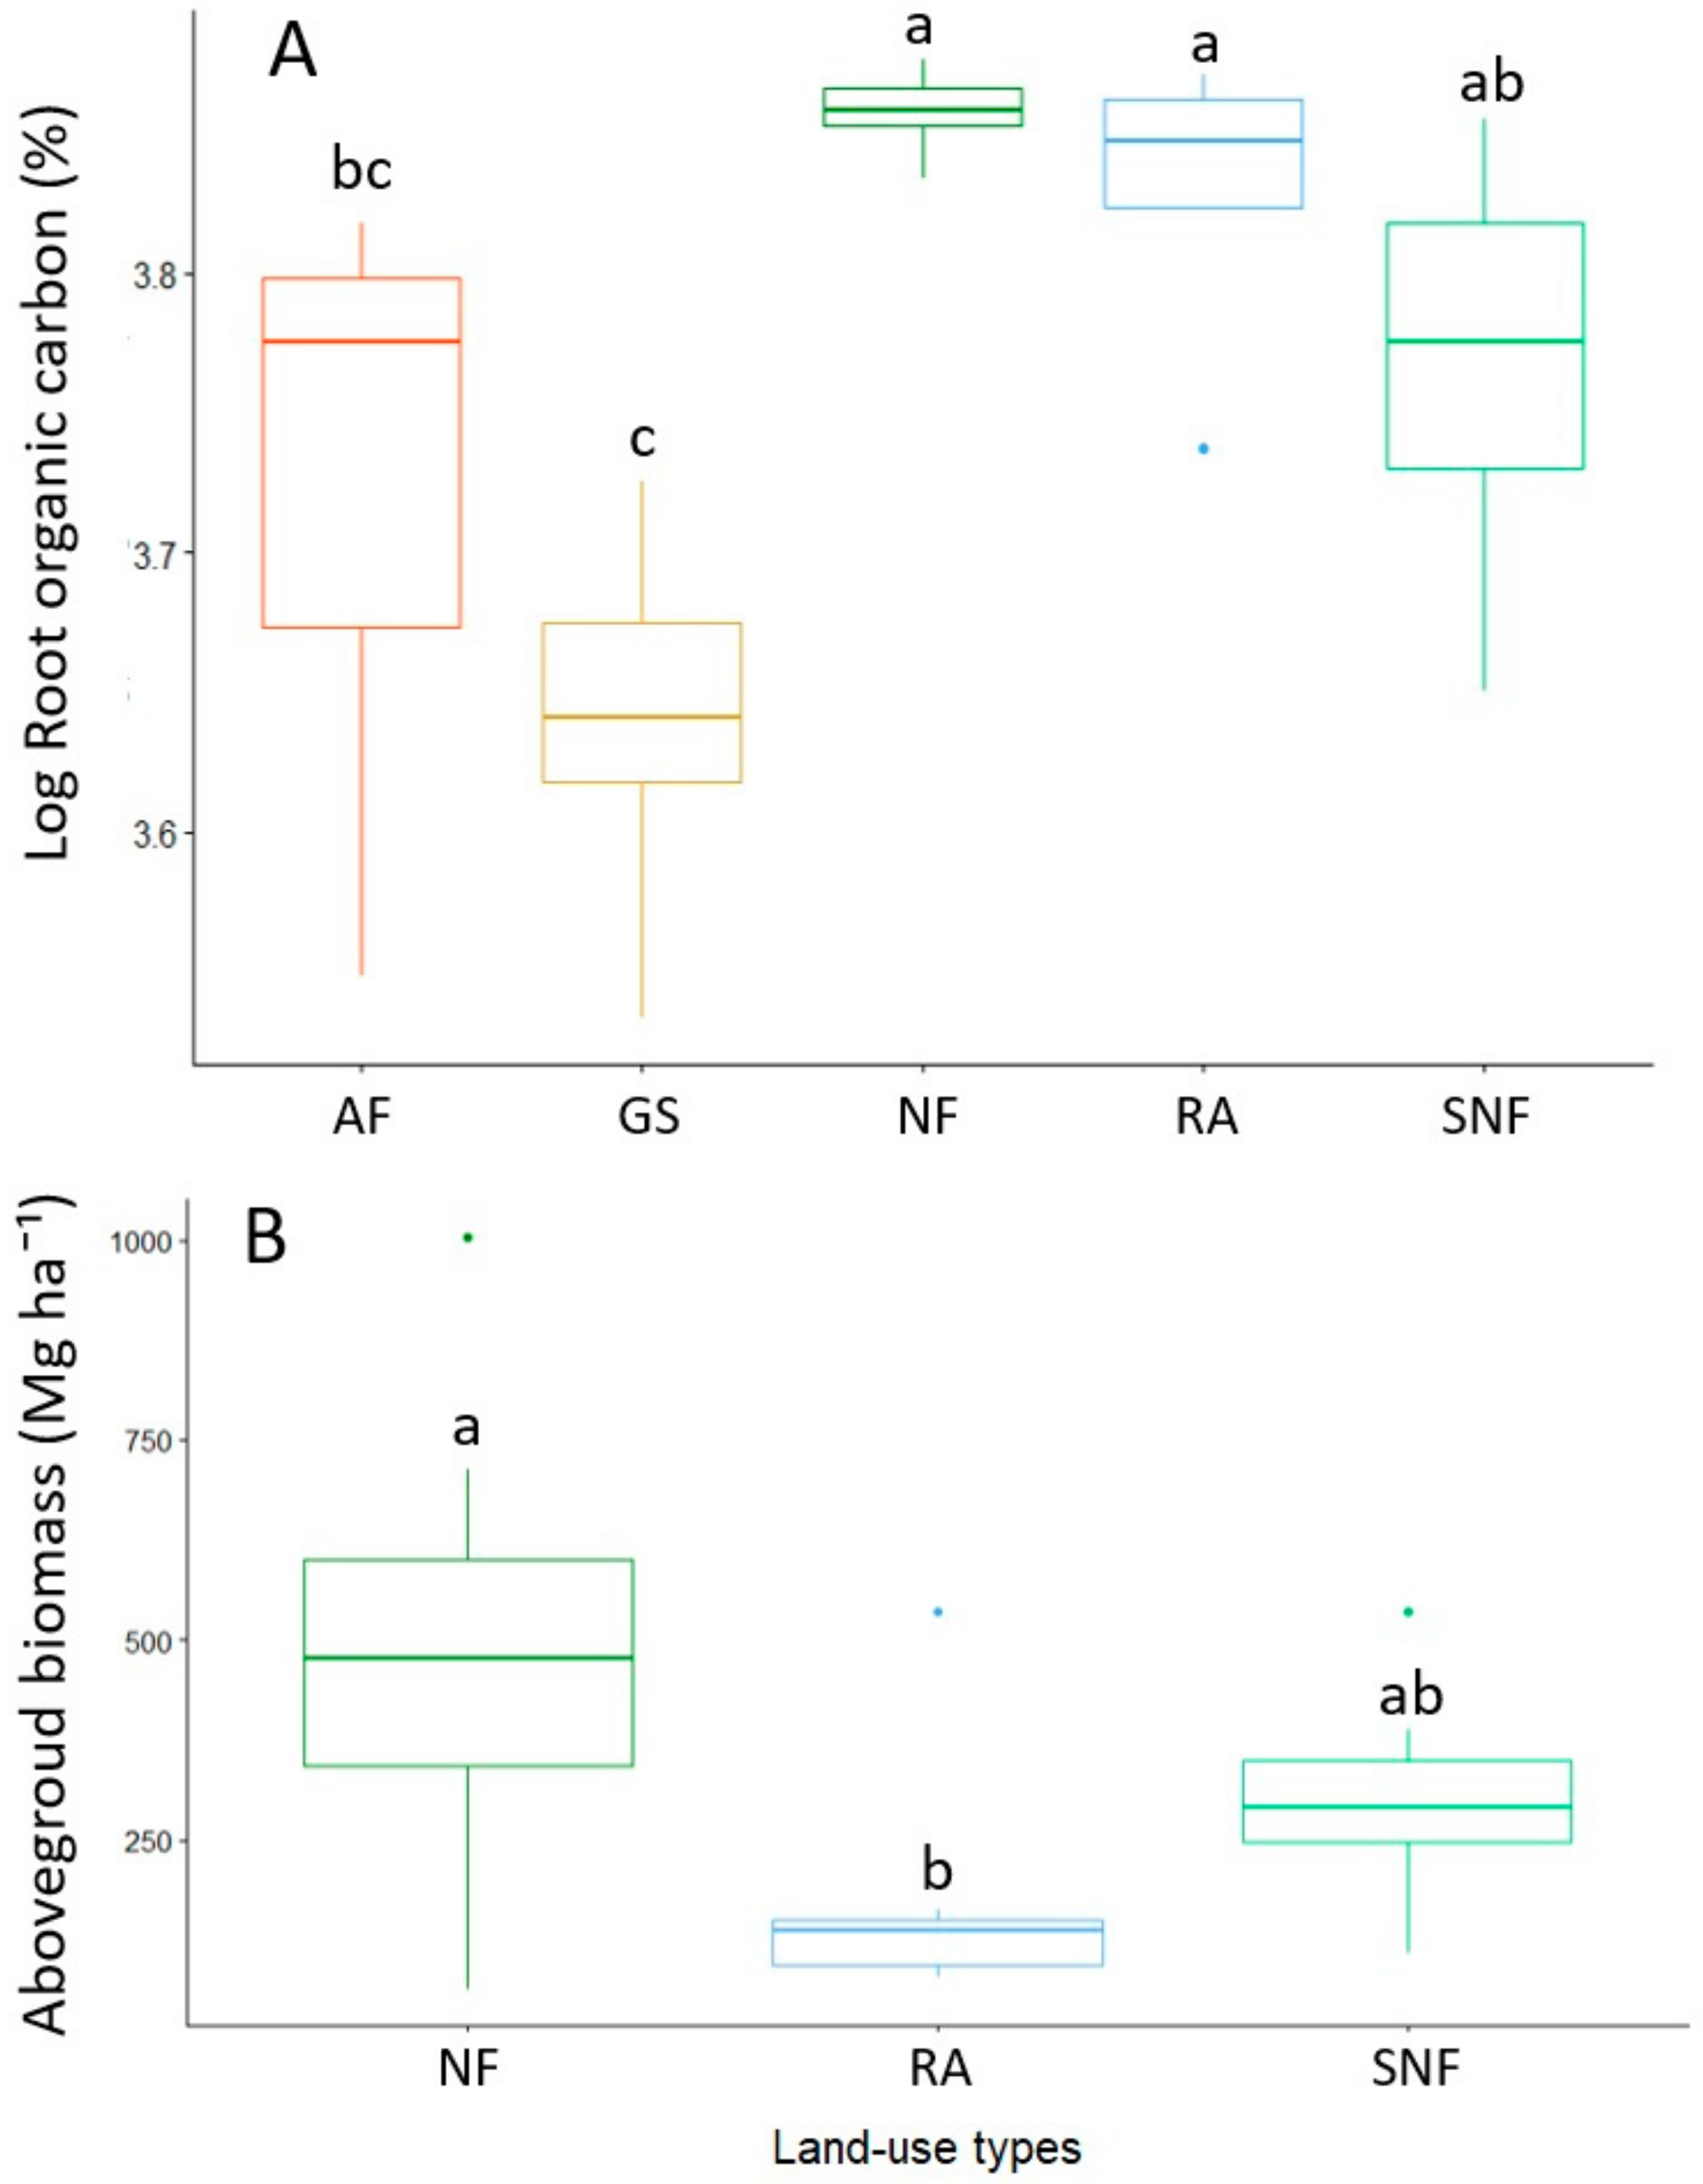
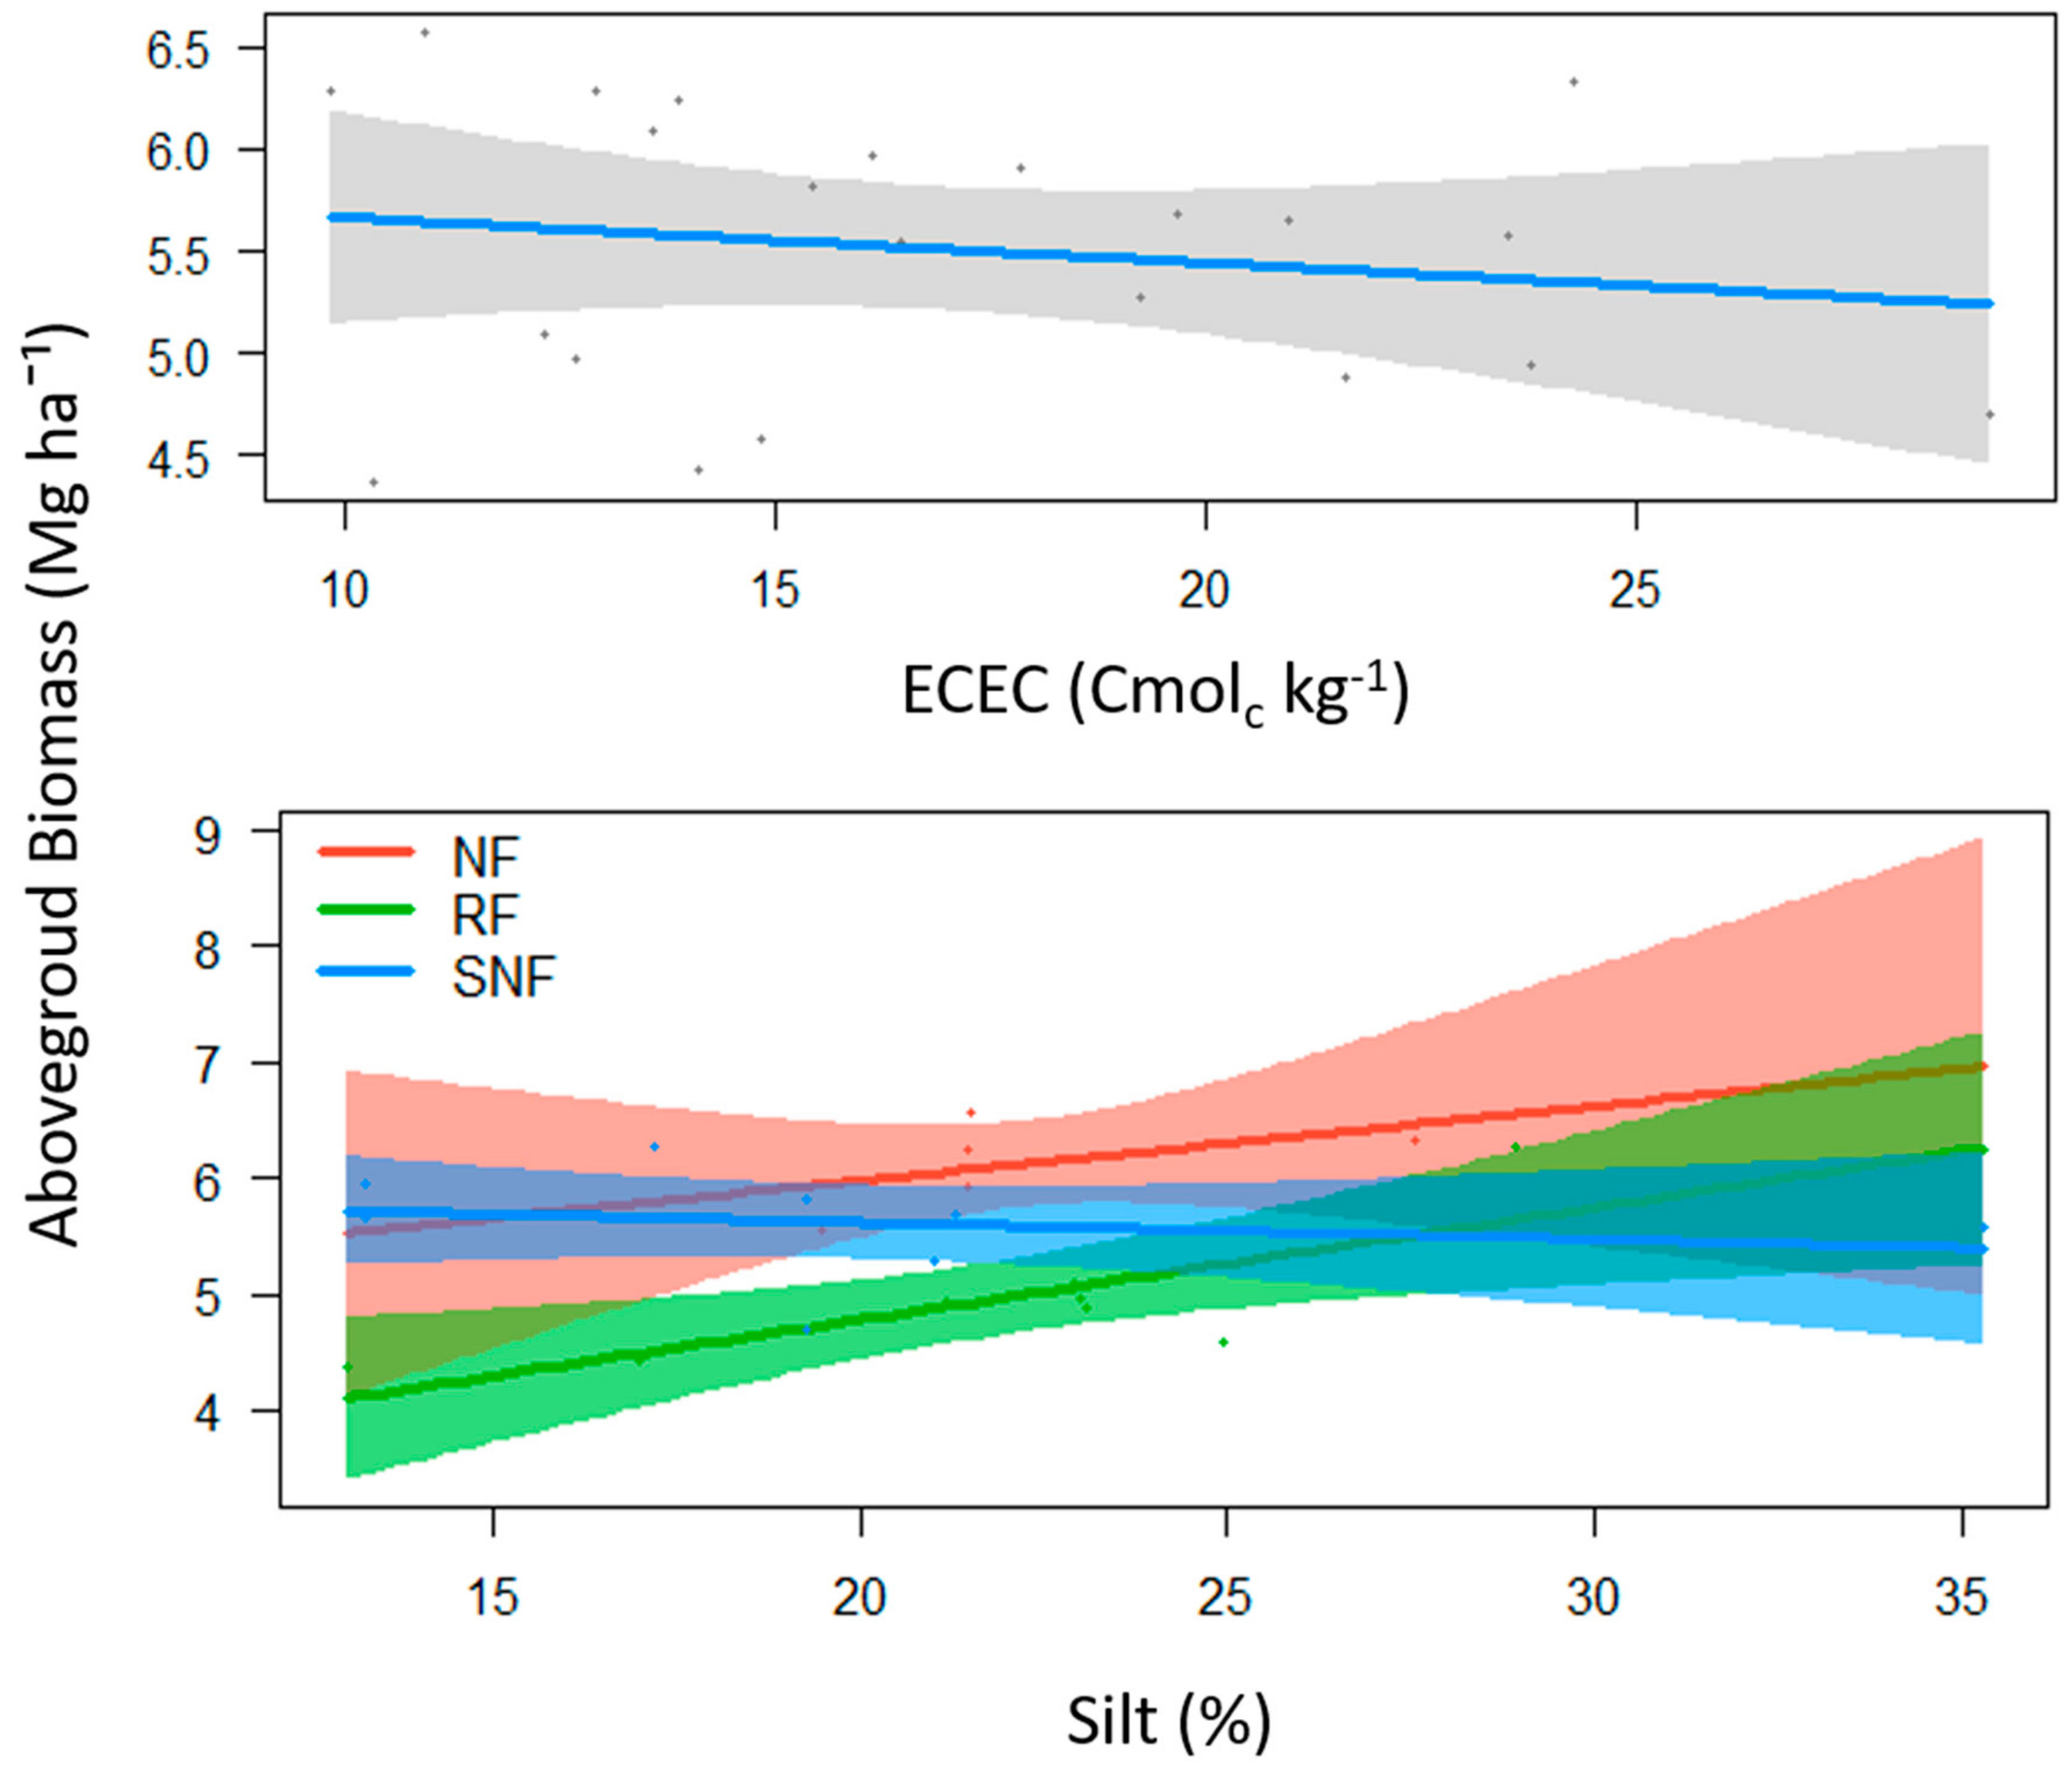
3.3. Root Organic Carbon, Above-Ground Biomass, and Its Relationship to Soil Variables

The results of the GLMMs showed that an increase in organic root carbon was positively related to an increase in soil potassium and soil organic carbon and negatively related to bulk density (Figure 4).
The marginal R2 of the model was 26 %, while the strong effect is related to the differences among sites (R2 conditional = 62 %). Root organic carbon was highest in the NF (47 %), followed by the RA (46 %), the SNF (43 %), the GS (38 %), and AF (38 %) (post-hoc Tukey´s test; Figure 5A). The best model for the variation in AGB fits with silt and ECEC (R2 =83 %). However, the highest proportion of the variance of this model was due to the effect of the block (the differences among sites explained 50 % of the total variation). Thus, NF showed significantly higher values of AGB than RA (post-hoc Tukey´s test; Figure 5B).
ECEC played a secondary role, being negatively related to AGB, while AGB was positively related to the increase of silt on RA and NF (Figure 6A,B).

4. Discussion

4.1. Influence of Restoration Interventions on Soil Attributes

Understanding the successful strategies on soil reclamation is an essential goal of restoration ecology [55,56]. Our results from the study area support our initial hypothesis that soil attributes have been improved over time compared to pre-disturbance and post-disturbance states. Soil properties in the restored area differed significantly from these states but were not significantly different from natural forest 20 years after initiation of restoration (except for bulk density and base saturation). The restoration of post-mining sites by the establishment of permanent tree cover is a useful practice for remediation [57]. However, one of the main challenges at the initial stages is the development of favorable conditions for plant growth in mining areas because of their highly disturbed character with high toxicity, compaction, and reduction of nutrients [58]. Therefore, the success of the restoration of mined areas depends on revegetation practices, especially during initial stages that are crucial for survival [57,59]. Two factors potentially contributed to the successful establishment of the vegetation in our study area: first, the management decision to initially use fast-growing exotic species that can tolerate the harsh initial environmental constraints [8] and have an ability to fix atmospheric nitrogen. For example, Leucaena leucocephala, which was very dominant in the restored area, has been discussed extensively in the literature for its role in nitrogen fixation (e.g., [60,61]). Cassia siamea with its extensive root distribution also played a major role in erosion control and soil stabilization of the restored area [62]. Second, seedlings of the planted tree species were potted using fresh topsoil.
The topsoil used for the potted seedlings seems to serve as suitable soil nuclei in providing the necessary nutrients and proper retention of these nutrients (high CEC and base saturation) for the young growing trees. This approach further ensured the emergence of other plant species from seeds stored in the topsoil [22]. Fresh topsoil has previously proven essential for successful vegetation establishment because of the provision of vital resources for plant growth, especially nutrients (N) and SOC [22,63]. Moreover, dispersed seeds from the nearby surrounding areas reaching these soil nuclei support effective vegetation establishment at the site. This is evident by the many plant species currently found at the restored area, as compared to the lack of these species in the nearby abandoned and unrestored gravel mine site. The restored area shows a significant improvement in soil pH with similar values for the reference forest sites, while the unrestored gravel site was strongly acidic with low nutrient concentration, which might explain its poor vegetation establishment. Soil pH is one the most important indicators for estimating soil health in former mine soils, as a result of its influence on nutrient cycling and soil properties [64]. For instance, soil pH is primarily ascribed to the substantial increase in the basic cations (Na, K, Mg, and Ca), together with the corresponding reduction of exchangeable acidity (H and Al) [40,65]. Therefore, the significantly higher concentrations of SOC and total N at the restored area compared with the abandoned gravel mine site could be ascribed to the restoration interventions that led to improved vegetation growth and development, which directly influenced SOC and N contents [40].
It is worth noting that previous studies have observed successful soil restoration of degraded mine sites after several decades [55,64,66]. Our results add to these studies by demonstrating that successful soil restoration could be obtained within two decades, at least in some tropical environments [56]. These results suggest that there is no universal global period for soil restoration, with significant differences depending on the specific context of each ecosystem, such as climatic conditions, surrounding vegetation, the origin of the disturbance, and the restoration approach [22,56,57,67]. Focusing on soil restoration, our results enable us to support afforestation after soil amendments as a critical catalyst for restoring soil properties after mining.

4.2. Carbon Sequestration and Biomass Reclaim

Forest functions as a terrestrial net sink in the global carbon cycle [68,69]. Our findings offer an insight into the potential impacts of restoration practices that aim at increasing plant biomass on C sequestration and the role of soil properties. Specifically, we show that middle-to-long term restoration practices increased biomass storage, but different patterns were observed for both the above- and below-ground components. We further show that active restoration practices (human intervention, initially planting trees in pots with topsoil) as opposed to passive restoration (unassisted recovery, sensu [70]) provide a more promising restoration approach after severe disturbance by surface mining. Although the restored forest area had a lower above-ground biomass compared to the natural and semi-natural forests, similar root organic carbon concentration was recorded across the three forest sites. The lower above-ground biomass stock recorded in the restored area can be attributed to the higher number of trees with larger diameter in the natural forest [71,72,73]. Usually, mature forests are characterized by old trees with higher diameter; trees in younger stands on the contrary have smaller diameters in restored forest [74]. The lower above-ground biomass in the semi-natural forest in comparison to the natural could be attributed mainly to anthropogenic disturbance such as logging and man-made wildfires in the area [28,29]. This highlights the impact that anthropogenic activity has on the functioning and service provision of forest ecosystems in the tropics. Root development and above-ground biomass are often positively related [75,76]. The restored area shows similar root organic carbon concentration to the natural forest (in contrast to above-ground biomass), which suggests a faster recovery of below-ground than above-ground biomass. Roots constitute about 30% of the below-ground biomass with the highest production and turnover rates [77,78]. Studying the relationship between fine root biomass and vegetation recovery therefore seems crucial to better understanding long term carbon dynamics and storage patterns [77].
Relationships between above or below-ground biomass and soil properties have been previously addressed [79,80,81]. The lack of significant relationships between biomass and soil properties in this study may stem from threshold effects that could create nonlinearities between variables [82]. Although specific mechanisms are not evident from our study, the results suggest that biomass variability may be related to some soil parameters. The best model selected silt and ECEC as predictors of above-ground biomass across the three forest sites. Organic root carbon was related to soil organic carbon, bulk density, and soil potassium concentration. The relative proportions of sand, silt, and clay play a vital role for vegetation establishment in restored ecosystems, mainly due to their effects on moisture and nutrient retention as well as bulk density. Silt reduces the number of both macrospores and microspores in sand and clay by creating more mesospores that contain available water at field capacity, which is used by plants for various physiochemical activities [40]. Consistent with our results, other studies also suggest that there is generally a decrease of exchangeable cations with the increase in clay on acid soils [83,84].
Concerning the organic root carbon, our results show positive feedback between root organic carbon and soil organic carbon. Most organic carbon in soils, such as organic and phenolic acids, are primarily plant-derived, being strongly determined by litter decomposition and root exudates [85]. Moreover, the improvement of the root system in restored areas has positive effects on nutrient cycling and C sequestration by promoting symbiotic association (i.e., mycorrhizas and N-fixing nodules), which together stimulates C sequestration by increasing the amount of C and nitrogen (N) entering soils [68,86]. Bulk density also accounts for the variations in root organic carbon among sites. Soil compaction strongly promotes water limitations and is known to drive seedling establishment in trees [87], potentially constraining plant root systems in mine soils [66]. The high bulk density in GS plots was due to the use of heavy machinery for mining, which caused soil compaction. Potassium is one of the essential elements for plants [88] and the positive relationship to below-ground biomass in this study is not surprising.

5. Conclusions

This study provides insights into the development of soil attributes and below- and above-ground biomass almost two decades after active forest restoration. Potted seedlings in fresh topsoil can serve as suitable soil nuclei in creating an optimal microclimate that overcomes potential limiting soil conditions at severely degraded mine sites. Our results suggest that major steps towards successful restoration can be accomplished within a relatively short period, without the wholesale application of topsoil. Improved soil conditions cause the development of extensive vegetation cover, which then influences carbon sequestration by both above- and below-ground biomass increases. By assessing restoration status compared to surrounding land-use types, we showed that the use of reference systems provides critical information to judge the success of restoration approaches. Our findings improve the understanding of how an active restoration practice can mitigate the constraints inhibiting the recovery of former mining sites compared to pre- and post-disturbance, as well as natural reference states. However, communities with higher plant biomass will push themselves, in a positive plant–soil feedback loop, to an overall more fertile environment. This makes it challenging to infer the specific role of individual soil properties on the development of vegetation cover. Future monitoring of restoration trajectories in the study area should therefore focus on individual processes and mechanisms to which our study provides first insights.

Author Contributions

Conceptualization, F.G.D. and K.B. Data curation, F.G.D. Formal analysis, P.K.N. and E.G.d.l.R. Investigation, F.G.D. Methodology, F.G.D. and P.K.N. Project administration, F.G.D. and K.B. Resources, K.B. Software, E.G.d.l.R. Visualization, F.G.D. and E.G.d.l.R. Writing—original draft, F.G.D. Writing—review and editing, K.B and E.G.d.l.R. Supervision, KB and E.G.d.l.R. All authors have read and agreed to the published version of the manuscript.

Funding

FGD received much appreciated financial support from the Catholic Academic Exchange Service (KAAD). Open Access publication was supported by the Volkswagen Foundation (Az: 94646).

Acknowledgments

We are grateful to Newmont Gold Ghana Limited and Forest Service Division of Ghana for making the study sites available. We declare that no financial support was received from Newmont Gold Ghana Limited. We thank two anonymous referees and the editor for their comments on a previous version. Special thanks to PD Dr. Udo Bröring, Prof Dr. Manfred Wanner, and the entire staff at the Department of Ecology—Brandenburg University of Technology, Cottbus-Senftenberg for their support. We are also grateful to Daniel Debrah, Raymond Ayepah, Solomon Ankamah Danso, Pascal Agoro Prince, Napoleon Mensah, Kingsley Osei Bonsu, Gloria Djabletey (Ph.D.), and Collins Ayine Nsor (Ph.D.) for their assistance.

Conflicts of Interest

The authors declare no conflict of interest

References

  1. Pellikka, P.K.E.; Heikinheimo, V.; Hietanen, J.; Schäfer, E.; Siljander, M.; Heiskanen, J. Impact of land cover change on aboveground carbon stocks in Afromontane landscape in Kenya. Appl. Geogr. 2018, 94, 178–189. [Google Scholar] [CrossRef]
  2. Giam, X. Global biodiversity loss from tropical deforestation. Proc. Natl. Acad. Sci. USA 2017, 114, 5775–5777. [Google Scholar] [CrossRef] [Green Version]
  3. Guo, X.; Meng, M.; Zhang, J.; Chen, H.Y.H. Vegetation change impacts on soil organic carbon chemical composition in subtropical forests. Sci. Rep. 2016, 6, 29607. [Google Scholar] [CrossRef] [PubMed]
  4. Society for Ecological Restoration International Science & Policy Working Group. The SER International Primer on Ecological Restoration; Society for Ecological Restoration International: Washington, DC, USA, 2004. [Google Scholar]
  5. Bullock, J.M.; Aronson, J.; Newton, A.C.; Pywell, R.; Benayas, J.M.R. Restoration of ecosystem services and biodiversity: conflicts and opportunities. Trends Ecol. Evol. 2011, 26, 541–549. [Google Scholar] [CrossRef] [PubMed]
  6. Nilsson, C.; Aradottir, A.L.; Hagen, D.; Halld; Mitchell, R.J.; Raulund-Rasmussen, K.; Svavarsdóttir, K.; Tolvanen, A.; Wilson, S.D. Evaluating the process of ecological restoration. Ecol. Soc. 2016, 21. [Google Scholar] [CrossRef] [Green Version]
  7. IUCN, WRI. A Guide to the Restoration Opportunities Assessment Methodology (ROAM): Assessing Forest Landscape Restoration Opportunities at the National or Sub-National Level; Working Paper (Road-Test Edition); IUCN: Gland, Switzerland, 2014. [Google Scholar]
  8. De la Riva, E.G.; Jimenez, M.D.; Mola, I.; Balaguer, L.; Costa-Tenorio, M.; Casado, M.A. Rates of local colonization and extinction reveal different plant community assembly mechanisms on road verges in central Spain. J. Veg. Sci. 2011, 22, 292–302. [Google Scholar] [CrossRef]
  9. Maestre, F.T.; Cortina, J.; Vallejo, V.R. Are Ecosystem Composition, Structure, and Functional Status Related to Restoration Success? A Test from Semiarid Mediterranean Steppes. Restor. Ecol. 2006, 14, 258–266. [Google Scholar] [CrossRef]
  10. Magro, S.; López, M.G.; Casado, M.A.; Jiménez, M.D.; Trigo, D.; Mola, I.; Balaguer, L. Soil functionality at the roadside: Zooming in on a microarthropod community in an anthropogenic soil. Ecol. Eng. 2013, 60, 81–87. [Google Scholar] [CrossRef]
  11. Jimenez, M.D.; Mola, I.; Casado, M.A.; Balaguer, L.; Ruiz-Capillas, P.; Corona, M.E.P. SOIL Development at the Roadside: A Case Study of a Novel Ecosystem. Land Degrad. Dev. 2011, 24, 564–574. [Google Scholar] [CrossRef]
  12. Harris, J. Soil Microbial Communities and Restoration Ecology: Facilitators or Followers? Science 2009, 325, 573–574. [Google Scholar] [CrossRef]
  13. Muñoz-Rojas, M. Soil quality indicators: Critical tools in ecosystem restoration. Curr. Opin. Environ. Sci. Heal. 2018, 5, 47–52. [Google Scholar] [CrossRef]
  14. Greiner, L.; Keller, A.; Grêt-Regamey, A.; Papritz, A. Soil function assessment: review of methods for quantifying the contributions of soils to ecosystem services. Land Use Policy 2017, 69, 224–237. [Google Scholar] [CrossRef]
  15. Maharjan, M. Effect of Land Use on Soil Fertility and Carbon Sequestration; Georg-August University of Göttingen: Göttingen, Germany, 2018. [Google Scholar]
  16. Laban, P.; Metternicht, G.; Davies, J. Soil Biodiversity and Soil Organic Carbon: Keeping Drylands Alive, 1st ed.; IUCN—International Union for Conservation of Nature: Gland, Switzerland, 2008; Available online: https://portals.iucn.org/library/node/47735 (accessed on 10 October 2019).
  17. Qiu, K.; Xie, Y.; Xu, N.; Pott, R. Ecosystem functions including soil organic carbon, total nitrogen and available potassium are crucial for vegetation recovery. Sci. Rep. 2018, 8, 7607. [Google Scholar] [CrossRef] [PubMed]
  18. Mendes, M.S.; Latawiec, A.E.; Sansevero, J.B.B.; Crouzeilles, R.; Moraes, L.F.D.; Castro, A.; Alves-Pinto, H.N.; Brancalion, P.H.S.; Rodrigues, R.R.; Chazdon, R.L.; et al. Look down-there is a gap-the need to include soil data in Atlantic Forest restoration. Restor. Ecol. 2018, 27, 361–370. [Google Scholar] [CrossRef]
  19. Peng, X.; Horn, R.; Hallet, P. Soil structure and its functions in ecosystems: Phase matter & scale matter. Soil Tillage Res. 2015, 146, 1–3. [Google Scholar] [CrossRef]
  20. Shimamoto, C.Y.; Padial, A.A.; Da Rosa, C.M.; Marques, M.C.M. Restoration of ecosystem services in tropical forests: A global meta-analysis. PLoS ONE 2018, 13, e0208523. [Google Scholar] [CrossRef]
  21. Lal, R. Restoring Soil Quality to Mitigate Soil Degradation. Sustainability 2015, 7, 5875–5895. [Google Scholar] [CrossRef] [Green Version]
  22. Nsiah, P.K.; Schaaf, W. The potentials of biological geotextiles in erosion and sediment control during gold mine reclamation in Ghana. J. Soils Sediments 2018, 19, 1995–2006. [Google Scholar] [CrossRef]
  23. Gould, I.J.; Quinton, J.N.; Weigelt, A.; De Deyn, G.B.; Bardgett, R.D. Plant diversity and root traits benefit physical properties key to soil function in grasslands. Ecol. Lett. 2016, 19, 1140–1149. [Google Scholar] [CrossRef]
  24. Omoro, L.M.A.; Laiho, R.; Starr, M.; Pellikka, P.K. Relationships between native tree species and soil properties in the indigenous forest fragments of the Eastern Arc Mountains of the Taita Hills, Kenya. For. Stud. China 2011, 13, 198–210. [Google Scholar] [CrossRef]
  25. De la Riva, E.G.; Prieto, I.; Villar, R. The leaf economic spectrum drives leaf litter decomposition in Mediterranean forests. Plant Soil 2018, 435, 353–366. [Google Scholar] [CrossRef]
  26. FAO. Global Forest Resources Assessment; Main Report: FAO Forestry Paper 163; FAO: Rome, Italy, 2010. [Google Scholar]
  27. Acheampong, E.O.; MacGregor, C.J.; Sloan, S.; Sayer, J. Deforestation is driven by agricultural expansion in Ghana’s forest reserves. Sci. Afr. 2019, 5. [Google Scholar] [CrossRef]
  28. Nindel, S. Forest Fire Dynamics and Carbon Stocks in Different Ecological Zones of Ghana; Technische Universität Dresden: Dresden, Germany, 2017. [Google Scholar]
  29. Addai, G.; Baidoo, P. The effects of forest destruction on the abundance, species richness and diversity of butterflies in the Bosomkese Forest Reserve, Brong Ahafo Region, Ghana. J. Appl. Biosci. 2013, 64, 4763. [Google Scholar] [CrossRef] [Green Version]
  30. Cash, R.N. A Reference for Restoration: Applying the Reference Site Model to Riparian Restoration Sites in the California Coastal Sage Scrub, Chaparral, and Oak Woodlands Ecoregion; Riparian Restoration: San Dimas, CA, USA, 2013. [Google Scholar]
  31. Ahirwal, J.; Maiti, S.K. Assessment of carbon sequestration potential of revegetated coal mine overburden dumps: A chronosequence study from dry tropical climate. J. Environ. Manag. 2017, 201, 369–377. [Google Scholar] [CrossRef] [PubMed]
  32. NGGL Newmont Ghana Gold Limited. Reclamation and Closure Plan Ahafo South Project; Newmont Mining Corporation: Denver, CO, USA, 2015; p. 77. [Google Scholar]
  33. Hawthorne, W.D.; Gyakari, N. Photo Guide for Forest Tree of Ghana. A Tree Spotters Guide for Identification of Large Trees; Oxford Forestry Institute: Oxford, UK, 2006. [Google Scholar]
  34. Larjavaara, M.; Muller-Landau, H.C. Measuring tree height: a quantitative comparison of two common field methods in a moist tropical forest. Methods Ecol. Evol. 2013, 4, 793–801. [Google Scholar] [CrossRef]
  35. Zanne, A.M.; Lopez-Gonzalez, G.; Coomes, D.A.; Ilic, J.; Jansen, S.; Lewis, S.L. Global Wood Density Database; Dryad: Oakland, CA, USA, 2009. [Google Scholar]
  36. Chave, J.; Réjou-Méchain, M.; Burquez, A.; Chidumayo, E.; Colgan, M.S.; Delitti, W.B.; Duque, A.; Eid, T.; Fearnside, P.M.; Goodman, R.C.; et al. Improved allometric models to estimate the aboveground biomass of tropical trees. Glob. Chang. Biol. 2014, 20, 3177–3190. [Google Scholar] [CrossRef]
  37. Vogt, K.A.; Vogt, D.J.; Bloomfield, J. Analysis of some direct and indirect methods for estimating root biomass and production of forests at an ecosystem level. Plant Soil 1998, 200, 71–89. [Google Scholar] [CrossRef]
  38. Motsara, M.R.; Roy, R.N. Guide to Laboratory Establishment for Plant Nutrient Analysis; Food and Agriculture Organization of the United Nations: Rome, Italy, 2008; p. 204. [Google Scholar]
  39. Hazelton, P.; Murphy, B. Interpreting soil test results. In What do All the Numbers Mean? CSIRO Publishing: Clayton, Victoria, Australia, 2007. [Google Scholar]
  40. Weil, R.R.; Brady, N.C. The Nature and Properties of Soils, 5th ed.; Pearson: Columbus, OH, USA, 2008; p. 1086. [Google Scholar]
  41. Bouyoucos, G.J. The Hydrometer As a New Method for the Mechanical Analysis of Soils. Soil Sci. 1927, 23, 343–354. [Google Scholar] [CrossRef]
  42. Frasier, I.; Noellemeyer, E.; Fernández, R.; Quiroga, A. Direct field method for root biomass quantification in agroecosystems. MethodsX 2016, 3, 513–519. [Google Scholar] [CrossRef]
  43. Harrison, X.A.; Donaldson, L.; Correa-Cano, M.E.; Evans, J.C.; Fisher, D.N.; Goodwin, C.E.; Robinson, B.; Hodgson, D.; Inger, R. A brief introduction to mixed effects modelling and multi-model inference in ecology. PeerJ 2018, 6, e4794. [Google Scholar] [CrossRef] [Green Version]
  44. Zuur, A.F.; Ieno, E.N.; Elphick, C.S. A protocol for data exploration to avoid common statistical problems. Methods Ecol. Evol. 2009, 1, 3–14. [Google Scholar] [CrossRef]
  45. Anderson, M.J.; Gorley, R.N.; Claeke, K.R. PERMANOVA+ for PRIMER: Guide to Software and Statistical Methods; PRIMER-E: Plymouth, UK, 2008. [Google Scholar]
  46. Oksanen, J.; Blanchet, F.G.; Kindt, R.; Legendre, P.; Minchin, P.R.; O’hara, R.B. Package Vegan; Community Ecology Package; CRAN: Vienna, Austria, 2013; Volume 9, pp. 1–295. [Google Scholar]
  47. Claeke, K.R.; Gorley, R.N.; Sommerfield, P.J.; Warwick, R.M. Change in Marine Communities: An Approach to Statistical Analysis and Interpretation, 3rd ed.; PRIMER-E: Plymouth, UK, 2014. [Google Scholar]
  48. Clarke, K.R.; Gorley, R.N. Getting Started with PRIMER v7; PRIMER-E Ltd.: Devon, UK, 2015. [Google Scholar]
  49. Zuur, A.F.; Ieno, E.N.; Walker, N.; Saveliev, A.A.; Smith, G.M. Mixed effects models and extensions in ecology with R. Stat. Biol. Health 2009, 32, 574. [Google Scholar]
  50. Luo, S.; He, Y.; Wang, Z.; Duan, D.; Zhang, J.; Zhang, Y.; Zhu, Y.; Yu, J.; Zhang, S.; Xu, F.; et al. Comparison of the retrieving precision of potato leaf area index derived from several vegetation indices and spectral parameters of the continuum removal method. Eur. J. Remote Sens. 2019, 52, 155–168. [Google Scholar] [CrossRef] [Green Version]
  51. Grueber, C.E.; Nakagawa, S.; Laws, R.J.; Jamieson, I.G. Multimodel inference in ecology and evolution: challenges and solutions. J. Evol. Biol. 2011, 24, 699–711. [Google Scholar] [CrossRef] [PubMed]
  52. Barton, A.D.; Ward, B.A.; Williams, R.G.; Follows, M.J. The impact of fine-scale turbulence on phytoplankton community structure. Limnol. Oceanogr. Fluids Environ. 2014, 4, 34–49. [Google Scholar] [CrossRef] [Green Version]
  53. Nakagawa, S.; Schielzeth, H. A general and simple method for obtaining R2 from generalized linear mixed effects models. Methods Ecol. Evol. 2012, 4, 133–142. [Google Scholar] [CrossRef]
  54. R Core Team. R: A Language and Environment for Statistical Computing; R Core Team: Vienna, Austria, 2013. [Google Scholar]
  55. Wang, J.; Zhao, F.; Yang, J.; Li, X. Mining Site Reclamation Planning Based on Land Suitability Analysis and Ecosystem Services Evaluation: A Case Study in Liaoning Province, China. Sustainability 2017, 9, 890. [Google Scholar] [CrossRef] [Green Version]
  56. Dutta, R.K.; Agrawal, M. Effect of tree plantations on the soil characteristics and microbial activity of coal mine spoil land. Trop. Ecol. 2002, 43, 315–324. [Google Scholar]
  57. Borišev, M.; Pajević, S.; Nikolić, S.; Pilipović, A.; Arsenov, D.; Župunski, M. Mine Site Restoration Using Silvicultural Approach. In Bio-Geotechnologies for Mine Site Rehabilitation; Elsevier: Amsterdam, The Netherlands, 2018; pp. 115–130. Available online: https://linkinghub.elsevier.com/retrieve/pii/B9780128129869000075 (accessed on 10 October 2019).
  58. Moreno-de las Heras, M. Development of soil physical structure and biological functionality in mining spoils affected by soil erosion in a Mediterranean-Continental environment. Geoderma 2009, 149, 249–256. [Google Scholar] [CrossRef]
  59. Nurtjahya, E.; Setiada, D.; Guhardja, E.M.; Setiadi, Y. Revegetation of tin-mined land using various local tree species in Bangka island, Indonesia. J. Am. Soc. Min. Reclam. 2008, 1, 14–19. [Google Scholar]
  60. Chaer, G.M.; Resende, A.S.; Campello, E.F.C.; De Faria, S.M.; Boddey, R.M. Nitrogen-fixing legume tree species for the reclamation of severely degraded lands in Brazil. Tree Physiol. 2011, 31, 139–149. [Google Scholar] [CrossRef] [PubMed] [Green Version]
  61. Bekunda, M. Nitrogen Fixation in Leucaena Leucocephala and Effects of Pruning on Cereal Yield; No. IAEA-TECDOC-1053; International Atomic Energy Agency: Vienna, Autstria, 1998. [Google Scholar]
  62. Vanlauwe, B.; Akinnifesi, F.K.; Tossah, B.K.; Lyasse, O.; Sanginga, N.; Merckx, R. Root distribution of Senna siamea grown on a series of derived-savanna-zone soils in Togo, West Africa. Agrofor. Syst. 2002, 54, 1–12. [Google Scholar] [CrossRef]
  63. Zipper, C.E.; Burger, J.A.; Skousen, J.G.; Angel, P.N.; Barton, C.D.; Davis, V.; Franklin, J. Restoring Forests and Associated Ecosystem Services on Appalachian Coal Surface Mines. Environ. Manag. 2011, 47, 751–765. [Google Scholar] [CrossRef] [PubMed]
  64. Buta, M.; Blaga, G.; Paulette, L.; Păcurar, I.; Roșca, S.; Borsai, O.; Grecu, F.; Sînziana, P.E.; Negrușier, C. Soil Reclamation of Abandoned Mine Lands by Revegetation in Northwestern Part of Transylvania: A 40-Year Retrospective Study. Sustainability 2019, 11, 3393. [Google Scholar] [CrossRef] [Green Version]
  65. Larney, F.J.; Angers, D.A. The role of organic amendments in soil reclamation: A review. Can. J. Soil Sci. 2012, 92, 19–38. [Google Scholar] [CrossRef]
  66. Albert, K.M.; Mensah, A.K. Role of revegetation in restoring fertility of degraded mined soils in Ghana: A review. Int. J. Biodivers. Conserv. 2015, 7, 57–80. [Google Scholar] [CrossRef] [Green Version]
  67. Zhang, H.; Duan, H.; Song, M.; Guan, D. The dynamics of carbon accumulation in Eucalyptus and Acacia plantations in the Pearl River delta region. Ann. For. Sci. 2018, 75, 40. [Google Scholar] [CrossRef] [Green Version]
  68. Clemmensen, K.E.; Bahr, A.; Ovaskainen, O.; Dahlberg, A.; Ekblad, A.; Wallander, H.; Stenlid, J.; Finlay, R.D.; Wardle, D.A.; Lindahl, B.D. Roots and Associated Fungi Drive Long-Term Carbon Sequestration in Boreal Forest. Science 2013, 339, 1615–1618. [Google Scholar] [CrossRef]
  69. Dong, J.; Kaufmann, R.K.; Myneni, R.; Tucker, C.J.; E Kauppi, P.; Liski, J.; Buermann, W.; Alexeyev, V.; Hughes, M.K. Remote sensing estimates of boreal and temperate forest woody biomass: carbon pools, sources, and sinks. Remote Sens. Environ. 2003, 84, 393–410. [Google Scholar] [CrossRef] [Green Version]
  70. Meli, P.; Holl, K.D.; Benayas, J.M.R.; Jones, H.P.; Jones, P.C.; Montoya, D.; Mateos, D.M. A global review of past land use, climate, and active vs. passive restoration effects on forest recovery. PLoS ONE 2017, 12, e0171368. [Google Scholar] [CrossRef]
  71. Srinivas, K.; Sundarapandian, S. Biomass and carbon stocks of trees in tropical dry forest of East Godavari region, Andhra Pradesh, India. Geol. Ecol. Landsc. 2018, 3, 114–122. [Google Scholar] [CrossRef]
  72. Gandhi, D.S.; Sundarapandian, S. Large-scale carbon stock assessment of woody vegetation in tropical dry deciduous forest of Sathanur reserve forest, Eastern Ghats, India. Environ. Monit. Assess 2017, 189, 604. [Google Scholar] [CrossRef] [PubMed]
  73. Lung, M.; Espira, A. The influence of stand variables and human use on biomass and carbon stocks of a transitional African forest: Implications for forest carbon projects. For. Ecol. Manag. 2015, 351, 36–46. [Google Scholar] [CrossRef]
  74. Padmakumar, B.; Sreekanth, N.; Shanthiprabha, V.; Paul, J.; Sreedharan, K.; Augustine, T.; Jayasooryan, K.; Rameshan, M.; Mohan, M.; Ramasamy, E.; et al. Tree biomass and carbon density estimation in the tropical dry forest of Southern Western Ghats, India. iFor.—Biogeosci. For. 2018, 11, 534–541. [Google Scholar] [CrossRef] [Green Version]
  75. Liu, F.; Gao, C.; Chen, M.; Li, K. Above- and below-ground biomass relationships of Leucaena leucocephala (Lam.) de Wit in different plant stands. PLoS ONE 2018, 13, e0207059. [Google Scholar] [CrossRef] [PubMed]
  76. Jiang, Y.; Zhang, Y.-J.; Wu, Y.; Hu, R.; Zhu, J.; Tao, J.; Zhang, T. Relationships between aboveground biomass and plant cover at two spatial scales and their determinants in northern Tibetan grasslands. Ecol. Evol. 2017, 7, 7954–7964. [Google Scholar] [CrossRef] [Green Version]
  77. Du, H.; Liu, L.; Su, L.; Zeng, F.; Wang, K.; Peng, W.; Zhang, H.; Song, T. Seasonal Changes and Vertical Distribution of Fine Root Biomass During Vegetation Restoration in a Karst Area, Southwest China. Front. Plant Sci. 2019, 9. [Google Scholar] [CrossRef] [Green Version]
  78. Sun, T.; Hobbie, S.E.; Berg, B.; Zhang, H.; Wang, Q.; Wang, Z.; Hättenschwiler, S. Contrasting dynamics and trait controls in first-order root compared with leaf litter decomposition. Proc. Natl. Acad. Sci. USA 2018, 115, 10392–10397. [Google Scholar] [CrossRef] [Green Version]
  79. Manaye, A.; Negash, M.; Alebachew, M. Effect of degraded land rehabilitation on carbon stocks and biodiversity in semi-arid region of Northern Ethiopia. For. Sci. Technol. 2019, 15, 70–79. [Google Scholar] [CrossRef] [Green Version]
  80. Chen, S.; Wang, W.; Xu, W.; Wang, Y.; Wan, H.; Chen, D.; Tang, Z.; Tang, X.; Zhou, G.; Xie, Z.; et al. Plant diversity enhances productivity and soil carbon storage. Proc. Natl. Acad. Sci. USA 2018, 115, 4027–4032. [Google Scholar] [CrossRef] [Green Version]
  81. Meng, S.; Jia, Q.; Zhou, G.; Zhou, H.; Liu, Q.; Yu, J. Fine Root Biomass and Its Relationship with Aboveground Traits of Larix gmelinii Trees in Northeastern China. Forest 2018, 9, 35. [Google Scholar] [CrossRef] [Green Version]
  82. Sollins, P. Factors influencing species composition in tropical lowland rain forest: does soil matter? Ecology 1998, 79, 23–30. [Google Scholar] [CrossRef]
  83. Jeon, I.; Nam, K. Change in the site density and surface acidity of clay minerals by acid or alkali spills and its effect on pH buffering capacity. Sci. Rep. 2019, 9, 9878. [Google Scholar] [CrossRef] [PubMed] [Green Version]
  84. Goulding, K.W.T. Soil acidification and the importance of liming agricultural soils with particular reference to the United Kingdom. Soil Use Manag. 2016, 32, 390–399. [Google Scholar] [CrossRef] [PubMed]
  85. Kumar, R.; Pandey, S.; Pandey, A. Plant roots and carbon sequestration. Curr. Sci. 2006, 91, 85–890. [Google Scholar]
  86. De Deyn, G.B.; Shiel, R.S.; Ostle, N.; McNamara, N.P.; Oakley, S.; Young, I.; Freeman, C.; Fenner, N.; Quirk, H.; Bardgett, R.D. Additional carbon sequestration benefits of grassland diversity restoration. J. Appl. Ecol. 2010, 48, 600–608. [Google Scholar] [CrossRef] [Green Version]
  87. Zhao, Y.; Krzic, M.; Bulmer, C.E.; Schmidt, M.G.; Simard, S.W. Relative bulk density as a measure of compaction and its influence on tree height. Can. J. For. Res. 2010, 40, 1724–1735. [Google Scholar] [CrossRef]
  88. Haile, W.; Boke, S. Response of Irish Potato (Solanum tuberosum) to the Application of Potassium at Acidic Soils of Chencha, Southern Ethiopia. Int. J. Agric. Biol. 2011, 13, 595–598. [Google Scholar]
Figure 1. Known previous (black arrows) and potential future (grey arrows) state transitions of the restored area over time. AF: arable field, GS: abandoned gravel-mined site, RA: restored area, SNF: semi-natural forest, and NF: natural forest.
Land 09 00209 g001
Figure 2. Non-metric multi-dimensional scaling (n-MDS) ordination showing resemblances between land-use types based on bootstrap average (av:) of soil properties with AF: arable field, GS: abandoned gravel-mined site, RA: restored area, SNF: semi-natural forest, and NF: natural forest.
Land 09 00209 g002
Figure 3. Non-metric multi-dimensional scaling (n-MDS) ordination of species composition among the three land-use types with trees (24 sample plots) with RA: restored area, SNF: semi-natural forest, and NF: natural forest. The length and direction of vectors represent the strength and direction of the association between tree species and land-use types. The circle indicates a maximum vector length corresponding to a Pearson correlation coefficient of 1.0.
Land 09 00209 g003
Figure 4. Significant relationship between organic root carbon and soil properties. The solid blue line represents the fitted relationship, and the grey area represents the 95% confidence interval.
Land 09 00209 g004
Figure 5. Box plot of organic root carbon (A) and above-ground biomass (B) between sites. The line represents the median value, the box limits are the 25th and 75th percentiles, error bars show 10th and 90th percentiles, and points show outliers. Different letters indicate significant differences between the land-use types (Tukey’s test, p < 0.05).
Land 09 00209 g005
Figure 6. (A,B) Relationship between above-ground biomass and significant soil attributes (ECEC and silt). The solid blue line represents the fitted relationship, and the grey area represents the 95 % confidence interval. ECEC: Effective cation exchange capacity.
Land 09 00209 g006
Table 1. Soil properties (mean and standard errors) of the five land-use types. Significant differences between sites were tested with PERMANOVA, and P-values are presented. Identical letters denote no significant differences between variables, while different letters denote significant differences between variables.
PropertiesNFSNFRAAFGSSignificance Levels
Mean ± SEMean ± SEMean ± SEMean ± SEMean ± SE
Sand (%)62.14 ± 2.4267.40 ± 2.3261.62 ± 2.6162.79 ± 1.6661.49 ± 3.510.464
Clay (%)15.13 ± 2.7612.62 ± 2.7016.63 ± 3.3020.90 ± 3.1221.17 ± 4.850.343
Silt (%)22.74 ± 1.6019.98 ± 2.4521.75 ± 1.7216.32 ± 1.8217.35 ± 1.880.106
BD (gcm−3)1.17 ± 0.03c1.28 ± 0.03b1.36 ± 0.05ab1.50 ± 0.06a1.41 ± 0.08ab0.001
pH5.71 ± 0.18b6.44 ± 0.19a5.69 ± 0.14b6.19 ± 0.12a4.51 ± 0.10c0.001
N (%)0.29 ± 0.02a0.19 ± 0.01b0.22 ± 0.03ab0.21 ± 0.01b0.10 ± 0.01c0.001
P (mgkg-1)6.01 ± 0.52b9.33 ± 2.93b8.44 ± 2.29b31.37 ± 12.17a2.83 ± 0.30c0.009
K (Cmolckg−1)0.29 ± 0.020.22 ± 0.020.23 ± 0.050.26 ± 0.080.14 ± 0.000.195
Na (%)0.18 ± 0.02a0.14 ± 0.00a0.17 ± 0.01a0.18 ± 0.02a0.11 ± 0.01b0.007
Ca(Cmolckg−1)10.85 ± 1.66a12.91 ± 1.63a9.48 ± 0.99a11.09 ± 1.12a5.48 ± 0.37b0.003
Mg(Cmolckg−1)3.43 ± 0.53a5.33 ± 1.06a4.24 ± 0.83a2.58 ± 0.69ab1.69 ± 0.17b0.011
SOM (%)7.98 ± 0.53a7.04 ± 0.63a8.80 ± 1.12a8.50 ± 0.76a4.55 ± 0.79b0.004
ECEC Cmolkg−1)15.45 ± 1.49a19.23 ± 2.03a15.32 ± 1.69a14.81 ± 1.45ab8.92 ± 0.34b0.004
Base Saturation (%)95.19 ± 0.88a95.98 ± 1.38a92.26 ± 0.85b94.95 ± 0.65a82.83 ± 2.06c0.001
C/N16.68 ± 1.84c21.53 ±1.69b24.08 ± 3.27b21.25 ± 1.69b32.98 ± 7.21a0.048

