Quantification of Soil Losses along the Coastal Protected Areas in Kenya


1
Aerospace Information Research Institute, Chinese Academy of Sciences, Beijing 100101, China
2
University of Chinese Academy of Sciences, Beijing 100049, China
3
Environment & Climate Change Research Institute, National Water Research Center, Cairo 12613, Egypt
4
Department of Hydrology and Water Resources Management, Faculty of Meteorology, Environment & Arid Land Agriculture, King Abdulaziz University Jeddah, Jeddah 21589, Saudi Arabia
*
Author to whom correspondence should be addressed.
Land 2020, 9(5), 137; https://doi.org/10.3390/land9050137
Submission received: 26 March 2020
/
Revised: 26 April 2020
/
Accepted: 27 April 2020
/
Published: 1 May 2020
(This article belongs to the Special Issue Drought, Land Use and Soil)
Abstract
:Monitoring of improper soil erosion empowered by water is constantly adding more risk to the natural resource mitigation scenarios, especially in developing countries. The demographical pattern and the rate of growth, in addition to the impairments of the rainfall pattern, are consequently disposed to adverse environmental disturbances. The current research goal is to evaluate soil erosion triggered by water in the coastal area of Kenya on the district level, and also in protected areas. The Revised Universal Soil Loss Equation (RUSLE) model was exercised to estimate the soil loss in the designated study area. RUSLE input parameters were functionally realized in terms of rainfall and runoff erosivity factor (R), soil erodibility factor (K), slope length and gradient factor (LS), land cover management factor (C) and slope factor (P). The realization of RUSLE input parameters was carried out using different dataset sources, including meteorological data, soil/geology maps, the Digital Elevation Model (DEM) and processing of satellite imagery. Out of 26 districts in coastal area, eight districts were projected to have mean annual soil loss rates of >10 t·ha−1·y−1: Kololenli (19.709 t·ha−1·y−1), Kubo (14.36 t·ha−1·y−1), Matuga (19.32 t·ha−1·y−1), Changamwe (26.7 t·ha−1·y−1), Kisauni (16.23 t·ha−1·y−1), Likoni (27.9 t·ha−1·y−1), Mwatate (15.9 t·ha−1·y−1) and Wundanyi (26.51 t·ha−1·y−1). Out of 34 protected areas at the coastal areas, only four were projected to have high soil loss estimation rates >10 t·ha−1·y−1: Taita Hills (11.12 t·ha−1·y−1), Gonja (18.52 t·ha−1·y−1), Mailuganji (13.75.74 t·ha−1·y−1), and Shimba Hills (15.06 t·ha−1·y−1). In order to mitigate soil erosion in Kenya’s coastal areas, it is crucial to regulate the anthropogenic disturbances embedded mainly in deforestation of the timberlands, in addition to the natural deforestation process caused by the wildfires.
1. Introduction
Climate change and its corresponding influences on natural resources are one of the greatest challenges that the scientific community has yet to answer The dynamicity and the complexity of climate change enforce the drastic impacts on natural ecosystems, especially the fragile ecosystems [1]. Climate prediction models suggest the alteration of the future climate to be shifted toward higher frequencies and intensities of extreme events on a global scale, with a substantial lack of mitigation plans on the local scale, founded on the Intergovernmental Panel for Climate Change findings (IPCC) [2]. Fragile ecosystems, especially coastal ecosystems, require significant considerations in terms of adaptation and mitigation efforts. Coastal ecosystems are unprotected to a wide range of natural threats: severe droughts, flash floods, fluctuations of sea level, sea surface temperature intensifying, and shoreline degradation in soil erosion dynamics [3]. Additionally, anthropogenic activities along coastal ecosystems are persistently increasing, which leads to heavy impacts on the adjacent natural ecosystems, specifically soil degradation [4,5].
Natural processes can lead to soil loss in the form of soil erosion, which is a solemn risk and a key apprehension globally. Soil erosion can be driven by several forces, mainly anthropogenic—like urbanization and mining activities—and equally caused also by natural reasons, like flash floods and rainstorms [6,7,8]. Henceforward, quantification of soil losses in critical areas, and delineation of the most adequate management application, is basic to the success of soil preservation plans [9]. Since soil erosion is an ongoing course, the evaluation of its effect on the environment is problematic, due to its spatial configuration, intricate biophysical developments, and the degree of its existence [10]. The soil erosion will magnify additionally with population expansion pressure, overutilization of natural resources, damaged land, and water management plans [11,12,13]. There is a prerequisite for soil protection to reverse the course of land desertion and improve agricultural production, to ensure food sanctuary and sustainability. Henceforth, there is a requirement for recognizing the critical erosion-susceptible areas. In addition to land degradation, additional difficulties caused by soil erosion comprise loss of soil nutrients, deteriorating crop yields, reduction in soil productivity, and pollution of surface and groundwater resources by sediment, fertilizer nutrients and insecticide residues.
Numerous approaches are available for calculation of soil surface erosion. These approaches are primarily of two types: physical models and experiential models [14,15,16]. The Water Erosion Prediction Project (WEPP) used by the United States Department of Agriculture [17], the Limburg Soil Erosion Model (LISEM) [18] and The European Soil Erosion Model EUROSEM [9] are broadly used physical models. Though these approaches are grounded on real procedures, they comprehend large numbers of input parameters with extensive computation. Furthermore, simulation of these for a specific area requires observed sediment loss data, which are not available for ungauged watersheds [19,20].
The revised model of the Universal Soil Loss Equation (RUSLE) is an updated version of the Universal Model of the Soil Loss Equation (USLE). The USLE was designed by the United States Department of Agriculture (USDA) in 1978 [21]. It can predict water under various influences (for example, land use, relief, soil and climate) and guide the development of protective erosion control plans [22]. RUSLE model contains a computer program that is easy to calculate and contains analysis of research data that is not available for USLE [23]. Although USLE has been retained in RUSLE, factor evaluation technology has been modified and new data has been introduced to evaluate terms under specific conditions. In the RUSLE model, the potential risk of soil erosion includes only the product of three natural factors (rainfall erosion, soil erodibility, and the length and slope of the slope) to indicate areas of high vulnerability [24,25,26]. On the contrary, the estimated soil erosion risk (Equation 1) is caused by natural and human factors (rainfall erosion, soil erodibility, slope length, slope coverage management and supporting practice factors) [27].
Experiential approaches are simple to apply and comprise fewer numbers of input parameters. The Universal Soil Loss Equation (USLE) developed by Wischmeier and Smith [28] is one of the most extensively used experiential soil loss estimation approaches. This is a pilot-scale model, which considers a number of factors, like topographical condition and soil characteristics of watersheds, local rainfall patterns, land use/land cover type and management practices, to calculate long-term average annual rill and inter-rill soil erosion [21].
Using orthodox systems to evaluate soil erosion risk is exclusive and time-consuming. The combination of existing soil erosion approaches and Remote Sensing datasets technologies, through the practice of Geographic Information Systems (GIS), appears to be advantageous with regards to soil erosion [29,30]. However, though soil erosion has been calculated locally in a few case studies in Kenya [31,32,33,34], it has not been evaluated at the district level and in protected areas. In addition, many of the changes in land use and land cover throughout current years have been compelled by the population growth burden, subsequent environmental pressure due to deforestation, the tourism industry, and agriculture [35,36].
It should be noted that the RUSLE model was chosen because the required data is relatively limited, and because of its simplicity, as pointed out by other authors [37,38,39]. The RUSLE model has been studied in depth, and has been widely used on different scales to estimate the loss from soil erosion and to plan the control of erosion imbalances for different land cover categories (e.g., agricultural land, pasture and forests) [23,40]. The RUSLE model and other methods of simulating soil erosion (such as the Coordination of Information on the Environment (CORINE model) can provide the most detailed information about soil erosion risks [27,41,42]. The RUSLE model usually uses auxiliary data provided free of charge in a geographic information system as an alternative method, because it measures soil, and so measuring erosion is expensive and takes time [43,44]. Although RUSLE is considered the main model for evaluating soil erosion, the availability of data to obtain certain RUSLE parameters is the biggest limitation, and it is impossible to maximize accuracy and unify the RUSLE processing method [45]. Model-based methods involve uncertainty in the calculation of each factor [46,47]. This disadvantage is common to all model-based methods [37].
The objectives of the current study are: (a) to assess soil erosion by water in coastal areas of Kenya; (b) to estimate soil erosion for different land cover and land use types, and for protected areas; and (c) to assess soil erosion risks for protected coastal areas of Kenya using the Revised Universal Soil Loss Equation (RUSLE) model [48].
2. Materials and Methods
2.1. Study Area Description
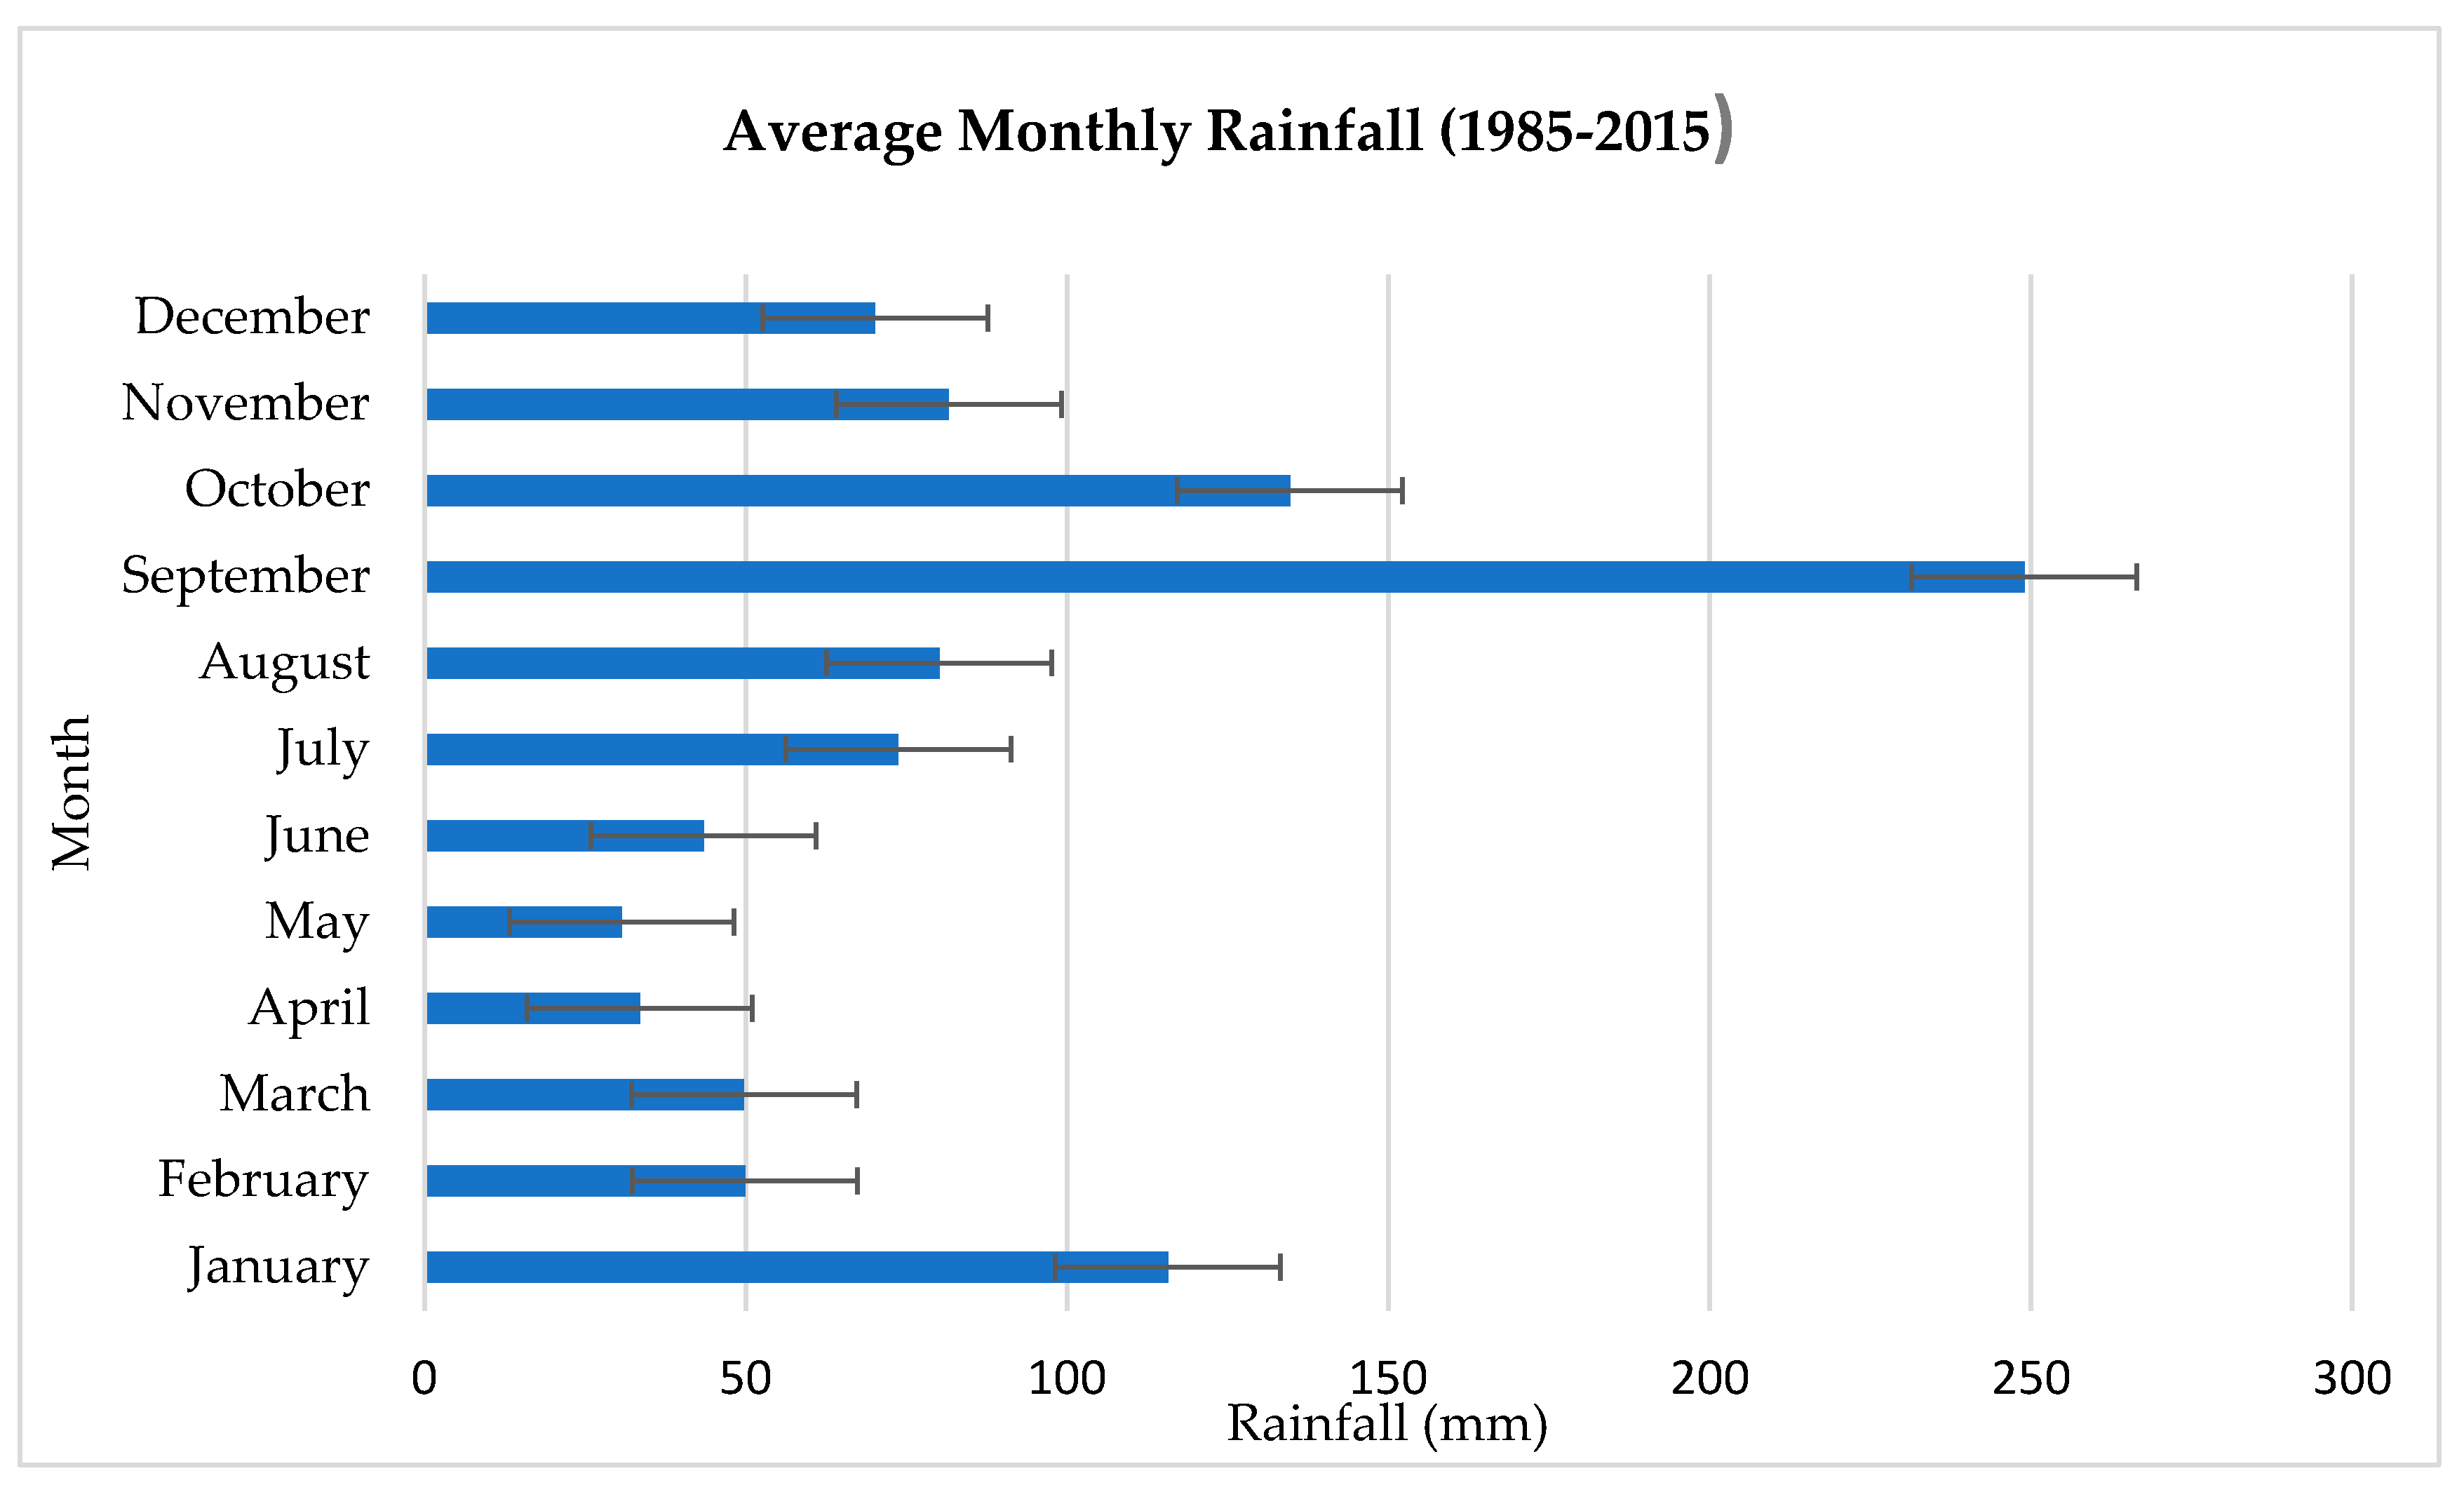
The coastal areas in Kenya are located between 2′15° N and 4′0° S, and encompass around 400 km along the Umba River headed North to the Somalian border, as shown in Figure 1. The climatic condition is defined to be a tropical climate with no all-year-round humidity. Daily temperature ranges between 30 °C and 22 °C. The mean annual precipitation is recorded to be around 1000 mm, falling in two rainy seasons. The long rainy season is from April until July, with average monthly rainfall of 134 mm, and the short rainy season is from October until December, with average monthly rainfall of 100 mm. the average monthly rainfall in the dry season is recoded to be 37 mm [49].
Kenyan protected areas play a crucial role in nature conservation strategies and in maintaining significant biodiversity in the country. The current natural ecosystems assist the Gross National Income (GNI) to stay functional, in terms of serving foraging, woods and clean water, as well as the Mijikenda provenance’s spiritual and cultural services [50,51]. Nevertheless, the Kenyan protected areas are under continuous pressure from the surrounding anthropogenic activities, especially when they are exaggerated by the climatic variabilities [52,53].
2.2. Methodological Framework
The current methodological framework is based on the implementation of the RUSLE empirical model (Table S1). The model shows significant results at different scales of applications [22,55,56]. The estimation of soil erosion based on the RUSLE model practices several natural and human-prompted basics [57].
Where A = Annual soil loss (t−1·ha−1·y−1), R = Rainfall-runoff erosivity factor (MJ−1·mm−1·ha−1·h−1·y−1), K = Soil erodibility factor (t−1·ha−1·h−1·ha−1·MJ−1·mm−1), LS = Slope length and slope steepness factors, C = Cover management factor, P = Conservation support practice factor equal to 1 in our study [58].
Basically, rill and sheet erosion are induced by surface water runoff, therefore the estimation of the rainfall erosivity factor (R) is essential. The seasonal variabilities and intensities of the rainfall (Figure 3) must be taken into consideration, specifically when the raindrop size is questioned. Larger raindrops contain enough kinetic energy to detach soil particles (Merlotto et al., 2016). The average monthly rainfall amounts for the period 1985–2015 were downloaded from http://www.cru.uea.ac.uk/data, considering 10 stations within 22 km of the Kenyan coastline and distributed along the entire coastline [59].
According to Wischmeier and Smith (1978), Rainfall erosivity factor can be estimated as follows:
Where, R factor was calculated and interpolated over the whole coastal area using a geostatistical model, is the monthly rainfall in mm, P is the annual rainfall in mm.
The influence of the topographical factors in soil erosion estimation cannot be neglected. For that reason, the LS factor is estimated following Panagos et al. (2015a):
Where = is the slope factor for the grid cell with coordinates ), = the grid cell size (m), ), = aspect direction for the grid cell with the coordinates (, = Flow accumulation with (, = the ratio of inter-rill erosion, = the slope.
The ratio of soil loss due to the practices of land use and land cover type is called the cover management factor (C) [23,31]. For the coastal area of Kenya under investigation, C factor is estimated based on the Normalized Difference Vegetation Index (NDVI). We used Landsat 8 with temporal resolution of August 24, 2015, and a spatial resolution of 30 m, to extract NDVI information to use in the equation (7). It was acquired from the US geological survey online portal (https://earthexplorer.usgs.gov/). The following equation:
Where = 2 and = 1 is the determined parameters of the NDVI.
The erosion control practices (P) factor expresses the effects of conservation practices that reduce the amount and rate of water runoff, which reduces erosion due to agricultural management practices such as contour tillage and planting, strip-cropping, terracing and subsurface drainage [60,61]. Unfortunately, due to the lack of financial means, these conservation practices are still undeveloped in developing countries, including the area of interest in this study [62]. Furthermore, establishment of a P factor map at the large watershed scale with complex land use systems is nearly impossible using the Wischmeier and Smith (1978) method, in which P factor is estimable based on the slope gradient and different support practices, such as terracing, contour tillage, etc. [63,64]. Therefore, the P factor value ranges from zero, as an index of good conservation practice, to one, as an index of poor conservation practice or no protective management in our study area [45,65].
The soil susceptibility to erosion is called the soil erodibility factor (K). The present study utilized the K factor [66], estimated using soil properties (sand, clay, silt and organic carbon fractions) compiled by the Africa Soil Information Service (AfSIS) with high spatial resolution of 250 m (http://www.isric.org/data/afsoilgrids250m, Table 1) [67], and Equation 8 proposed by Williams (1995) [68]. For validation reasons the results dataset from Fenta et al. (2020) [69] was kindly provided to compare our own K factor result.
where (Equation (9)) is a factor that gives low soil erodibility factors for soils with high coarse-sand contents and high values for soils with little sand, (Equation (10)) is a factor that gives low soil erodibility factors for soils with high clay to silt ratios, (Equation (11)) is a factor that reduces soil erodibility for soils with high organic carbon content, and (Equation (12)) is a factor that reduces soil erodibility for soils with extremely high sand contents [70].
where is the percent sand content (0.05–2.00 mm diameter particles), is the percent silt content (0.002–0.05 mm diameter particles), is the percent clay content (<0.002 mm diameter particles), and is the percent organic carbon of the layer (%).
3. Results and Discussion
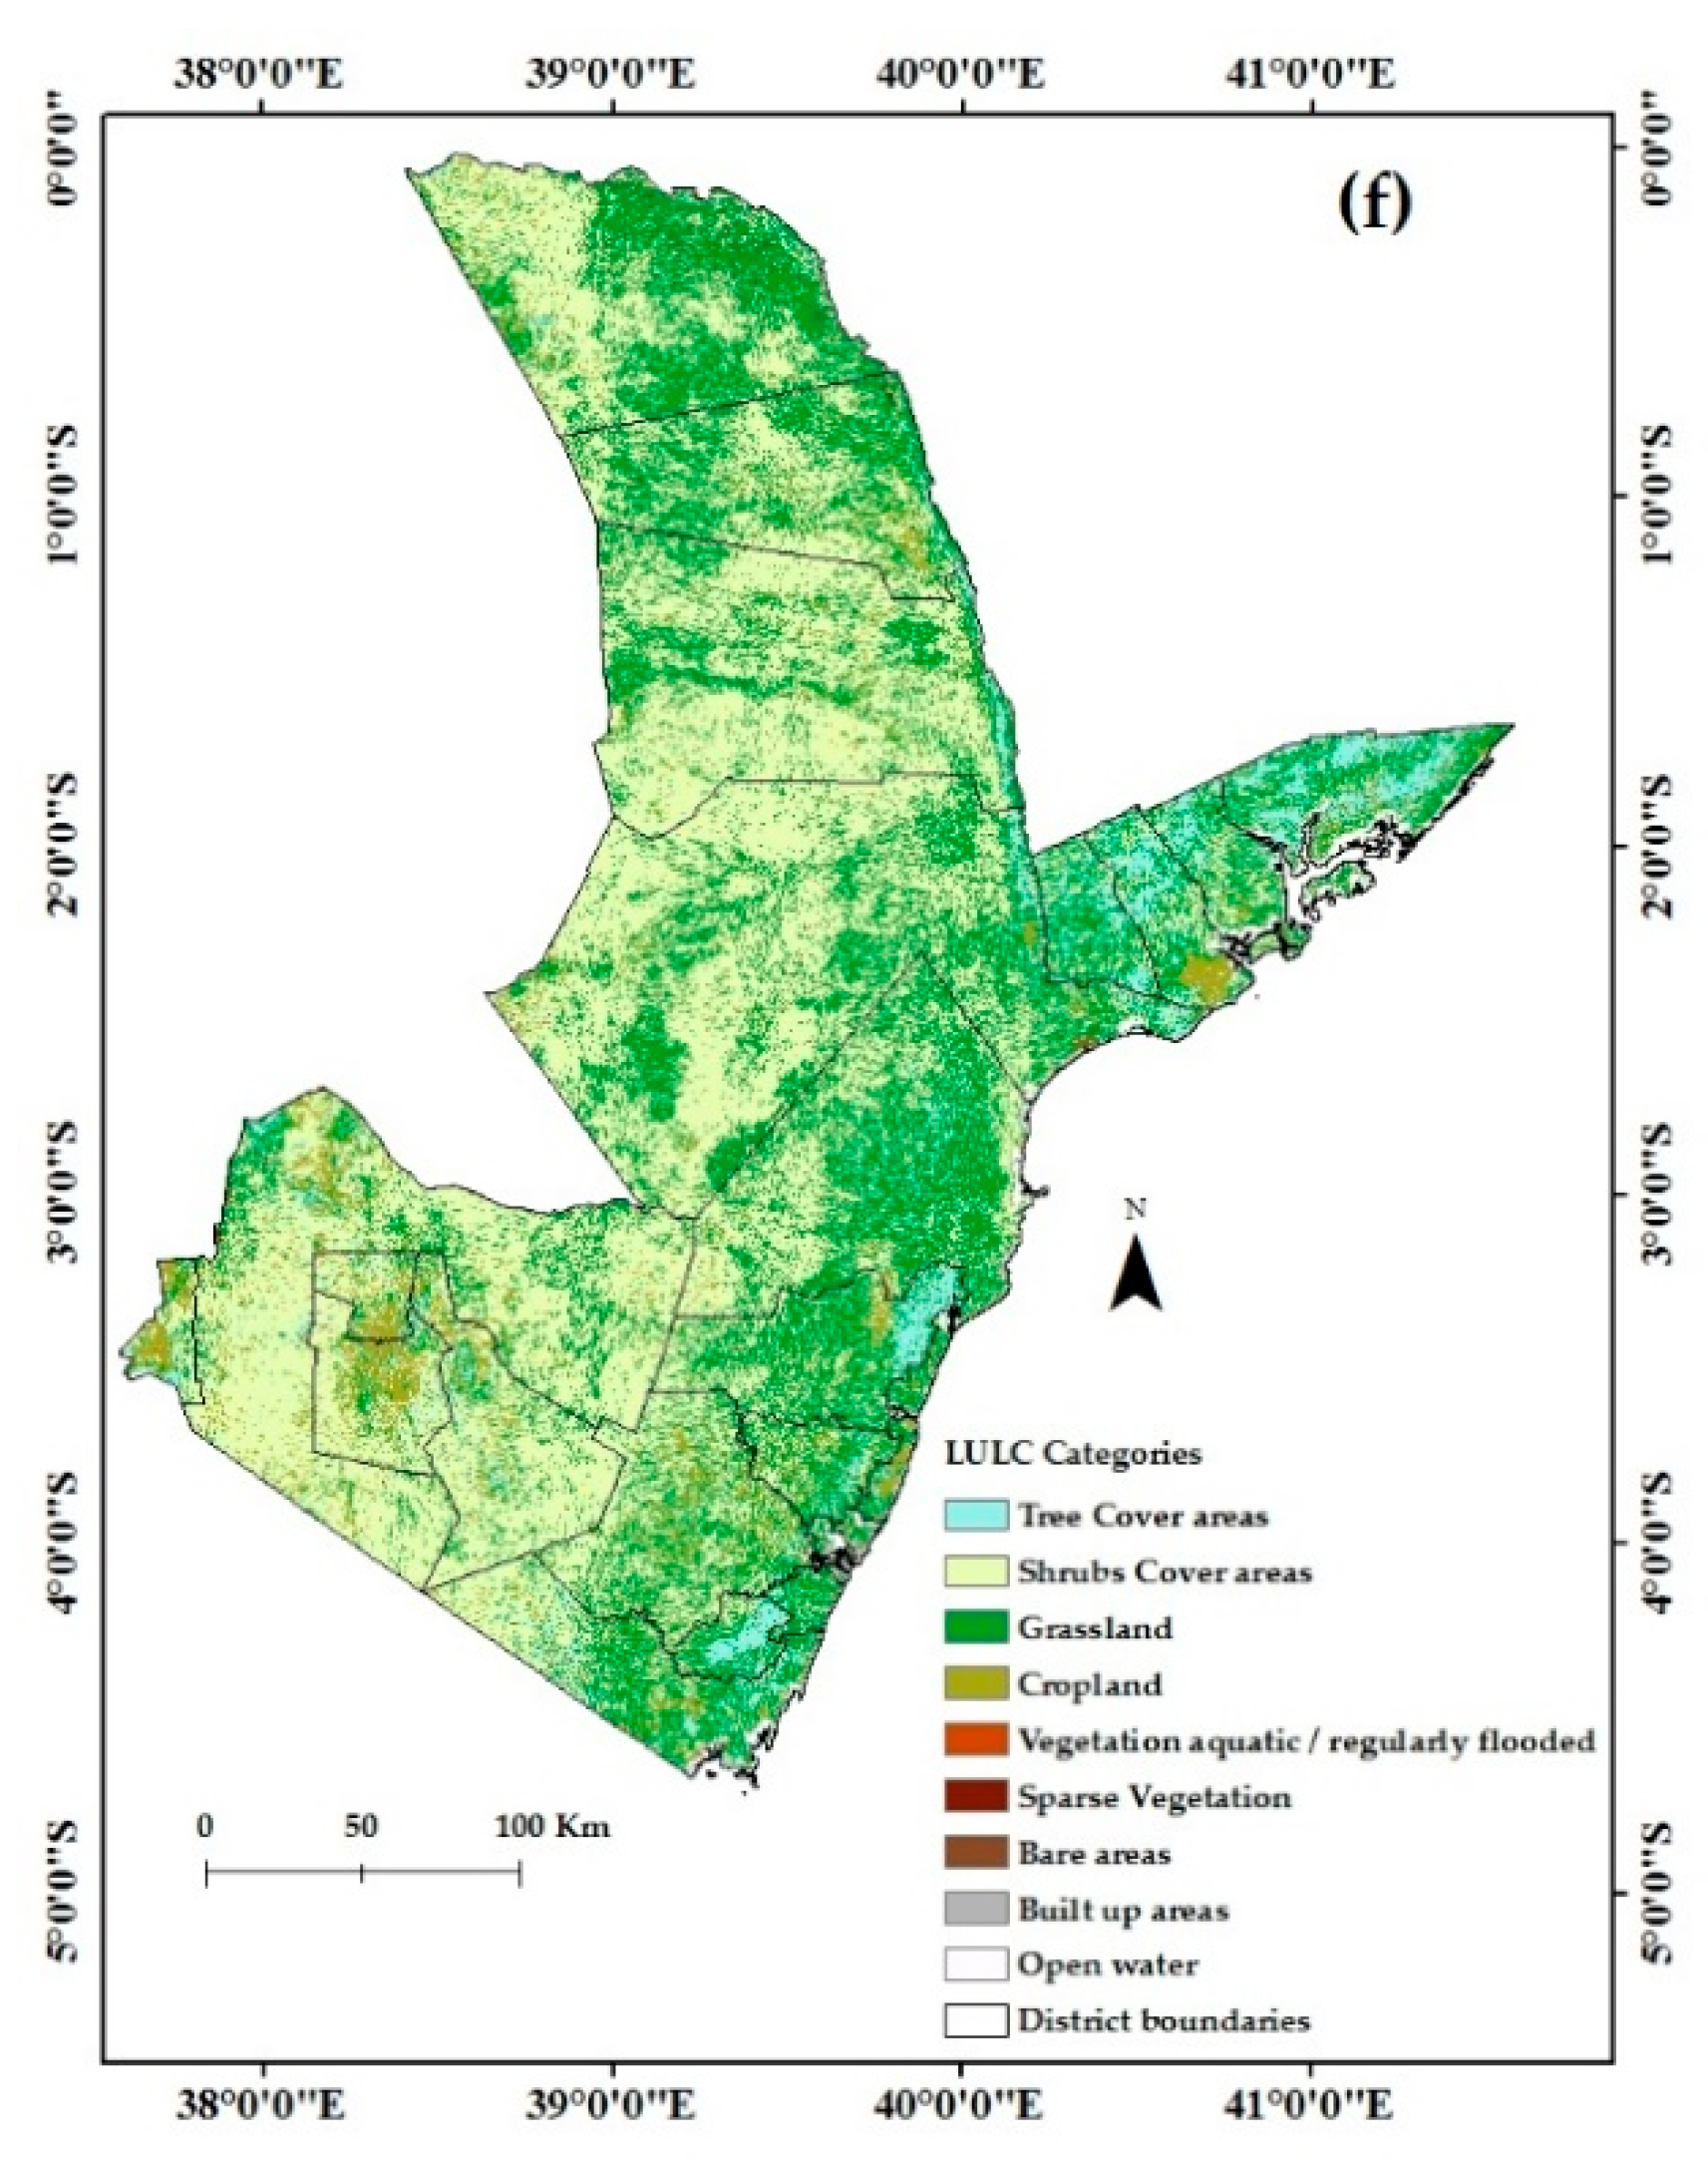
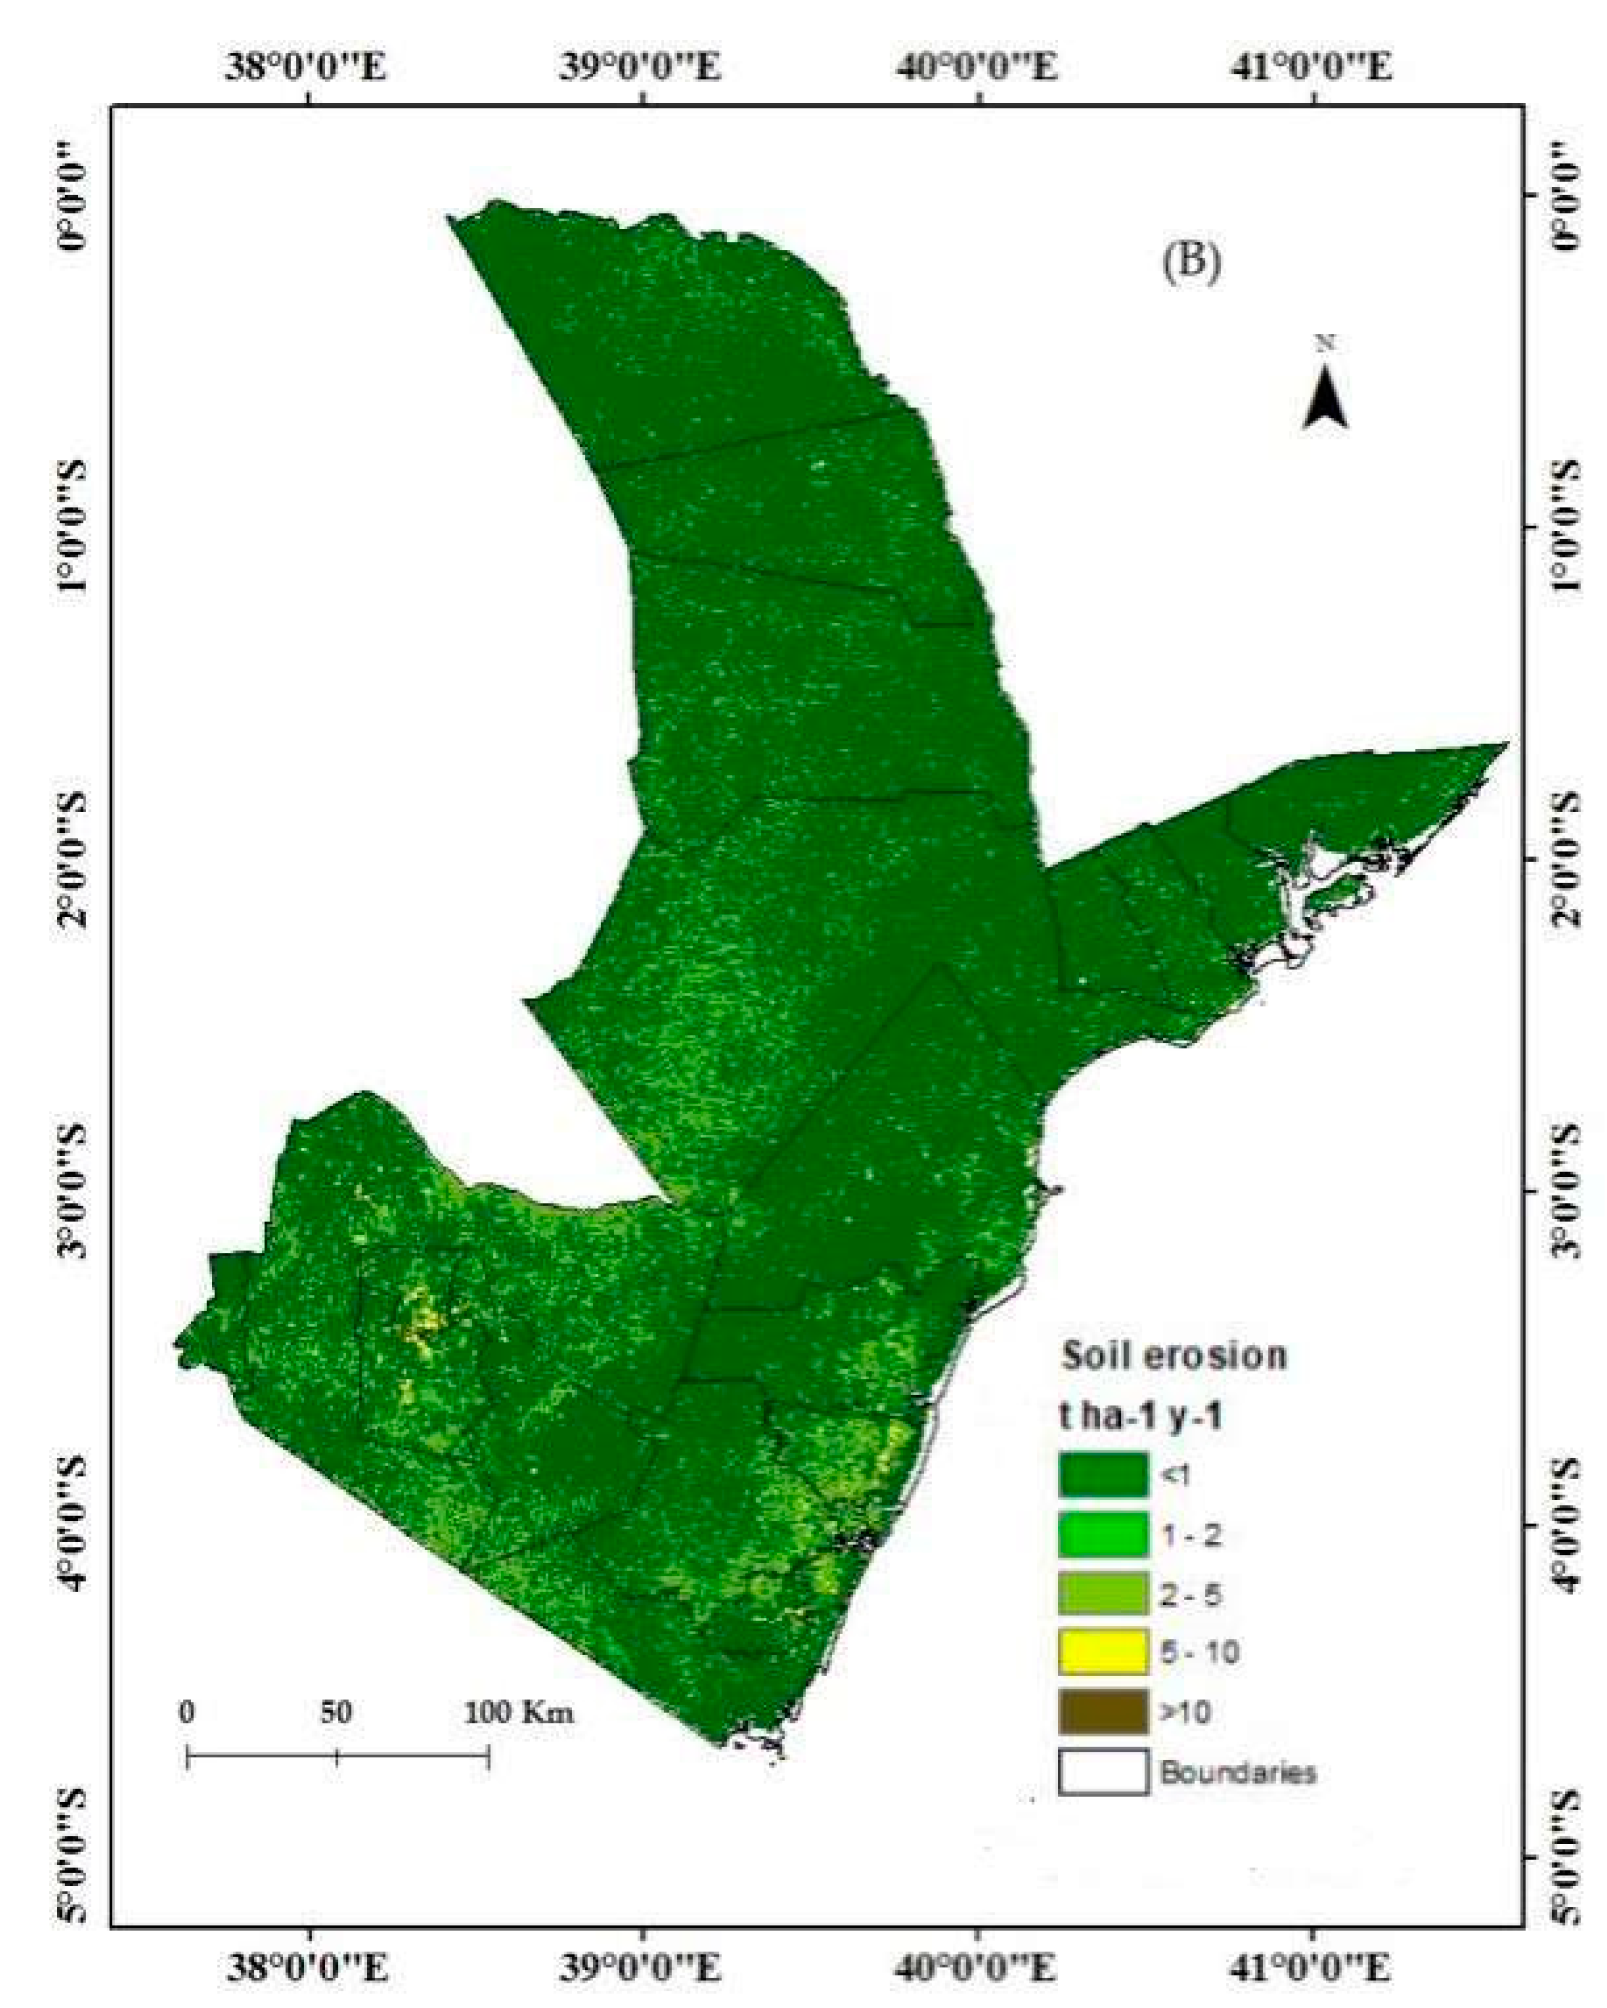
The estimation of soil loss using the RUSLE model necessitates a GIS environment where the multiplication RUSLE parameters take place. Study area slope is shown in Figure 4, and rainfall erosivity factor, soil erodibility factor, cover management factor, slope length and steepness factor, conservation support practice factor, and the land use and land cover map are demonstrated in Figure 5, respectively. Meanwhile, the estimation of soil erosion for the entire coastal area of Kenya is represented in Figure 6. The spatial configuration of the land use and land cover (LULC) types and the corresponding soil erosion estimation is proven in Table 2, except for tree cover areas, shrub cover areas and grassland; all other land cover types had unsustainable soil erosion.
The study area of Fenta et al. (2020) [69] also covers the coastal area of Kenya. Therefore, it could be used for validation of our results. A spatial analysis of the estimated soil loss risk at a district level revealed that 8 of the 26 districts of the coastal area (Table 3) are unprotected to an overall mean erosion risk rate >10 t·ha−1·y−1, and 8 districts, including Kololenli (19.709 t·ha−1·y−1), Kubo (14.36 t·ha−1·y−1), Matuga (19.32 t·ha−1·y−1), Changamwe (26.7 t·ha−1·y−1), Kisauni (16.23 t·ha−1·y−1), Likoni (27.9 t·ha−1·y−1), Mwatate (15.9 t·ha−1·y−1) and Wundanyi (26.51 t·ha−1·y−1), have completely suffered from the estimated soil erosion, and therefore extra soil erosion control precautions are needed.
The soil erosion acceptance value assists as a foundation for discerning whether the soil poses a prospective threat for drastic soil loss, or mostly for soil poverty [72]. As 8 districts of the coastal area have an average soil erosion of 10 t·ha−1·y−1, this is a prone land as an unsustainable average soil erosion rate is greater than 10 t·ha−1·y−1 (Table 3) [73]. The coast’s total soil loss, more than 70%, was in areas with a high soil risk, characterized by a steep slope range of 40% up to more than 100% (Figure 4), and high mean rainfall intensity of 1024 mm·y−1, as well as a monthly rainfall of 103 mm (Figure 3).
The highest average soil loss is found at the LULC types of built-up areas along the coast, with Mombasa County, Malindi, Kilifi and Lamu representing major urbanization infrastructure at the coastal shoreline. This has key effects on soil erosion acceleration, usually by baring the vegetative cover of the land surface, changing the drainage schemes, and compressing the soil particles throughout the construction process, and consequently covering the land with an impermeable layer of asphalts or concreate. This leads to the surface runoff becoming risky [40,74], hence poor planning and a lack of inter-sectoral coordination, and a lack of adequate enforcement items of management, [75] results in soil erosion in the coastal region.
The total soil losses of the 34 coastal protected areas under investigation in the current research are elaborated in Table 4. Taita Hills (11.12 t·ha−1·y−1), Gonja (18.52 t·ha−1·y−1), Mailuganji (13.75 t·ha−1·y−1) and Shimba Hills (15.06 t·ha−1·y−1) were the most endangered protected areas, where the annual mean soil erosion is higher than 10 t·ha−1·y−1 [76]. The higher soil erosion rate recorded in those protected areas could be based on the extensive anthropogenic activities, as well as the expansion of the deforestation process, either naturally or human-induced [42].
For validation reasons (Table S2), in tropical ecosystems, the threshold of soil erosion lenience was projected by Panagos et al. (2015a, 2017) to be 10 t·ha−1·y−1. The tropical threshold is considered to be higher than soil erosion impacts on crop production in Europe and North America, where the threshold is conducted to be 1 t·ha−1·y−1 due to the implemented higher standards of environmental protection [77]. Other examples of soil erosion risk include experiments conducted within the Sierra de Manantlán Biosphere Reserve in Mexico, which is recorded to have a wide range of soil erosion risks from 0 to 100 t·ha−1·y−1, which basically depends on the mountainous topography [78]. Meanwhile, the soil erosion risk in the Chemoga watershed in Ethiopia is projected to be a slope resilience risk, with 0 risks at the downstream and over 80 t·ha−1·y−1 at the watershed upstream [79].
The driving forces in coastal areas that make the soil erosion magnitude adverse are mostly climatic and topographic factors, assembled in the form of higher rainfall intensities and rugged terrain. The soil’s physical and chemical properties have a particular role in soil loss rate variabilities.
4. Conclusions
Remote Sensing, incorporated with the Geographical Information System, is exercised in the current study as a cost-effective tool to spatiotemporally quantify soil erosion risks on a local scale of a district-level along the shoreline of the Kenyan protected areas. Accordingly, the Revised Universal Soil Loss Equation model parameters were successfully realized and practiced to project potential soil erosion on a watershed scale, and derive robust results to be considered for soil restoration master plans. The slope is a very effective parameter that must be pointed out to limit soil degradation. Therefore, the transformation of gradients into vegetated terraces is the key element to deaccelerate the soil erosion process. This approach drops the strength of surface runoff erosivity and declines the scale influence of soil erosion. The findings of the present study suggest that areas with an annual average soil erosion potentiality of 10 t·ha−1·y−1 and higher must be prioritized in soil conservation plans. Above and beyond this is the providing of essential assistance to the decision-makers to implement effective anti-erosive practices to restrict the soil erosion process.
Supplementary Materials
The following are available online at https://www.mdpi.com/2073-445X/9/5/137/s1, Table S1: RUSLE model factors- Authors, Case study, and Equations and Table S2: Validation of our results from the Literature.
Author Contributions
Y.H. and M.A. were involved in conceptualizing the problem and identifying data while N.Y. and Q.M. mostly conducted data integration, while E.M. assisted in data analysis. All authors designed the research methods and worked on the entire framework of this research, carried out the discussion and analysis as well as the review of the manuscript. All authors have read and agreed to the published version of the manuscript.
Acknowledgments
The authors would like to thank the editor and anonymous reviewers for their valuable comments and suggestions to improve the quality of this paper. This work has been supported by the following projects 1-Spatial information service and application demonstration of comprehensive monitoring of urban and rural ecological environment, National Key Research and Development Program, 2017YFB0503900, 2017YFB0503905, 2-Major Projects of High Resolution Earth Observation Systems of National Science and Technology (05-Y30B01-9001-19/20-1), 3-CAS_TWAS president’s Fellowship for international Ph.D. Students, 4-National Science and Technology Support Project “Exploring the Origin of Chinese Civilization” (NO.2013BAK08B06).
Conflicts of Interest
The authors declare no conflict of interest.
References
- Ojwang, R.O.; Dietrich, J.; Anebagilu, P.K.; Beyer, M.; Rottensteiner, F. Rooftop rainwater harvesting for Mombasa: Scenario development with image classification and water resources simulation. Water (Switzerland) 2017, 9, 359. [Google Scholar] [CrossRef] [Green Version]
- Awuor, C.B.; Orindi, V.A.Y.O.; Adwera, A.O. Climate change and coastal cities: The case of Mombasa, Kenya. Environ. Urban. 2008, 20, 231–242. [Google Scholar] [CrossRef]
- Sudha Rani, N.N.V.; Satyanarayana, A.N.V.; Bhaskaran, P.K. Coastal vulnerability assessment studies over India: A review. Nat. Hazards 2015, 77, 405–428. [Google Scholar] [CrossRef]
- Beach, W.P.; Kebede, A.S.; Nicholls, R.J.; Hanson, S.; Mokrech, M. Impacts of Climate Change and Sea-Level Rise: A Preliminary Case Study of Mombasa, Kenya. J. Coast. Res. 2012, 28, 8–19. [Google Scholar]
- Musingi, J.K.; Kithha, S.M.; Wambua, B.N. The urban growth of Mombasa coastal town and its implication for surface and groundwater resources. In Proceedings of the International Symposium Held During IUGG 99, the XXII General Assembly of the International Union of Geodesy and Geophysics, Birmingham, UK, 18–30 July 1999; pp. 419–422. [Google Scholar]
- Koirala, P.; Thakuri, S.; Joshi, S.; Chauhan, R. Estimation of Soil Erosion in Nepal using a RUSLE modeling and geospatial tool. Geoscience 2019, 9, 147. [Google Scholar] [CrossRef] [Green Version]
- Claessens, L.; Van Breuge, P.; Notenbaert, A.; Herrero, M.; De Steeg, J. Van Mapping potential soil erosion in East Africa using the Universal Soil Loss Equation and secondary data. IAHS-AISH Publ. 2008, 398–407. [Google Scholar]
- Chittenden, D.B. Prevention and Control of Soil Erosion: The State of the Art; Special Report- Higway Research; Pennsylvania Department of Transportation: Harrisburg, PA, USA, 1973; pp. 123–150.
- Ganasri, B.P.; Ramesh, H. Assessment of soil erosion by RUSLE model using remote sensing and GIS—A case study of Nethravathi Basin. Geosci. Front. 2016, 7, 953–961. [Google Scholar] [CrossRef] [Green Version]
- Sujatha, E.; Sridhar, V. Spatial Prediction of Erosion Risk of a Small Mountainous Watershed Using RUSLE: A Case-Study of the Palar Sub-Watershed in Kodaikanal, South India. Water 2018, 10, 1608. [Google Scholar] [CrossRef] [Green Version]
- Reichmann, O.; Chen, Y.; Iggy, L.M. Spatial model assessment of P transport from soils to waterways in an Eastern Mediterranean Watershed. Water (Switzerland) 2013, 5, 262–279. [Google Scholar] [CrossRef] [Green Version]
- Barungi, M.; Edriss, A.; Mugisha, J.; Waithaka, M.; Tukahirwa, J. Factors Influencing the Adoption of Soil Erosion Control Technologies by Farmers Along the Slopes of Mt. Elgon in Eastern Uganda. J. Sustain. Dev. 2013, 6, 9. [Google Scholar] [CrossRef]
- Ozsahin, E.; Duru, U.; Eroglu, I. Land use and land cover changes (LULCC), a key to understand soil erosion intensities in the Maritsa Basin. Water (Switzerland) 2018, 10, 335. [Google Scholar] [CrossRef] [Green Version]
- Woldemariam, G.; Iguala, A.; Tekalign, S.; Reddy, R. Spatial Modeling of Soil Erosion Risk and Its Implication for Conservation Planning: The Case of the Gobele Watershed, East Hararghe Zone, Ethiopia. Land 2018, 7, 25. [Google Scholar] [CrossRef] [Green Version]
- Ayele, T.; Ahmed, N.; Ribbe, L.; Heinrich, J. Science of the Total Environment Hydrological responses to land use/cover changes in the source region of the Upper Blue Nile Basin, Ethiopia. Sci. Total Environ. 2017, 575, 724–741. [Google Scholar]
- Chandra, S.; Manisa, P. Application of RUSLE model for soil loss estimation of Jaipanda watershed, West Bengal. Spat. Inf. Res. 2017, 25, 399–409. [Google Scholar]
- Reitsma, K.D.; Dunn, B.H.; Mishra, U.; Clay, S.A.; DeSutter, T.; Clay, D.E. Land-use change impact on soil sustainability in a climate and vegetation transition zone. Agron. J. 2015, 107, 2363–2372. [Google Scholar] [CrossRef] [Green Version]
- Pérez-Molina, E.; Sliuzas, R.; Flacke, J.; Jetten, V. Developing a cellular automata model of urban growth to inform spatial policy for flood mitigation: A case study in Kampala, Uganda. Comput. Environ. Urban Syst. 2017, 65, 53–65. [Google Scholar] [CrossRef]
- Pelacani, S.; Märker, M.; Rodolfi, G. Simulation of soil erosion and deposition in a changing land use: A modelling approach to implement the support practice factor. Geomorphology 2008, 99, 329–340. [Google Scholar] [CrossRef]
- Jiang, T.; Chen, Y.D.; Xu, C.Y.; Chen, X.; Chen, X.; Singh, V.P. Comparison of hydrological impacts of climate change simulated by six hydrological models in the Dongjiang Basin, South China. J. Hydrol. 2007, 336, 316–333. [Google Scholar] [CrossRef]
- Smith, H.J. Application of empirical soil loss models in southern Africa: A review. S. Afr. J. Plant Soil 1999, 16, 158–163. [Google Scholar] [CrossRef]
- Nam, P.; YANG, D.; KANAE, S.; OKI, T.; MUSIAKE, K. Global Soil Loss Estimate Using RUSLE Model: The Use of Global Spatial Datasets on Estimating Erosive Parameters. Geoinformatics 2003, 14, 49–53. [Google Scholar] [CrossRef] [Green Version]
- Alexandridis, T.K.; Sotiropoulou, A.M.; Bilas, G.; Karapetsas, N.; Silleos, N.G. The Effects of Seasonality in Estimating the C-Factor of Soil Erosion Studies. L. Degrad. Dev. 2015, 26, 596–603. [Google Scholar] [CrossRef]
- Panagos, P.; Ballabio, C.; Borrelli, P.; Meusburger, K.; Klik, A.; Rousseva, S.; Tadić, M.P.; Michaelides, S.; Hrabalíková, M.; Olsen, P.; et al. Rainfall erosivity in Europe. Sci. Total Environ. 2015, 511, 801–814. [Google Scholar] [CrossRef] [PubMed] [Green Version]
- Panagos, P.; Borrelli, P.; Meusburger, K. A New European Slope Length and Steepness Factor (LS-Factor) for Modeling Soil Erosion by Water. Geosciences 2015, 5, 117–126. [Google Scholar] [CrossRef] [Green Version]
- Panagos, P.; Borrelli, P.; Meusburger, K.; Yu, B.; Klik, A.; Lim, K.J.; Yang, J.E.; Ni, J.; Miao, C.; Chattopadhyay, N.; et al. Global rainfall erosivity assessment based on high-temporal resolution rainfall records. Sci. Rep. 2017, 7. [Google Scholar] [CrossRef] [PubMed] [Green Version]
- Panagos, P.; Borrelli, P.; Meusburger, K.; Alewell, C.; Lugato, E.; Montanarella, L. Estimating the soil erosion cover-management factor at the European scale. Land use policy 2015, 48, 38–50. [Google Scholar] [CrossRef]
- Wischmeier, W.H.; Smith, D.D. Predicting Rainfall Erosion Losses—A Guide to Conservation Planning; USDA, Science and Education Administration: Washington, DC, USA, 1978; ISBN 19786726437.
- Mendoza-ponce, A.; Corona-núñez, R.; Kraxner, F.; Leduc, S.; Patrizio, P. Identifying e ff ects of land use cover changes and climate change on terrestrial ecosystems and carbon stocks in Mexico. Glob. Environ. Chang. 2018, 53, 12–23. [Google Scholar] [CrossRef] [Green Version]
- Alphan, H.; Derse, M.A. Change detection in Southern Turkey using normalized difference vegetation index (NDVI). J. Environ. Eng. Landsc. Manag. 2013, 21, 12–18. [Google Scholar] [CrossRef]
- Hunink, J.E.; Niadas, I.A.; Antonaropoulos, P.; Droogers, P.; de Vente, J. Targeting of intervention areas to reduce reservoir sedimentation in the Tana catchment (Kenya) using SWAT. Hydrol. Sci. J. 2013, 58, 600–614. [Google Scholar] [CrossRef] [Green Version]
- Willy, D.K.; Holm-Müller, K. Social influence and collective action effects on farm level soil conservation effort in rural Kenya. Ecol. Econ. 2013, 90, 94–103. [Google Scholar] [CrossRef]
- Saiz, G.; Wandera, F.M.; Pelster, D.E.; Ngetich, W.; Okalebo, J.R.; Rufino, M.C.; Butterbach-Bahl, K. Long-term assessment of soil and water conservation measures (Fanya-juu terraces) on soil organic matter in South Eastern Kenya. Geoderma 2016, 274, 1–9. [Google Scholar] [CrossRef]
- Were, K.O.; Dick, T.B.; Singh, B.R. Remotely sensing the spatial and temporal land cover changes in Eastern Mau forest reserve and Lake Nakuru drainage basin, Kenya. Appl. Geogr. 2013, 41, 75–86. [Google Scholar] [CrossRef]
- Elhag, M.; Kojchevska, T.; Boteva, S. EPM for Soil Loss Estimation in Different Geomorphologic Conditions and Data Conversion by Using GIS. IOP Conf. Ser. Earth Environ. Sci. 2019, 221. [Google Scholar] [CrossRef]
- Bahrawi, J.A.; Elhag, M.; Aldhebiani, A.Y.; Galal, H.K.; Hegazy, A.K.; Alghailani, E. Soil Erosion Estimation Using Remote Sensing Techniques in Wadi Yalamlam Basin, Saudi Arabia. Adv. Mater. Sci. Eng. 2016, 2016. [Google Scholar] [CrossRef] [Green Version]
- Zeng, C.; Wang, S.; Bai, X.; Li, Y.; Tian, Y.; Li, Y.; Wu, L.; Luo, G. Soil erosion evolution and spatial correlation analysis in a typical karst geomorphology using RUSLE with GIS. Solid Earth 2017, 8, 721–736. [Google Scholar] [CrossRef] [Green Version]
- Taye, G.; Vanmaercke, M.; Poesen, J.; Van Wesemael, B.; Tesfaye, S.; Teka, D.; Nyssen, J.; Deckers, J.; Haregeweyn, N. Determining RUSLE P- and C-factors for stone bunds and trenches in rangeland and cropland, North Ethiopia. L. Degrad. Dev. 2018, 29, 812–824. [Google Scholar] [CrossRef]
- Morán-tejeda, E.; Zabalza, J.; Rahman, K.; Gago-silva, A.; López-moreno, J.I.; Vicente-serrano, S.; Lehmann, A.; Tague, C.L.; Beniston, M. Hydrological impacts of climate and land-use changes in a mountain watershed: Uncertainty estimation based on model comparison. ECOHydrology 2014. [Google Scholar] [CrossRef]
- Wang, L. An Assessment of the Impact of Urbanization on Soil Erosion in Inner Mongolia. Int. J. Environ. Res. Public Health 2018, 15, 550. [Google Scholar] [CrossRef] [Green Version]
- Zhang, H.; Wei, J.; Yang, Q.; Baartman, J.E.; Gai, L.; Yang, X.; Li, S.; Yu, J.; Ritsema, C.J.; Geissen, V. An Improved Method for Calculating Slope Length (Λ) and the Ls Parameters of the Revised Universal Soil Loss Equation for Large Watersheds. Geoderma 2017, 308, 36–45. [Google Scholar] [CrossRef]
- Panagos, P.; Borrelli, P.; Poesen, J.; Ballabio, C.; Lugato, E.; Meusburger, K.; Montanarella, L.; Alewell, C. The new assessment of soil loss by water erosion in Europe. Environ. Sci. Policy 2015, 54, 438–447. [Google Scholar] [CrossRef]
- Karamage, F.; Zhang, C.; Liu, T.; Maganda, A.; Isabwe, A. Soil erosion risk assessment in Uganda. Forests 2017, 8, 52. [Google Scholar] [CrossRef]
- Benchettouh, A.; Kouri, L.; Jebari, S. Spatial estimation of soil erosion risk using RUSLE/GIS techniques and practices conservation suggested for reducing soil erosion in Wadi Mina watershed (northwest, Algeria). Arab. J. Geosci. 2017, 10. [Google Scholar] [CrossRef]
- Fantappiè, M.; Priori, S.; Costantini, E.A.C. Soil erosion risk, Sicilian Region (1:250,000 scale). J. Maps 2015, 2, 323–341. [Google Scholar] [CrossRef] [Green Version]
- Karamage, F.; Shao, H.; Chen, X.; Ndayisaba, F.; Nahayo, L.; Kayiranga, A.; Omifolaji, J.K.; Liu, T.; Zhang, C. Deforestation effects on soil erosion in the Lake Kivu Basin, D.R. Congo-Rwanda. Forests 2016, 7, 281. [Google Scholar] [CrossRef] [Green Version]
- Aiello, A.; Adamo, M.; Canora, F. Remote sensing and GIS to assess soil erosion with RUSLE3D and USPED at river basin scale in southern Italy. Catena 2015, 131, 174–185. [Google Scholar] [CrossRef]
- Renard, K.G.; Foster, G.R.; Weesies, G.A.; McCool, D.K.; Yoder, D. Predicting Soil Erosion by Water: A Guide to Conservation Planning with the Revised Universal Soil Loss Equation; USDA-ARS, Southwest Watershed Research Center: Tucson, Arizona, 1996; p. 703.
- Ongoma, V.; Chen, H.; Gao, C.; Nyongesa, A.M.; Polong, F. Future changes in climate extremes over Equatorial East Africa based on CMIP5 multimodel ensemble. Nat. Hazards 2018, 90, 901–920. [Google Scholar] [CrossRef]
- Boillat, S.; Gerber, J.; Oberlack, C.; Zaehringer, J.G.; Speranza, C.I.; Rist, S. Distant Interactions, Power, and Environmental Justice in Protected Area Governance: A Telecoupling Perspective. Sustainability 2018, 10, 3954. [Google Scholar] [CrossRef] [Green Version]
- Coad, L.; Leverington, F.; Knights, K.; Geldmann, J.; Eassom, A.; Kapos, V.; Kingston, N.; De Lima, M.; Zamora, C.; Cuardros, I.; et al. Measuring impact of protected area management interventions: Current and future use of the Global Database of Protected Area Management Effectiveness. Philos. Trans. R. Soc. B Biol. Sci. 2015, 370. [Google Scholar] [CrossRef]
- Recanatesi, F.; Giuliani, C.; Ripa, M.N. Monitoring Mediterranean Oak Decline in a Peri-Urban Protected Area Using the NDVI and Sentinel-2 Images: The Case Study of Castelporziano State Natural Reserve. Sustainability 2018, 10, 3308. [Google Scholar] [CrossRef] [Green Version]
- Rodríguez-rodríguez, D.; Martínez-vega, J.; Echavarría, P. Int J Appl Earth Obs Geoinformation A twenty year GIS-based assessment of environmental sustainability of land use changes in and around protected areas of a fast developing country: Spain. Int. J. Appl. Earth Obs. Geoinf. 2019, 74, 169–179. [Google Scholar] [CrossRef]
- Rodrigues, A.S.; Andelman, S.J.; Bakarr, M.I.; Boitani, L.; Brooks, T.M.; Cowling, R.M.; Fishpool, L.D.; Da Fonseca, G.A.; Gaston, K.J.; Hoffmann, M. Effectiveness of the Global Protected Area Network in Representing Species Diversity. Nature 2004, 428, 640–643. [Google Scholar] [CrossRef] [PubMed]
- Meigh, J.R.; McKenzie, A.A.; Sene, K.J. A grid-based approach to water scarcity estimates for Eastern and Southern Africa. Water Resources Manag. 1999, 13, 85–115. [Google Scholar] [CrossRef]
- Moges, D.M.; Bhat, H.G. Integration of geospatial technologies with RUSLE for analysis of land use/cover change impact on soil erosion: Case study in Rib watershed, north-western highland Ethiopia. Environ. Earth Sci. 2017, 76. [Google Scholar] [CrossRef]
- Gelagay, H.S.; Minale, A.S. Soil loss estimation using GIS and Remote sensing techniques: A case of Koga watershed, Northwestern Ethiopia. Int. Soil Water Conserv. Res. 2016, 4, 126–136. [Google Scholar] [CrossRef] [Green Version]
- Panagos, P.; Borrelli, P.; Meusburger, K.; van der Zanden, E.H.; Poesen, J.; Alewell, C. Modelling the effect of support practices (P-factor) on the reduction of soil erosion by water at European scale. Environ. Sci. Policy 2015, 51, 23–34. [Google Scholar] [CrossRef]
- Ojwang, L.; Rosendo, S.; Mwangi, M.; Celliers, L.; Obura, D.; Muiti, A. Earth ’ s Future Special Section: Assessment of Coastal Governance for Climate Change Adaptation in Kenya Earth ’ s Future. Assess. Coast. Gov. Clim. Chang. Adapt. Kenya Earth’s Futur. 2017, 5, 1119–1132. [Google Scholar]
- Teng, H.; Viscarra Rossel, R.A.; Shi, Z.; Behrens, T.; Chappell, A.; Bui, E. Assimilating satellite imagery and visible-near infrared spectroscopy to model and map soil loss by water erosion in Australia. Environ. Model. Softw. 2016, 77, 156–167. [Google Scholar] [CrossRef]
- Thomas, J.; Joseph, S.; Thrivikramji, K.P. Assessment of soil erosion in a tropical mountain river basin of the southern Western Ghats, India using RUSLE and GIS. Geosci. Front. 2018, 9, 893–906. [Google Scholar] [CrossRef]
- Onyando, J.; Kisoyan, P.; Chemelil, M. Estimation of Potential Soil Erosion for River Perkerra Catchment in Kenya. Water Resources Manag. 2005, 19, 133–143. [Google Scholar] [CrossRef]
- Gaubi, I.; Chaabani, A.; Ben Mammou, A.; Hamza, M.H. A GIS-based soil erosion prediction using the Revised Universal Soil Loss Equation (RUSLE) (Lebna watershed, Cap Bon, Tunisia). Nat. Hazards 2017, 86, 219–239. [Google Scholar] [CrossRef]
- da Cunha, E.R.; Bacani, V.M.; Panachuki, E. Modeling soil erosion using RUSLE and GIS in a watershed occupied by rural settlement in the Brazilian Cerrado. Nat. Hazards 2017, 85, 851–868. [Google Scholar] [CrossRef]
- Van der Knijff, J.M.; Jones, R.J.; Montanarella, L. Soil erosion risk assessment in Italy. Eur. Soil Bur. 2000, EUR 19044, 34. [Google Scholar]
- Naqvi, H.R.; Mallick, J.; Devi, L.M.; Siddiqui, M.A. Multi-temporal annual soil loss risk mapping employing Revised Universal Soil Loss Equation (RUSLE) model in Nun Nadi Watershed, Uttrakhand (India). Arab. J. Geosci. 2013, 6, 4045–4056. [Google Scholar] [CrossRef]
- Soil Property Maps of Africa at 250 m Resolution | ISRIC. Available online: https://www.isric.org/projects/soil-property-maps-africa-250-m-resolution (accessed on 16 April 2020).
- Lal, R. Soil degradation by erosion. L. Degrad. Dev. 2001, 12, 519–539. [Google Scholar] [CrossRef]
- Fenta, A.A.; Tsunekawa, A.; Haregeweyn, N.; Poesen, J.; Tsubo, M.; Borrelli, P.; Panagos, P.; Vanmaercke, M.; Broeckx, J.; Yasuda, H.; et al. Land susceptibility to water and wind erosion risks in the East Africa region. Sci. Total Environ. 2020, 703, 135016. [Google Scholar] [CrossRef] [PubMed]
- Africa Soil Information Service (AfSIS) | ISRIC. Available online: https://www.isric.org/projects/africa-soil-information-service-afsis (accessed on 16 April 2020).
- Schürz, C.; Mehdi, B.; Kiesel, J.; Schulz, K.; Herrnegger, M. A systematic assessment of uncertainties in large scale soil loss estimation from different representations of USLE input factors – A case study for Kenya and Uganda. Hydrol. Earth Syst. Sci. Discuss. 2019, 1–35. [Google Scholar] [CrossRef] [Green Version]
- Garcin, Y.; Schildgen, T.F.; Torres Acosta, V.; Melnick, D.; Guillemoteau, J.; Willenbring, J.; Strecker, M.R. Short-lived increase in erosion during the African Humid Period: Evidence from the northern Kenya Rift. Earth Planet. Sci. Lett. 2017, 459, 58–69. [Google Scholar] [CrossRef] [Green Version]
- Ongwenyi, G.S.; Kithiia, S.M.; Denga, F.O. An overview of soil erosion and sedimentation problems in Kenya. Sediment Probl. Strateg. Monit. Predict. Control 1993, 216–221. [Google Scholar]
- Arsiso, B.K.; Mengistu Tsidu, G.; Stoffberg, G.H.; Tadesse, T. Influence of urbanization-driven land use/cover change on climate: The case of Addis Ababa, Ethiopia. Phys. Chem. Earth 2018, 105, 212–223. [Google Scholar] [CrossRef]
- Hategekimana, Y.; Yu, L.; Nie, Y.; Zhu, J.; Liu, F.; Guo, F. Integration of multi-parametric fuzzy analytic hierarchy process and GIS along the UNESCO World Heritage: A flood hazard index, Mombasa County, Kenya. Nat. Hazards 2018. [Google Scholar] [CrossRef]
- FAO and ITPS Status of the World’s Soil Resources (SWSR)—Main Report, Food and Agriculture organization of the United Nations; FAO and ITPS Status of the World’s Soil Resources (SWSR): Rome, Italy, 2015; ISBN 978-92-5-109004-6.
- Mullan, D.; Favis-mortlock, D.; Fealy, R. Agricultural and Forest Meteorology Addressing key limitations associated with modelling soil erosion under the impacts of future climate change. Agric. For. Meteorol. 2012, 156, 18–30. [Google Scholar] [CrossRef] [Green Version]
- Millward, A.A.; Mersey, J.E. Adapting the RUSLE to model soil erosion potential in a mountainous tropical watershed. Catena 1999, 38, 109–129. [Google Scholar] [CrossRef]
- Tadesse, L.; Suryabhagavan, K.V.; Sridhar, G.; Legesse, G. International Soil and Water Conservation Research Landuse and landcover changes and Soil erosion in Yezat Watershed, North Western Ethiopia. Int. Soil Water Conserv. Res. 2017, 5, 85–94. [Google Scholar] [CrossRef] [Green Version]
Figure 1.
Study area location.
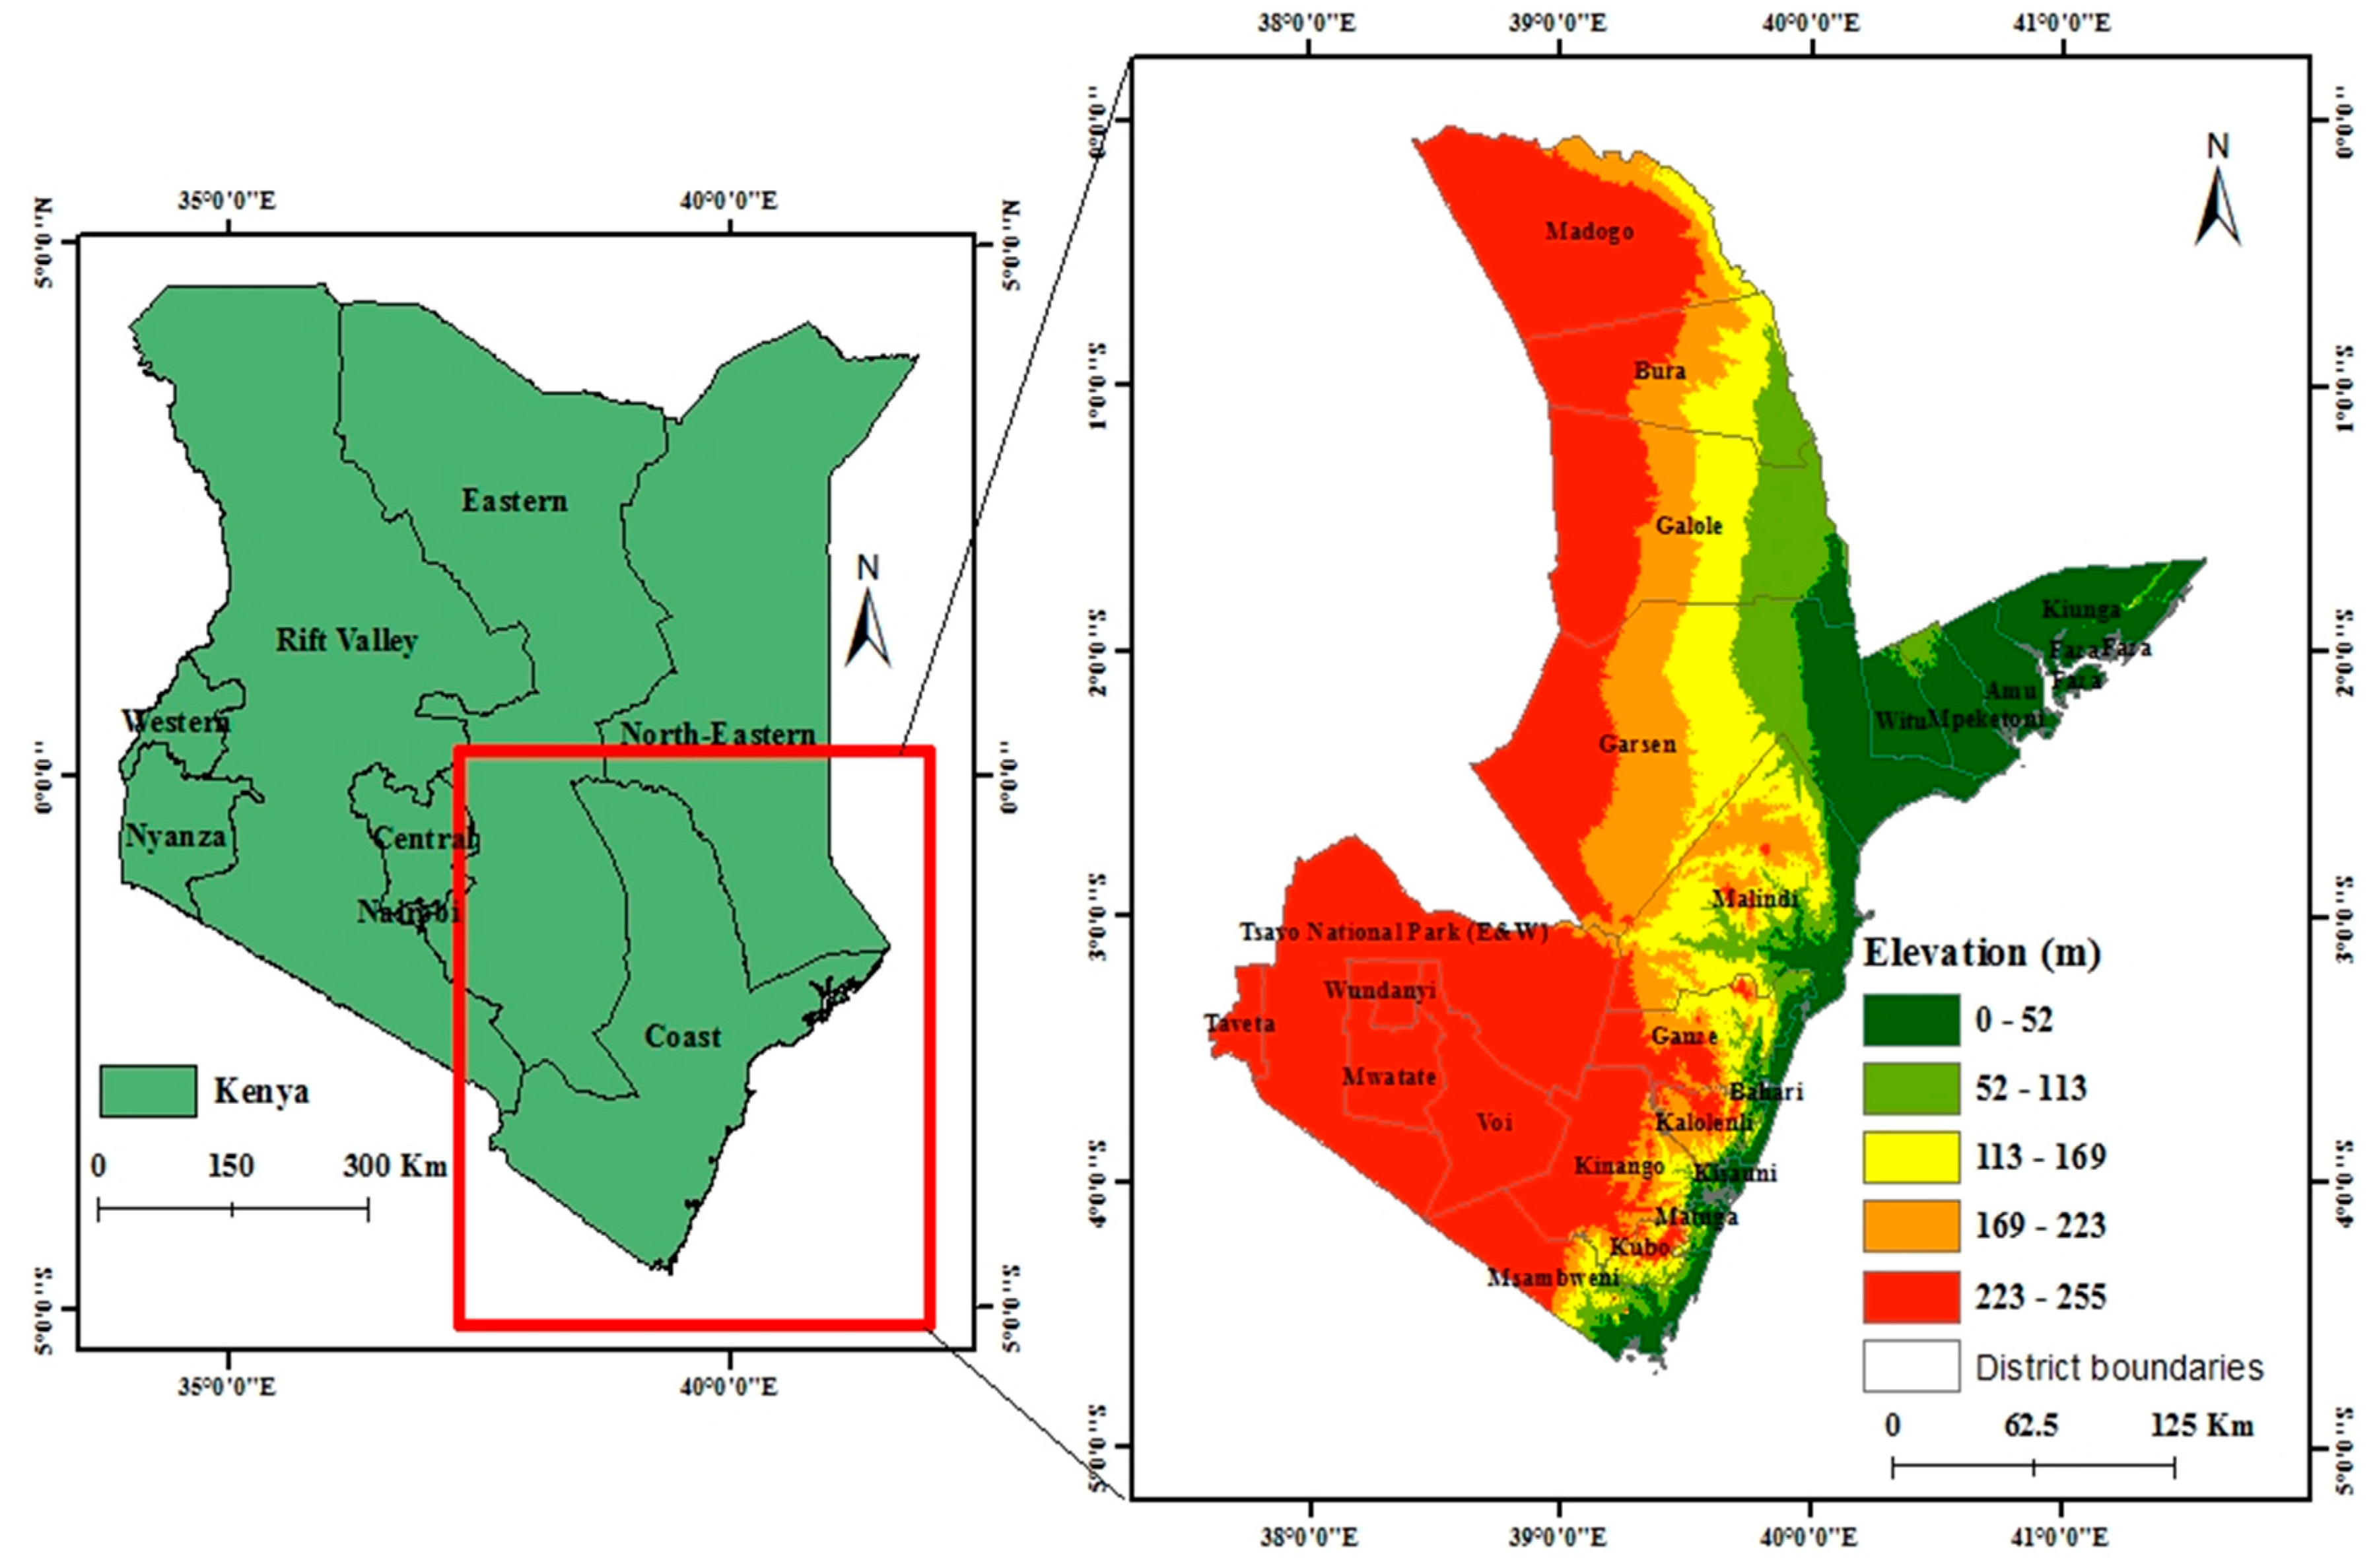
Figure 2.
List of the names of protected areas along with the coastal areas.
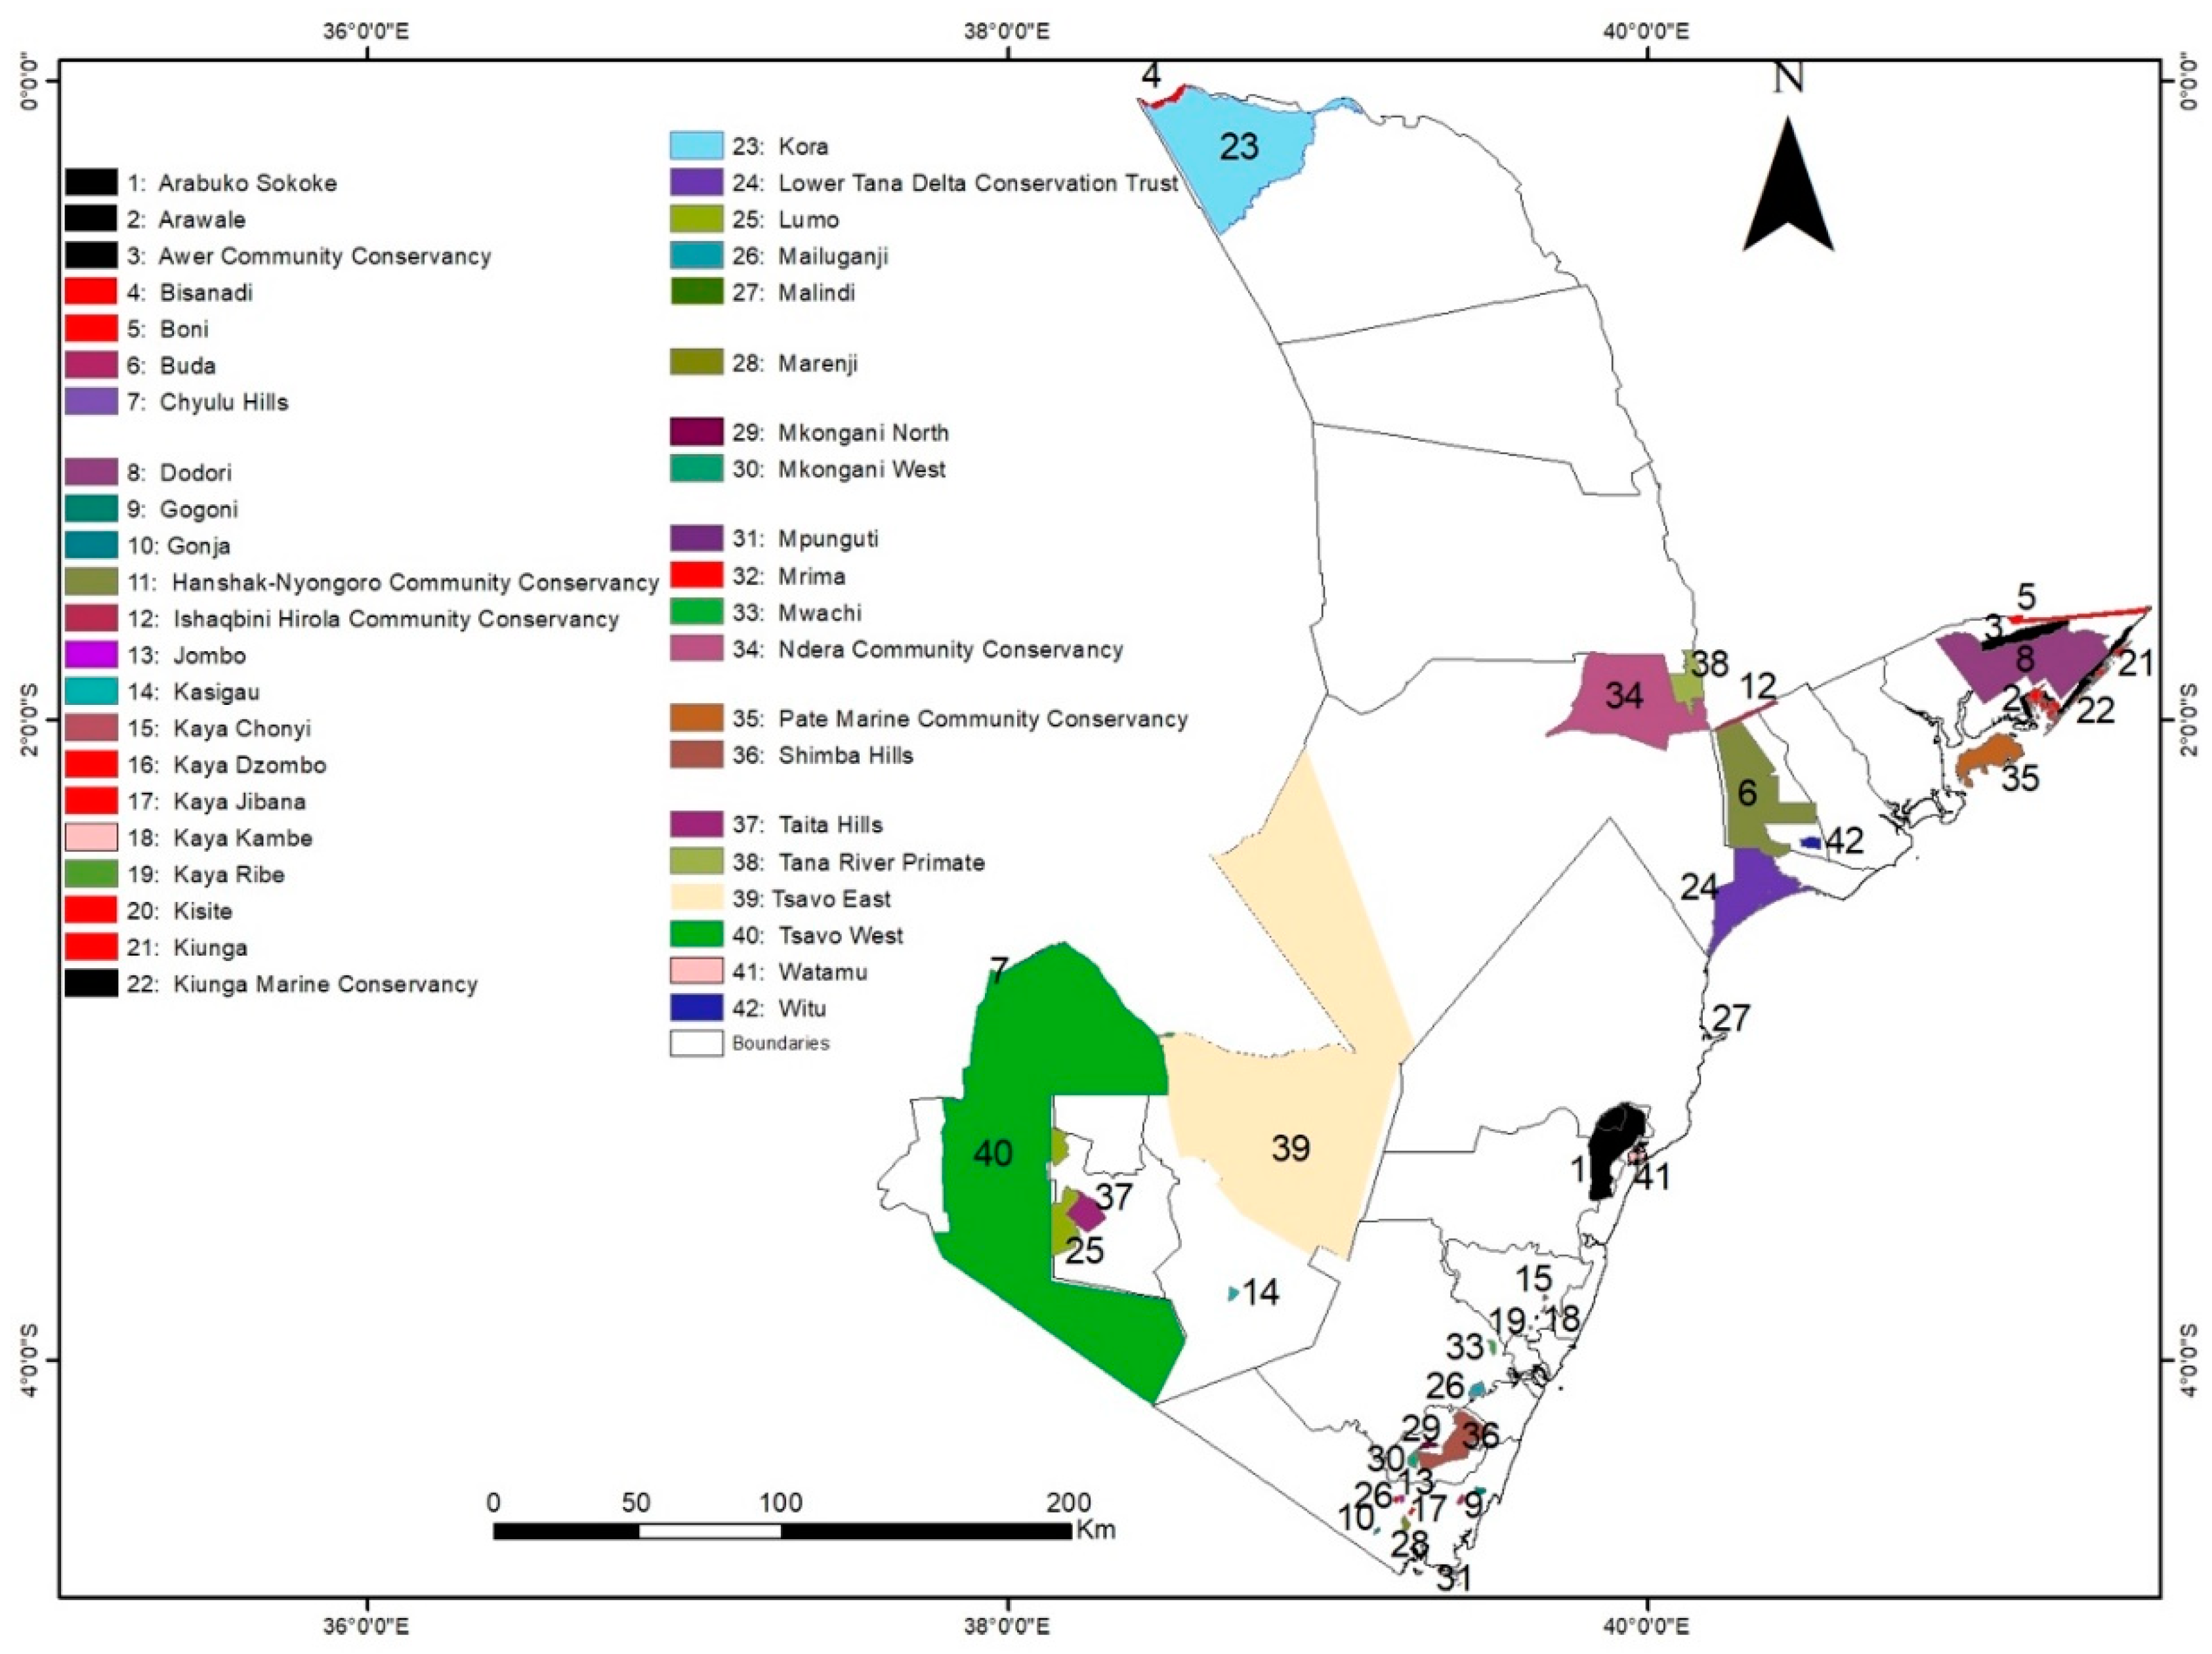
Figure 3.
Average monthly rainfall (mm) for the Coast of Kenya.

Figure 4.
Slope map of a coastal area of Kenya.
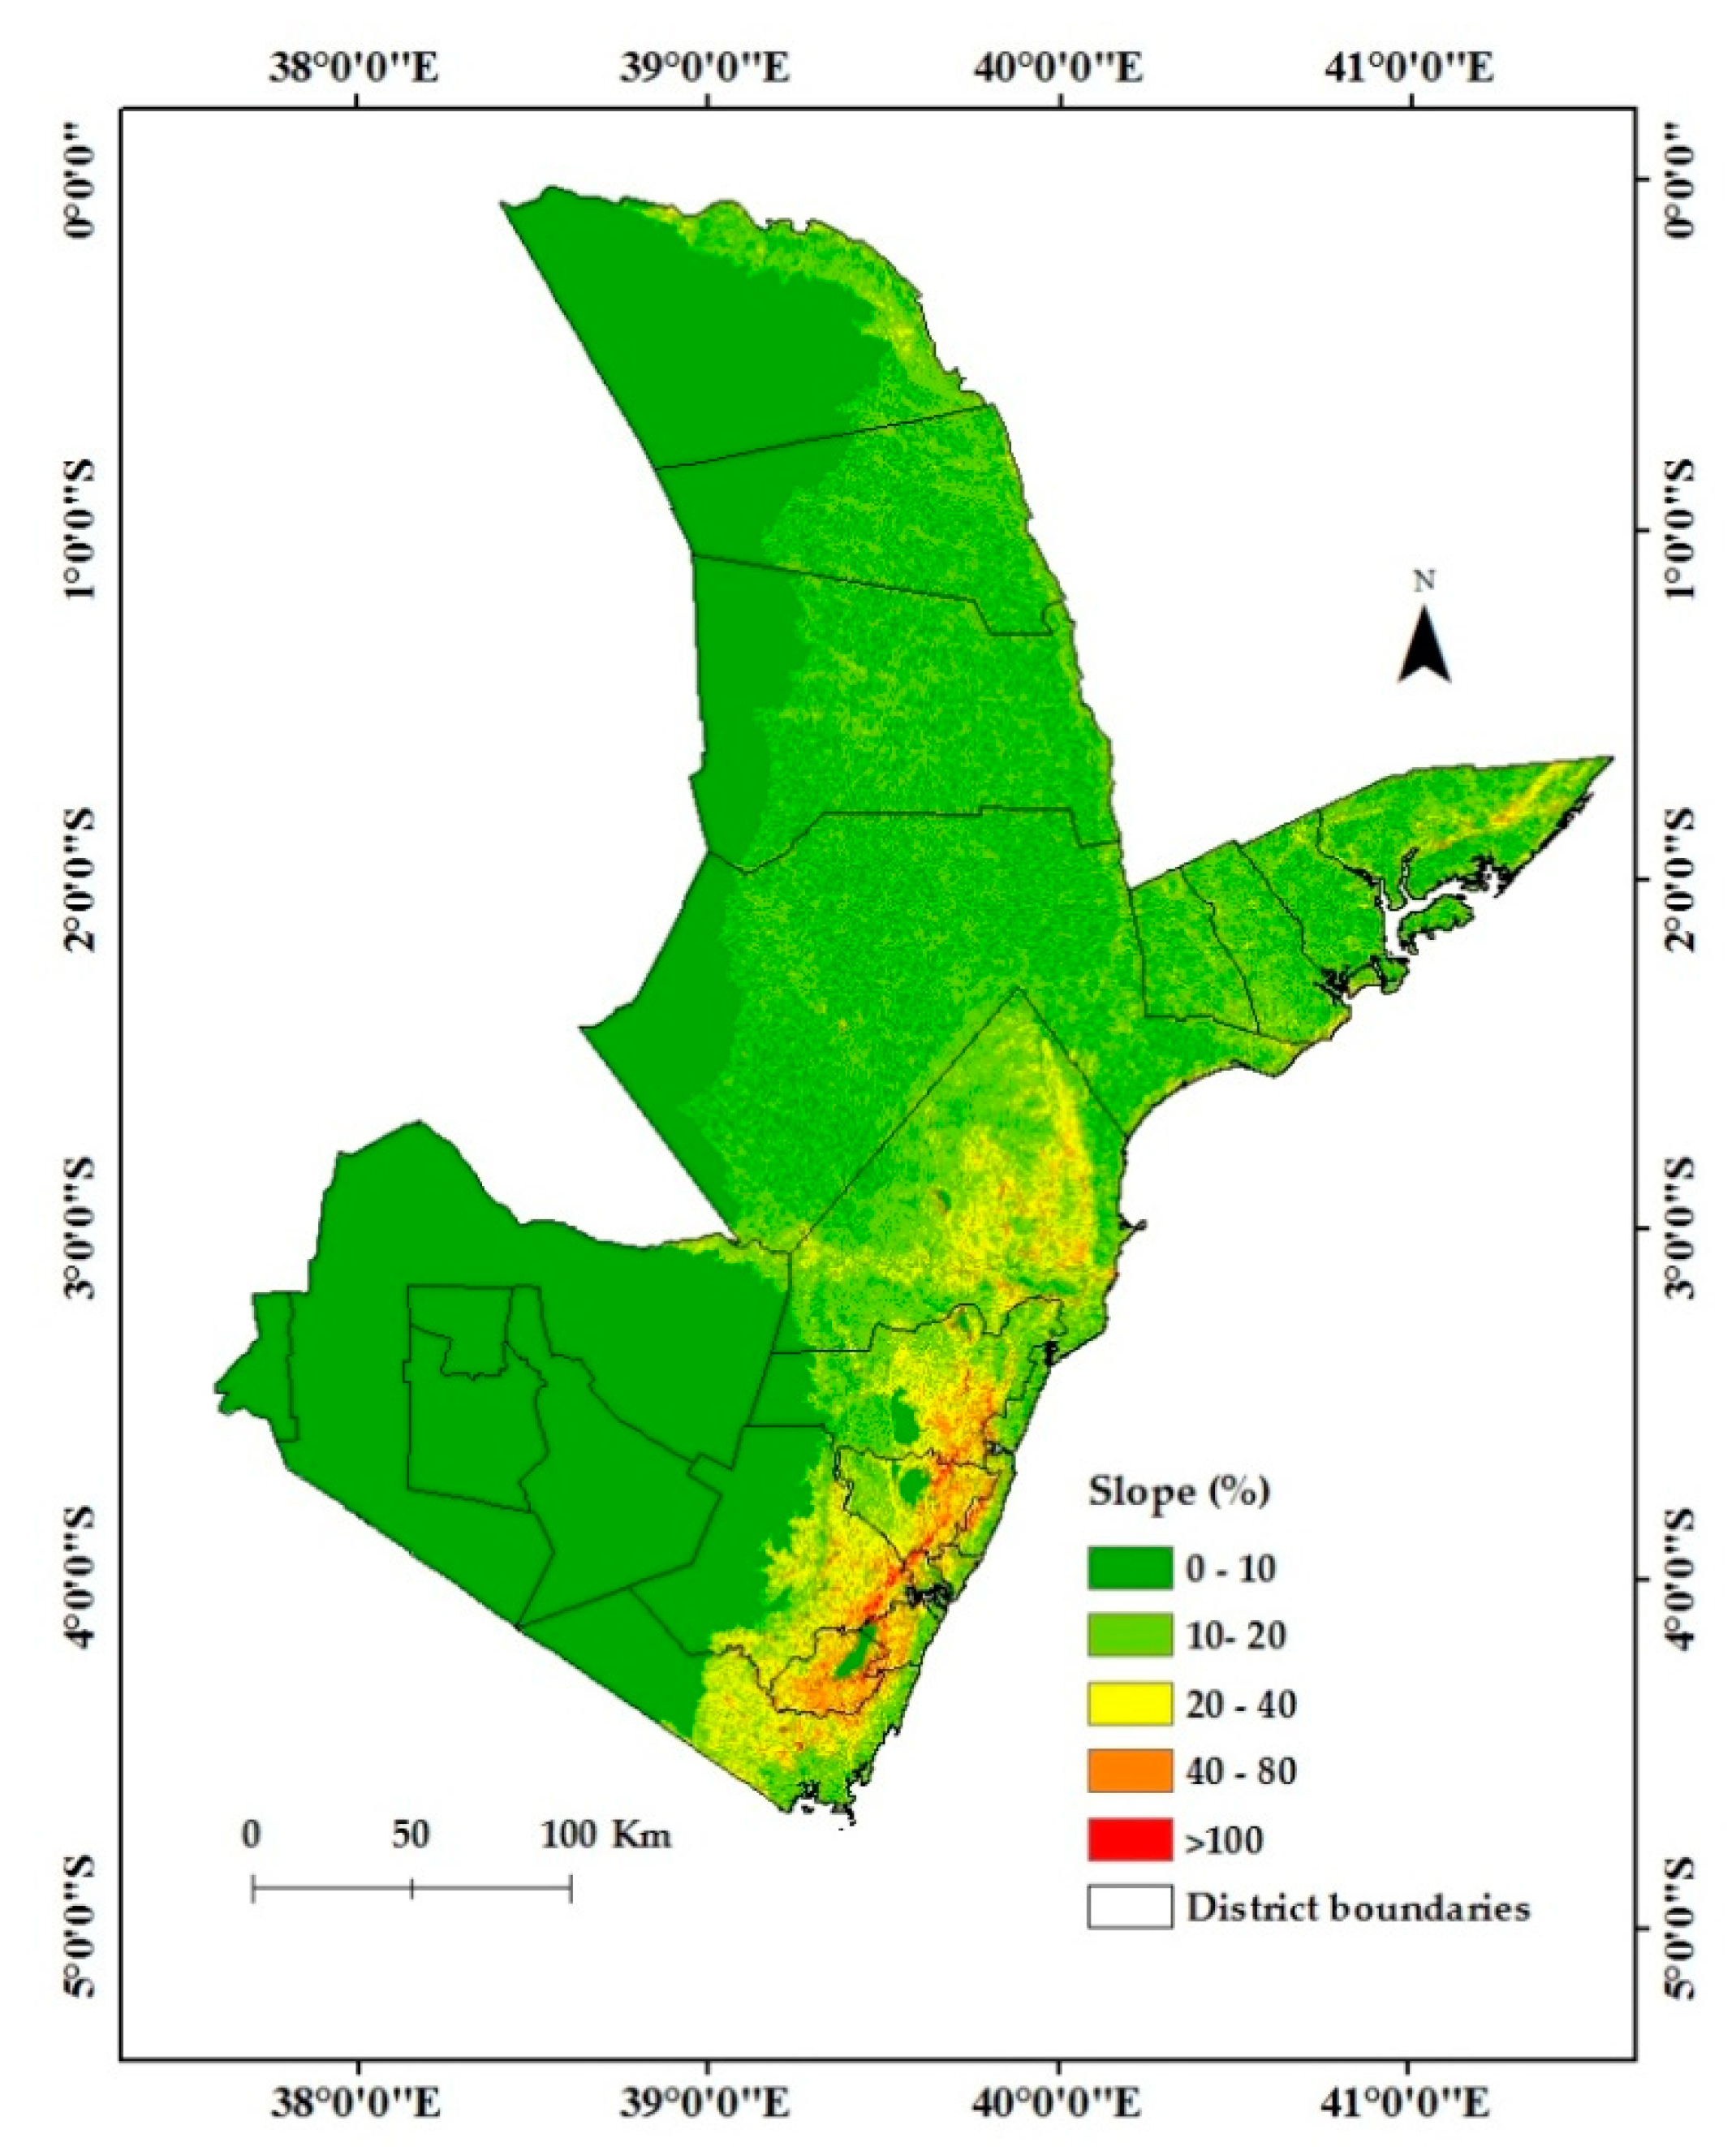
Figure 5.
Maps of the RUSLE factors: (a) Rainfall erosivity factor calculated after Panagos et al. (2017) [26]; (b) Soil erodability factor (K) calculated after Fenta et al. (2020) [69]; (c) Cover management factor calculated after Alexandridis et al. (2015) [23]; (d) Slope length and steepness factor calculated after Panagos et al. (2015b) [41]; and (f) land use and land cover map calculated after Schürz et al. (2019) [71].
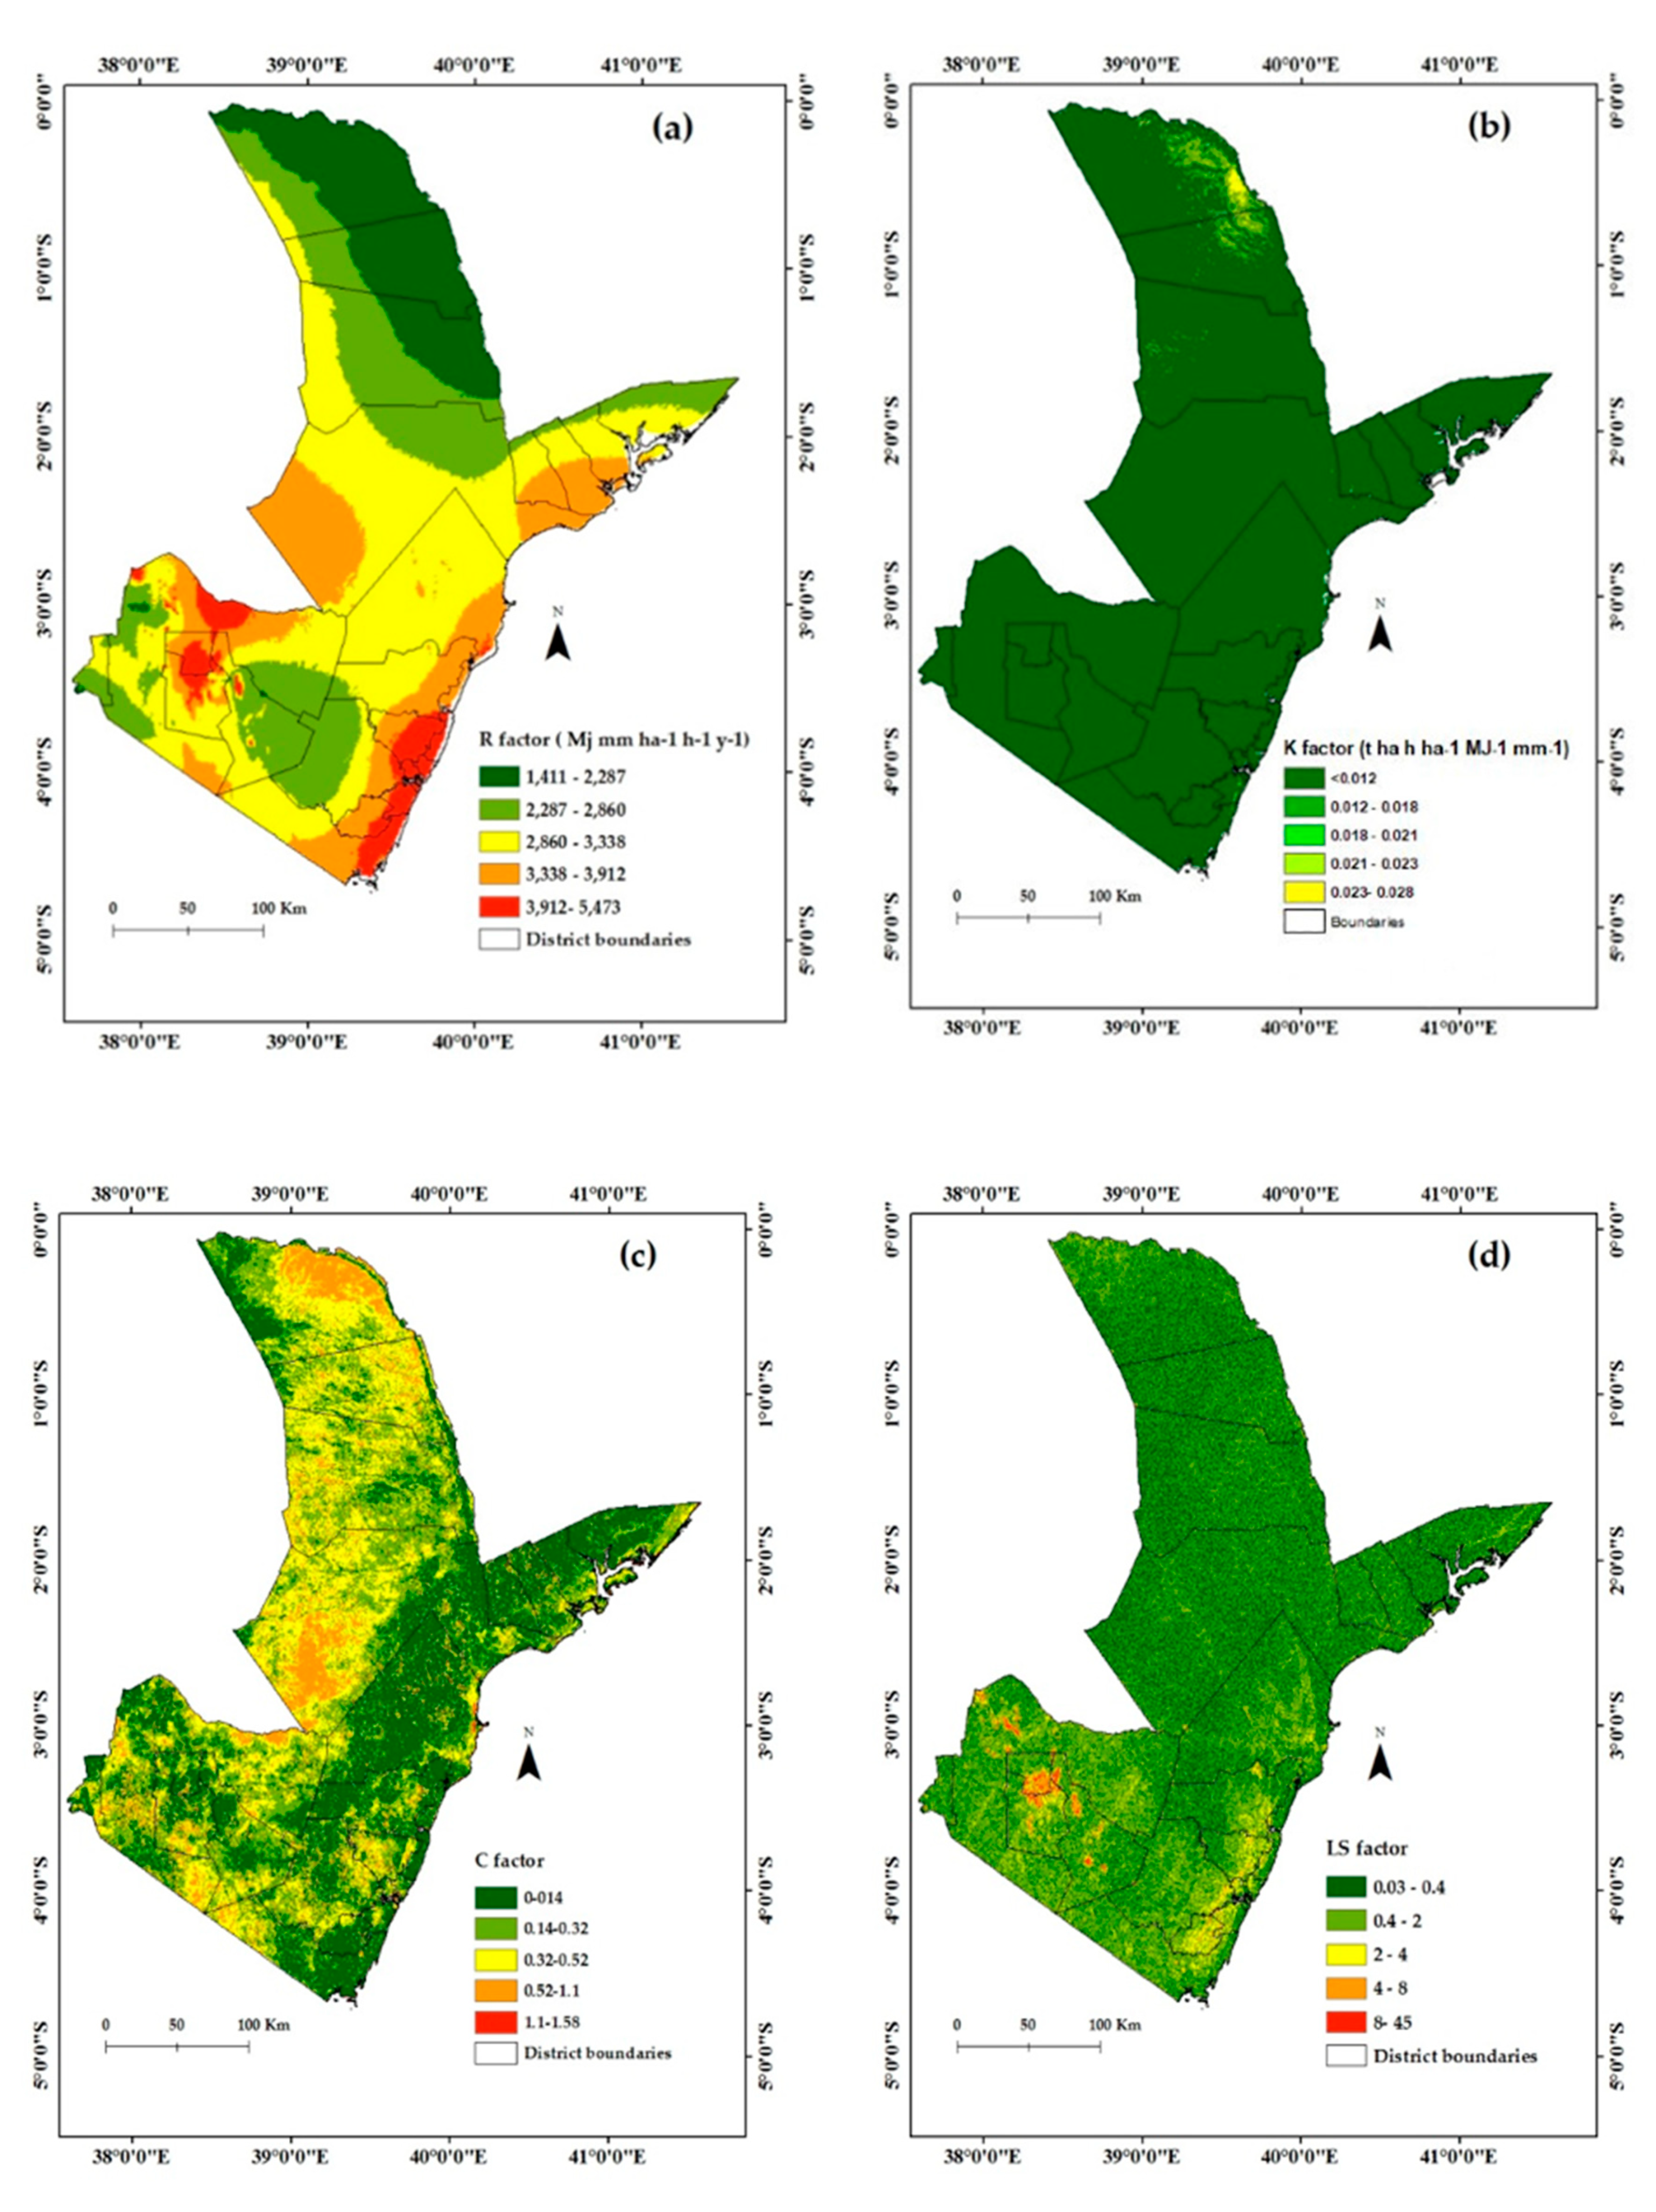

Figure 6.
Map of estimated soil erosion rates for the coastal area.


Table 1.
Principal data sources.
| Factor. | Environmental Variables | Resolution | Sources |
|---|---|---|---|
| Terrain | DEM | 30 m | Shuttle Radar Topography Mission (SRTM) |
| Slope | 30 m | Shuttle Radar Topography Mission (SRTM) | |
| Flow accumulation | 30 m | Shuttle Radar Topography Mission (SRTM) | |
| Aspect | 30 m | Shuttle Radar Topography Mission (SRTM) | |
| Topographic | 30 m | Shuttle Radar Topography Mission (SRTM) | |
| Climate | Mean annual rainfall | https://earthengine.google.com/ | |
| Vegetation | NDVI | 30 m | (https://earthexplorer.usgs.gov/) |
| Land | Land use land cover | 20 m | RCMD GeoPortal ( http://geoportal.rcmrd.org/ ) |
| Soil | Soil type | http://www.isric.org/data/afsoilgrids250m) | |
| Sand | http://www.isric.org/data/afsoilgrids250m) | ||
| Silt | http://www.isric.org/data/afsoilgrids250m) | ||
| Clay | http://www.isric.org/data/afsoilgrids250m) | ||
| Organic carbon | http://www.isric.org/data/afsoilgrids250m) |
Table 2.
Average soil loss per land cover and land use types.
| Land Use Land Cover | Area in Sq. mi | Area (%) | Average Soil Loss (t·ha−1·y−1) |
|---|---|---|---|
| Tree Cover areas | 7.0974 | 5.39 | 6.21 |
| Shrubs Cover areas | 69.27576 | 52.6 | 6.23 |
| Grassland | 46.01648 | 34 | 6.43 |
| Cropland | 8.36488 | 6.35 | 9.14 |
| Aquatic Vegetation | 0.074074 | 0.06 | 5.345 |
| Sparse vegetation | 0.159122 | 0.12 | 6.92 |
| Bare areas | 0.449932 | 0.34 | 7.66 |
| Built up areas | 0.165981 | 0.13 | 17.52 |
| Open Water | 0.097394 | 0.07 | 0 |
| Total | 131.701 | 100 % |
Table 3.
Mean estimated soil loss rates per district level in the coastal area of Kenya.
| District Name | Mean Soil Loss (t·ha−1·y−1) |
|---|---|
| Amu | 2.61 |
| Witu | 2.71 |
| Kiunga | 2.75 |
| Madogo | 3.89 |
| Bura | 4.42 |
| Galole | 4.52 |
| Mpeketoni | 4.54 |
| Malindi | 4.87 |
| Taveta | 4.9 |
| Faza | 6.1 |
| Garsen | 6.19 |
| Bahari | 6.54 |
| Ganze | 6.66 |
| Voi | 7.1 |
| Msambweni | 7.62 |
| Kinango | 9.07 |
| Tsavo National Park (E&W) | 9.12 |
| Island | 9.9 |
| Kubo | 14.36 |
| Mwatate | 15.9 |
| Kisauni | 16.23 |
| Matuga | 19.32 |
| Kalolenli | 19.709 |
| Wundanyi | 26.51 |
| Changamwe | 26.7 |
| Likoni | 27.9 |
Table 4.
Mean estimated soil loss rates of the protected areas in the coastal area of Kenya.
| Name of Protected Area at the Coast | Mean Soil Loss (t·ha−1·y−1) |
|---|---|
| Kaya Dzombo | 0.13 |
| Witu | 0.31 |
| Kaya Ribe | 0.42 |
| Kaya Jibana | 0.49 |
| Mkongani West | 0.53 |
| Buda | 0.8 |
| Kaya Chonyi | 0.94 |
| Kasigau | 1.12 |
| Awer Community Conservancy | 1.32 |
| Marenji | 1.39 |
| Kaya Kambe | 1.67 |
| Kora | 2.47 |
| Hanshak-Nyongoro Community Conservancy | 2.58 |
| Tana River Primate | 2.59 |
| Dodori | 3.24 |
| Arabuko Sokoke | 3.47 |
| Ndera Community Conservancy | 3.54 |
| Mrima | 3.69 |
| Lower Tana Delta Conservation Trust | 4.56 |
| Watamu | 5.05 |
| Jombo | 5.94 |
| Pate Marine Community Conservancy | 6.19 |
| Kiunga Marine Conservancy | 6.48 |
| Gogoni | 7.41 |
| Kiunga | 8.5 |
| Mkongani North | 8.63 |
| Lumo | 8.67 |
| Mwachi | 8.72 |
| Tsavo East | 8.86 |
| Tsavo West | 9.33 |
| Taita Hills | 11.12 |
| Mailuganji | 13.75 |
| Shimba Hills | 15.06 |
| Gonja | 18.52 |
© 2020 by the authors. Licensee MDPI, Basel, Switzerland. This article is an open access article distributed under the terms and conditions of the Creative Commons Attribution (CC BY) license (http://creativecommons.org/licenses/by/4.0/).
Share and Cite
MDPI and ACS Style
Hategekimana, Y.; Allam, M.; Meng, Q.; Nie, Y.; Mohamed, E. Quantification of Soil Losses along the Coastal Protected Areas in Kenya. Land 2020, 9, 137. https://doi.org/10.3390/land9050137
AMA Style
Hategekimana Y, Allam M, Meng Q, Nie Y, Mohamed E. Quantification of Soil Losses along the Coastal Protected Areas in Kenya. Land. 2020; 9(5):137. https://doi.org/10.3390/land9050137
Chicago/Turabian StyleHategekimana, Yves, Mona Allam, Qingyan Meng, Yueping Nie, and Elhag Mohamed. 2020. "Quantification of Soil Losses along the Coastal Protected Areas in Kenya" Land 9, no. 5: 137. https://doi.org/10.3390/land9050137
Note that from the first issue of 2016, this journal uses article numbers instead of page numbers. See further details here.