Article

Regional Economic Sustainability: Universities’ Role in Their Territories

by
Dolores Gallardo-Vázquez
1,* and
José A. Folgado-Fernández
2
1
Department of Financial Economics and Accounting, Faculty of Economics and Business, University of Extremadura, 06006 Badajoz, Spain
2
Department of Financial Economics and Accounting, Faculty of Business, Finance and Tourism, University of Extremadura, 10071 Cáceres, Spain
*
Author to whom correspondence should be addressed.
Land 2020, 9(4), 102; https://doi.org/10.3390/land9040102
Submission received: 8 March 2020 / Revised: 23 March 2020 / Accepted: 26 March 2020 / Published: 28 March 2020

Abstract

:
The sustainability of territories (e.g., regions and countries) is currently an issue that should be considered when implementing organizational strategies. The globalization, industrialization, and population growth trends observed in recent decades have forced experts to adopt a sustainable approach capable of guaranteeing that a population’s present needs can be met without compromising future generations’ well-being. Among the essential pillars of successful sustainability strategies, social development stands out as quite important, so the present study focused on it. Social development strategies include ensuring a satisfactory level of education while simultaneously fostering an adequate quality of life and long-term sustainability. Thus, this study’s objective was to gain a clearer understanding of universities’ role as promoters of education and generators of populations that become more deeply rooted in their territory of origin. One public university, the University of Extremadura in Spain, was found to play a unique, specific role in its region, as this institution has quite unique characteristics that differentiate it from other nearby universities. This study measured the regional population’s preferences by assessing an interest group’s levels of satisfaction and by observing the influence of quality and innovation on this group’s perceptions of the public university’s operations. A questionnaire was prepared and distributed electronically to all University of Extremadura students. The final sample consisted of data from 362 questionnaires, which were analyzed using structural equation modeling. The results indicated that the students’ perceptions of this institution’s innovation and quality are determinants of their satisfaction levels. In addition, this university is considered to be a reason to remain in the region, promoting residents’ sense of belonging and helping consolidate the region as a sustainable area.

1. Introduction

With the publication of the Brundtland Report under the title Our Common Future [1], a vision was created of organizations’ economic development being linked to environmental and social sustainability. Globalization has fostered an excessive focus on social advancement regardless of its extremely high costs, which include aggravated economic problems, so experts have had to rethink existing policies. In the cited report’s vision, the idea of sustainability prevails as a way to avoid current development’s negative consequences by developing solutions to observed problems [2].
In this context, researchers have argued that the sustainability of territories (e.g., regions and countries) is an issue that should be considered when implementing organizational strategies. The globalization, industrialization, and population growth trends observed in recent decades have forced experts to adopt a sustainable perspective capable of guaranteeing that present needs can be met without compromising future generations’ well-being [3]. Thus, all types of organizations (e.g., companies, institutions, and public administrations) have begun to implement initiatives and voluntarily act in a manner that falls under the umbrella of corporate social responsibility (CSR).
This strategy is considered to be a tool capable of achieving the desired sustainable development. The European Union’s (EU) well-known “Green Book, Promoting a European Framework for Corporate Social Responsibility” [4] considers CSR to be companies’ voluntary integration of social and environmental concerns into their business operations and into their interactions with stakeholders. In 2011, this definition was expanded by the EU [4] to include firms’ responsibility for their impact on society. An explicit reference was made to the need to collaborate with stakeholders in order to address social, environmental, and ethical concerns and to respect human rights and consumers’ concerns about business operations and core strategies [5].
CSR’s importance has continued to grow in recent years. Currently, numerous organizations are seeking to implement socially responsible strategies, knowing that they can provide sustainable competitive advantages [6,7]. Larger companies started to develop these initiatives earlier. Small and medium enterprises are aware of this issue’s importance, but they have more difficulty applying CSR strategies because of their limited resources. In addition, the existing literature indicates that other companies, such as cooperatives, foundations, and nonprofit entities, are paying attention to a triple-bottom-line framework.
Institutions of higher education or universities have also started following this path, and studies have reported that this strategy now permeates numerous universities’ operations [8]. These institutions are working toward sustainability in their regions in order to ensure their society and the planet have a future. Universities are seeking to improve their contributions to economic development, minimize environmental impacts, and ensure the social development of their communities and regions, with the ultimate goal of contributing to maintaining their countries’ prosperity [9].
Thus, higher education institutions play an important role in contemporary societies, serving as an integrating force within territories and a determinant of sustainable economic development. Universities must not only become an integral part of the processes that educate people who are critical, responsible, committed, and consistent, but they must also be able to respond to their society’s demands for a set of responsible values that foster sustainability. The latter is based on three basic pillars: economic growth, environmental protection, and social development. Of these, social development stands out as the most essential, so the present study focused on this aspect. For universities, the central question to address is how to provide a satisfactory level of education; however, at the same time, these institutions’ programs have an impact on regions’ ability to generate an adequate quality of life and long-term sustainability [10].
Stakeholder theory indicates that all of the relevant agents currently involved in organizations have to be satisfied, so every organization has to look out for its stakeholders’ best interests. Universities have many interest groups, including teachers, service and administration staff, students, local administrators, unions, companies, employers, families, and society in general [11]. The present research focused on a particular, extremely important group of stakeholders: students. Kosta [12] has said that students’ voices are gradually becoming a crucial component of universities’ development, stating that a comprehensive understanding of student sustainability must emerge. This study sought to extract information about their satisfaction with Spain’s University of Extremadura as an indicator of students’ intent to remain in the Extremadura region.
The research was designed to gain a fuller understanding of the university’s role as a promoter of education and a generator of deeper roots in students’ region of origin. A higher education system’s development and expansion determine its contribution to economic growth, improved living standards, and a growing demand for education among qualified candidates, as well as satisfied interest groups [13]. The current study examined the regional population’s preferences based on an assessment of a single interest group’s satisfaction (i.e., students), as students are the most receptive of the region’s younger generations [13]. The objective was to observe how the quality of and innovation within the institution’s operations influence this group’s perceptions. The specific role played by this public university makes it unique in the Extremadura region of Spain, giving the institution critical characteristics that differentiate it from other nearby universities.
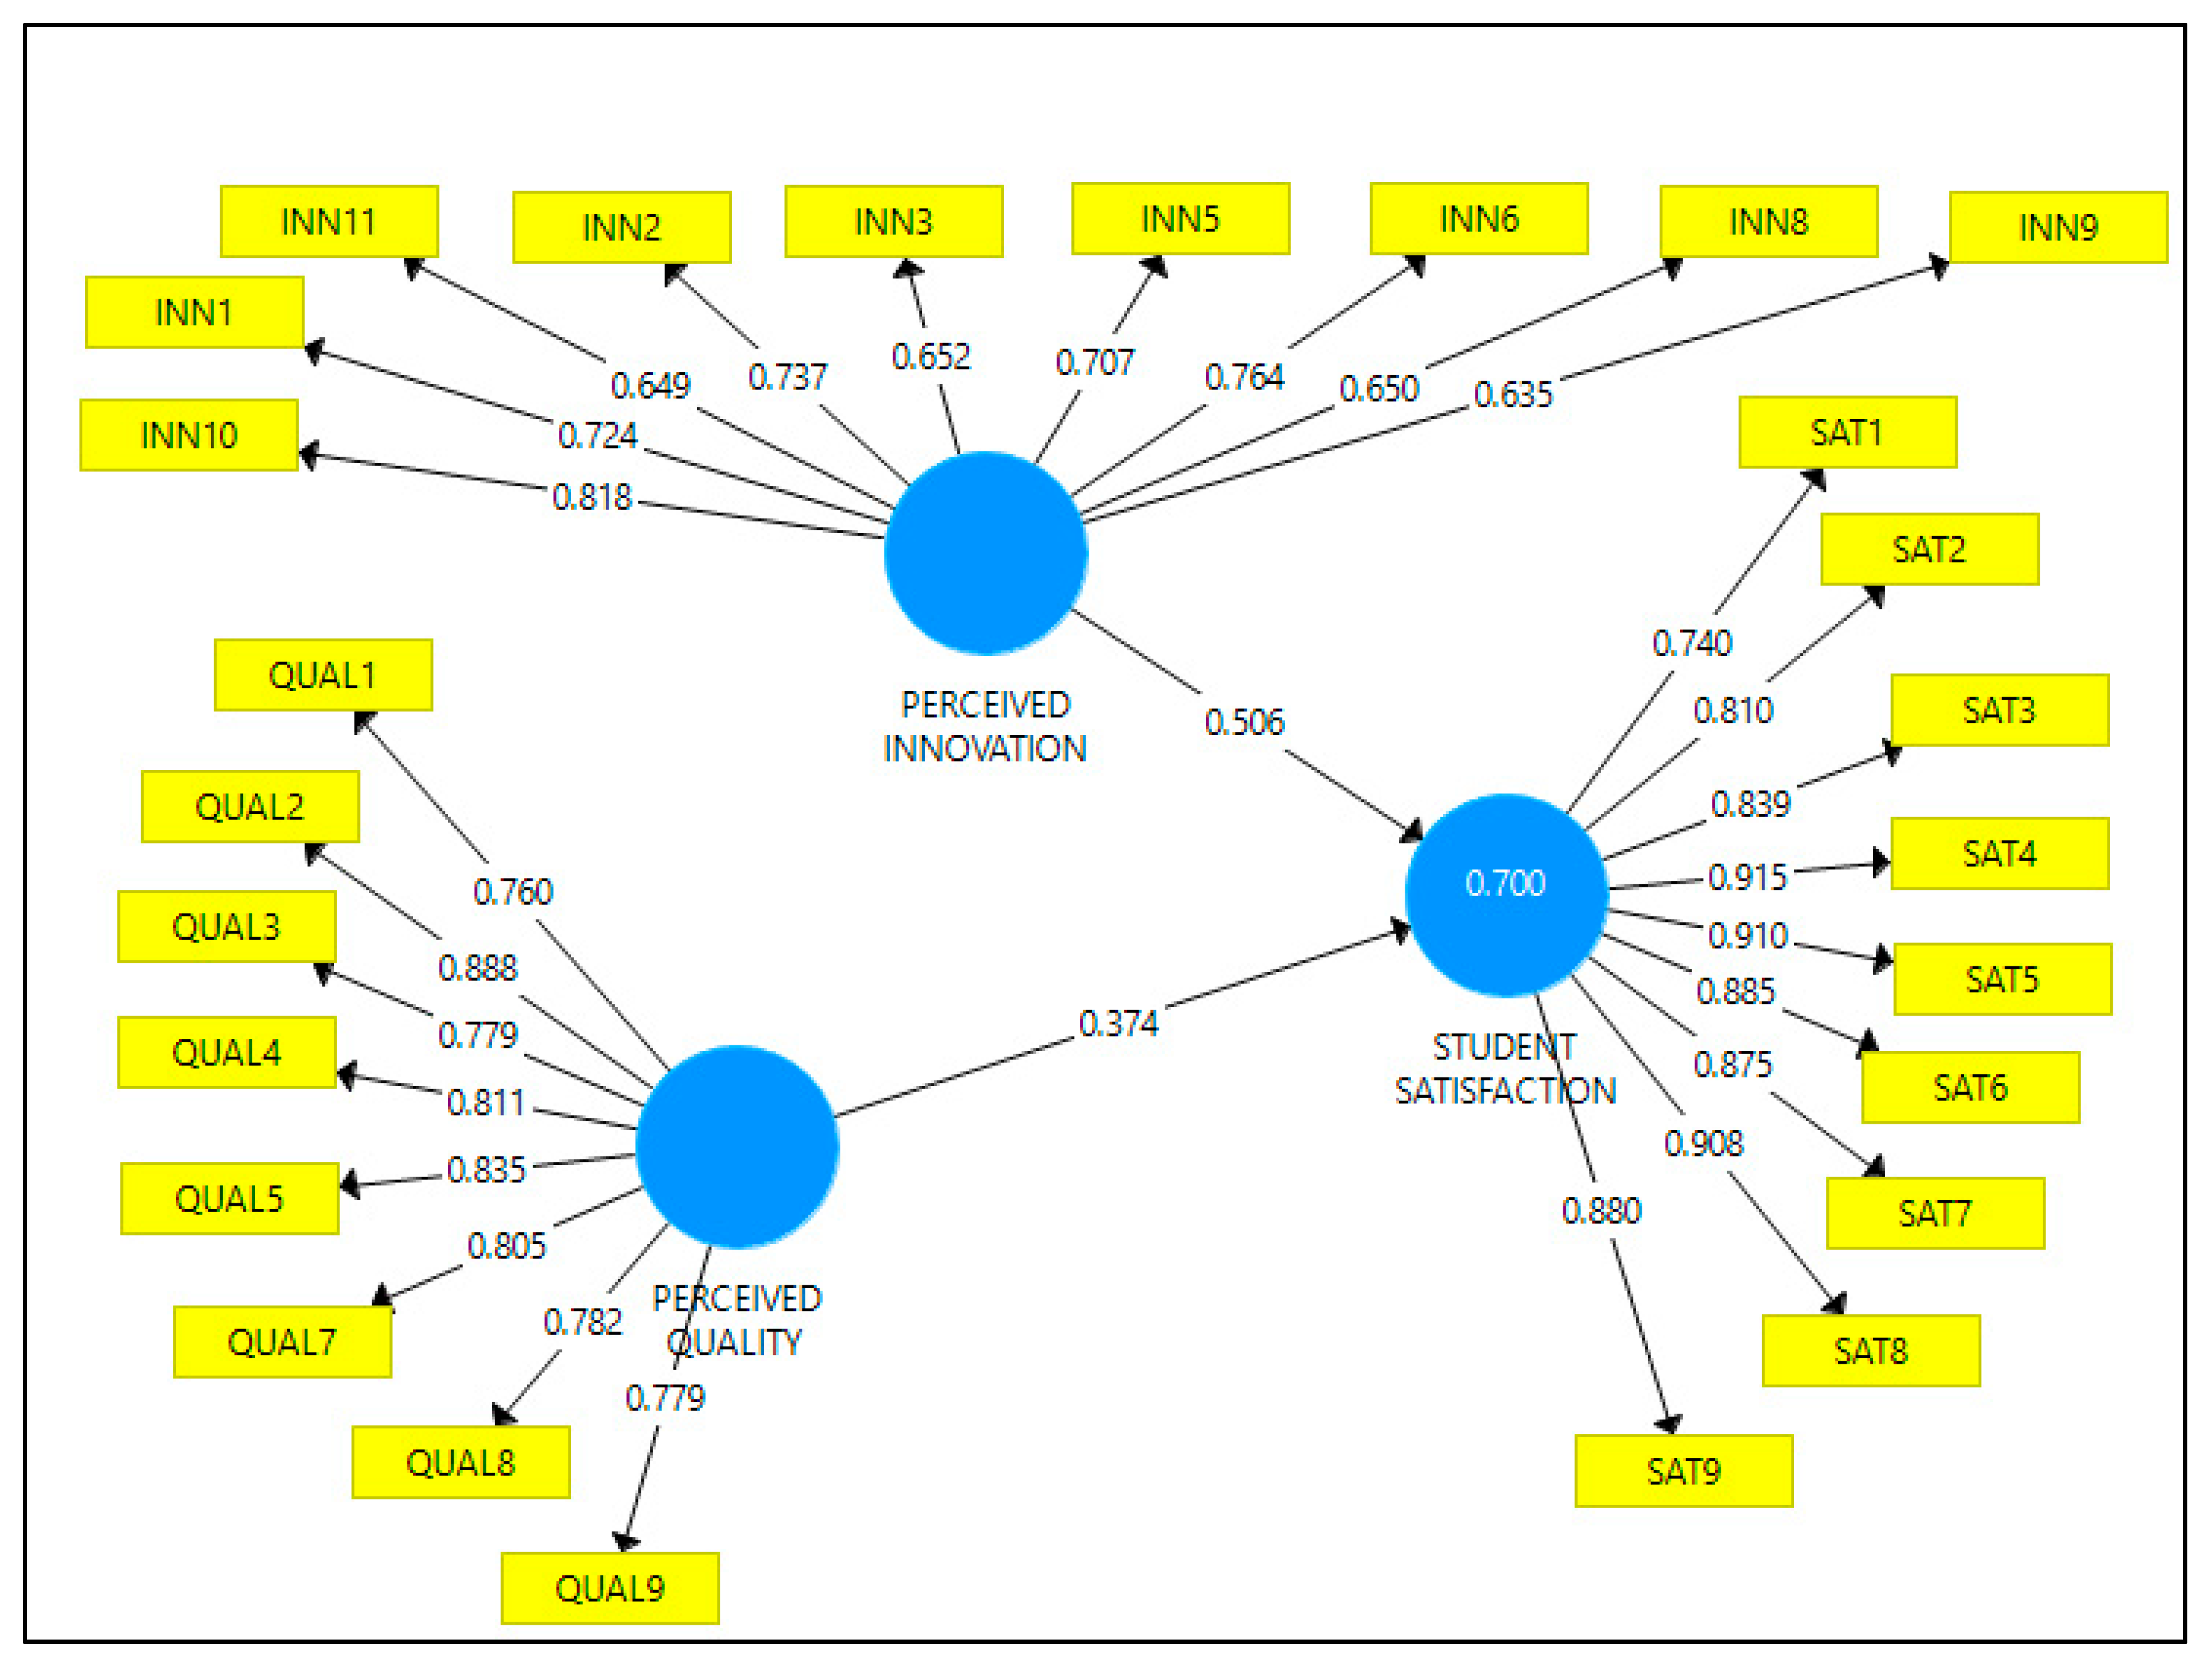
A questionnaire was prepared and then distributed electronically to all students at the University of Extremadura. The final sample consisted of data from 362 questionnaires, which were analyzed using structural equation modeling. The results indicate that students’ perceptions of both innovation and quality are determinants of their level of satisfaction, and the latter is considered to be a reason to remain in the region, thereby promoting a sense of belonging to Extremadura and its consolidation as a sustainable area.
The results offer various interesting contributions to existing knowledge. First, the findings contribute to the literature on the economy and sustainability of territories with a low population density, including identifying factors that determine residents’ decisions to stay in these regions and thus contribute to their sustainable development and that of society. Second, the results further the assessment of higher education’s role in advancing economic sustainability, as the study was conducted in the context of a public university. Last, as can be seen from the above contributions, the findings contribute to the literature related to university social responsibility, a strategy that many universities have recently begun to implement.
This paper is structured into eight parts. After this introduction, an analysis of the territory under study (i.e., the Extremadura region of Spain) is presented. The specific public university’s role as a factor in regional economic sustainability is then discussed. The next sections detail the research hypotheses, methods, and results. The paper ends with a discussion of the results and the conclusions reached in the study, as well as its limitations and future lines of research.

2. Spain’s Extremadura Region

Extremadura is one of 17 Spanish autonomous communities. It is located in the southwest part of the Iberian Peninsula, bordering Portugal to the west. The community of Castilla y León lies to the north (i.e., the provinces of Salamanca and Ávila), Castilla La Mancha is to the east (i.e., the provinces of Toledo and Ciudad Real), and Andalusia is to the south (i.e., the provinces of Huelva, Seville, and Córdoba).
The region under study is composed of the two largest provinces in the country: Badajoz and Cáceres. The total population in the region was 1,067,710 inhabitants in 2019, which is 2.3% of Spain’s population. Of these, 673,559 inhabitants live in the province of Badajoz, which is the largest in Spain, with an area of 21,766 square kilometers (km2) and a population density of 31.07 inhabitants/km2. The remaining 394,151 inhabitants live in Cáceres, which is the second largest province in Spain after Badajoz, with an area of 19,868 km2 and a population density of 19.69 inhabitants/km2 [14]. The region’s geographical density is 25.71 inhabitants/km2, which is well below the average for Spain.
Extremadura has an area of 41,633 km2, and the region is located in the fifth largest autonomous community of Spain in terms of total area. Of the municipalities that make up the two provinces, 161 are in the province of Badajoz, and 219 are in the province of Cáceres. Extremadura’s population is extremely irregularly distributed. The capital of Badajoz has 150,702 inhabitants, which makes it the region’s only city with over 100,000 inhabitants. The next largest cities are Cáceres with 96,126 residents, Mérida with more than 50,000, and Plasencia with over 40,000. Nine municipalities have more than 10,000 people, while about 220 municipalities have under 1000 inhabitants. Finally, 10 municipalities’ populations do not top 100 residents. Thus, the population distribution is quite irregular, as the region has many municipalities with extremely diverse population densities and a marked tendency toward large rural areas [14].
From a geographical point of view, Extremadura offers natural parks, reserves, lakes, mountains, and forests that together constitute major physical resources, such as the Central System, Montes de Toledo, and Sierra Morena. Two of the most important rivers of the Iberian Peninsula pass through the region: the Tajo in the province of Cáceres and the Guadiana in Badajoz. The region is characterized by warm weather in the south and a more temperate climate in the north. These climatic and geographical features contribute to making it a widely visited region throughout the year. The important places to visit are strongly promoted, and the weather helps make touring different cities and sites enjoyable. Among the places of greatest interest in terms of tourism and heritage are Cáceres, Mérida, and Guadalupe, which are listed as World Heritage Sites. In addition, the region has protected natural areas, such as the Monfragüe Biosphere Reserves, Siberia Extremeña, and Villuercas–Ibores–Jara Geopark. All of the aforementioned cities and natural spaces have been favorably mentioned and granted awards by the United Nations Educational, Scientific, and Cultural Organization [15].
With regard to the region’s economy, it has a consumer price index of 104,664, with an interannual variation of 0.7%. Estremadura has 67,687 companies, with an activity rate of 55.66 euros and an unemployment rate of 23.48%.
Overall, Extremadura is an extremely attractive region to visit and in which to live. A necessary element of this is its proximity to important cities with a large number of inhabitants and a rich cultural heritage, which are extremely attractive to university students. More specifically, the cities of Madrid, Salamanca, and Seville are key to Extremadura residents’ quality of life. These three cities have universities with a long history, a wide range of academic programs, and numerous cultural and recreational resources, which make life in these urban centers extremely attractive. For these reasons, the younger inhabitants of Extremadura often decide to get a university education in these other cities instead of staying inside their region of origin. Nonetheless, the University of Extremadura is considered to be an institution capable of motivating younger residents in the surrounding region to stay, encouraging them to put down roots in their own territory and thus ensuring that graduates remain in the region. The next section presents the University of Extremadura’s characteristics within this specific context.

3. The University of Extremadura’s Role in the Region

3.1. Characteristics of the University of Extremadura

The University of Extremadura was created in 1973, so it has over 47 years of experience providing higher education. As the only university in the region, this institution’s history and operations are closely linked to the Extremaduran community, influencing regional society while also being shaped by it. The university has four campuses—Badajoz, Cáceres, Mérida, and Plasencia—in which more than 32,000 undergraduate, postgraduate, and doctoral students are enrolled. They are an important interest group in terms of both their numbers and their participation in learning processes. About 1500 professors and more than 800 administration and services professionals work with the students, also constituting groups of great importance in the university’s operations.
The University of Extremadura’s mission as an educational and vocational training institution means its programs have a broad, diverse configuration. In addition to the eight vice-rectors who work under the current rector, a set of secretariats, units, offices, services, and associations collaborate to ensure the institution functions properly. These professionals engage in numerous activities to fulfill the university’s commitment to all its interest groups (e.g., teachers, students, administration and services staff, companies, labor unions, and public administrations). Some of the most important components of the university are the Student Attention Unit, Technical Evaluation and Quality Unit, Office of Quality and Strategy, Office of University Social Responsibility, and Office of Mediation.
In all of these divisions, the staff seek to develop initiatives that generate links with society and attract students, encouraging them to remain in the region, educating them, and trying to ensure that graduates stay in Extremadura. In this way, the university contributes to local social and regional development, shaping how the surrounding territory moves forward and contributing to its sustainability. Three aspects characterize the University of Extremadura’s operations—social commitment, economic development, and regional promotion—all of which focus on increasing the region’s sustainability.

3.2. Group 9 (G9) Context

The University of Extremadura is a unique university in its region, but the university is also a member of the G9 nonprofit association, which was formed by public universities from each of Spain’s autonomous communities and other universities, including Cantabria, Castilla La Mancha, Islas Baleares, La Rioja, Oviedo, País Vasco, Pública of Navarra, and Zaragoza. The G9 was created in 1997 to achieve a common social goal: to promote collaboration between the member universities not only with regard to instruction and research activities, but also with regard to management and services. This group thus contributes to strengthening these universities’ academic activities [16].
The member universities’ operations are enhanced in many different fields. For example, from an academic and instructional point of view, the G9 favors the exchange of teaching staff, stimulates student mobility between universities, develops postgraduate training courses, facilitates information exchange, and promotes doctoral students’ participation in joint programs. With regard to scientific research, other initiatives have been pursued, such as personnel training to consolidate research groups, joint efforts to respond to calls for research, and the transference of key cooperative projects to the regional governments of autonomous communities. The G9 also facilitates the use of all available means to encourage the completion of doctoral theses, among other related goals. In addition, these universities collaborate in diverse areas in order to organize meetings, seminars, conferences, and joint cultural and social activities.
Over the years, this collaboration has focused on strengthening the G9 members’ validity through programs, such as a shared virtual campus, which have enhanced the implementation of the Bologna Process and have made the European university system more attractive. These improvements have been beneficial for students’ mobility and employability, as well as for increasing the G9 institutions’ competitiveness. In this way, the group has encouraged a better, more extensive virtualization of the courses offered by each participating university [16].
All of these initiatives have ensured that virtual mobility has become a strategic tool for member universities, contributing to their sustainability within their regions [17,18]. Concurrently, e-learning methods for teaching university courses have been applied through the shared virtual campus. These innovations have led to important advances in how the European Higher Education Area is configured [19,20]. However, the advantages are countered by disadvantages, such as the absence of face-to-face communication between teachers and students. This is not just an inconvenience: these limitations require new models for how instructors advise students using this type of virtual education in order to ensure online courses work well [21]. The G9 virtual campus helps facilitate tutoring, but requires training teachers on how to use the campus. Overall, these innovations will ultimately generate more student satisfaction and be perceived as necessary for quality instruction in university contexts.
In this way, integrating innovation and quality in the context of a university network involves a holistic and comprehensive approach to education in relation to (i) the content of what is being learned; (ii) the process of how to teach and learn; (iii) the environment in which learning happens and with whom one is learning; and (iv) in what socioeconomic, cultural, and political context learning is happening.

4. Hypotheses Development

Sustainability initiatives in universities have increased over the past years. However, the impact of such initiatives on students has not been formally estimated [12]. Some previous research [22] has indicated there is no formal process to achieve such an estimation, despite the importance of knowing the opinion of this important interest group. A starting point is having a broad and consistent definition of sustainability for the context of higher education [23,24]. Due to the lack of this definition, some authors have focused on university students’ perceptions in general [25], with the absence of references to sustainability at universities. Other authors have addressed sustainability in the university curriculum [26] and the university management [27]. This limited research should go further, analyzing students’ attitudes and their knowledge of sustainability through other variables under study. Given this, in this paper we focused on innovation and quality, as perceived by students, as well as on the satisfaction they obtain from sustainable management in the university.
Innovation activities can enhance differentiation in organizations and institutions [28,29]. The Organization for Economic Cooperation and Development’s “Oslo Manual” [30] defines innovation as the process of adopting, improving, and/or making significant changes to products or processes as part of organizational management, in order to improve business results. In managerial contexts, a relationship exists between innovation and sustainability [31].
More specifically, Larrieta-Rubín de Celis et al. [32] have reported that innovation contributes to sustainability, local socioeconomic development, and competitiveness. Gallardo-Vázquez et al. [33], Gallardo-Vázquez and Sánchez-Hernández [7], Sánchez-Hernández et al. [34], Castilla-Polo et al. [35], and Yu et al. [36] have found evidence of a direct, positive relationship between innovation and sustainability that generates success in competitive sectors. In addition, researchers have confirmed that large, medium, and small companies are adopting innovative business models that include a sustainable, responsible approach [37,38].
Given this link between innovation and sustainability, society’s welfare can be taken into consideration while creating economic growth in companies’ surrounding regions [39,40,41,42] in order to generate positive impacts on society [43,44]. Integrating motivated work teams that focus on sustainability can also generate innovation within firms. This approach improves employee satisfaction and encourages organizations to develop more extensively and to attain a sustainable position in the market [45].
The same relationship between innovation and sustainability can be observed in universities, even though they are a very specific type of context, because, as previously mentioned, these institutions must also search for sustainability. Thus, any educational innovations that arise lead to improvements in student achievement through teaching practices designed to improve learning processes and enhance student satisfaction [46,47,48,49]. With innovative processes, tools based on new technologies—including the use of the internet—expedite initiatives’ implementation. Among these innovations, the G9 virtual campus stands out as facilitating learning and generating satisfaction. Another type of innovation is the empowerment of collaborative learning, which encourages students to work in groups to achieve shared goals [47,50].
Innovation necessarily also comes from teachers updating course content, which contributes to class subject matter being adjusted to fit the labor market and to maintaining a balance between theoretical and practical content. During this process, instructors must design course activities that enhance learning and satisfy students’ needs [47,51]. We considered these innovative activities in university contexts in the study’s questionnaire items in order to assess more accurately innovation’s link to student satisfaction. As a result, the first hypothesis was written as follows:
Hypothesis 1 (H1): 
When innovation is perceived as an integral part of a university and the surrounding region, residents are satisfied with its level of sustainability.
Customers or consumers clearly want to gain access to high-quality products and services, and a link has been found between perceived quality and sustainability [52,53], so companies need to establish parameters of quality that generate customer satisfaction. The International Organization for Standardization (ISO) 9000 and the ISO 14000 are the most widely recognized standards for quality, offering numerous advantages for the organizations that adopt these guidelines [54]. These quality standards are also closely related to the ISO 26000, which functions as another measure of sustainability, although with some notable differences [53].
In university contexts, quality standards are also being developed, although sustainability standards are in a quite early stage of formation. For the present study’s purposes, the main differences between the ISO 9000, ISO 14000, and ISO 26000 were insignificant, since the research focused on university interest groups (i.e., customers’ interest in quality and all stakeholders’ concerns about sustainability) [53]. The interest group under study included students, who are a university’s clients. Thus, a good education model requires managing the quality of education, including monitoring student satisfaction [13]. When this interest group is put through a system of education that encourages responsibility and quality, students will be able to introduce improvements into their social activities and the surrounding economy, as well as focus on sustainability [13].
Evaluations of student satisfaction are a sign of higher education institutions focusing on successful performance [55,56,57]. Different factors are related to educational processes and university contexts, as well as to students’ own life strategies, so these factors should be included in assessments [13,58,59,60]. In addition, current research has had to consider satisfaction with the curriculum offered, which should integrate students’ social expectations with the activities made available during their time at university [61]. Shrestha [62] has found that the determinants of perceived quality of education in Nepal include the quality of the faculty, the quality of the infrastructure, graduate employability, the quality of the curriculum, and the school’s reputation as antecedents of perceived quality and perceived value. These elements include student satisfaction surveys, quality certifications, a registry of complaints and claims, and periodic reviews of the teaching system, all items that were included in the questionnaire. Overall, the quality of education in these institutions is the most important aspect, which can be defined as universities’ competitiveness, as specified by academic rankings [63,64]: this indirectly contributes to the achievement of sustainability [65]. On the basis of the above findings, the second hypothesis was created:
Hypothesis 2 (H2): 
When quality is perceived as an integral part of a university and the surrounding region, residents are satisfied with its level of sustainability.

5. Materials and Methods

5.1. Study Population and Sample Selection

University of Extremadura students who were enrolled during the 2017–2018 academic year constituted the population under study. These students were spread across the university’s four campuses, and these individuals’ places of origin were extremely diverse and included people from the region’s two provincial capitals, many municipalities in the region, other nearby regions, and even international students. The latter included two categories: Portuguese students who enroll in the University of Extremadura because of the proximity between Spain and Portugal and students from the Erasmus Program, who are from different European countries. Overall, the population of Spanish and international students was 18,985 individuals for the year under analysis.
The sample was composed of 362 students, which is an adequate size for this kind of study, according to Roldán and Sánchez-Franco [66], Cohen [67], and Green [68]. Assuming a medium size effect, a power level of 0.80, and an alpha level of 0.05, a minimum sample of 53 respondents was required, which the present study exceeded. The sample was a random selection of students from all of the university’s undergraduate and master’s programs. To obtain data on the students’ perceptions of the subjects in question, a structured questionnaire was prepared, which was then sent electronically to the entire study population. All of the students were thus informed of the study’s purpose, and they were each encouraged to complete the survey.

5.2. Questionnaire and Items

This study focused on the interrelationships between three constructs: perceived innovation, perceived quality, and student satisfaction. All of them are latent variables that cannot be measured directly, so a series of indicators had to be defined while creating the questionnaire in order to assess the students’ perceptions of each construct. The indicators’ definitions were based on existing studies.
More specifically, “perceived innovation”, in an educational context, was defined as processes leading to changes and improvements [69]. This variable represented a satisfaction response related to collaboration and procedure in the educational institution. It was measured using scales previously developed by Larrán et al. [70], Vieira [71], and Díaz and Beerli [72]. The items were formulated to establish the importance that students attach to measures taken to implement innovations in their university and the perceived degree of intensity with which innovations are put into practice. These items referred to activities through which students can more fully utilize the university’s computer and internet resources, as well as activities that encourage students’ openness to society. Eleven items were included to meet this objective.
“Perceived quality” can be understood as a single global judgment of or attitude toward a service provided [73]. It represents a satisfaction response related to personal feedback about the educational institution. The present study measured perceived quality using the scale developed by Larrán et al. [74]. In the questionnaire, nine items were used to assess the students’ impressions of the quality of the teaching processes, information adequacy, scholarships, or participation in representative bodies.
Finally, student satisfaction was conceptualized as students’ attitudes through a comparison of the perceived performance of the educational services offered to these individuals’ previous expectations [75]. This variable was a satisfaction response related to whether students felt cared for in the educational institution. The present assessment was based on scales previously developed by Capelleras and Veciana [76], as well as items adapted from Díaz and Beerli’s work [72]. The current study’s objective was to measure students’ perceptions of teachers’ attitudes toward them and their level of involvement and motivation. In total, nine items were included covering satisfaction.
For all three defined constructs, responses were given on a seven-point Likert scale according to the students’ perceptions, which ranged from 1 (“completely disagree”) to 2 (“strongly disagree”), 3 (“disagree”), 4 (“neither agree nor disagree”), 5 (“agree”), 6 (“strongly agree”), and 7 (“completely agree”). All of the items are listed inTable A1, Table A2 and Table A3. The questionnaire used in this paper is an example of students generating value for the institution. Through this process, students were connected and immersed into the university’s process of value creation [77]. This allowed for their opinions to be taken into account in the institutional context, helping enhance an inclusive system of higher education [78].

5.3. Structural Equation Modeling

To test the proposed conceptual model of causal relationships, structural equation modeling was applied using partial least squares (PLS), with the help of SmartPLS Professional version 3.2.8 software [79]. The relevant literature [80,81,82,83] reports, first, that this method is considered to be a second-generation multivariate data analysis technique that facilitates the incorporation of abstract constructs that cannot be directly observed. Second, structural equation modeling allows researchers to determine the degree to which measurable variables describe latent variables. Third, this method provides a model of relationships between multiple predictor variables and the selected criteria. Last, structural equation modeling helps researchers use the data obtained to combine and compare hypotheses based on prior theoretical knowledge.

6. Results

6.1. Factor Analysis

First, by means of an exploratory factor analysis (AFE) with varimax rotation, we performed a factor analysis in order to understand the latent (internal) structure of the items and the extent to which the relationships between them were internally consistent. We worked with JASP software v.0.11.1.0. We proceeded to extract latent factors that represented the shared variance in responses among the multiple items. That is, the grouping of the set of observable variables was carried out based on the variability that each of them shared with the others [84]. An additional requirement for AFE is a certain sample size in order to ensure the least possible sampling error. An AFE provides good results when large samples of approximately 300 participants are used, which was true in our case [84,85].
As a step previous to carrying out an AFE, it is necessary to check that the items to be analyzed are highly correlated [86]. For this, the Bartlett sphericity test is used, which indicates the absence of correlation between items: thus, significance values less than 0.100 indicate that data are adequate for analysis [87] (Table 1).
The results obtained were adequate for performing the AFE, since the value of the significance of the Bartlett test was, in all cases, less than 0.100.
For the extraction of factors, eigenvalues are considered to be indicators of the proportion of explained variance. In our case, five factors were obtained for the variable “perceived innovation”, four factors for “perceived quality”, and three factors for “student satisfaction”. The loadings (after the application of a varimax rotation process) are shown in Table 2.
At the same time, the correlations between the factors were determined, as reflected in Table 3.
It is useful to calculate Cronbach’s α coefficients for scales in order to observe the correlations between items. Thus, the following coefficients were determined: α1 (INN) = 0.877; α2 (QUAL) = 0.920; α3 (SAT) = 0.957. All Cronbach’s α values were greater than 0.7, which was satisfactory. This determined the internal consistency of the items that made up the scales. In addition, descriptive statistics were calculated for each of the scales (Table 4). McDonald’s omega coefficient (also known as Jöreskog’s rho) is a relatively new reliability estimator that is used in factorial models [88] and that reaches values slightly higher than Cronbach’s α. This coefficient works with factor loads, reflecting a more realistic level of reliability. To be considered an acceptable value, the coefficient must be between 0.7 and 0.9 [89], although values greater than 0.65 can be acceptable in some circumstances [90]. In our case, the values were ω (INN) = 0.879, ω (QUAL) = 0.921, and ω (SAT) = 0.958, so all were acceptable. However, Gutmann’s λ6 coefficient is often considered to be a better method than Cronbach’s α because the latter underestimates the reliability of the scores and overestimates the first factor. Gutmann’s λ6 coefficient performs better in these respects [91]. For this coefficient, a minimum value of 0.7 is considered to be acceptable. In our case, the values were λ6 (INN) = 0.884, λ6 (QUAL) = 0.922, and λ6 (SAT) = 0.960, so all were acceptable (Table 4).
Finally, an analysis of additional fit indices was carried out (Table 5). We performed an analysis of the confirmatory factor of the Root Mean Square Error of Approximation (RMSEA), a Tucker–Lewis index (TLI), and a Bayesian information criterion (BIC) test. Guided by suggestions provided in Hu and Bentler [92], we defined an acceptable model fit through the following criteria: RMSEA (≤0.06), TLI (≥0.95). In terms of the BIC, there is no clear cut-off, but the general rule is that the lower the value, the better the model fit is. The first variable, (INN), had a good model fit (RMSEA = 0.018 (90 % CI = 0–0.059), TLI = 0.996, BIC = −48.651). These model fit indices were in line with the criteria of Hu and Bentler [92]. The second variable, (QUAL), also achieved a good model fit (RMSEA = 0.053 (90 % CI =0–0.094), TLI = 0.982, BIC = −23.381), and Hu and Bentler’s criteria [92] were also fulfilled. The third variable, (SAT) (RMSEA = 0.06 (90 % CI =0-029–0.106), TLI = 0.983, BIC = −19.405), also achieved a good fit. For all three variables, the model fit was good [92].
Once the factor analysis was carried out, we proceeded to evaluate the structural model.

6.2. Global Model Fit Assessment

The first step taken to evaluate the model was an analysis of its overall adjustment [93]. To analyze the model’s goodness of fit, various adjustment tests (those available for PLS) were conducted after a bootstrapping technique was applied [93,94]. The first test used was the standardized root mean square (SRMR), which has a maximum recommended value of 0.08, according to Henseler et al. [95]. The second test was an unweighted least squares discrepancy (d_ULS) and a geodetic discrepancy (d_G) [93]. The last test run was a correlation of the root mean square residual covariance (RMStheta), which Henseler et al. [93,96] have stated must have values extremely close to 0 and less than 0.12.
In the present study, the SRMR index’s value was 0.061, which is lower than the recommended maximum. The adjustment tests d_ULS and d_G gave values of 1,310 and 0.610, respectively, which are lower than the 95th percentile and which show that the existing discrepancy was nonsignificant. Finally, the RMStheta produced a value of 0.128 [93], which is close to zero and thus within the allowed limit. These results confirmed that the model’s general goodness-of-fit was satisfactory.

6.3. Evaluation of Measurement Model

Each item’s loading (λ) was examined to assess the indicators’ individual reliabilities. The literature indicates that an indicator is acceptable as part of a construct when λ > 0.707 [97,98,99]. However, loadings greater than 0.6 can also be allowed, as was done in the present study (see Table 6). The final indicators validated for the model had loadings ranging from 0.635 to 0.915.
To evaluate the construct reliability, the Cronbach’s alpha values were analyzed. Values greater than 0.7 are required, according to Hair et al. [100]. In the current research, the values were 0.874 for perceived innovation, 0.922 for perceived quality, and 0.957 for student satisfaction, which could be considered satisfactory (see Table 6 above). In addition, the constructs’ composite reliability was evaluated. Values greater than 0.7 are required for exploratory research, and values of 0.8 are required for more advanced studies, according to Nunally [101] and Vandenberg and Lance [102]. All of the present model’s constructs had values greater than 0.8 (0.899 for perceived innovation, 0.937 for perceived quality, and 0.964 for student satisfaction), which confirmed the constructs’ internal consistency.
Finally, the constructs’ convergent validity was evaluated using average extracted variance (AVE). This measure was developed by Fornell and Larcker [103] and Hair et al. [80,100], who have recommended that AVE values be higher than 0.50. The present model’s constructs had the recommended minimum value (0.5 for perceived innovation, 0.649 for perceived quality, and 0.747 for student satisfaction), so their convergent validity was satisfactory (see Table 6).
The discriminant validity was analyzed, as shown in Table 7, by applying both Fornell and Larcker’s criterion [103] and the heterotrait–monotrait (HTMT) ratio. In the first case, all of the model’s constructs met the established criterion for discriminant validity [66,96] (0.823 > 0.803 and 0.807; 0.803 > 0.803 and 0.781; and 0.864 > 0.807 and 0.781). In the second case, the HTMT ratio was compared to a predefined threshold of 0.85 [104]. Based on this criterion, all of the model’s variables had discriminant validity. Therefore, the results confirmed that all of the constructs under study met the established criteria (see Table 7). An explanatory nomogram of the model is provided in Figure A1.

6.4. Evaluation of Structural Model

The structural model was evaluated next to verify the hypotheses that included the relationships between the latent variables [105]. Collinearity was first checked to ensure no bias was present in the results. The variance inflation factor for both hypotheses had a value of 2.811, which was lower than 3 [106], so collinearity was not an issue. A model’s path coefficients (β) or standardized regression weights should have values greater than 0.2 and ideally greater than 0.3 [83] (see Table 8).
To test the hypotheses, a bootstrapping procedure was applied using 5,000 bootstrap subsamples, as well as a Student’s t-distribution with n - 1 degrees of freedom, in which n was the number of subsamples [80,83]. The results were considered to be satisfactory, as the hypotheses were validated (see Table 8 above). Thus, students’ perceptions of innovation and quality contribute to their satisfaction. This finding is quite interesting, since it shows that individuals who have decided to attend the region’s public university are satisfied with it, which contributes to improving Extremadura’s sustainability. That is, the variables were found to have both positive and significant effects (p < 0.001), thus confirming H1 and H2, with β values of 0.506 and 0.374, respectively.
Finally, the model’s predictive power was analyzed by calculating the dependent variables’ explained variance (R2) [107]. The R2 for student satisfaction was 0.700 and greater than 0.1, which is considered to be an appropriate value [108]. A Stone–Geisser Q2 test was conducted using a blindfolding procedure to assess the model’s predictive power for the dependent constructs. The value obtained was 0.516 and thus greater than 0, so the model had significant predictive capacity [83,107].

7. Discussion

The results obtained validated the two hypotheses proposed for this research. Perceived innovation and quality are, therefore, integral features of the Extremadura region and its public university, which adds to its population’s satisfaction with the territory’s ability to achieve sustainability. These data suggest that innovation has a stronger effect on satisfaction, possibly because of the stakeholders in question. The respondents were university students who were mostly young and deeply concerned about any improvements and innovations that affect the education they receive, and they were also interested in the role of new technology in students’ relationships with their university.
This finding is in line with previous research, such as that of Wilkins and Balakrishnan [49], who highlighted that innovation is an area that needs further development in higher education institutes. The cited study’s results confirmed the importance of technology to student satisfaction, including distance learning, project-based learning, optional courses, mobility modules, and information support for these processes. Other researchers have also underlined innovation’s influence on higher education students’ satisfaction. Given these results, universities should keep records of the courses taught that include technological and innovative processes (as possible practical applications) [47,48].
The positive effect of perceived quality on student satisfaction was also substantiated by the present study’s results. In this area of research, Martirosyan [55], for example, has analyzed how the factors related to quality clearly influence Armenian students’ satisfaction with higher education. These results support previous research [56,57,58] that found that aspects related to quality are among the most important factors leading to student satisfaction. Thus, universities’ perceived quality must be made clear to students throughout these institutions, especially in terms of course teachers, resource availability, international programs, facilities, and sustainability strategies [61].
As can be seen from the present results, student satisfaction contributes to regions’ sustainability (through universities). Thus, higher education institutions must implement and then evaluate strategies that systematically guarantee a reduction in environmental impact and must promote curricula focused on the surrounding region’s future sustainability. In addition, universities need to ensure well-coordinated programs involving all stakeholders, including, among others, students, staff, other educational centers, partner universities, institutions, companies, and nongovernmental organizations [63]. Future entrepreneurs and political and social leaders, as well as government officials, are generally trained at universities, so the current research results confirm the importance of indirectly strengthening regions’ sustainability through universities [65].

8. Conclusions

The above findings confirm that students’ perceptions of both innovation and quality, as integral parts of their university, are decisive factors in these stakeholders’ levels of satisfaction, especially innovation. These results mean that universities’ operations go beyond merely providing an education, as these institutions are dynamic agents in their regions and contribute to a country’s sustainability. These institutions are particularly important in territories with a low population density, as they help attract talent or consolidate student retention in the surrounding areas once they finish their studies. In addition, universities help with the creation of companies within the surrounding region and the region’s development as a sustainable space for future generations. In addition, the authors’ conclusions should draw the attention of decision makers toward a focus on regionality and single development plans and the attendant student satisfaction, as such plans can help students professionally.
This study’s results highlight three main areas in which universities should concentrate their initiatives and programs. The first is a strategic analysis of improvements made in the quality of instruction. The second area is the evolution of spaces created to encourage teaching innovation, research programs, and technology transfer. The last is maintaining indispensable relationships with local economic actors in order to train qualified professionals and encourage business creation that meets the relevant region’s real demands. The active participation of students as cocreators is important and of value to all stakeholders. Students benefit from this, acquiring skills and greater knowledge and responsibility [109]. Teachers benefit from the contributions made, generating a dynamic exchange [110].
From this perspective, we can affirm that, in a new circular economy context, a circular benefit can be achieved through social development strategies through the following steps: (i) students achieve improvements through teaching practices that improve their learning processes and enhance student satisfaction; (ii) instructors in the labor market design course activities that enhance learning and satisfy students’ needs; (iii) satisfied students introduce improvements to the surrounding economic landscape; (iv) perceived satisfaction is an indicator of the level of sustainability; and (v) students then wish to stay and work in the region around their universities.
Let us consider that, despite unprecedented economic growth, the world is headed toward resource depletion and serious social crises, and old ways of problem-solving have proven inadequate. Something has to be done to change development—its philosophy and methods—if societies want to reverse those negative trends. Both Brundtland and the “Oslo Manual” have stated that innovation in education is essential to ensuring a flexible, modern education system that is capable of driving innovation in the economy and in society. We must work toward sustainability, innovating and guaranteeing quality education, which will generate satisfaction in the population and will lead to greater regional development.
This study’s main limitation was that it focused on only one existing interest group in the selected university—students—thereby leaving room for future research in which we will conduct detailed analyses of other stakeholders, such as professors or university administrators. More specifically, further studies are needed to analyze, in detail, the decisions of university administrators with regard to innovation and higher-quality teaching. Moreover, researchers should also explore the role of teachers’ skills and commitment to innovation in university instructional design processes. Finally, we should also explore the impact of a university in a broader context, as further relationships and hypotheses can be established with a new or modified model.

Author Contributions

All authors have read and agree to the published version of the manuscript. Conceptualiztion, D.G.-V. and J.A.F.-F.; methodology, D.G.-V.; formal analysis, D.G.-V.; writing, D.G.-V. and J.S.F.-F., review and final conclusions, D.G.-V. and J.A.F.-F.

Funding

This research was funded by the European Regional Development Fund, the Junta of Extremadura (Business Research [INVE] Research Group [SEJ022 code]), and the VI Action Plan 2018–2020, grant number GR18058.

Acknowledgments

This research was supported by the European Regional Development Fund, the Junta of Extremadura (Business Research [INVE] Research Group [SEJ022 code]), and the VI Action Plan 2018–2020 (under grant number GR18058).

Conflicts of Interest

The authors declare no conflicts of interest.

Appendix A

Table A1. Indicators of Perceived Innovation.
Items (based on Larrán et al. [70], Vieira [71], and Díaz and Beerli [72])
INN1Courses’ theoretical and practical content meets the demands of the labor market.
INN2The courses are balanced in terms of theoretical and practical content.
INN3The university encourages the use of the virtual campus.
INN4The internet is used in all courses.
INN5Teachers encourage a combination of individual and group work.
INN6Most teachers are open to discussions about and improvements in their courses.
INN7I think that the “eduroam” WiFi network is of great value to my connectivity and ability to complete assignments properly.
INN8The university provides classrooms and areas equipped with computers and tablets to facilitate student learning.
INN9The university encourages students to use their own laptops and/or tablets in classrooms.
INN10I think that the University of Extremadura is an innovative institution.
INN11In my university, forums and activities are organized in which people outside the institution can participate and that encourage free movement, as the doors are always open.
Table A2. Indicators of Perceived Quality.
Items (based on Larrán et al. [74])
QUAL1Student satisfaction surveys are periodically conducted and published.
QUAL2A continuous improvement strategy is applied to students’ educational processes.
QUAL3The university has quality certifications for degree programs or services.
QUAL4My university has structured processes and/or channels for students to register claims and complaints.
QUAL5Periodic reviews of the teaching systems (i.e., content, curricula, and course offerings) are carried out.
QUAL6The university complies with the Organic Law on the Protection of Personal Data and principles of confidentiality.
QUAL7This institution provides adequate and honest information to students.
QUAL8A clear, well-defined strategy has been developed to improve scholarships and student aid.
QUAL9Student participation in government and control bodies is facilitated.
Table A3. Indicators of Student Satisfaction.
Items (based on Capelleras and Veciana [76] and Díaz and Beerli [72])
SAT1Everyone at the university is friendly to me.
SAT2The staff takes my needs into account when improving teaching practices.
SAT3I get clear, complete information about my studies and related subjects.
SAT4The teachers care about student learning.
SAT5The teachers motivate students to engage more deeply in course subject matter.
SAT6The teachers encourage student participation.
SAT7The teachers are available to give guidance to students when needed.
SAT8Continuous communication occurs between teachers and students.
SAT9The staff clearly seeks to stimulate students to develop their abilities.

Appendix B

Figure A1. Explanatory nomogram.
Land 09 00102 g0a1

References

  1. Brundtland, G.H. World commission on environment and development. Environ. Policy Law 1985, 14, 26–30. [Google Scholar]
  2. Githiru, M.; Njambuya, J. Globalization and Biodiversity Conservation Problems: Polycentric REDD+ Solutions. Land 2019, 8, 35. [Google Scholar] [CrossRef] [Green Version]
  3. Luke, T. Neither sustainable nor development: Reconsidering sustainability in development. Sustain. Dev. 2005, 13, 228–238. [Google Scholar] [CrossRef]
  4. Commission of the European Communities. Green Paper. Promoting a European Framework for Corporate Social Responsibility; Publications Office of the European Communities: Luxembourg, 2001. [Google Scholar]
  5. Szczepankiewicz, E.; Mućko, P. CSR reporting practices of Polish energy and mining companies. Sustainability 2016, 8, 126. [Google Scholar] [CrossRef] [Green Version]
  6. Weber, M. The business case for corporate social responsibility: A company-level measurement approach for CS. Eur. Manag. J. 2008, 26, 247–261. [Google Scholar] [CrossRef]
  7. Gallardo-Vázquez, D.; Sánchez-Hernández, M.I. La Responsabilidad Social Empresarial en Extremadura; Fundación Obra Social la Caixa: Badajoz, Spain, 2012; ISBN 9788469551776. [Google Scholar]
  8. Gholami, H.; Saman, M.; Sharif, S.; Zakuan, N.; Abu, F.; Awang, S. Critical Success Factors of Student Relationship Management. Sustainability 2018, 10, 4527. [Google Scholar] [CrossRef] [Green Version]
  9. Jickling, B.; Wals, A. Globalization and environmental education: Looking beyond sustainable development. J. Curric. Stud. 2008, 40, 1–21. [Google Scholar] [CrossRef]
  10. Muijen-Heidi, H. Corporate social responsibility starts at university. J. Bus. Ethics 2004, 53, 235–246. Available online: https://www.jstor.org/stable/25123296 (accessed on 15 February 2020). [CrossRef]
  11. Matten, D.; Moon, J. Corporate social responsibility. J. Bus. Ethics 2004, 54, 323–337. [Google Scholar] [CrossRef] [Green Version]
  12. Kosta, K. Exploring the views of postgraduates on higher education sustainability. In Lynne Wyness, Education for Sustainable Development: Towards the Sustainable University; Pedagogic Research Institute and Observatory (PedRIO): Exeter, UK, 2015; pp. 34–37. [Google Scholar]
  13. Razinkina, E.; Pankova, L.; Trostinskaya, I.; Pozdeeva, E.; Evsseva, L.; Tanova, A. Student satisfaction as an element of education quality monitoring in innovative higher education institution. E3S Web Conf. 2018, 33, 03043. [Google Scholar] [CrossRef]
  14. Statistical Yearbook of Spain; Instituto Nacional de Estadística (INE): Madrid, Spain, 2019; Available online: https://www.ine.es/prodyser/pubweb/anuario19/anu19_indigen.pdf (accessed on 10 November 2019).
  15. Sánchez-Martín, J.; Rengifo-Gallego, J.; Sánchez-Rivero, M. Protected Areas as a Center of Attraction for Visits from World Heritage Cities: Extremadura (Spain). Land 2020, 9, 47. [Google Scholar] [CrossRef] [Green Version]
  16. Mondéjar, J.; Mondéjar, J.A.; Vargas, M. Implantación de la metodología e-learning en la docencia universitaria: Una experiencia a través del proyecto Campus Virtual. Rev. Latinoam. Tecnol. Educ. 2006, 5, 59–71. Available online: file:///C:/Users/Lola/Downloads/Dialnet-ImplantacionDeLaMetodologiaElearningEnLaDocenciaUn-2229170.pdf (accessed on 27 March 2019).
  17. Dondi, C. An Economic Analysis of Virtual Mobility. Beyond Humanities, Long Term Strategy for ODL in University Environments and Virtual Mobility; Coimbra Group: Brussels, Belgium, 1988; pp. 87–98. [Google Scholar]
  18. Montes, R.; Gea, M.; Dondi, C.; Salandin, T. Virtual Mobility: The value of inter-cultural exchange. eLearn. Pap. 2011, 24, 1–9. [Google Scholar]
  19. Barro, S.; Burillo, P. Las TIC en el Sistema Universitario Español: Un Análisis Estratégico; Conferencia de Rectores de las Universidades Españolas (CRUE): Madrid, Spain, 2006; ISBN 84-932783-7-8. [Google Scholar]
  20. Laso, M.; San Román, P.; Larralde, G.; Cabrerizo, X.; Benito, D. Estrategia social para la adopción de herramientas de e-learning por una comunidad universitaria: El caso de la Universidad Pública de Navarra. IEEE-RITA 2009, 4, 129–136. [Google Scholar]
  21. Perea, M.; Cubo, S. Educational and tutorial plan in virtual contexts in the University of Extremdura. REOP 2010, 21, 13–24. [Google Scholar] [CrossRef]
  22. Harraway, J.; Broughton-Ansin, F.; Deaker, L.; Jowett, T.; Shephard, K. Exploring the use of the Revised New Ecological Paradigm Scale (NEP) to Monitor the Development of Students’ Ecological Worldviews. J. Environ. Educ. 2012, 43, 177–191. [Google Scholar] [CrossRef]
  23. Emanuel, R.; Adams, J.N. College Students’ Perceptions of Campus Sustainability. Int. J. Sustain. High. Educ. 2011, 12, 79–92. [Google Scholar] [CrossRef]
  24. Wachholz, S.; Artz, N.; Chene, D. Warming to the Idea: University Students’ Knowledge and Attitudes about Climate Change. Int. J. Sustain. High. Educ. 2012, 15, 128–141. [Google Scholar] [CrossRef]
  25. Zwickle, A.; Koontz, T.M.; Slagle, K.M.; Bruskotter, J.T. (Forthcoming) Assessing Sustainability Knowledge of a Student Population: Developing a Tool to Measure Knowledge in the Environmental, Economic, and Social Domains. Available online: https://ess.osu.edu/sites/essl/files/imce/Forthcoming%20Article.pdf (accessed on 20 March 2020).
  26. Moody, G.L.; Hartel, P.G. Evaluating an Environmental Literacy Requirement Chosen as a Method to Produce Environmentally Literate University Students. Int. J. Sustain. High. Educ. 2007, 8, 355–370. [Google Scholar] [CrossRef]
  27. Jones, N.; Roumeliotis, S.; Iosifides, T.; Hatziantoniou, M.; Sfakianaki, E.; Tsigianni, E.; Thivaiou, K.; Biliraki, A.; Evangelinos, K. Students’ Perceptions on Environmental Management of HEIs and the Role of Social Capital. Int. J. Sustain. High. Educ. 2013, 14, 278–290. [Google Scholar] [CrossRef]
  28. Carroll, A.B. Carroll’s pyramid of CSR: Taking another look. Int. J. Corp. Soc. Responsib. 2016, 1, 3. [Google Scholar] [CrossRef] [Green Version]
  29. Mishra, D.R. Post-innovation CSR performance and firm value. J. Bus. Ethics 2017, 140, 285–306. [Google Scholar] [CrossRef]
  30. Organization for Economic Cooperation and Development (OECD). Oslo Manual. Guidance on the Collection and Interpretation of Data on Innovation; OECD Publishing: Luxemburg, 2005. [Google Scholar]
  31. Kramer, M.R.; Porter, M.E. Estrategia y sociedad: El vínculo entre ventaja competitiva y responsabilidad social corporativa. Harv. Bus. Rev. 2006, 84, 42–56. [Google Scholar]
  32. De Larrieta-Rubín Celis, I.; Velasco-Balmaseda, E.; de Fernández Bobadilla, S.; Alonso-Almeida, M.M.; Intxaurburu-Clemente, G. Does having women managers lead to increased gender equality practices in corporate social responsibility? Bus. Ethics 2015, 24, 91–110. [Google Scholar] [CrossRef]
  33. Gallardo-Vázquez, D.; Sánchez-Hernández, M.I.; Corchuelo Martínez-Azúa, M.B. Validación de un instrumento de medida para la relación entre la orientación a la responsabilidad social corporativa y otras variables estratégicas de la empresa. Rev. Contab. 2013, 16, 11–23. [Google Scholar] [CrossRef] [Green Version]
  34. Sánchez-Hernández, M.I.; Carvalho, L.C.; Paiva, I.S. Orientation towards social responsibility of North-West African firms. Sustain. Account. Manag. Policy J. 2019, 10, 365–394. [Google Scholar] [CrossRef]
  35. Castilla-Polo, F.; Sánchez-Hernández, M.I.; Gallardo-Vázquez, D. Assessing the influence of social responsibility on reputation: An empirical Case-Study in agricultural cooperatives in Spain. J. Agric. Environ. Ethics 2017, 30, 99–120. [Google Scholar] [CrossRef]
  36. Yu, H.C.; Kuo, L.; Kao, M.F. The relationship between CSR disclosure and competitive advantage. Sustain. Account. Manag. Policy J. 2017, 8, 547–570. [Google Scholar] [CrossRef]
  37. Adams, R.; Jeanrenaud, S.; Bessant, J.; Denyer, D.; Overy, P. Sustainability-oriented innovation: A systematic review. Int. J. Manag. Rev. 2016, 18, 180–205. [Google Scholar] [CrossRef]
  38. Martínez-Conesa, I.; Soto-Acosta, P.; Palacios-Manzano, M. Corporate social responsibility and its effect on innovation and firm performance: An empirical research in SMEs. J. Clean Prod. 2017, 142, 2374–2383. [Google Scholar] [CrossRef]
  39. Aho, E.; Cornu, J.; Georghiu, L.; Subira, A. Creating an Innovative Europe; Aho Group Report; European Communities: Brussels, Belgium, 2016; Available online: http://europa.eu.int/invest-in-research (accessed on 3 October 2019).
  40. European Commission. The European Union Explained: Research and Innovation; European Commission Publication Office: Brussels, Belgium, 2014; Available online: http://ec.europa.eu/newsroom/horizon2020/document.cfm?doc_id=6322 (accessed on 3 August 2019).
  41. Von Schomberg, R.A. Vision of Responsible Research and Innovation. In Responsible Innovation: Managing the Responsible Emergence of Science and Innovation in Society; Owen, R., Bessant, J., Heintz, M., Eds.; John Wiley & Sons, Ltd.: Chinchester, UK, 2013; pp. 51–74. [Google Scholar]
  42. Auer, A.; Jarmai, K. Implementing responsable research and innovation practices in SMEs: Insights into drivers and barriers from the Austrian Medical Device Sector. Sustainability 2018, 10, 17. [Google Scholar] [CrossRef] [Green Version]
  43. Pavie, X.; Scholten, V.; Carthy, D. Responsible Innovation: From Concept to Practice; World Scientific Publishing Company: Singapore, 2014. [Google Scholar]
  44. Chatfield, K.; Iatridis, K.; Stahl, B.C.; Paspallis, N. Innovating responsibly in ICT for ageing: Drivers, obstacles and implementation. Sustainability 2017, 9, 971. [Google Scholar] [CrossRef] [Green Version]
  45. Jahanshahi, A.; Brem, A. Sustainability in SMEs: Top management teams behavioral integration as source of innovativeness. Sustainability 2017, 9, 1899. [Google Scholar] [CrossRef] [Green Version]
  46. Peck, C.; Gallucci, C.; Sloan, T.; Lippincott, A. Organizational learning and program renewal in teacher education: A socio-cultural theory of learning, innovation and change. Educ. Res. Rev. 2009, 4, 16–25. [Google Scholar] [CrossRef]
  47. Villalustre, L.; del Moral, M. Innovaciones didáctico-metodológicas en el contexto virtual de Ruralnet y satisfacción de los estudiantes universitarios. REICE Rev. Iberoam. Sobre Calid. Efic. Cambio Educ. 2010, 8, 69–81. [Google Scholar]
  48. Zhu, C. Student satisfaction, performance, and knowledge construction in online collaborative learning. Educ. Technol. Soc. 2012, 15, 127–136. [Google Scholar]
  49. Wilkins, S.; Balakrishnan, M. Assessing student satisfaction in transnational higher education. Int. J. Educ. Manag. 2013, 27, 146–153. [Google Scholar] [CrossRef] [Green Version]
  50. Barkley, E.; Cross, K.; Major, C. Técnicas de Aprendizaje Colaborativo; Ministerio de Educación y Ciencia-Editorial Morata: Madrid, Spain, 2007. [Google Scholar]
  51. Barbera, E. Educación en la red. Las Actividades Virtuales de Enseñanza y Aprendizaje; Editorial Paidós Ibérica: Barcelona, Spain, 2003. [Google Scholar]
  52. Waddock, S.; Bodwell, C. Managing responsibility: What can be learned from the quality movement? Calif. Manag. Rev. 2004, 47, 25–38. [Google Scholar] [CrossRef] [Green Version]
  53. Castka, P.; Balzarova, M. The impact of ISO 9000 and ISO 14000 on stardization of social responsibility-an inside perspective. Int. J. Prod. Econ. 2008, 113, 74–87. [Google Scholar] [CrossRef]
  54. Poksinska, B.; Dahlgarard, J.; Eklund, J. Implementing ISO 14000 in Sweeden: Motives, benefits and comparisons with ISO 9000. Int. J. Qual. Reliab. Manag. 2003, 20, 585–606. [Google Scholar] [CrossRef]
  55. Martirosyan, N. An examination of factors contributing to student satisfaction in Armenian higher education. Int. J. Educ. Manag. 2015, 29, 177–191. [Google Scholar] [CrossRef]
  56. Harvey, L. Student feedback. Qual. High. Educ. 2003, 9, 3–20. [Google Scholar] [CrossRef]
  57. Shah, M.; Nair, C.; Richardson, J. Measuring and Enhancing the Student Experience; Chandos Publishing: Cambridge, UK, 2017. [Google Scholar]
  58. Yusoff, M.; McLeay, F.; Woodruffe-Burton, H. Dimensions driving business student satisfaction in higher education. Qual. Assur. Educ. 2015, 23, 86–104. [Google Scholar] [CrossRef]
  59. Banwet, D.; Datta, B. A study of the effect of perceived lecture quality on post-lecture intentions. Work Stud. 2002, 52, 234–243. [Google Scholar]
  60. Walker, J. Service encounter satisfaction: Constructualized. J. Serv. Mark. 1995, 9, 5–14. [Google Scholar] [CrossRef]
  61. Kotova, S.; Hasanova, I. The quality of the educational process in the University through students’eyes. J. Educ. Sci. 2016, 9, 43. [Google Scholar] [CrossRef] [Green Version]
  62. Shrestha, B.K. Public perception of the quality of academic education program. J. Educ. Res. 2013, 3, 52–64. [Google Scholar] [CrossRef] [Green Version]
  63. Abubakar, I.; Al-Shihri, F.; Ahmed, S. Students’ assessment of campus sustainability at the University of Dammam, Saudi Arabia. Sustainability 2016, 8, 59. [Google Scholar] [CrossRef] [Green Version]
  64. Newell, G. Assessing property student satisfaction with their property education experience in an Australian university. Pac. Rim Prop. Res. J. 2013, 19, 133–149. [Google Scholar] [CrossRef]
  65. Bowser, G.; Gretzel, U.; Davis, E.; Brown, M. Educating the future of sustainability. Sustainability 2014, 6, 692–701. [Google Scholar] [CrossRef] [Green Version]
  66. Roldán, J.L.; Sánchez-Franco, M.J. Variance-based structural equation modeling: Guidelines for using partial least squares. In Research Methodologies, Innovations and Philosophies in Software Systems Engineering and Information Systems; Mora, M., Gelman, O., Steenkamp, A.L., Raisinghani, M., Eds.; Information Science Reference: Hershey, PA, USA, 2012; pp. 193–221. [Google Scholar]
  67. Cohen, J. Statistical Power Analysis for the Behavioral Sciences; Lawrence Erlbaum Associates: Hillsdale, MI, USA, 1988. [Google Scholar]
  68. Green, S. How many subjects does it take to do a regression analysis. Multivar. Behav. Res. 1991, 26, 499–510. [Google Scholar] [CrossRef] [PubMed]
  69. Havelock, K.; Huberman, A. Innovación y Problemas de la Educación; UNESCO/OIE: Geneva, Switzerland, 1980. [Google Scholar]
  70. Larrán Jorge, M.; López Hernández, A.; Herrera Madueño, J.; Andrades Peña, F.J. Do Spanish public universities use corporate social responsibility as a strategic and differentiating factor? Int. J. Humanit. Soc. Sci. 2012, 2, 29–44. [Google Scholar]
  71. Vieira Barros, D. Virtual: Base para el desarrollo de la competencia pedagógica de uso de la tecnología en la formación de profesores. Rev. Iberoam. Educ. 2007, 42, 6. [Google Scholar]
  72. Díaz, G.; Beerli, A. Los efectos de la imagen percibida de la universidad en la satisfacción de los estudiantes. Rev. Esp. Investig. Mark. ESIC 2003, 7, 7–25. [Google Scholar]
  73. Parasuraman, A.; Zeithalm, V.; Berry, L. SERVQUAL: A multiple-item scale for measuring consumer perceptions of service quality. J. Retail. 1988, 64, 12–40. [Google Scholar]
  74. Larrán Jorge, M.; López Hernández, A.; Calzado Cejas, M.Y. Stakeholder expectations in Spanish public universities: An empirical study. Int. J. Humanit. Soc. Sci. 2012, 2, 1–13. [Google Scholar]
  75. Sureshchandar, G.; Rajendran, C.; Anantharaman, R. The relationship between service quality and customer satisfaction—A factor specific approach. J. Serv. Mark. 2002, 16, 363–379. [Google Scholar] [CrossRef] [Green Version]
  76. Capelleras, J.L.; Veciana, J.M. Calidad de Servicio en la Enseñanza Universitaria: Desarrollo y Validación de Una Escala de Medida; Working paper, 2001/4; Universidad Autónoma de Barcelona: Barcelona, Spain, 2001. [Google Scholar]
  77. Perello-Marín, M.R.; Ribes-Giner, G.; Pantoja Díaz, O. Enhancing Education for Sustainable Development in Environmental University Programmes: A Co-Creation Approach. Sustainability 2018, 10, 158. [Google Scholar] [CrossRef] [Green Version]
  78. Robinson, C.; Taylor, C. Theorizing student voice: Values and perspectives. Improv. Sch. 2007, 10, 5–17. [Google Scholar] [CrossRef]
  79. Ringle, C.M.; Wende, S.; Becker, J.M. SmartPLS 3; SmartPLS: Hamburg, Germany, 2014. [Google Scholar]
  80. Hair, J.F.; Ringle, C.M.; Sarstedt, M. PLS-SEM: Indeed a silver bullet. J. Mark. Theory Pract. 2011, 19, 139–151. [Google Scholar] [CrossRef]
  81. Hair, J.F.; Ringle, C.M.; Sarstedt, M. Editorial-partial least squares structural equation modeling: Rigorous applications, better results and higher acceptance. Long Range Plan. 2013, 46, 1–12. [Google Scholar] [CrossRef]
  82. Fornell, C. A second generation of multivariate analysis: An overview. In A Second Generation of Multivariate Analysis; Fornell, C., Ed.; Praeger Publishers: New York, NY, USA, 1982. [Google Scholar]
  83. Chin, W.W. The partial least squares approach to structural equation modelling. Mod. Methods Bus. Res. 1998, 295, 295–336. [Google Scholar]
  84. Pérez, E.R.; Medrano, L. Análisis Factorial Exploratorio: Bases Conceptuales y Metodológicas. Rev. Argent. Cienc. Comport. 2010, 2, 58–66. [Google Scholar]
  85. Tabachnick, B.; Fidell, L. Using Multivariate Statistics; Harper & Row: New York, NY, USA, 2001. [Google Scholar]
  86. Comrey, A.L. A first Course in Factor Analysis; Academic Press: New York, NY, USA, 1973. [Google Scholar]
  87. Gallardo Vázquez, D. Escala de medida de responsabilidad social en el contexto universitario: Una triple visión basada en competencias, formación y participación del estudiante. Estud. Gerenc. 2019, 35, 159–177. [Google Scholar] [CrossRef]
  88. Ventura Leon, J.; Caycho-Rodríguez, T. El coeficiente Omega: Un metodo alternativo para la estimacion de la confiabilidad. Rev. Latinoam. Cienc. Soc. Niñez Juv. 2017, 15, 625–627. [Google Scholar]
  89. Campo-Arias, A.; Oviedo, H.C. Propiedades psicométricas de una escala: La consistencia interna. Rev. Salud Pública 2008, 10, 831–839. [Google Scholar] [CrossRef] [PubMed] [Green Version]
  90. Katz, M.H. Multivariable Analysis, 2nd ed.; Cambridge University Press: Cambridge, UK, 2006. [Google Scholar]
  91. Revelle, W. Hierarchical Cluster Analysis and the Internal Structure of Tests. Multivar. Behav. Res. 1979, 14, 57–74. [Google Scholar] [CrossRef]
  92. Hu, L.; Bentler, P.M. Cutoff criteria for fit indexes in covariance structure analysis: Conventional criteria versus new alternatives. Struct. Equ. Model. 1999, 6, 1–55. [Google Scholar] [CrossRef]
  93. Henseler, J.; Hubona, G.; Ray, P.A. Using PLS path modelling in new technology research: Updated guidelines. Ind. Manag. Data Syst. 2016, 116, 2–20. [Google Scholar] [CrossRef]
  94. Henseler, J. Partial Least Squares Path Modeling: Quo Vadis? Qual. Quant. 2018, 52, 1–8. [Google Scholar] [CrossRef] [Green Version]
  95. Henseler, J.; Dijkstra, T.; Sarstedt, M.; Ringle, C.; Diamantopoulos, A.; Straub, D.; Ketchen, D.J.; Hair, J.; Hult, G.; Calantone, R.J. Common beliefs and reality about PLS: Comments on Rönkkö and Evermann (2013). Organ. Res. Methods 2014, 17, 182–209. [Google Scholar] [CrossRef] [Green Version]
  96. Henseler, J.; Ringle, C.M.; Sarstedt, M. Testing measurement invariance of composites using partial least squares. Int. Market. Rev. 2016, 33, 405–431. [Google Scholar] [CrossRef]
  97. Carmines, E.; Zeller, R. Reliability and Viability Assessment; Sage Publications: Thousand Oaks, CA, USA, 1991. [Google Scholar]
  98. Roberts, P.; Priest, H.; Traynor, M. Reliability and validity in research. Nurs. Stand. 2006, 20, 41–46. [Google Scholar] [CrossRef] [PubMed]
  99. Chin, W.; Dibbern, J. An introduction to a permutation based procedure for multi-group PLS analysis: Results of tests of differences on simulated data and a cross cultural analysis of the sourcing of information system services between Germany and the USA. In Handbook of Partial Least Squares: Concepts, Methods and Applications in Marketing and Related Fields; Esposito, V., Chin, W.W., Henseler, J., Wang, H., Eds.; Springer: Berlin, Germany, 2010; pp. 171–193. [Google Scholar]
  100. Hair, J.F., Jr.; Black, W.; Babin, B.; Anderson, R.; Tatham, R. SEM: An introduction. In Multivariate Data Analysis: A Global Perspective; Hair, J.F., Jr., Black, W.C., Babin, B.J., Anderson, R.E., Eds.; Pearson Prentice Hall: Upper Saddle River, NJ, USA, 2010; pp. 629–686. [Google Scholar]
  101. Nunnally, J.C. Psychometric Theory; McGraw-Hill: New York, NY, USA, 1978. [Google Scholar]
  102. Vandenberg, R.J.; Lance, C.E. A review and synthesis of the measurement invariance literature: Suggestions, practices, and recommendations for organizational research. Organ. Res. Methods 2000, 3, 4–70. [Google Scholar] [CrossRef]
  103. Fornell, C.; Larcker, D. Evaluating structural equation models with unobservable variables and measurement error. J. Mark. Res. 1981, 18, 39–50. [Google Scholar] [CrossRef]
  104. Henseler, J.; Ringle, C.M.; Sarstedt, M. A new criterion for assessing discriminant validity in variance-based structural equation modelling. J. Acad. Mark. Sci. 2015, 43, 115–135. [Google Scholar] [CrossRef] [Green Version]
  105. Wright, R.; Campbell, D.; Thatcher, J.; Roberts, N. Operationalizing multidimensional constructs in structural equation modeling: Recommendations for IS research. Commun. Assoc. Inf. Syst. 2012, 30, 367–412. [Google Scholar] [CrossRef] [Green Version]
  106. Hair, J.F.; Risher, J.; Sarstedt, M.; Ringle, C. When to use and how to report the results of PLS-SEM. Eur. Bus. Rev. 2019, 31, 2–24. [Google Scholar] [CrossRef]
  107. Chin, W.W. How to write up and report PLS analyses. In Handbook of Partial Least Squares: Concepts, Methods and Applications in Marketing and Related Fields; Esposito, V., Chin, W.W., Henseler, J., Wang, H., Eds.; Springer: Berlin, Germany, 2010; pp. 655–690. [Google Scholar]
  108. Falk, R.; Miller, N. A Primer for Soft Modeling; University of Akron Press: Akron, OH, USA, 1992. [Google Scholar]
  109. Bovill, C.; Cook-Sather, A.; Felten, P. Students as co-creators of teaching approaches, course design, and curricula: Implications for academic developers. Int. J. Acad. Dev. 2011, 16, 133–145. [Google Scholar] [CrossRef] [Green Version]
  110. Hattie, J. Visible Learning: A Synthesis of over 800 Meta-Analyses Relating to Achievement; Routledge: London, UK, 2008. [Google Scholar]
Table 1. Bartlett sphericity test.
Innovation
Approximate chi-square11.036
df10
p0.055
Quality
Approximate chi-square12.431
df6
p0.053
Satisfaction
Approximate chi-square16.407
df6
p0.012
Note: df = degrees of freedom; p = significance.
Table 2. Factor loadings.
Factor 1Factor 2Factor 3Factor 4Factor 5
INN10.710
INN10 0.831
INN11
INN20.746
INN3 0.844
INN4 0.493
INN5 0.818
INN60.438
INN7
INN8 0.921
INN9
Factor 1Factor 2Factor 3Factor 4
QUAL10.891
QUAL20.771
QUAL30.636
QUAL4
QUAL5 1.035
QUAL6 0.825
QUAL7 0.672
QUAL8
QUAL9 1.060
Factor 1Factor 2Factor 3
SAT1 0.578
SAT2 0.786
SAT3 0.824
SAT40.651
SAT50.989
SAT60.745
SAT7 0.718
SAT8 0.763
SAT90.549
Note: varimax applied rotation method; INN = perceived innovation; QUAL = perceived quality; SAT = student satisfaction.
Table 3. Factor correlations.
INNFactor 1Factor 2Factor 3Factor 4Factor 5
Factor 11.000
Factor 20.1341.000
Factor 30.0590.0361.000
Factor 40.0130.0190.0101.000
Factor 50.0990.0170.0810.0051.000
QUALFactor 1Factor 2Factor 3Factor 4
Factor 11.000
Factor 20.8271.000
Factor 30.8790.8551.000
Factor 40.6950.7490.7591.000
SATFactor 1Factor 2Factor 3
Factor 11.000
Factor 20.8411.000
Factor 30.8640.8601.000
Table 4. Scale reliability statistics.
MeanSDMcDonald’s ωGutmann’s λ6
INN3.9640.7630.8790.884
QUAL3.8370.5210.9210.922
SAT4.0640.4440.9580.960
Note: SD = standard deviation.
Table 5. Additional fit indices.
RMSEARMSEA (90% confidence)TLIBIC
INN0.0180–0.0590.996−48.651
QUAL0.0530–0.0940.982−23.381
SAT0.060.029–0.1060.983−19.405
Note: RMSEA = Root Mean Square Error of Approximation; TLI = Tucker-Lewix Index; BIC = Bayesian Information Criterion.
Table 6. Items’ individual reliabilities.
First-Order Construct/IndicatorLoads (λ)Cronbach’s AlphaComposite ReliabilityAVE
Perceived Innovation 0.8740.8990.5
INN1 *0.724
INN2 *0.737
INN3 *0.652
INN5 *0.707
INN6 *0.764
INN8 *0.650
INN9 *0.635
INN10 *0.818
INN11 *0.649
Perceived Quality 0.9220.9370.649
QUAL1 *0.760
QUAL2 *0.888
QUAL3 *0.779
QUAL4 *0.811
QUAL5 *0.835
QUAL7 *0.805
QUAL8 *0.782
QUAL9 *0.779
Student Satisfaction 0.9570.9640.747
SAT1 *0.740
SAT2 *0.810
SAT3 *0.839
SAT4 *0.915
SAT5 *0.910
SAT6 *0.885
SAT7 *0.875
SAT8 *0.908
SAT9 *0.880
Note: AVE = average extracted variance; INN = perceived innovation; QUAL = perceived quality; SAT = student satisfaction. This table contains only the model’s validated indicators (those that appear with an asterisk are the items for each scale, which were validated in the model). * Indicators that appear with an asterisk are the items for each scale that have been validated in the model.
Table 7. Discriminant validity of the constructs.
Fornell-Larcker criterionHTMT
ConstructsINNQUALSATINNQUALSAT
INN0.823
QUAL0.8030.803 0.889
SAT0.8070.7810.8640.8680.825
Note: INN = perceived innovation; QUAL = perceived quality; SAT = student satisfaction; HTMT = heterotrait–monotrait.
Table 8. Contrast of hypotheses, correlation coefficients, and explained variance.
HypothesesVIFPath Coefficients (β)T-Statistic (bootstrap)SDP-ValueRelationship Validation
H1: INN → SAT2.8110.506 ***10.6260.0480.000Validated
H2: QUAL → SAT2.8110.374 ***7.6930.0490.000Validated
Note: VIF = variance inflation factor; INN = perceived innovation; QUAL = perceived quality; SAT = student satisfaction; ***p < 0.001 (based on a Student’s t-distribution of t(0.05, 4999) = 1.645; t(0.01, 4999) = 2.327; t(0.001, 4999) = 3.092).

