1. Introduction
An increase in end-user competition for limited water resources is challenging world development sustainability. Since the United Nations proclaimed its “zero hunger” and “clean water and sanitation” aims in 2015 through the development of “food–water” community synergies, several countries have sought to improve their water infrastructure and technologies. For example, the UK government has improved its water quality management and wastewater drainage system construction [
1], China and Europe have sought to improve their healthy water through improved water sanitation [
2], and the Republic of South Africa has invested in water sanitation infrastructure [
3]. However, technological interventions may jeopardize natural cycles and disrupt sustainable development goals; hence, soft paths to water allocation management are suggested.
Because climate change impacts water management services, this study focused on future water management and water allocation strategies based on current resident lifestyles and energy use [
4]. Regional climates and demographic factors largely influence water availability and water demand; for example, in China, the uneven seasonal and geographic distribution of precipitation increases water scarcity problems. This study developed several future scenarios to support the managerial insights under these types of changing conditions, based on which, adjusted solutions could be determined using mathematical programming models.
However, it is important to identify the specific participants and their objectives to identify suitable trade-offs when selecting mathematical programming models. Within many river basins, multiple provinces generally share the water, each of which requires as much water as possible to develop their local economies and satisfy their domestic living demands. Therefore, the river basin authority needs to know how to allocate the water to different provinces to ensure basin sustainability and equitable social, economic, and environmental benefits.
In real-world practice, there are often multiple reservoirs within a river basin, and each reservoir may have multiple conflicting objectives that affect the other reservoirs [
5]. Many countries allow inter-basin water transfers, which means water is transferred from one basin that has excess water availability to neighboring basins suffering from water-scarcity [
6]. Intra transfer means water is transferred within the same basin. As intra and inter-basin transfers affect water use efficiency and water use stress in different ways, water transfers need to jointly consider economic, social, and environmental benefits.
Above all, this paper developed a market-based dynamic multi-objective optimization model to allocate limited basic water and developed strategies to resolve seasonal water allocation problems. Therefore, the objectives of this research were three-fold: first, several scenarios were given to quantify future social, economic, and environmental goals; then, the sectoral demands were simulated; finally, a dynamic multi-objective optimization model that included a water market was proposed to explore climate change adaptation and equitably allocate the water resources to different sectors. Therefore, the contributions of this study are: (1) to address a multi-province water supply issue that includes both intra- and inter water transfers; (2) to propose a market-based dynamic multi-objective optimization model; (3) to develop four climatic scenarios to characterize possible future situations.
2. Literature Review
2.1. Climate Scenario Predictions
Compared to the current climate, significant changes are expected in the future, with some areas becoming much drier and hotter and others becoming wetter. Previous research has used shared socio-economic pathways (SSPs) and representative concentration pathways (RCPs) to design future scenarios [
7]. Fours RCPs: RCP2.6, RCP4.5, RCP6.0, and RCP8.5, were first mentioned in the IPCC Fifth Assessment Report (AR5) in 2013, each of which predicted varying future average annual temperatures and rainfall patterns [
8,
9,
10].
SSPs are narrative descriptions that exclude climate change and CO2 fertilization effects. SSP1 describes a future pathway with low adaptation and mitigation challenges, SSP2 describes medium challenges and a future in which the development trends are not extreme, and SSP3 describes a future pathway with high adaptation and mitigation challenges. In principle, each SSP can be combined with each RCP to produce various projected combinations [
8].
Different RCP scenarios have varying emissions, concentrations, radiative forcing situations, and land uses. While SSPs focus on GDP, population, and lifestyle projections [
11]. Here, based on the main SSP and RCP characteristics, we designed several future scenarios to explore the effects of climate change on river basin water allocation and water transfer.
2.2. Mathematical Models
Recently, many mathematical models have been developed to tackle water resource allocation problems in different river basins. In 1994, Rosegrant (1994) proposed that the market for tradable water rights helped improve the efficiency, equity, and sustainability of water use in developing countries [
12]. Later, Nasiri-Gheidari (2018) studied the inter-basin water transfer problem based on a bi-objective optimization model [
13]; Li et al. (2020) used a multi-objective model to study the agricultural irrigation allocation problem [
14]; Xie et al. (2018) applied an inexact stochastic optimization model to solve the water allocation problem [
15]; besides, Xu et al. (2019b), and Yao et al. (2019) solved optimal water resources allocation strategies under a bi-level optimization model [
16,
17]. Further, Gu et al. (2013) found that the geography and river basin scales need to be considered across space and time after considering the uneven distribution of water resources, and the authors developed a multi-stage programming model. Above all, optimization modeling seems one of the effective approaches for efficient water allocation [
18]; however, fewer articles aim to solve the problem of spatial-seasonal water allocation. To solve the real-world problem, we first define several dynamic indicators, including variable water availability and irrigation water demand in different growth stages, and then we adopt the idea of dynamic programming into the model.
It is also necessary to account for the multiple objectives associated with equity, efficiency, and environmental sustainability when developing realistic models. Equity evaluates whether is fair for stakeholders to withdrawal water [
19], efficiency is concerned with the economic benefit maximization while minimizing the total use of water resources [
20], and environmental sustainability makes sure that it is environmentally friendly to withdrawal water based on the allocation strategy [
20]. Besides, it is not easy to fulfill all these goals at the same time. A Pareto frontier can be drawn to compare the viability of multiple Pareto solutions.
In this study, the river basin authority needs to simultaneously consider the economy, society, and environment when designing the different provinces’ water allocations. While previous studies have made significant advances, work still needs to be done to meet adjusted water resource allocation requirements under changing climate conditions. To ensure comprehensive insights, this paper divided the planning year into seasons and employed dynamic programming.
3. Material and Methodology
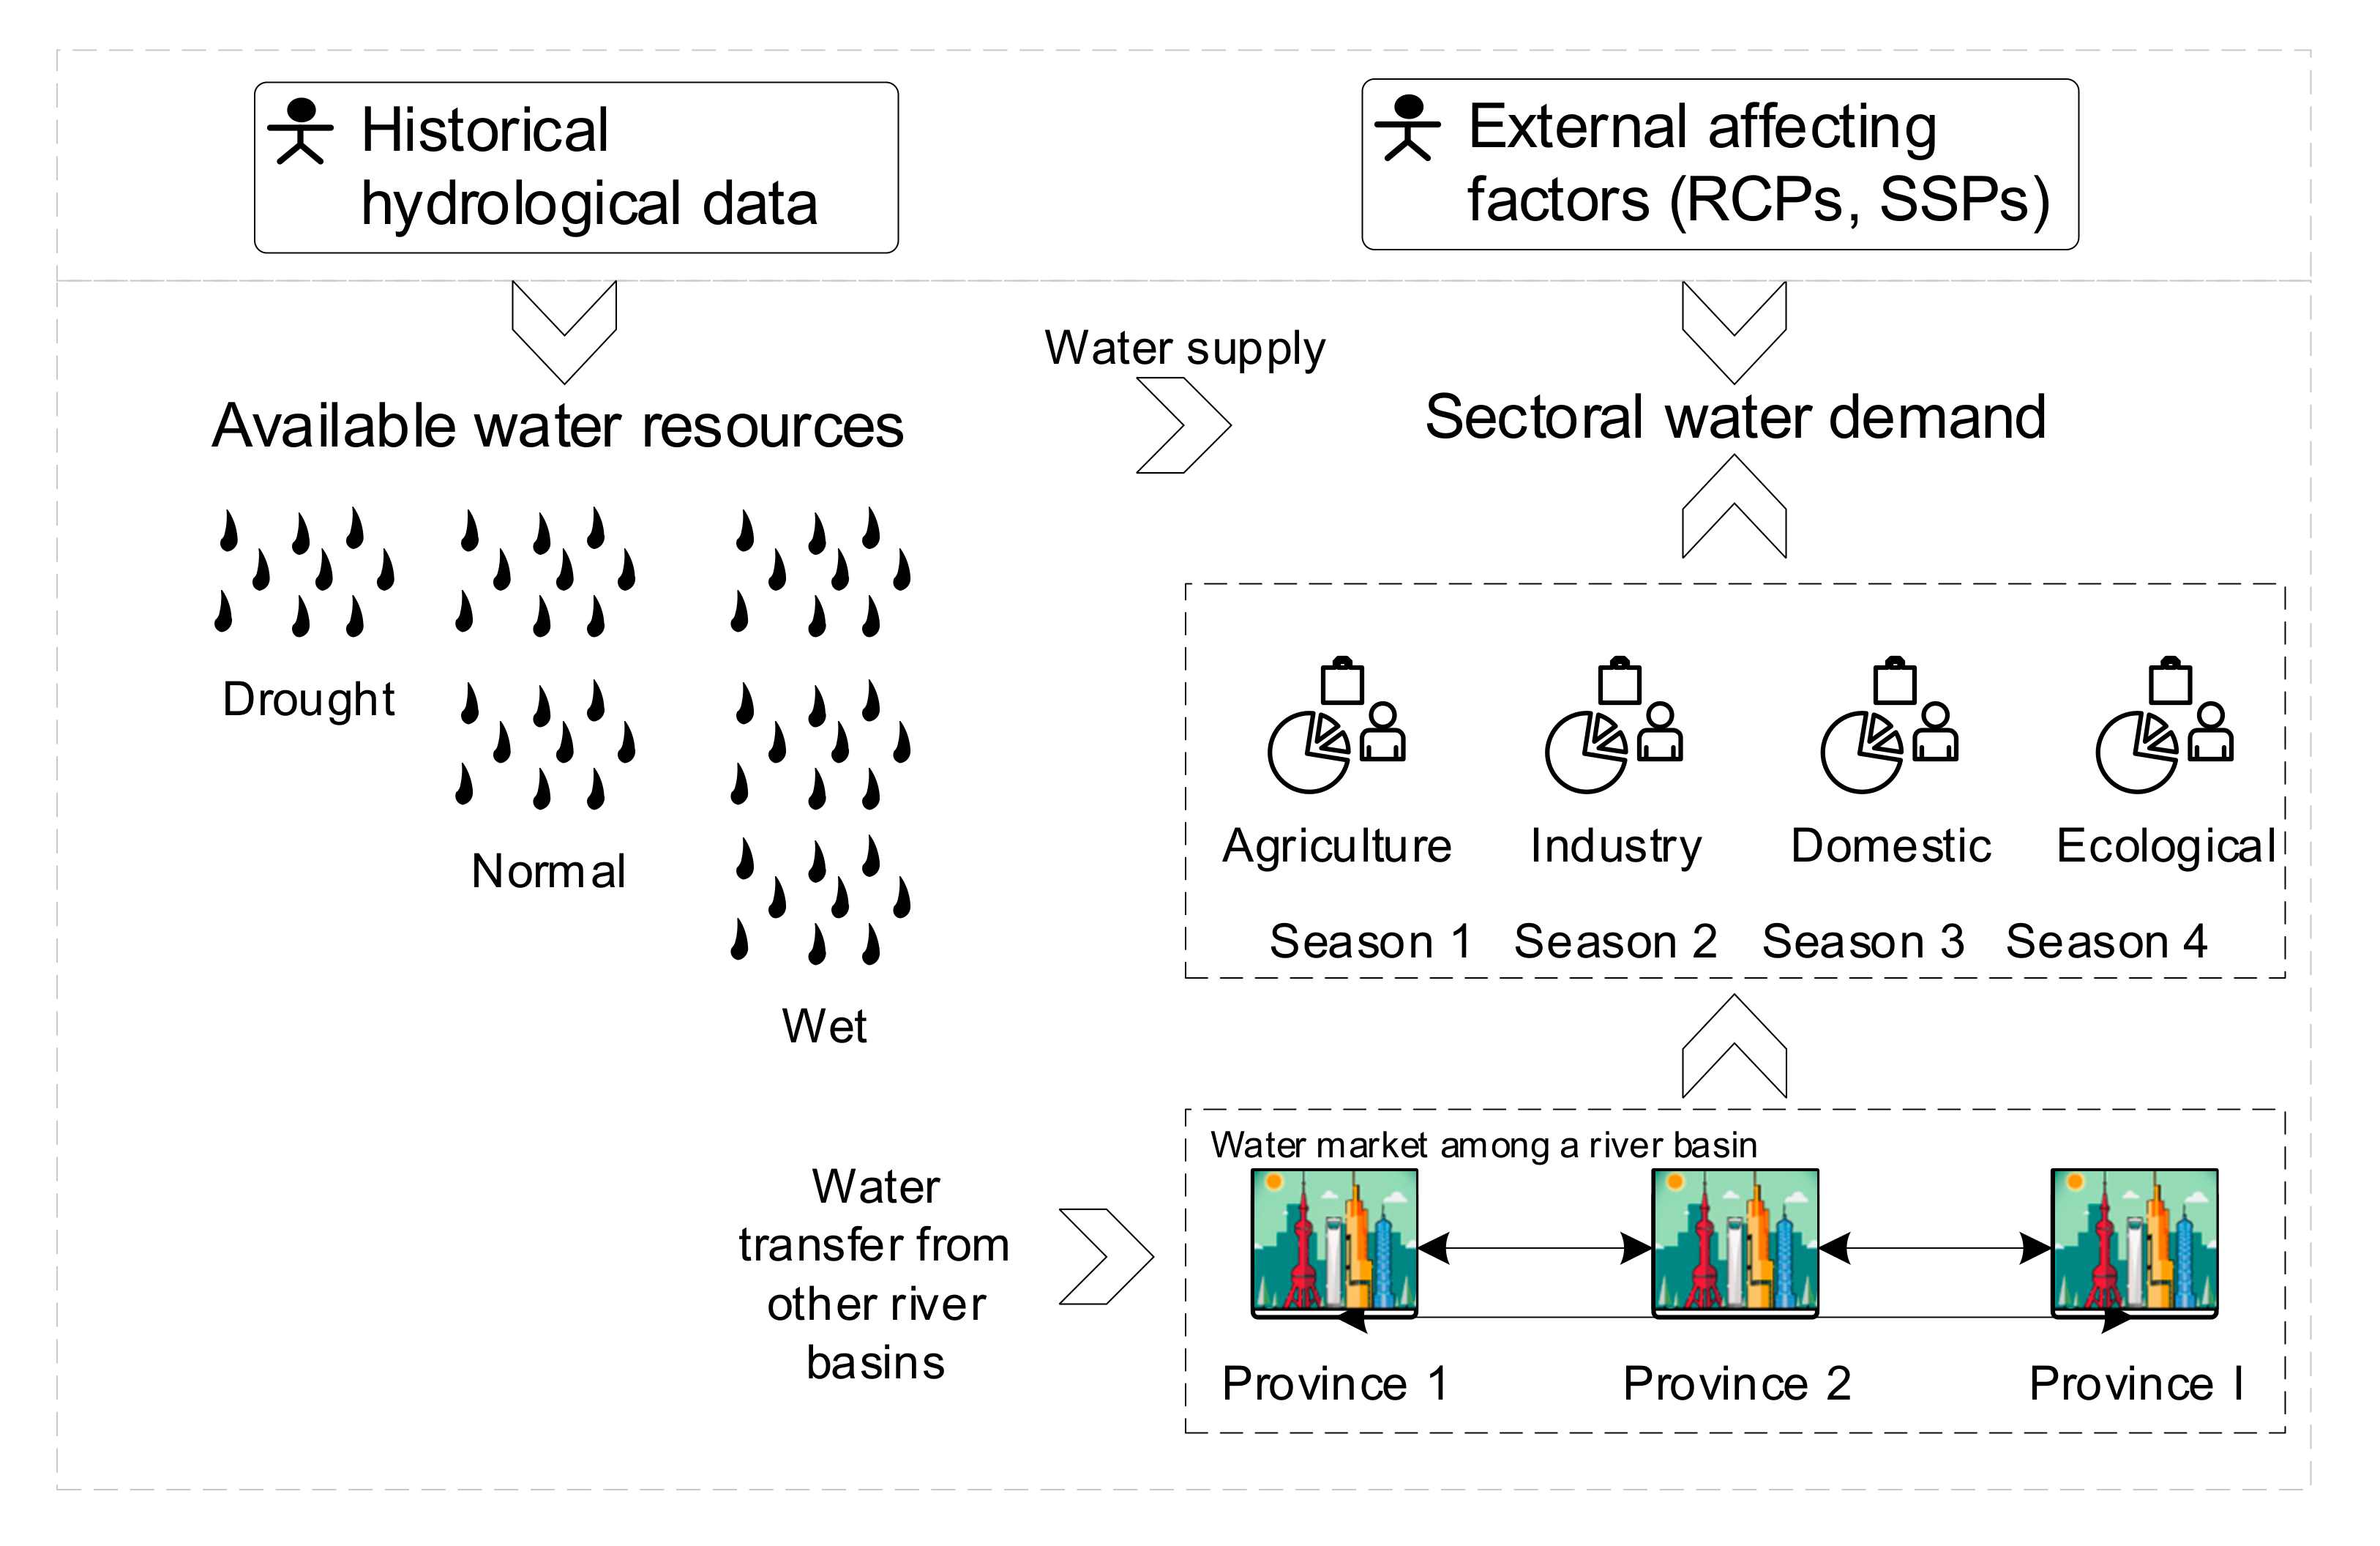
To offer the adjusted seasonal water allocation strategies,
Figure 1 (1) briefly summarizes future river basin scenarios, (2) presents the seasonal and sectoral water demands in the different scenarios, and (3) proposes adjusted water allocation actions by solving a dynamic multi-objective programming model.
3.1. Background of the Studied Basin
Inter-basin water supplies have become increasingly complex because of inefficient water management and insufficient naturally available water [
21]. Generally, multiple reservoirs are constructed along a river basin to supply the limited water to associated provinces. However, because the development modes vary from region to region, authorities are willing to reallocate the water use rights after receiving their initial water entitlements. At this time, there is often competition and conflicts between the end-users and the provinces. Therefore, this study seeks to solve a multi-province water supply problem in the presence of a water market. To illustrate the practicability of this study’s suggested approach, an adjusted management pattern for the Yiluo river basin was developed. The Yiluo river basin at 18,881 km
2 crosses both Shaanxi and Henan provinces and is one of the most critical Yellow river tributaries, with the main Luo river being 446.9 km and the Yi river tributary being 264.8 km.
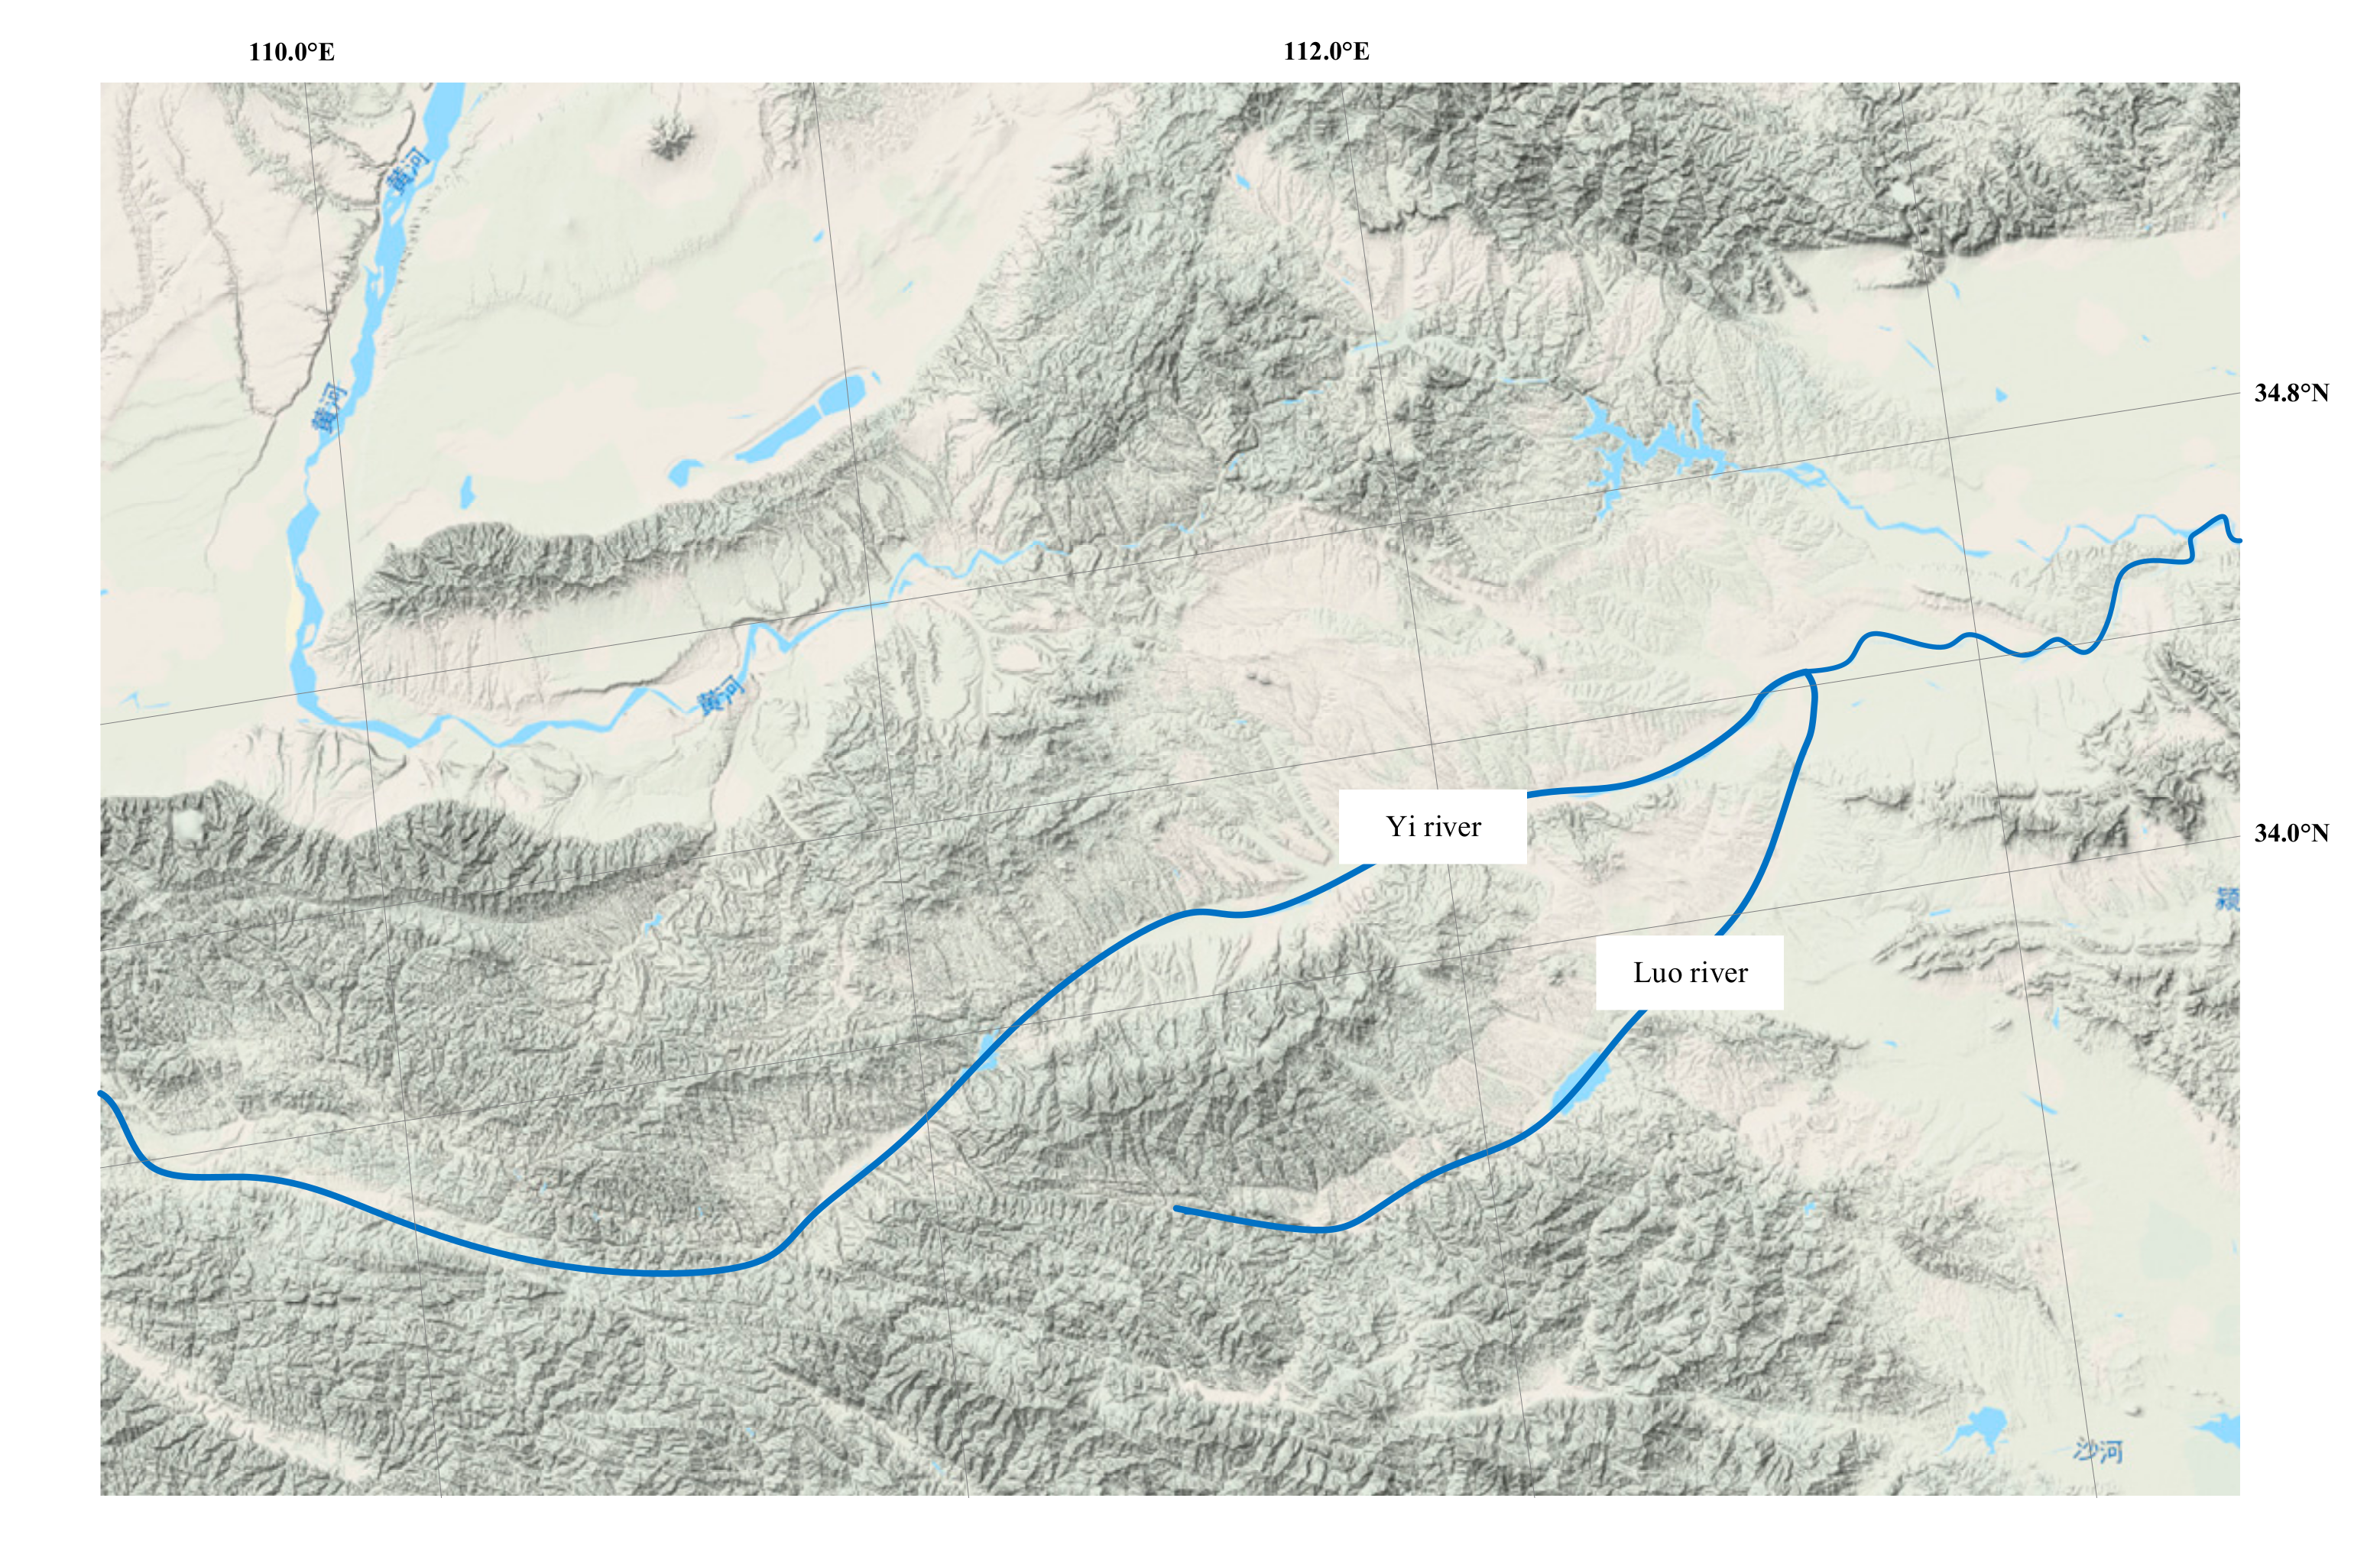
The Yiluo river basin has two main reservoirs, the Ganxian and Luhun, which are, respectively, located on the Luo and the Yi rivers, as shown in
Figure 2; however, water levels in these reservoirs are different. The Luhun Reservoir spillway design flood level is 331.80 m, the designed flood level is 327.5 m, the flood control level is 317 m, and the dead water level is 298 m, and the Guxian Reservoir spillway design flood level is 551.02 m, the designed flood level is 548.55 m, the flood control level is 529.30 m, and the dead water level is 495 m.
3.2. Climate Scenarios Setting
This study applied a Scenario Matrix Framework that included both the RCPs and SSPs, with the SSPs focused on two possible evolutionary challenges to human society in the coming century: “challenges to adaptation” and “challenges to mitigation” and the RCPs paying greater attention to the influences of carbon emissions on temperature and precipitation.
Table 1 gives quantified values for some of the main variables under each future scenario. Referring to Zhuo et al. (2016) [
7], we constructed two scenarios S1 and S2 by combining climate scenarios forced by RCP2.6 with socio-economic scenarios SSP1 and SSP2, and two scenarios S3 and S4 that combine climate outcomes caused by RCP8.5 with SSP2 and SSP3, respectively.
In this way, future water demand and supply quantities were calculated.
3.3. Climate and Socio-Economic Changes Impacts on Demand
The future water demand was predicted based on the above climate scenarios based on Equations (1)–(6).
Domestic, industrial, and agricultural water demand is influenced by economic, climatic, and demographic factors, such as water use per GDP, the amount of water used per person, and the amount of water demand per farmland irrigation, precipitation, temperature, and so on. In the following paragraphs, specific water demands are calculated.
Industrial water demand is usually calculated based on a quota-based method, as shown in Equation (1).
where
is the Gross Domestic Product in sector
i in season
t,
is the water demand per GDP, and
is the water reuse coefficient.
Annual domestic water demand change is usually calculated based on climatic-induced change, considering the impacts of temperature (precipitation) on water demand, which are denoted
and
[
24]. Equation (3) is proposed to consider temperature and precipitation effects together.
where
is the percentage change in domestic water demand,
is the percentage change in temperature, and
is the percentage change in precipitation.
Further, as domestic water demand is influenced by population, this study added the demand value controlled by the climate to the demand value influenced by the demographic and economic factors, as shown in Equation (4).
where
is the population size, and
is the GDP per capita,
is the percentage change in domestic water demand caused by temperature and precipitation changes. Multivariate regression analysis was used to calculate coefficients
c,
d, and
f, with the error in the regression model being
. In this way, domestic water demand can be calculated by Equation (4).
Ashour and Al-Najar (2013) reported a temperature increase of 1–2 °C would lead to a rise in irrigation requirements of 3.28–6.68% [
25]. In this paper, the combined impact of land for planting paddies and the effect of the temperature on agricultural water demand was considered, with Equation (5) being used to simulate and predict the agricultural water demand.
where
f1 is a coefficient that reflects the influence of the rate for planting paddies on irrigation water demand,
is the land rate for planting paddies,
f2 is the coefficient that reflects the impact of temperature changes on irrigation water demand,
is the temperature change.
3.4. Dynamic Multi-Objective Optimization Model
Based on the above analyses, this study considered three objective maximization functions: economic efficiency, social equity, and the share of green water resources.
3.4.1. Objective Functions
Objective function 1: maximize economic benefits. Economic returns are maximized with the promise of physical water transfer. This function enables us to obtain the net economic benefit of agricultural (
i = 1), industrial (
i = 2), domestic (
i = 3), and ecological (
i = 4) sectors among two provinces; that is, Shaanxi province (
k = 1) and Henan province (
k = 2). The net economic benefit excluded water transfer cost and imported water cost.
where
t = 1 represents Spring;
t = 2 represents Summer;
t = 3 represents Autumn;
t = 4 represents Winter.
represents economic benefit per unit of water from sector
i in period
t. represents water transfer costs.
represents the price of imported water.
represents allocated water to sectors.
represents traded water in region
k.
represents imported water used in region
k.
Objective function 2: minimize water shortage. This study seeks to minimize water shortage per capita after physical water transfer to reflect the social benefit. The water shortage is minimized to promise every person can get available portable water.
where
means population in region
k.
Objective function 3: minimize total pollution production. More water is generally allocated to sectors with higher water use efficiency; however, more pollution can enter the river because of the industrial output. Therefore, this study seeks to minimize the Chemical Oxygen Demand (COD) concentration during the water consumption process.
where
means wastewater per unit of water from sector
i in period
t, COD concentration was considered in this study.
3.4.2. System Constraints
This decision entity is subject to the following constraints:
State transition equation for the reservoirs. The water storage in the past stage is the initially available water in the present stage. Therefore, a state transfer equation is proposed to describe the dynamic water available in the four seasons; that is,
is the storage in season
t and
is the storage in season
t−1.
is the water input in season
t.
where
means storage in the reservoir in region
k in season
t, and
means storage in season
t−1.
Water supply constraint. The water supply should not exceed a specific value in each season, which is mostly decided by the water demand.
where
means water demand in sector
i in region
k in period
t.
Water allocation constraint. The watershed authority decides on the initial water rights in each region; therefore, the constraint is set to ensure that the total water use and transactions do not exceed the initial water rights.
where
means initial water rights in region
k.
In this way, the market-based dynamic multi-objective model is proposed, which can be solved by MATLAB 2017 solver. The results are usually depicted as Pareto frontiers, consisting of sets of non-inferior solutions.
3.5. Data Source and Data Preparation
Based on Yiluo river basin historical data reported by the National Climatic Centre of the China Meteorological Administration, we find the available water can be 2065 million m
3 (Slightly dry condition), 2140 million m
3 (Normal condition), and 2349 million m
3 (Wet condition) in a planning year, which is mainly for Shaanxi and Henan province. To determine a reasonable allocation strategy and the water demands in the future scenarios, both the seasonal precipitation and the runoff within the river basin in two provinces needed to be considered in the calculations. The seasonal water demands in the different sectors were simulated under different scenarios, as shown in
Table 2,
Table 3 and
Table 4. The ecological water demands were 187 million m
3 and 4.75 million m
3 in Henan and Shaanxi provinces in this study, and based on the historical water planning projects in the Yellow river basin, the average ratios for the initial water rights for Shaanxi province and Henan province were 28% and 72%.
3.6. Data Analysis and Statistical Methods
When it comes to data analysis and statistical methods, two steps should be conducted before. First, a scenario matrix framework was developed that fully integrated the RCPs with the SSPs, after which the economic, demographic, and meteorological parameters were simulated on potential future pathways. Based on the assumptions for the four scenarios (SSP1-2.6, SSP2-2.6, SSP2-8.5, and SSP3-8.5), and the change rate shown in
Table 1, projections results for the 2050 scenarios with a 2004 baseline year are shown in
Table 2.
Second, based on the different data inputs, the water demands were calculated using relevant equations. By using excel software and SPSS solver, the predicted seasonal water demands in different sectors are shown in
Table 3 and
Table 4.
3.7. Uncertainties and Shortcomings
It is worth noting that the above four scenarios are based on assumptions concerning climate change and socio-economic developments, which further impact population, diets demand, and water demands. In this way, scenario analysis can be done faced with these future uncertainties. Later, the quota-based and multivariable regression models are used to simulate water demands caused by climate change and socio-economic development.
4. Results and Discussion
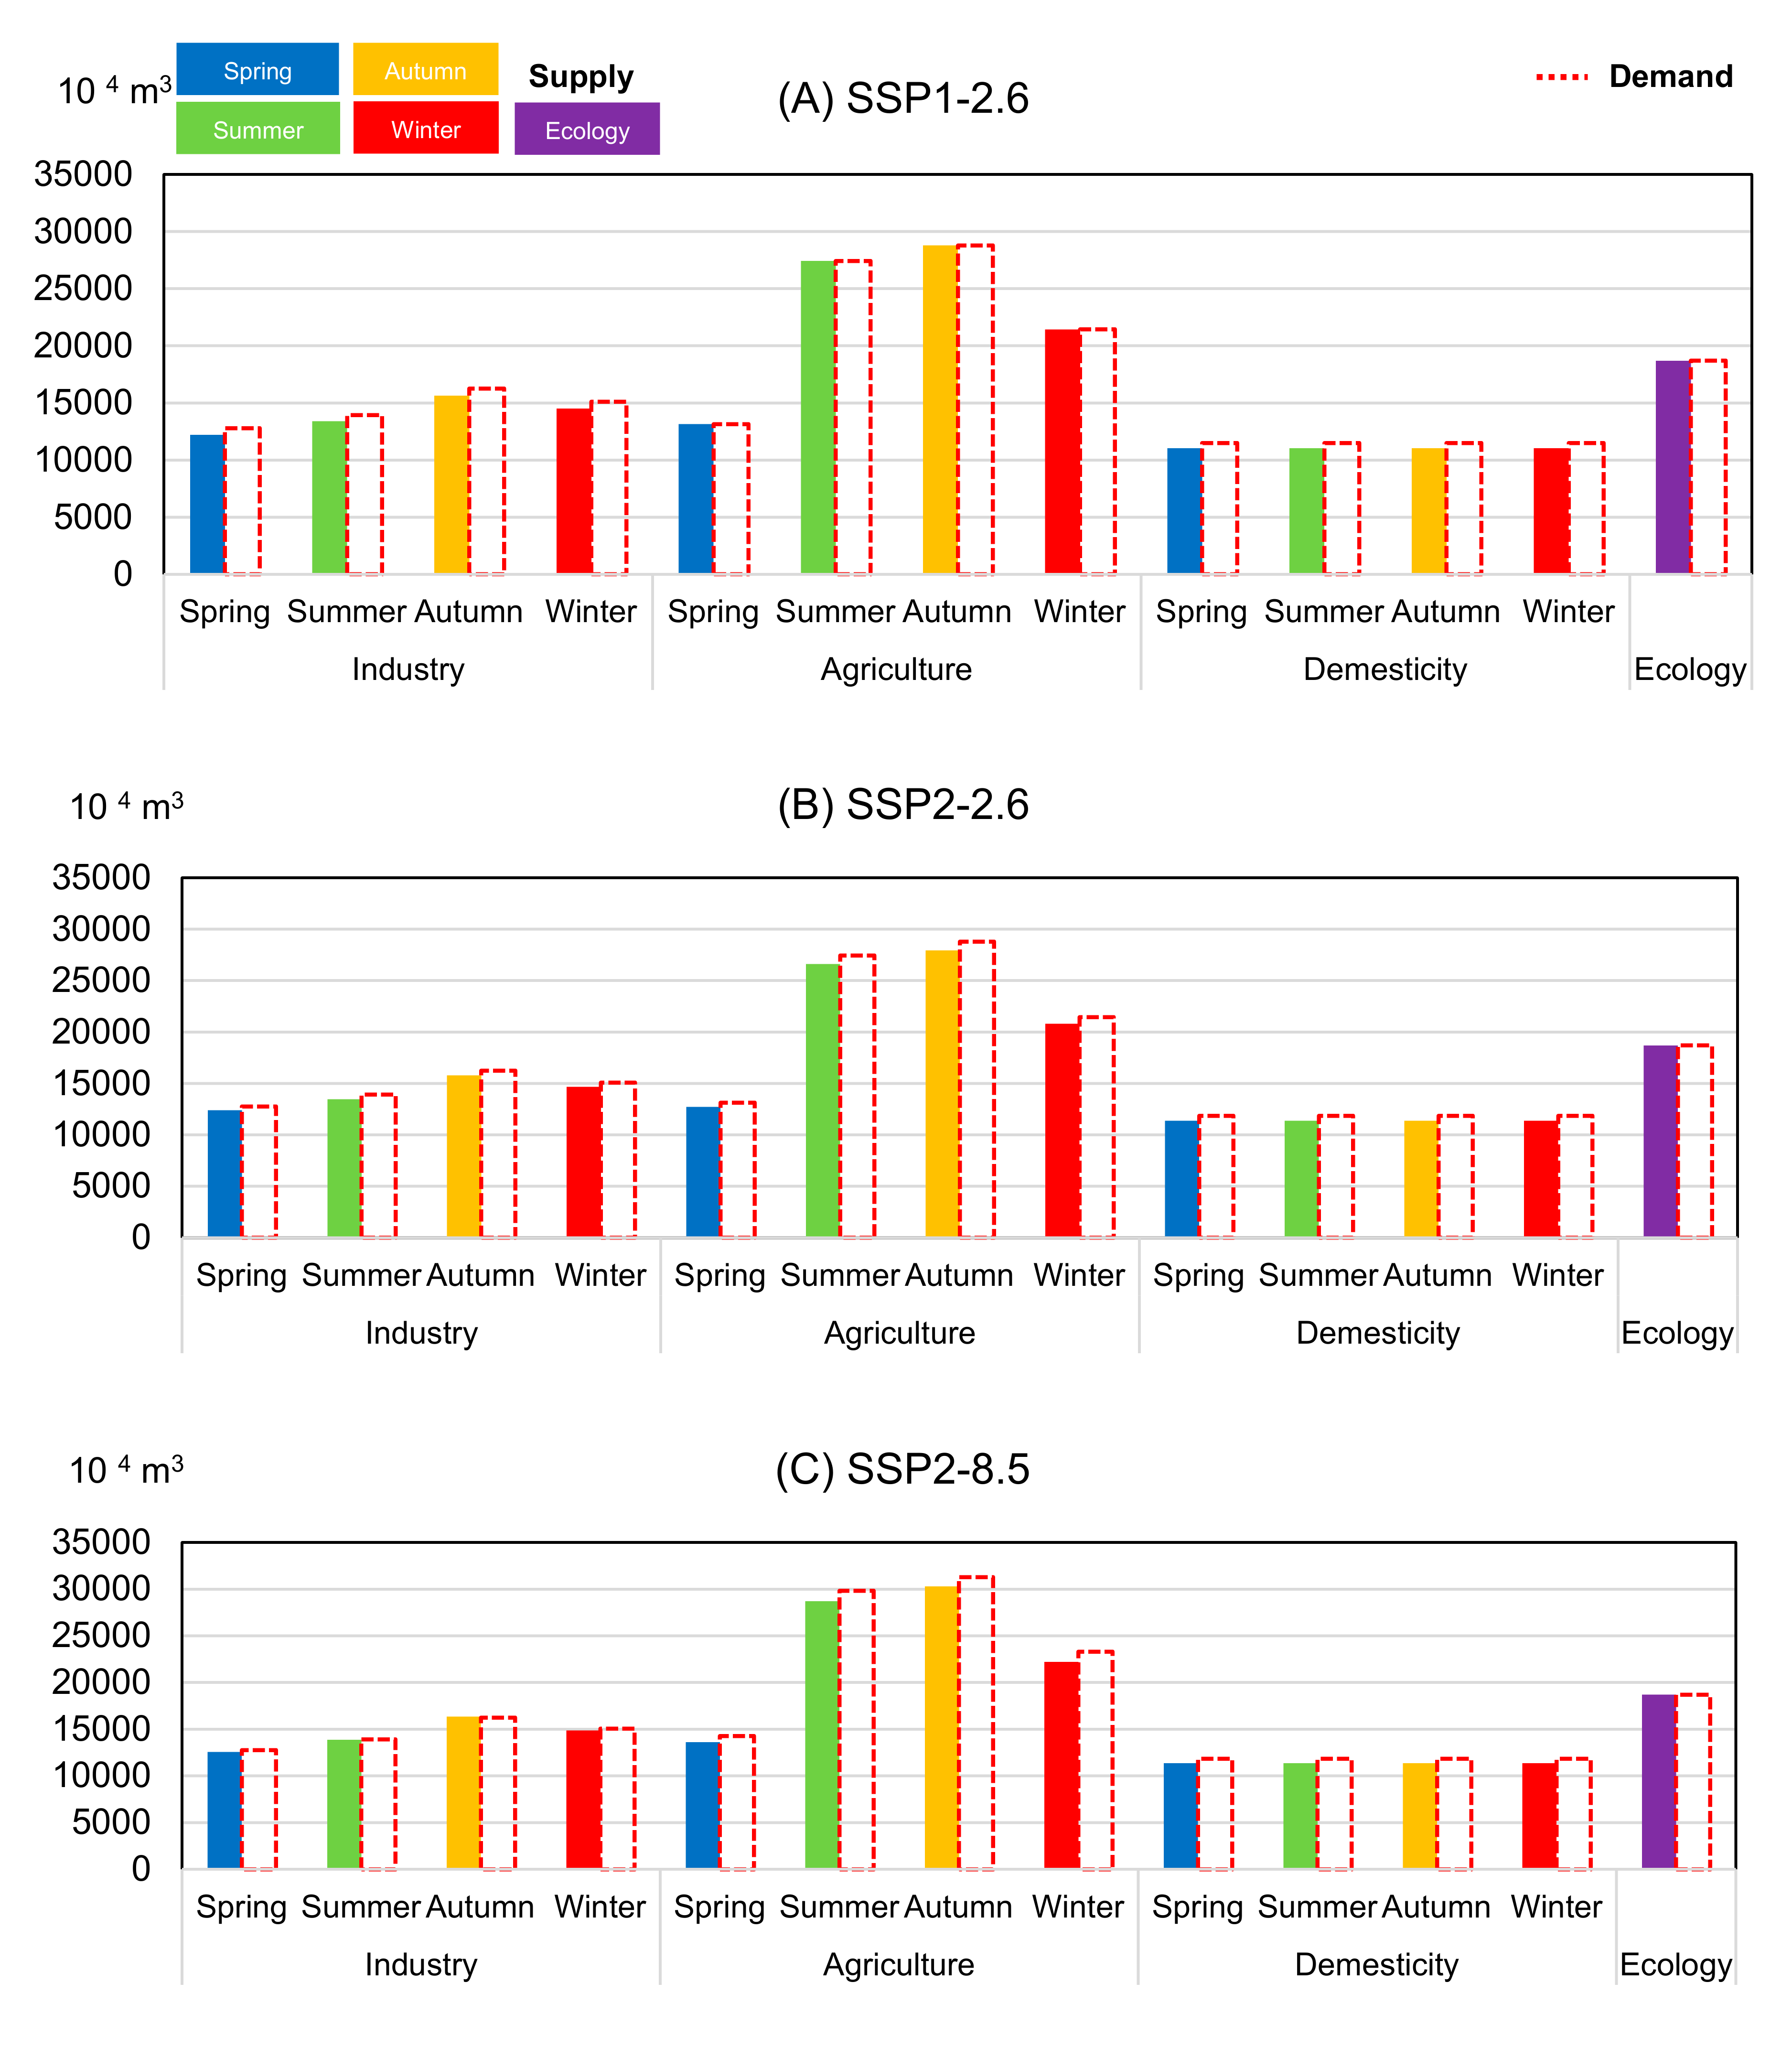
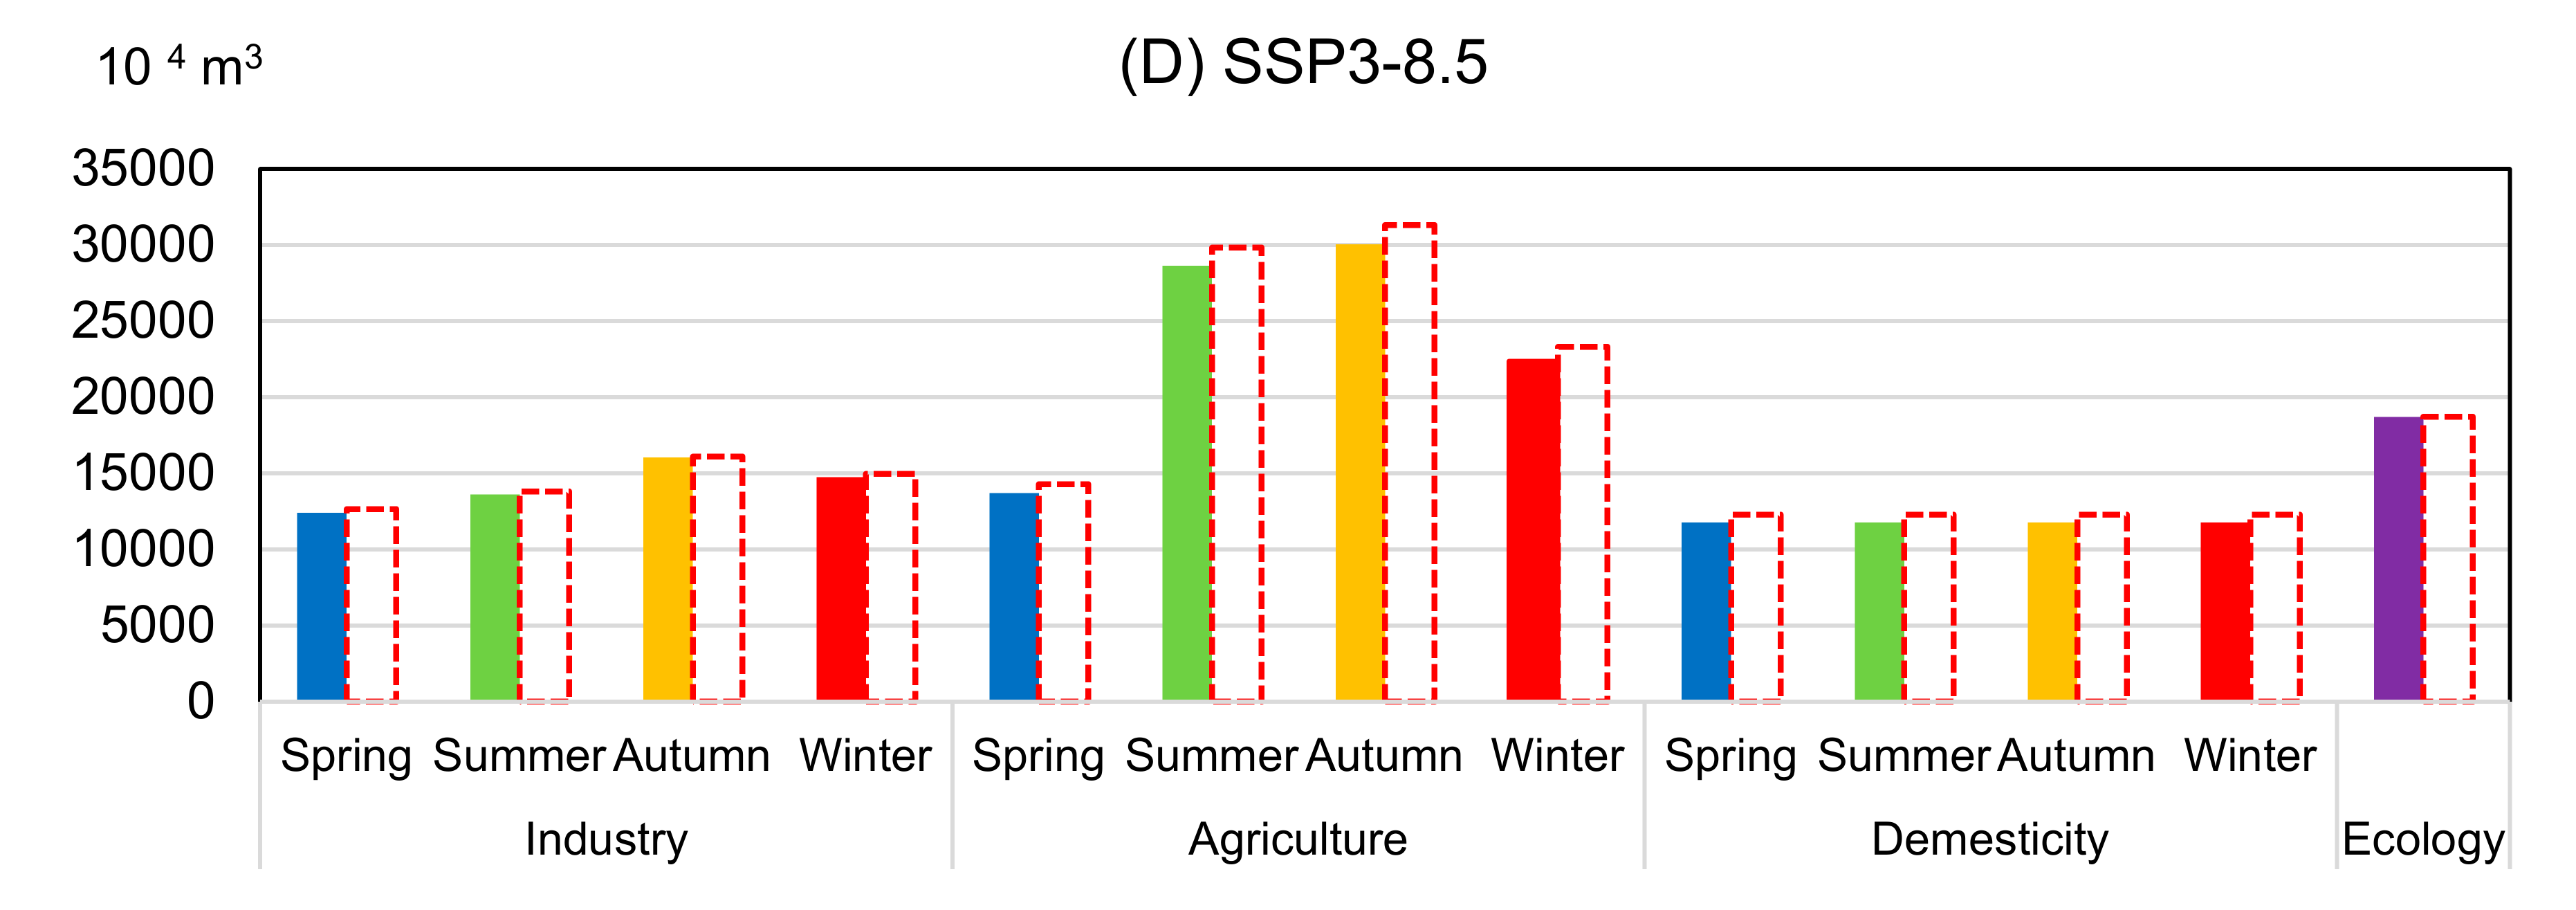
4.1. Seasonal Water Allocation Strategies with Normal Available Water
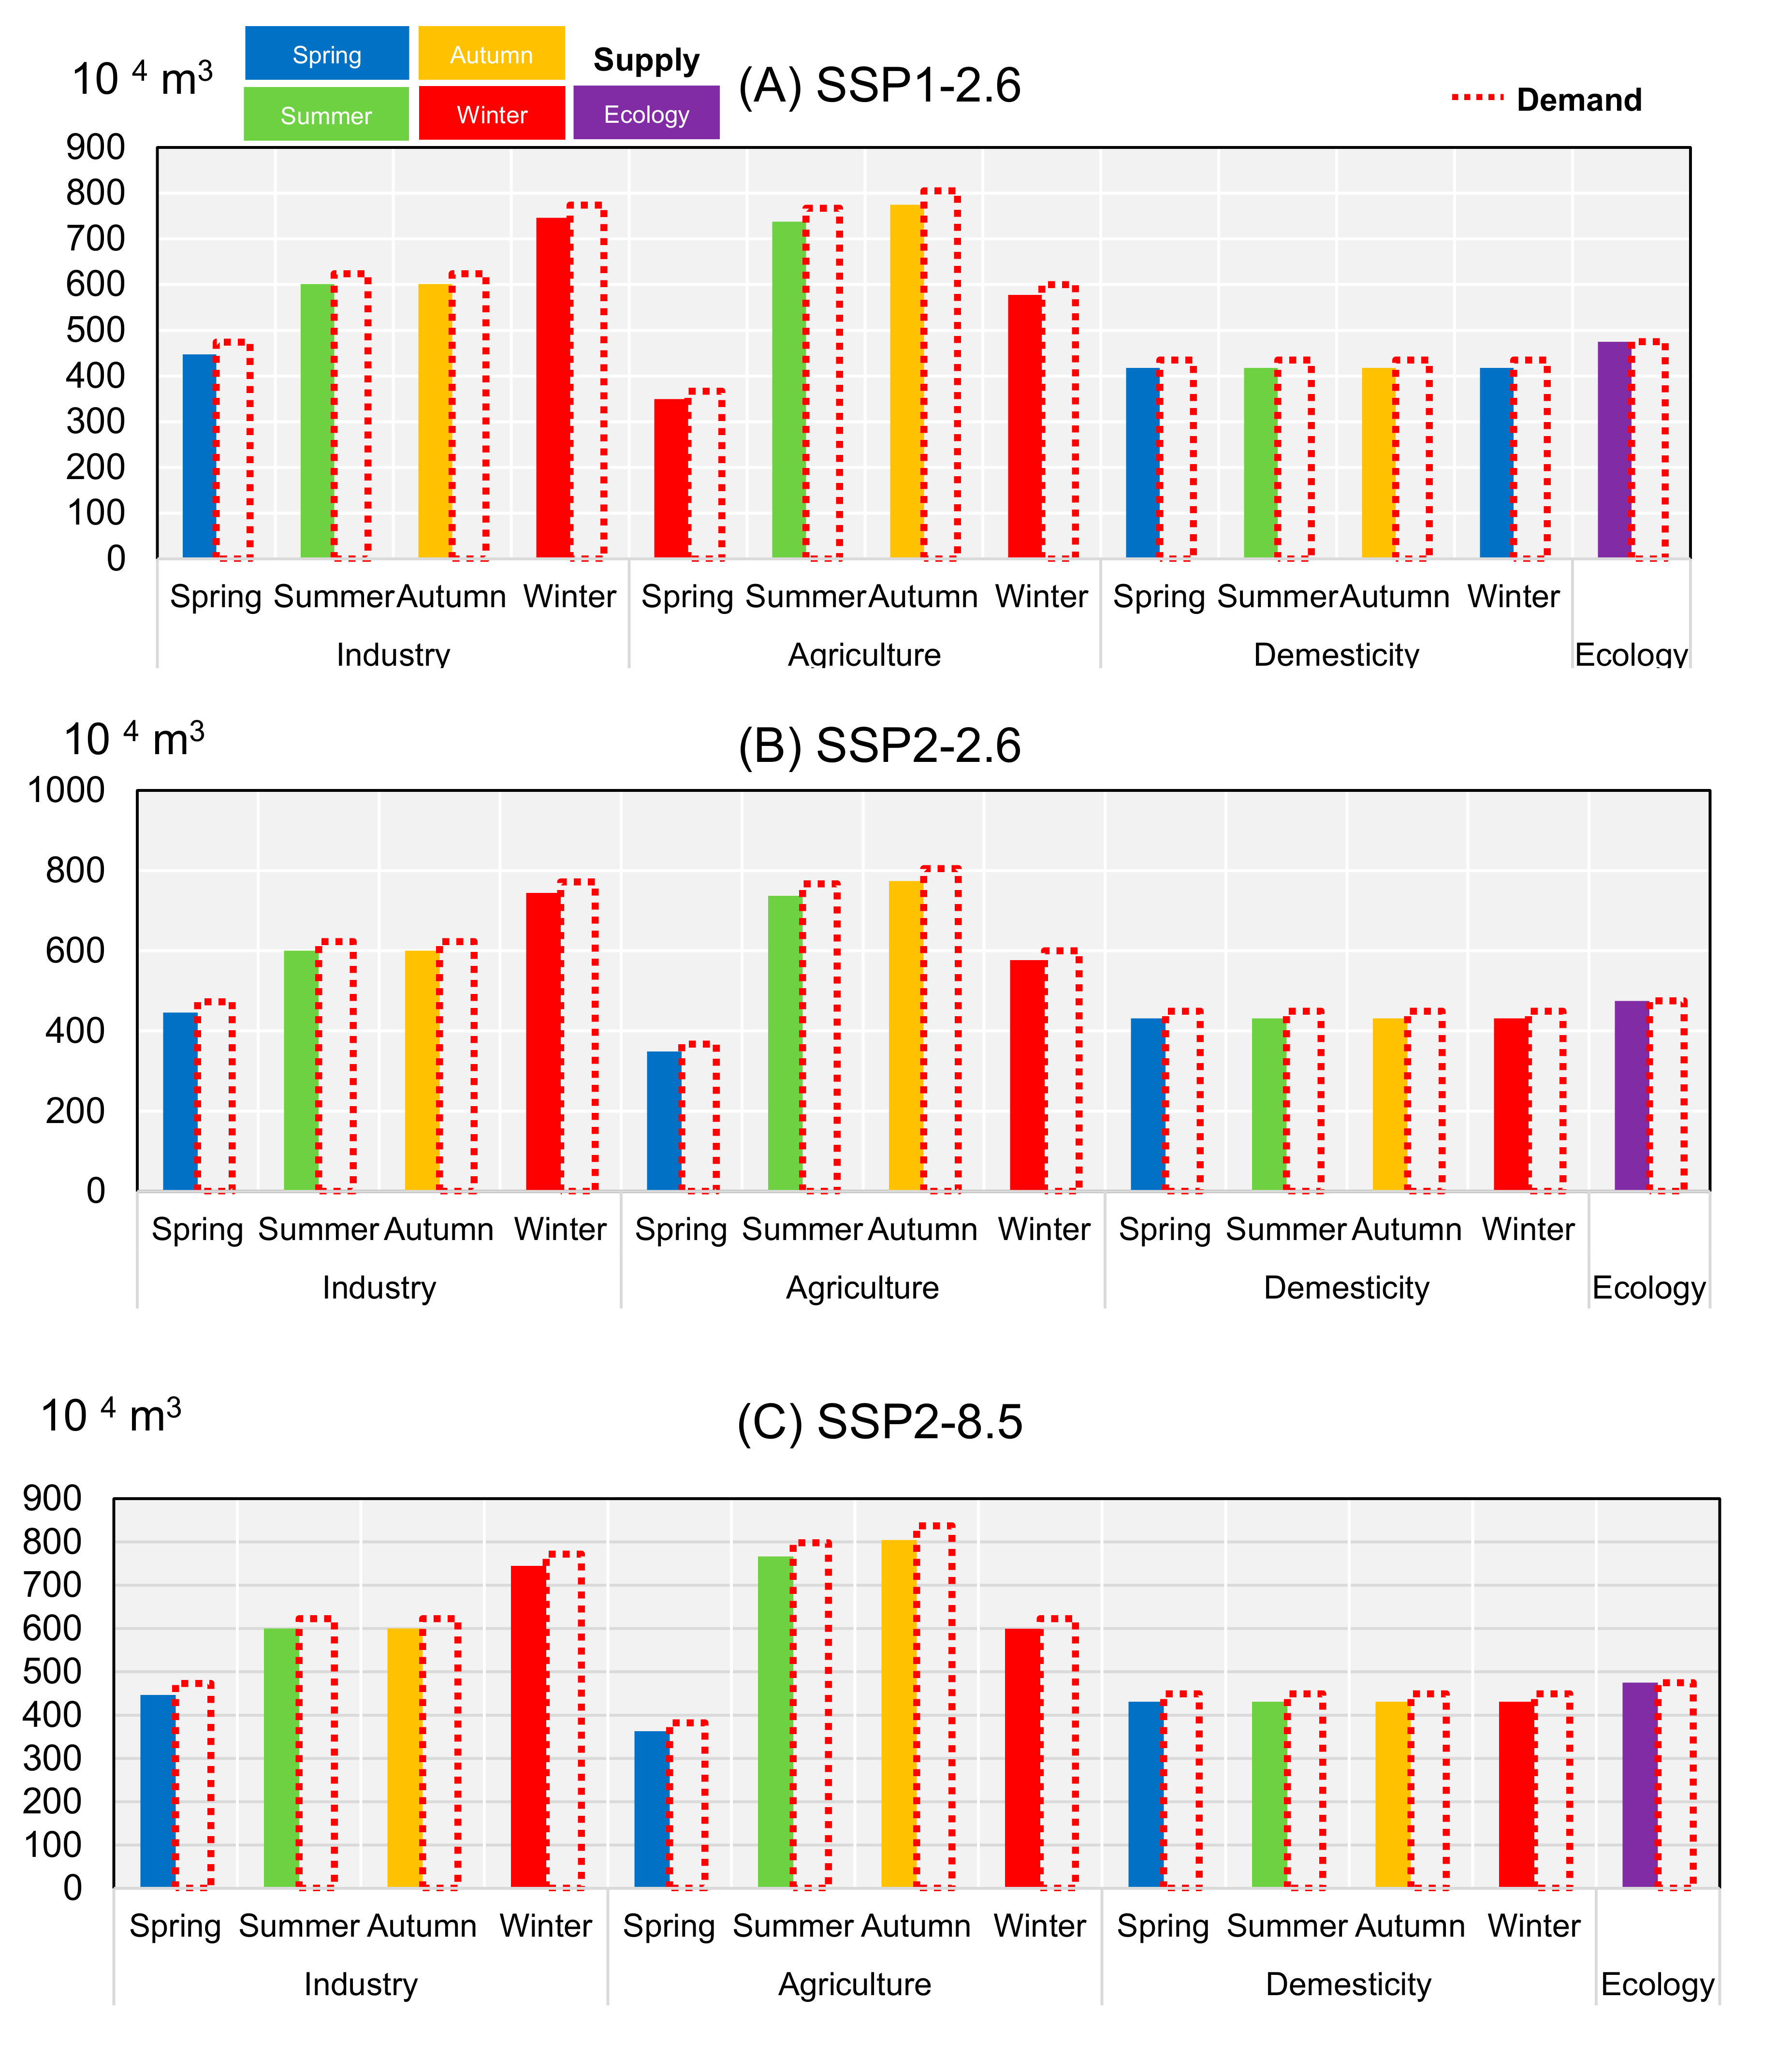
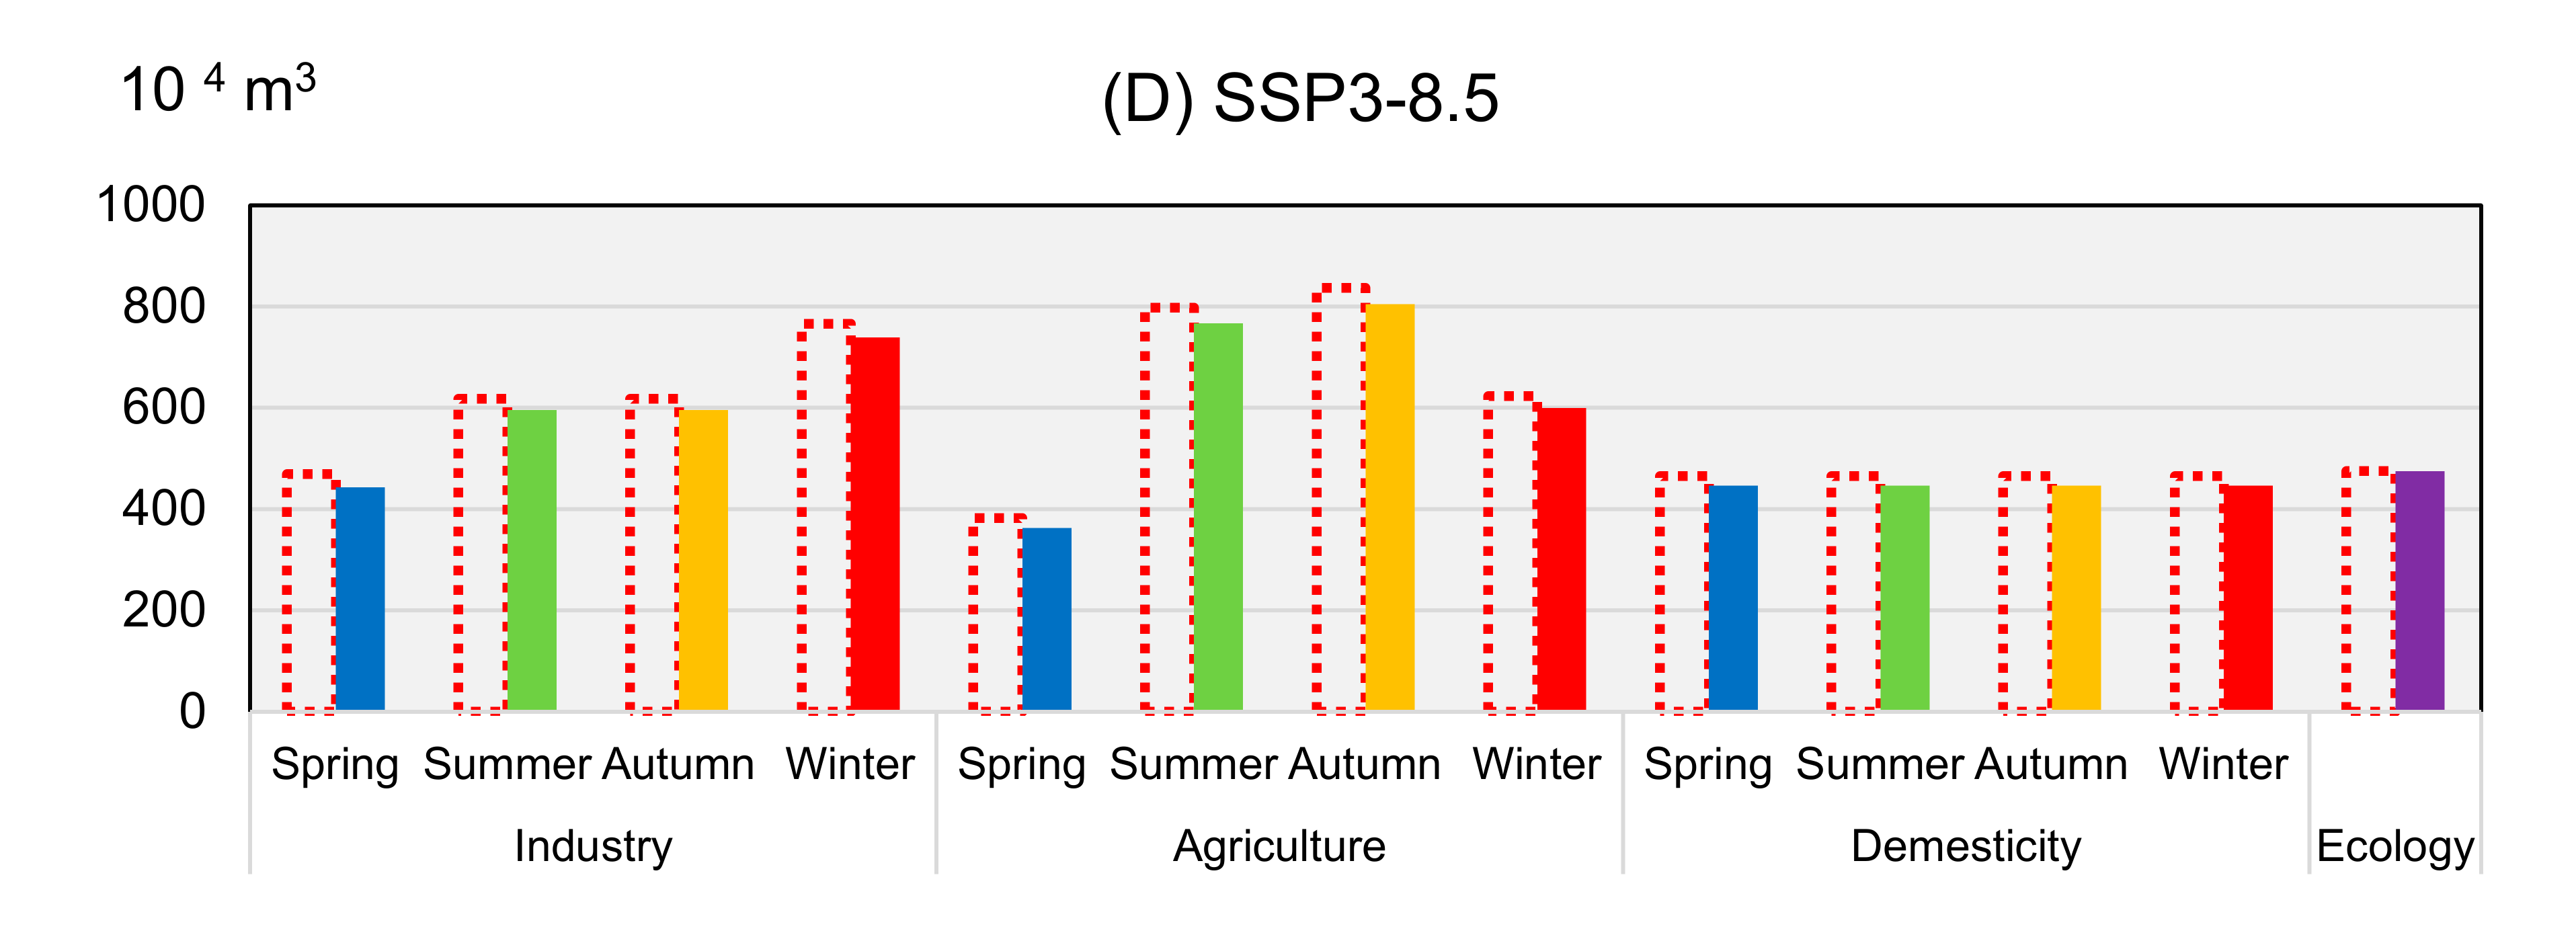
Without any preference for each objective, the middle solution was chosen to analyze the seasonal water allocation strategies. The two provinces’ seasonal water allocation strategies were solved using the proposed dynamic multi-objective programming model, which considered the ecological water demand and the water demand from climate change and economic development, the influences for which are shown in
Figure 3a–d and
Figure 4a–d.
In the four scenarios, both Shaanxi and Henan provinces experienced water scarcity. In the SSP1-2.6 and SSP2-2.6 scenarios, Shaanxi province sells water to Henan province because of the higher economic benefits than would have been gained from self-production, with the transfer values being 0.48 million m3 (under SSP1-2.6 scenario) and 0.02 million m3 (under SSP2-2.6 scenario). However, as the available basin water cannot satisfy the water demand in the two provinces, additional water is transferred from other basins and the South-to-North Water Transfer Project. Considering the water purchase and distribution costs, the amount of transferred water is optimized, with the water transfer from outside the basin being 91.07 million m3, 83.86 million m3, 165.61 million m3, and 172.71 million m3 in the four scenarios; that is, SSP1-2.6, SSP2-2.6, SSP2-8.5, and SSP3-8.5.
4.2. Effects from Varying the Available Water Resources on the Water Allocation Strategies
Water availability is a crucial factor when allocating limited resources to different users. As the relationship between water allocation and water availability is not linear [
17], this section explores the correlativity between them by solving the proposed model under different hydrological conditions.
Table 5 and
Table 6 illustrate the adjusted water allocation strategies under different hydrological conditions (slight dry condition and wet condition). As shown in
Table 5, more water is allocated to the industrial sector in winter (such as 743 × 10
4 m
3 in SSP1-2.6 scenario), and less water is allocated to the industrial sector in spring (such as 455 × 10
4 m
3 in SSP1-2.6 scenario). By contrast, more water is irrigated for crop growth in summer and autumn, with 736 × 10
4 m
3 and 773 × 10
4 m
3, respectively, in the SSP1-2.6 scenario. Besides, with the increase in water availability, more water can be used by the four sectors in Shaanxi. In all, the optimized seasonal water withdrawals in Shaanxi are shown in
Table 5.
In Henan province, more water is used for industrial development in Autumn; for example, 15,122 × 10
4 m
3 water is consumed in the SSP1-2.6 scenario, and the other values are shown in
Table 6. Additionally, 25,510 × 10
4 m
3 and 27351 × 10
4 m
3 water is irrigated, respectively, in Henan’s spring and summer in the SSP1-2.6 scenario. Furthermore, there is the same level of seasonal domestic water demand in the two provinces, which is instead influenced by climate and socio-economic factors.
4.3. Effects of the Water Market
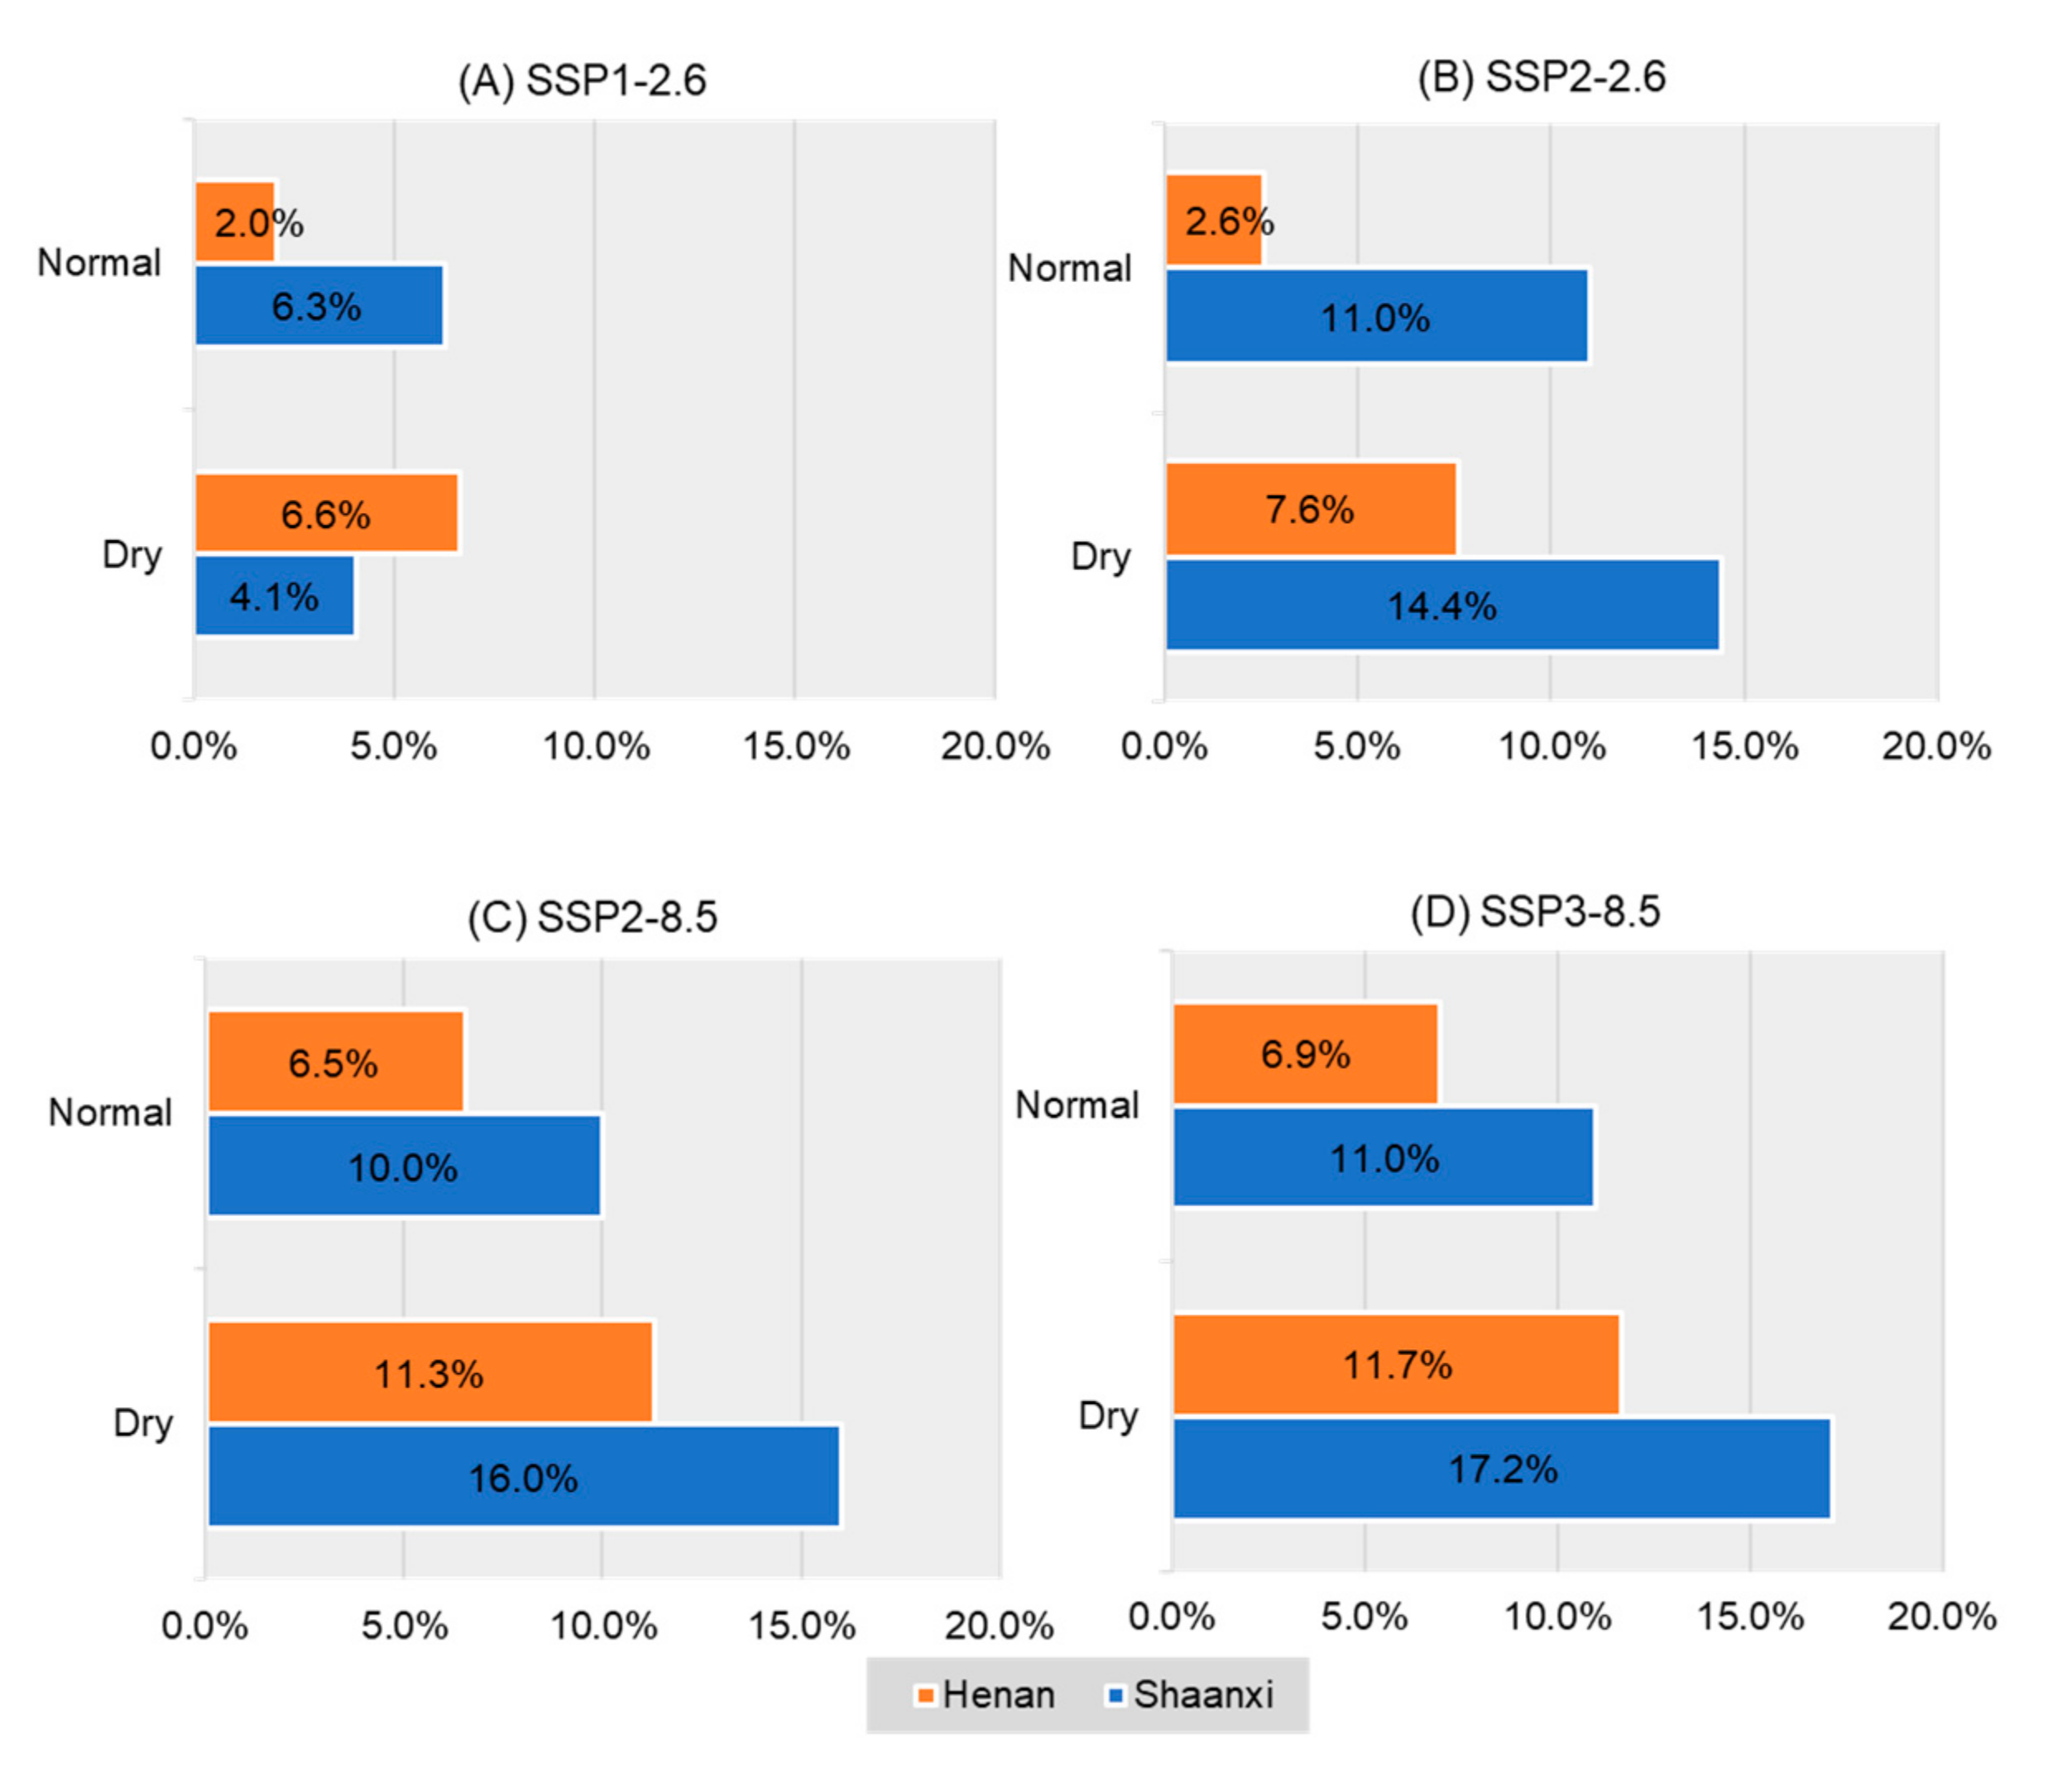
By comparison to the water demands in this basin, we found that locally available water cannot satisfy it. Therefore, to determine the economic, social, and environmental benefits, a water market strategy is needed to reduce the gap between demand and supply. Water scarcity ratios and water stress indices are calculated in this section to reflect the water market’s impact.
Figure 5a–d shows the average water scarcity ratios in each province under different future conditions without considering the water transfers. As can be seen, the average water scarcity ratios in both provinces are the same in both wet and normal conditions; however, the ratio in Shaanxi province is larger than in Henan province, possibly because Shaanxi province has limited water and therefore it is not economically, socially, or ecologically efficient to produce water-intensive goods.
The water stress index, which is an integration of the water use stress (
) and the water environment stress (
), was calculated using Equation (S1) in the
Supplementary Materials, in which
and
are the weight coefficients, which were 0.5 and 0.5 in this study without any preference to each of the estimation index.
is the total water use volume divided by the total available water volume, and
is the total wastewater volume divided by the total available water volume, with the wastewater emission coefficients in each sector having been simulated from historical data published National bureau of statistics.
Using Equations (1)–(3), the water stress indices were determined without considering the water market. After calculating the differences, the reduced water stress was determined, as shown in
Table 7. In the slightly dry condition and normal condition, water use and water environment stresses are increasingly reduced with the deterioration of the future conditions. It is also found that the market-based optimization method works better in the worse scenario.
4.4. Roles of Policymakers
4.4.1. Implementing Adjusted Strategies for Local Water Management and Water Transfers
For each scenario, optimal water allocation and transfer options were offered for local government to mitigate climate change, control the Chemical Oxygen Demand (COD) emissions, and encourage economic development.
Possible future pathways were quantified based on which sectoral water demands were predicted. The adapted water resources and intra-basin and inter-basin water transfers were determined using the proposed market-based dynamic multi-objective model. Hence, under different future conditions, the water scarcity problem in the Yiluo river basin cannot be ignored, and water transfers from other basins are needed. Besides, different local water allocation strategies and water transfer ratios can be optimized, faced with changing future conditions.
4.4.2. Exploring Alternative Water Resources and Saving Water
Water use stress in some regions such as Shaanxi and Henan provinces arises due to natural water scarcity. Therefore, to relieve these problems, this study optimized the water transfers from other regions. However, in slight-dry and normal scenarios (with possibilities of 0.3 and 0.5), it was found that there was no water basin development pathway could fully satisfy the water demand, even though varying the water transfer ratios could, to some extent, help meet demand and relieve the water use and environmental stresses.
Hence, alternative water resources should be found in the future, such as reclaimed water and desalinated water. Meanwhile, higher water use efficiency should be encouraged. For example, the agricultural sector could seek to optimize planting areas and implement water-saving irrigation measures. The industrial sector could increase its water reuse ratios and reduce the water used for cooling, and the domestic sector could be encouraged to save water and implement grey water reuse systems.
4.4.3. Reinforcing Environmental Regulations
Water quality has become a critical problem in many river basins due to agricultural fertilizer runoffs and industrial and municipality wastewater, which put significant pressure on the water environment. To sustainably develop river basins, this study defines an environment-based objective, minimized the total pollution entering the water body, and calculated the reduced environmental stress after introducing water transfers in different scenarios based on various climate change and economic development effects. In wetter years, it would be necessary to enforce environmental regulations on the industrial and agricultural sectors, especially on heavily polluting enterprises, and in dry years, environmental regulations are needed to ensure adequate ecological water demands and environmental balance.
5. Conclusions
Water management directly affects local, national, and global sustainable development; there has been an increased focus on ensuring that in the future all people have access to “clean water and sanitation” and have “zero hunger.” In China, the South–North Water Transfer Project and the water market’s instigation are proved to relieve water use and water environmental stress. However, as there is always economic development, seasonal precipitation differences, and evaporation uncertainties, it is often difficult to determine the planning year’s water demand and availability. Therefore, to examine the degree to which a changing climate and economic development modes affect water management strategies, this study developed a three-stage framework to consider the impacts of varying meteorological, economic, and social factors on adjusted water management strategies. Therefore, this paper’s primary contribution can be expressed as: (1) optimized the quantity of water that needed to be used locally to balance the economy-society-environment, and (2) several future scenarios were simulated and qualified and adjusted strategies suggested to deal with water scarcity in different planning years.
To verify the feasibility of the proposed decision-making framework and optimization model, a real-world case study focused on the Yiluo river basin. An optimal integrated solution to the local water allocations in Shaanxi and Henan provinces was determined, and several water transfers were suggested based on the results. Then, simulated input data were employed to illustrate the adjusted water allocation strategies under different future conditions. It was found that the water scarcity problem in the Yiluo river basin would not be satisfied by its water supplies and that water transfers from other basins would be needed.
Future studies plan to develop an in-depth framework coupling machine learning with a regression model to predict the water demand. Further, multiple driving forces are considered in addition to climate-driven and socio-economic development-driven factors. Finally, based on the proposed optimization model, managerial insights can be offered to allocate water resources to satisfy decision-making targets towards economic-societal-environmental benefits improvement.
Author Contributions
Conceptualization, Z.X. and L.Y.; methodology, Z.X.; software, Y.L.; validation and data curation, Y.L.; writing—original draft preparation, Z.X. and Y.L.; writing—review and editing, Y.L.; funding acquisition, L.Y. All authors have read and agreed to the published version of the manuscript.
Funding
The work is supported by the National Natural Science Foundation of China (Grant No. 71771157), Funding of Sichuan University (Grant No. skqx201726 and 2019hhs-19), and Social Science Funding of Sichuan Province (Grant No. SC19TJ005).
Conflicts of Interest
The authors declare no conflict of interest.
References
- UK Government. Water for Life: Market Reform Proposals. 2011. Available online: https://www.gov.uk/government/publications/water-for-life-market-reform-proposals (accessed on 8 December 2011).
- Moro, M.A. An Evolutionary Approach to Water Innovation: Comparing the Water Innovation Systems in China and Europe. Ph.D. Thesis, Technical University of Denmark, Kongens Lyngby, Denmark, March 2018. [Google Scholar]
- Republic of South Africa. National Water and Sanitation Master Plan. 2019. Available online: https://www.gov.za/sites/default/files/gcis_document/201911/national-water-and-sanitation-master-plandf.pdf (accessed on 31 October 2018).
- Popp, A.; Calvin, K.; Fujimori, S.; Havlik, P.; Humpenöder, F.; Stehfest, E.; Bodirsky, B.L.; Dietrich, J.P.; Doelmann, J.C.; Gusti, M.; et al. Land-use futures in the shared socio-economic pathways. Glob. Environ. Chang. 2017, 42, 331–345. [Google Scholar] [CrossRef]
- Arunkumar, R.; Jothiprakash, V. Optimal crop plans for a multi-reservoir system having intra-basin water transfer using multi-objective evolutionary algorithms coupled with chaos. Comput. Electron. Agric. 2017, 140, 34–47. [Google Scholar] [CrossRef]
- Shourian, M.; Raoufi, Y.; Attari, J. Interbasin Water Transfer Capacity Design by Two Approaches of Simulation-Optimization and Multicriteria Decision Making. J. Water Resour. Plan. Manag. 2017, 143, 04017054. [Google Scholar] [CrossRef]
- Zhuo, L.; Mekonnen, M.M.; Hoekstra, A.Y. Consumptive water footprint and virtual water trade scenarios for China—With a focus on crop production, consumption and trade. Environ. Int. 2016, 94, 211–223. [Google Scholar] [CrossRef] [PubMed]
- Van Vuuren, D.P.; Edmonds, J.; Kainuma, M.; Riahi, K.; Thomson, A.; Hibbard, K.; Hurtt, G.C.; Kram, T.; Krey, V.; Lamarque, J.-F.; et al. The representative concentration pathways: An overview. Clim. Chang. 2011, 109, 5–31. [Google Scholar] [CrossRef]
- Xia, Y.; Hu, Y.; Liu, J. Comparison of trends in the Hadley circulation between CMIP6 and CMIP5. Sci. Bull. 2020, 65, 1667–1674. [Google Scholar] [CrossRef]
- Tamaddun, K.A.; Kalra, A.; Kumar, S.; Ahmad, S. CMIP5 Models’ Ability to Capture Observed Trends under the Influence of Shifts and Persistence: An In-Depth Study on the Colorado River Basin. J. Appl. Meteorol. Clim. 2019, 58, 1677–1688. [Google Scholar] [CrossRef]
- Arnell, N.W.; Lloyd-Hughes, B. The global-scale impacts of climate change on water resources and flooding under new climate and socio-economic scenarios. Clim. Chang. 2013, 122, 127–140. [Google Scholar] [CrossRef]
- Rosegrant, M.W.; Binswanger, H.P. Markets in tradable water rights: Potential for efficiency gains in developing country water resource allocation. World Dev. 1994, 22, 1613–1625. [Google Scholar] [CrossRef]
- Nasiri-Gheidari, O.; Marofi, S.; Adabi, F. A robust multi-objective bargaining methodology for inter-basin water resource allocation: A case study. Environ. Sci. Pollut. Res. 2017, 25, 2726–2737. [Google Scholar] [CrossRef]
- Li, M.; Xu, Y.; Fu, Q.; Singh, V.P.; Liu, D.; Li, T. Efficient irrigation water allocation and its impact on agricultural sustainability and water scarcity under uncertainty. J. Hydrol. 2020, 586, 124888. [Google Scholar] [CrossRef]
- Xie, Y.; Xia, D.; Huang, G.; Ji, L. Inexact stochastic optimization model for industrial water resources allocation under considering pollution charges and revenue-risk control. J. Clean. Prod. 2018, 203, 109–124. [Google Scholar] [CrossRef]
- Xu, Z.; Yao, L.; Zhou, X.; Moudi, M.; Zhang, L. Optimal irrigation for sustainable development considering water rights transaction: A Stackelberg-Nash-Cournot equilibrium model. J. Hydrol. 2019, 575, 628–637. [Google Scholar] [CrossRef]
- Yao, L.; Xu, Z.; Chen, X. Sustainable water allocation strategies under various climate scenarios: A case study in China. J. Hydrol. 2019, 574, 529–543. [Google Scholar] [CrossRef]
- Gu, J.; Huang, G.; Guo, P.; Shen, N. Interval multi-stage joint-probabilistic integer programming approach for water resources allocation and management. J. Environ. Manag. 2013, 128, 615–624. [Google Scholar] [CrossRef]
- Hu, Z.; Wei, C.; Yao, L.; Li, L.; Li, C. A multi-objective optimization model with conditional value-at-risk constraints for water allocation equality. J. Hydrol. 2016, 542, 330–342. [Google Scholar] [CrossRef]
- Xu, J.; Lv, C.; Yao, L.; Hou, S. Intergenerational equity based optimal water allocation for sustainable development: A case study on the upper reaches of Minjiang River, China. J. Hydrol. 2019, 568, 835–848. [Google Scholar] [CrossRef]
- Guo, X.; Hu, T.; Zhang, T.; Lv, Y. Bilevel model for multi-reservoir operating policy in inter-basin water transfer-supply project. J. Hydrol. 2012, 424, 252–263. [Google Scholar] [CrossRef]
- Cuaresma, J.C. Income projections for climate change research: A framework based on human capital dynamics. Glob. Environ. Chang. 2017, 42, 226–236. [Google Scholar] [CrossRef]
- Wang, X.-J.; Zhang, J.-Y.; Shahid, S.; Guan, E.-H.; Wu, Y.-X.; Gao, J.; He, R.-M. Adaptation to climate change impacts on water demand. Mitig. Adapt. Strat. Glob. Chang. 2016, 21, 81–99. [Google Scholar] [CrossRef]
- Wang, L.; Fang, L.; Hipel, K.W. Basin-wide cooperative water resources allocation. Eur. J. Oper. Res. 2008, 190, 798–817. [Google Scholar] [CrossRef]
- Al-Najar, H.; Ashour, E.K. The impact of climate change and soil salinity in irrigation water demand on the Gaza Strip. J. Water Clim. Chang. 2013, 4, 118–130. [Google Scholar] [CrossRef]
| Publisher’s Note: MDPI stays neutral with regard to jurisdictional claims in published maps and institutional affiliations. |
© 2020 by the authors. Licensee MDPI, Basel, Switzerland. This article is an open access article distributed under the terms and conditions of the Creative Commons Attribution (CC BY) license (http://creativecommons.org/licenses/by/4.0/).


