Article

Three Decades of Changes in Brazilian Municipalities and Their Food Production Systems

1
Center for Systems Integration and Sustainability, Department of Fisheries and Wildlife, Michigan State University, East Lansing, MI 48823, USA
2
Center for Environmental Studies and Research, State University of Campinas, Campinas 13083-867, Brazil
3
Embrapa Agricultural Informatics, Brazilian Agricultural Research Corporation, Campinas 13083-886, Brazil
4
Department of Geography, King’s College London, London WC2R 2LS, UK
5
Center for Global Change and Earth Observations, Michigan State University, East Lansing, MI 48823, USA
6
Center of Nuclear Energy in Agriculture, University of São Paulo, Piracicaba 13416-000, Brazil
7
Environmental Geography Group, Institute for Environmental Studies, Vrije Universiteit Amsterdam, de Boelelaan, 1081HV Amsterdam, The Netherlands
*
Author to whom correspondence should be addressed.
Land 2020, 9(11), 422; https://doi.org/10.3390/land9110422
Submission received: 22 September 2020 / Revised: 22 October 2020 / Accepted: 26 October 2020 / Published: 30 October 2020

Abstract

:
Agricultural systems are heterogeneous across temporal and spatial scales. Although much research has investigated farm size and economic output, the synergies and trade-offs across various agricultural and socioeconomic variables are unclear. This study applies a GIS-based approach to official Brazilian census data (Agricultural Censuses of 1995, 2006, and 2017) and surveys at the municipality level to (i) evaluate changes in the average soybean farm size across the country and (ii) compare agricultural and socioeconomic outcomes (i.e., soybean yield, agricultural production value, crop production diversity, and rural labor employment) relative to the average soybean farm size. Statistical tests (e.g., Kruskal–Wallis tests and Spearman’s correlation) were used to analyze variable outcomes in different classes of farm sizes and respective Agricultural Censuses. We found that agricultural and socioeconomic outcomes are spatially correlated with soybean farm size class. Therefore, based on the concepts of trade-offs and synergies, we show that municipalities with large soybean farm sizes had larger trade-offs (e.g., larger farm size was associated with lower crop diversity), while small and medium ones manifest greater synergies. These patterns are particularly strong for analysis using the Agricultural Census of 2017. Trade-off/synergy analysis across space and time is key for supporting long-term strategies aiming at alleviating unemployment and providing sustainable food production, essential to achieve the UN Sustainable Development Goals.

1. Introduction

Food production systems are diverse by nature and vary in space and time depending on cultural and social assets, available infrastructure, capital, market, and biophysical conditions. This variability leads to, e.g., the emergence of large, medium and small farms (in terms of area and production volumes), and differences in crops produced [1]. The United Nations Sustainable Development Goals (SDGs), launched in 2015, defined targets intrinsically related to human dimensions (e.g., gender, economy, culture, environment, food) as part of the challenge of achieving future sustainable societies [2]. Previous literature has called attention to the need of achieving synergies, and minimizing trade-offs, between SDGs related to food systems [3]. Farm size and production, along with numerous other agricultural-socioeconomic measures, are key indicators for understanding the sustainability of food systems [4,5]. However, greater understanding is needed about when, where, and in which situations large or small farms can achieve better production outcomes, and improved synergies considering production, environment, and economy [1,6,7,8,9,10].
Recently, Rada and Fuglie [4] suggested that farm size and productivity evolve with the stages of economic development in a region and that there is no single economically optimal agrarian structure. However, the logic of economies of scale has driven increased production to favor larger farms in many places [5] and leading regions to specialize in specific commodity products to gain competitive advantages. This increased production and specialization has been traded-off against other agricultural socioeconomic benefits (e.g., lowering rural labor demand and crop diversity) and environmental degradation [11,12,13,14,15,16]. In fact, over recent decades, new food production regions organized around large-scale farming operations have emerged, based on specific agricultural commodities to supply demand elsewhere, sometimes sourcing geographically distant places to create what are known as “telecoupled food systems” [17,18]. On the other hand, there is evidence that in some situations, large corporate farms can end up having reduced productivity, and being outcompeted by productivity of farms operating in the same business but individually producing at smaller scales [8,12,15]. Additionally, small farms (with less than 2 ha) represent around 84% of the world’s farms [19], and a study looking to Latin America, sub-Saharan Africa, and South and East Asia concluded that the smallholders (having less than 5 ha) in those regions contribute more than half of global food calories [1].
Across food systems, trade-offs and synergies between agricultural and socioeconomic measures are expected [3,9]. Synergies are situations where multiple variables have desirable values simultaneously, and are informally known as “win-win situations” [20]. For example, a synergy might be viewed to exist when high crop yields are achieved together with higher crop diversity, rural employment, and monetary gains per land unit. In contrast, a trade-off results from a situation of antagonism and requires a decision to accept fewer desirable values of one variable (or set of variables) in return for more desirable values of another [21]. Trade-offs and synergies in food systems arise at multiple hierarchical levels [9], such as at the farm level where a producer may decide what kind of crops to produce, or the municipality level where the combination of farms’ outcomes (production) may increase local jobs, landscape connectivity, or resilience to market shocks. In trade-off situations, a producer or another hierarchical level (e.g., a given municipality) cannot achieve desired positive outcomes in all dimensions and a decision towards a given benefit may detrimentally impact another socioeconomic or ecological dimension [22]. Trade-off and synergy analysis, sometimes treated as opposing concepts [9], is central to the growing debate about sustainable food systems [9,23,24,25,26].
For example, one trade-off from a socioeconomic perspective might be that municipalities with large soybean producers rely on a few rural laborers, meaning that large enterprises are supported at low labor levels. In a country with critical levels of poverty and unemployment [27], this trade-off is significant. From a socioecological perspective, crop diversity has critical importance for creating multifunctional landscapes and, therefore, represents an important variable to determine if municipalities (according to their average soybean farm sizes) are socioecologically resilient. A lower crop diversity, expected to be found in monocultural agricultural frontiers [28], represents an ecological trade-off of large-scale commodity production areas. Soybean yield is considered one of the key dimensions to determine producers’ profitability [29] with higher yields assumed to equate greater profit. Here lies an important economic trade-off, e.g., soybean yield vs. the production scale of the farm. Driven by economies of scale, sometimes large soybean farmers end up producing crops in large areas but with low yields, which in-turn squeezes profitability while operating at large scales [5]. These examples demonstrate how different perspectives on the values of multiple variables can produce trade-offs. Hence, a synergy situation, e.g., is achieved when a municipality has a highly diversified crop portfolio at the same time of absorbing higher laborers to work in croplands and additionally obtaining high crop yields. The synergy here brings socioeconomic and ecological gains but also indicates a likelihood of association between municipalities with small and medium farmers in average [1].
Considering food systems as heterogeneous and dynamic, there is still a need for studies on synergies and trade-offs in food systems across space and time simultaneously [30,31], as previous studies have usually addressed broad or local scales with no temporal analysis or consideration of variations across geographical regions [32,33,34,35]. For instance, Tittonell et al. [32] conduced an in-depth local study on a small set of smallholder maize producers in Kenya to model how decisions lead to trade-off situations based on a data set representing a snapshot of year 2002. In Lemaire et al. [34], the authors hypothesized the need of coupling crop and livestock production in more diversified systems as a necessary pathway to foster synergies between production and environmental quality and highlighted the need of spatial and temporal approaches for studying those dynamics. However, the study addressed neither the spatial nor the temporal dimension through quantitative data analysis approach. In Fader et al. [35], the authors developed a quantitative approach to deal with many synergy and trade-off situations between water, energy, and food, but at a general level, leading the authors to suggest more studies at specific locations in order to understand the results. Our study proposes to understand trade-offs and synergies related to farm size, production volumes, and social outcomes [1,10].
We examine the Brazilian food system (i.e., agricultural production and its related socioeconomic dimensions across municipality and farm levels), looking at municipalities according to their average soybean farm sizes. We take this approach as previous empirical findings have pointed out that between large and small soybean producers, there are many nuanced differences, such as more diversified agricultural portfolio in the latter but export crops in the former [36]. We expect to see these effects at the municipality level. Brazil has increased its participation in the global food production and trade, becoming a major producer and exporter of cereals, soybean, and beef [37]. Brazilian food systems have been shaped by domestic and international forces during the last three decades, a period of monetary stabilization, public cuts in agricultural incentives, and entrance of private firms leveraging farmers’ choices towards a more capital-intensive agribusiness system [16,38,39,40]. Partially explained by the national colonization history, partially by geographical location, infrastructure, and environmental conditions, Brazil has developed different agricultural production regions, varying from small-to-medium farm sizes to large ones, the last often associated to Midwestern and Northern regions of the country [5,16,18,38,41]. Since the 1940s, the Brazilian Federal Government started colonization projects that aimed to integrate the Midwest and Northern regions with the rest of the country by connecting them to the national economy as a provider of agricultural products and support for the industrialization of the southeast [42,43]. In the 1970s, the colonization process started to be led by private companies aiming to create agricultural settlements [43] and private companies predominantly from Rio Grande do Sul were attracted by the opportunity to purchase large portions of land at low prices. Consequently, hubs of large land occupation started to appear in Mato Grosso and other areas of Central Brazil.
Expansion of soybean cultivation in Brazilian tropical regions (mainly in the Cerrado biome) in recent decades (50% of world’s new areas since 2000 [18]) brought massive land changes, together with public health issues caused by the use of agrochemicals [44], but also providing some socioeconomic benefits [45]. Therefore, in face of the expected continued growth in soybean demand globally, further reinforced in Brazil as a result of a developing the US–China Trade War [46], we argue for the need to understand spatiotemporal patterns of crop yield, production values, and rural labor demand of large-size soybean farms in comparison to medium and small soybean farms.
Supported by the premise that sustainable food systems must be holistically evaluated by taking into consideration the trade-offs and synergies between socioeconomics and environmental impacts [22,23], we place our lens at the municipality level, looking for associations of trade-offs and synergies in the food systems with the varying soybean farm sizes across Brazil. The farm unit is where farmers’ decisions can be explicitly evaluated [5] but is at the local scales (e.g., municipality) that effects of farming landscapes are better understood as they are dependent upon political, economic, or biophysical contexts [35]. Additionally, previous studies have demonstrated that broader levels can be more effective for planning sustainable development than traditional farm-level planning in Brazilian contexts [47], especially for municipalities with high dependency on monocropping systems [48]. Therefore, our goal is to examine how municipalities associated to different groups of soybean farm size reached different outcomes of soybean yields, diversity in crop production, human labor uptake, and capital per cultivated land unit. Additionally, we investigate how the soybean farm sizes changed over time from region to region (across Brazil) resulting in different patterns of outcomes.

2. Materials and Methods

This study investigates spatiotemporal dynamics of food systems across Brazilian regions of varying soybean farm-size, aiming at examining the trade-offs and synergies between soybean yield, crop diversity, rural labor, and monetary returns, dimensions of the food systems strongly related to SDGs. We argue that the knowledge about the spatiotemporal distribution of farm sizes and outputs are critical for effective policy-making and conservation agendas. Data were obtained from the Agricultural Census (AC) of 1995/1996, 2006, and 2017, and from the Municipal Agricultural Production (PAM), a systematic rural survey conducted yearly since 1974, both led by the Brazilian Institute of Geography and Statistics (IBGE) with national coverage at the municipal level. Table 1 presents the list of data from IBGE sources. We also derived other variables using IBGE data (Table 1).

2.1. Average Soybean Farm Size, Labor, and Production Values

As the information of land area owned by a single farmer is confidential, we created a variable at the municipality level, SoyMFarm. This variable is a proxy to measure soybean land distribution per farm across the country and to compare with other crops’ area distribution and classify types of rural producers, using statistical data in a spatially explicit manner. Using only the rural units producing soybean (RuralP95, Rural06, and RuralP17) and the planted area with soybean (AgriProd) in the respective municipality and year, the new variable measures the average soybean planted area per producer at the municipal level (SoyMFarm) for all Brazilian municipalities (Equation (1)), a similar approach proposed by Samberg et al. [1]:
SoyMFarmi,t= SPAi,t/RPi,t,
where SPAi,t is soybean planted area at municipality i in a given year t and RPi,t is the respective number of rural properties producing soybean in those municipalities during the same year. The new variable SoyMFarm describes the average soybean farm size in each municipality. This approach to spatialize soybean farm size at the national level considers previous literature and allows us to evaluate the coherence of results [16,18,38,49,50].
The number of rural employees in croplands is a key indicator of human labor in food systems. To capture this, we calculated the area of cropland per rural laborer at the municipality level (CropPerLaborer), Equation (2):
CropPerLaboreri,t = PAi,t/CLi,t,
where PAi,t represents total planted area with all annual and perennial crops in hectares at municipality i in a given year t (AgriProd) and CLi,t is the total number of rural employees working in annual and perennial crops of the same municipality and year (Laborers95, Laborers06, and Laborers17). The production value data from IBGE represents the weighted average of the amount paid (in thousands of Reais, the Brazilian currency) to farms according to each annual and perennial crop but excluding additional costs such as taxes or transportation costs. Therefore, this value totals the cash inflow generated for all crops produced in a given municipality, resulting from trade between producers and markets (national and international). Using data on total (all crops) production value (PV) and planted area (AgriProd) per municipality i in a given year t, the value earned by each hectare of cultivated land (ProdValue) was calculated (Equation (3)):
ProdValuei,t = PVi,t/ PAi,t,
where PVi,t represents total production value from all annual and perennial crops produced in municipality i in a given year t (AgriProd) and PAi,t is the same from Equation (2). The same approach applied to calculate the variable CropPerLaborer was used to reach the variable WageAverage that represents the average of the total wage paid (W) along 1 agricultural year to each rural laborer at the municipality (Laborers06 and Laborers17) where W represented the total wage paid in a given municipality and census year (Wage06 and Wage17), Equation (4):
WageAveragei,t = Wi,t/ CLi,t.

2.2. Crop Diversity

Crop diversity represents the crop composition of a given agricultural municipality and it is expected to be lower in very specialized and commodity exporting regions compared to other regions that are less specialized and not driven by large-size farms [28,51,52]. The Shannon diversity index was chosen over Simpson’s index as Shannon is more sensitive to richness and therefore provides a better measure of the full set of crops present in a municipality (i.e., more responsive to rare species, crops in this case) [28,53]. Therefore, the Shannon diversity index (SDI) was calculated for each municipality and for the 3 years of interest, using planted area (AgriProd), Equation (5):
SDI   =   i = 1 S p i l n p i ,
where pi is the proportion of planted area per crop i (the IBGE/PAM data provide information of 71 crops). The Shannon indices were transformed to its exponential exp(SDI) to express the effective number of crops (ENC), a more suitable index because the resulting values represent the number of crops dominating the production in a given municipality [28], Equation (6):
ENC = eSDI.

2.3. Statistical and Spatiotemporal Analysis

Statistical tests that were applied to verify if significant differences were present among categories of average soybean farm size against the variables representing crop diversity, rural labor, and production value. Therefore, the variable (SoyMFarm) average soybean farm size was transformed into categorical data (SoyMFarmClass) from small to large. Class A ranges from 1 to 50 ha, B >50 and ≤200, C >200 and ≤500, D >500 and ≤1000, E >1000 and ≤2000, and F >2000. Although small and large farms may vary from definition, region, and perspectives [1,19], sometimes those definitions still vary within regions, countries, and agricultural activities. For example, small farms in Brazil generally range between 1 and 5 ha in average but in the case of soybean, they can be considered small having 6–24 ha [54]. The categorical classes of soybean farm size were based on previous literature [5,18,38,49,50,54] and supported by the IBGE Agricultural Census of 2017, where among the major soybean producer States, the minimum average soybean farm size at municipality level were found in Santa Catarina State (36 ha) and the maximum in Piauí (2187 ha). For the purpose of this study, we used small to class A, medium to classes B and C, medium-large to D, and large to E and F. Kruskal–Wallis tests were applied (normal distribution of data was rejected by a Shapiro–Wilk test using statistical significance threshold of p = 0.01) taking the SoyMFarmClass as the independent variable, allowing us to test our hypothesis that significant differences in our dependent variables are found among classes according the average soybean farm size. Soybean farm size classes in 2017 were also evaluated by the Local Moran’s I test for spatial autocorrelation [55]. Additionally, descriptive and inferential statistics (i.e., Error bars of Confidence Intervals at 95% of statistical significance) were used to support the inferences from statistical tests’ results [56] and to analyze variations in the response of each dependent variable to categorical classes of soybean farm size.
To ensure independence among data, we did not test differences between years, but only among classes of soybean farm sizes [45]. Dependent variables for each Kruskal–Wallis test were AgriProd (i.e., Soybean yield), number of laborers per hectare (CropPerLaborer), production value per hectare (ProdValue), and the effective number of crops (ENC). Spearman’s rank correlation (Shapiro–Wilk test rejected normal distribution at significance threshold p = 0.01) was applied to evaluate how ProdValue associates with ENC and if there is correlation between ENC with CropPerLaborer. The selected dependent variables contribute to achieve at least three UN Sustainable Development Goals (SDGs) of “Zero Hunger” (Targets 2.3 and 2.4), “Decent work and economic growth” (Target 8.2) and “Life on Land” (Target 15.9). Therefore, using the proposed approach, we are able to (i) trace the changes in municipality groups according to their average soybean farm size across the country and (ii) identify synergies and trade-offs between variables selected for the study at municipality level. Maximum synergy is expected when the four variables (Soybean yield, ENC, ProdValue, and CropPerLaborer) produce more desirable outcomes (mean values) within the same soybean farm size class in the respective year, i.e., having greater synergies compared to the other size classes. Additionally, a trade-off situation can be reached if a given soybean farm size class is underperforming in many or all variables (e.g., as large as the farm size class, the lower will be the performance of all variables such as large farms at the expense of lower soybean yields). Hence, our trade-off/synergy analysis is based on logical inference from the results of each variable according to the soybean farm size classes in a respective year—they are aggregated at the farm size class and the Kruskal–Wallis statistic is used to assess whether the differences between variable values in each class are statically significant.

3. Results

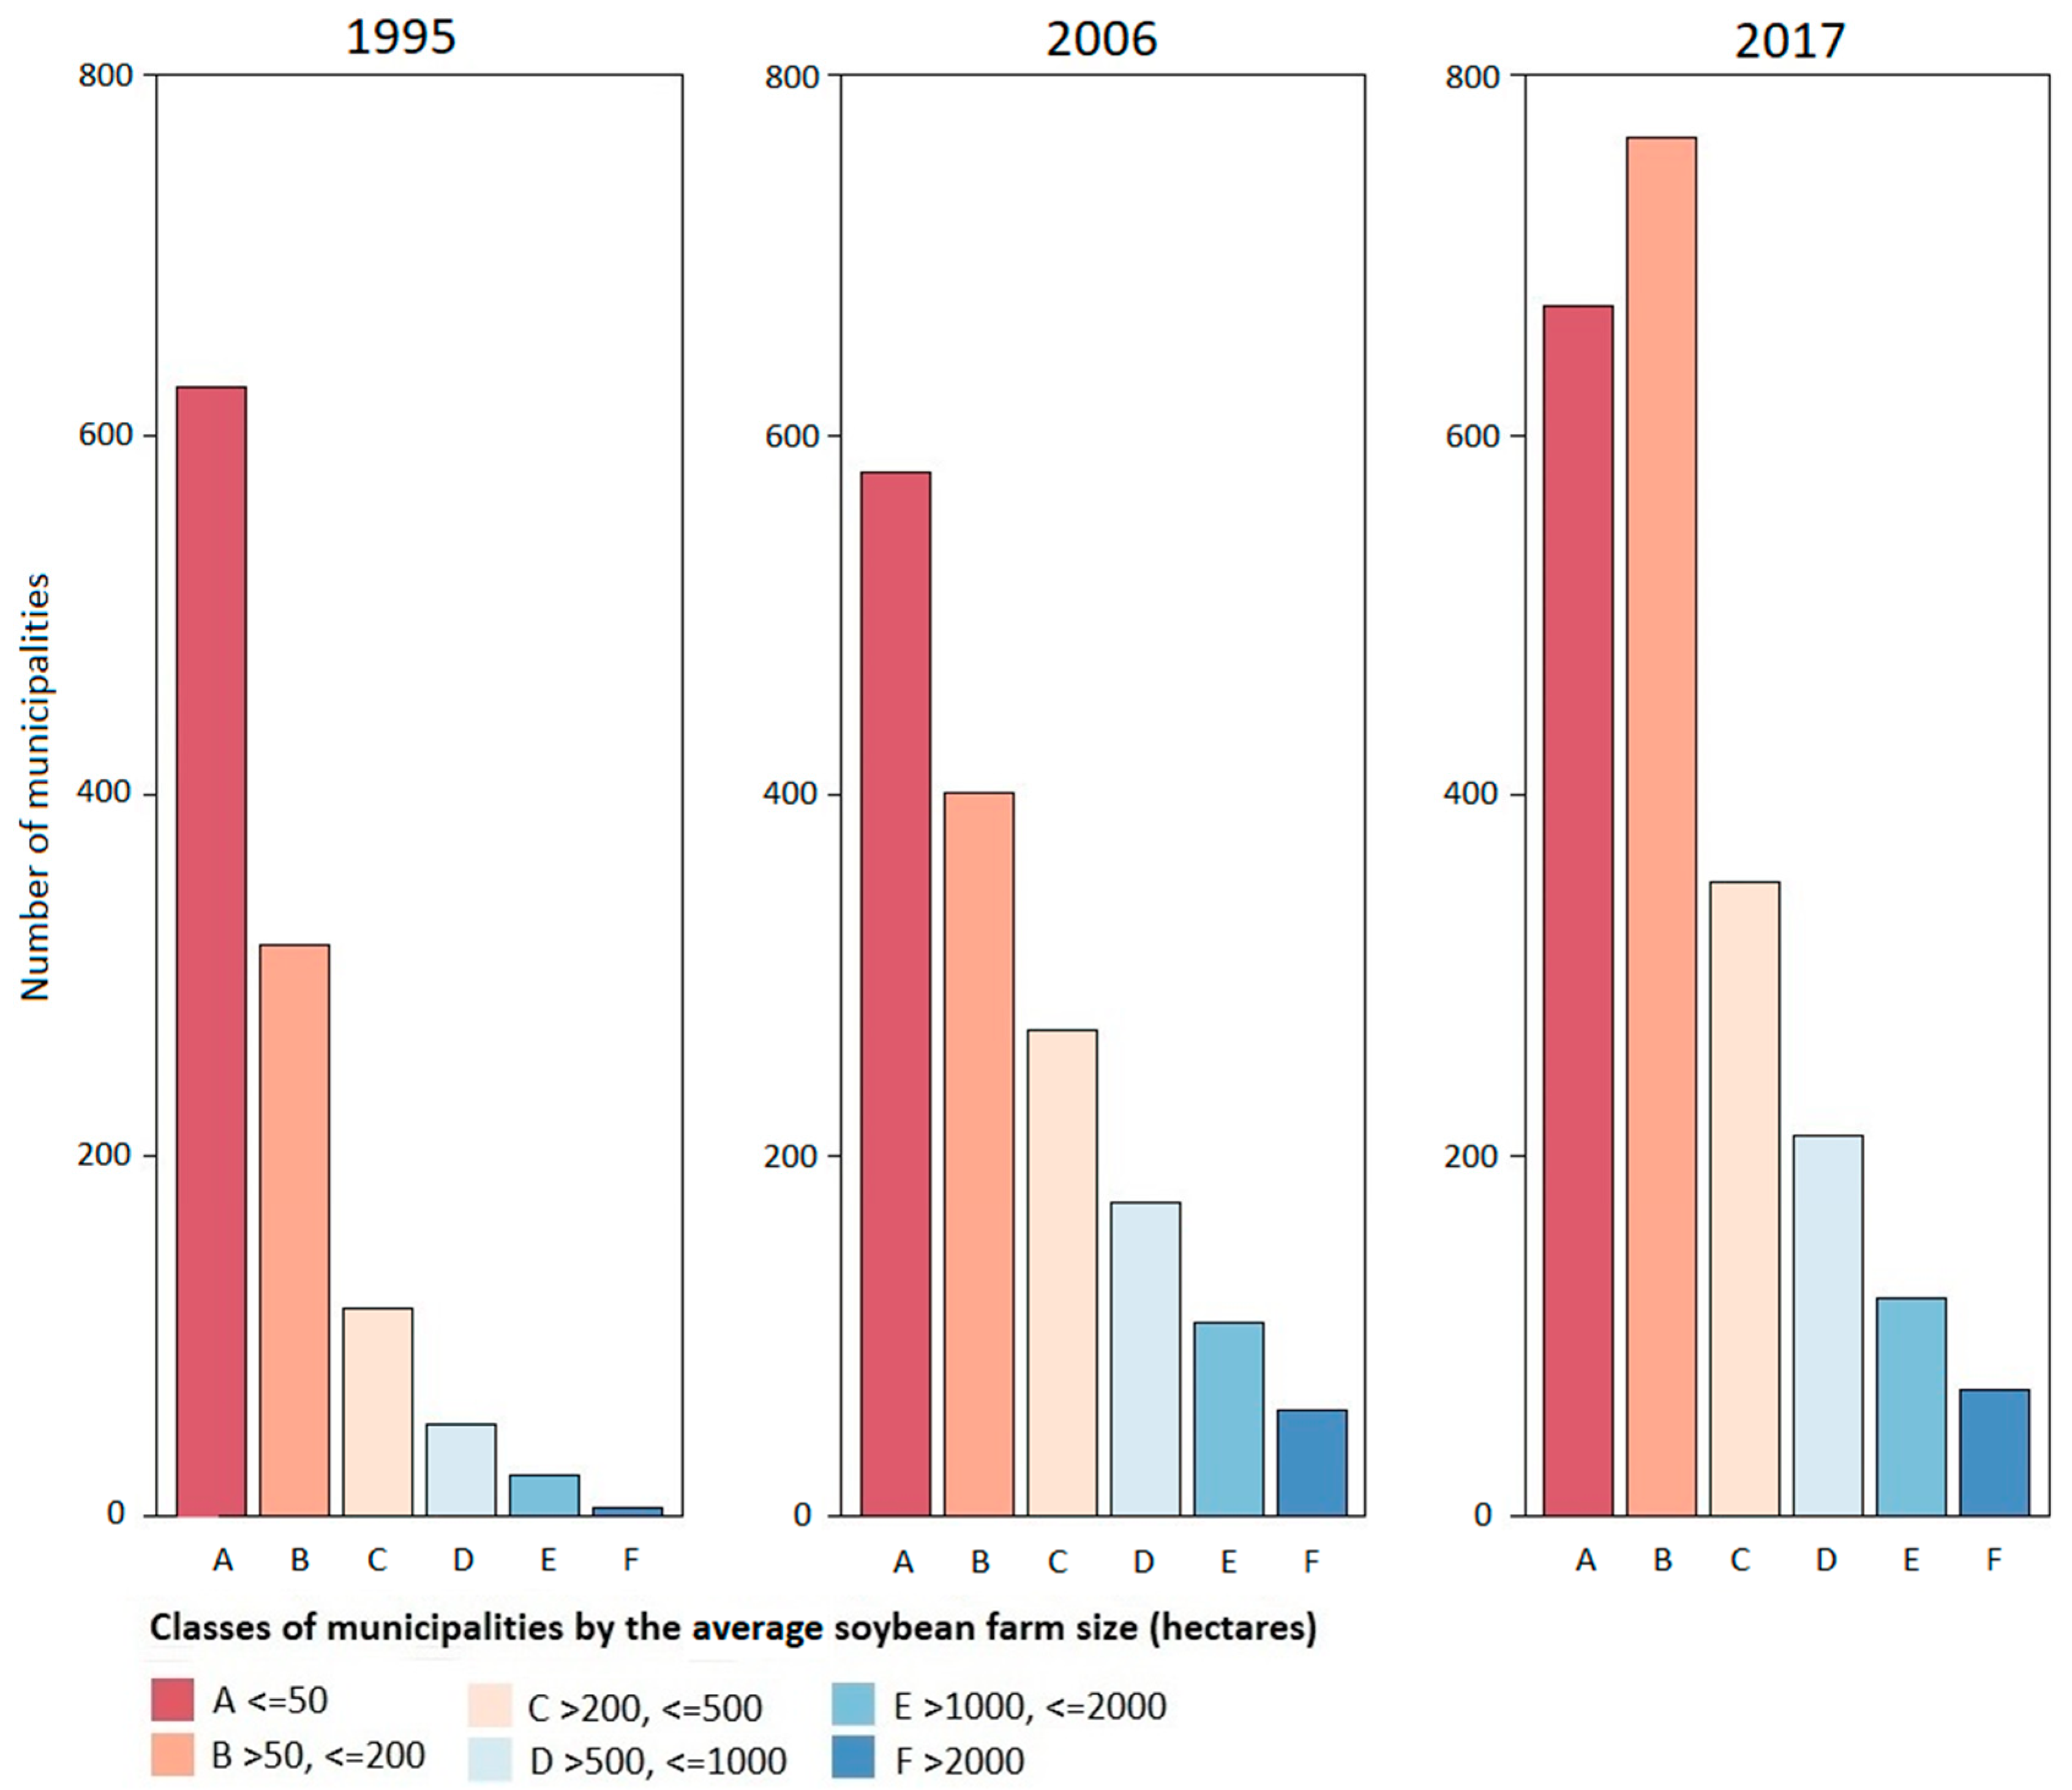
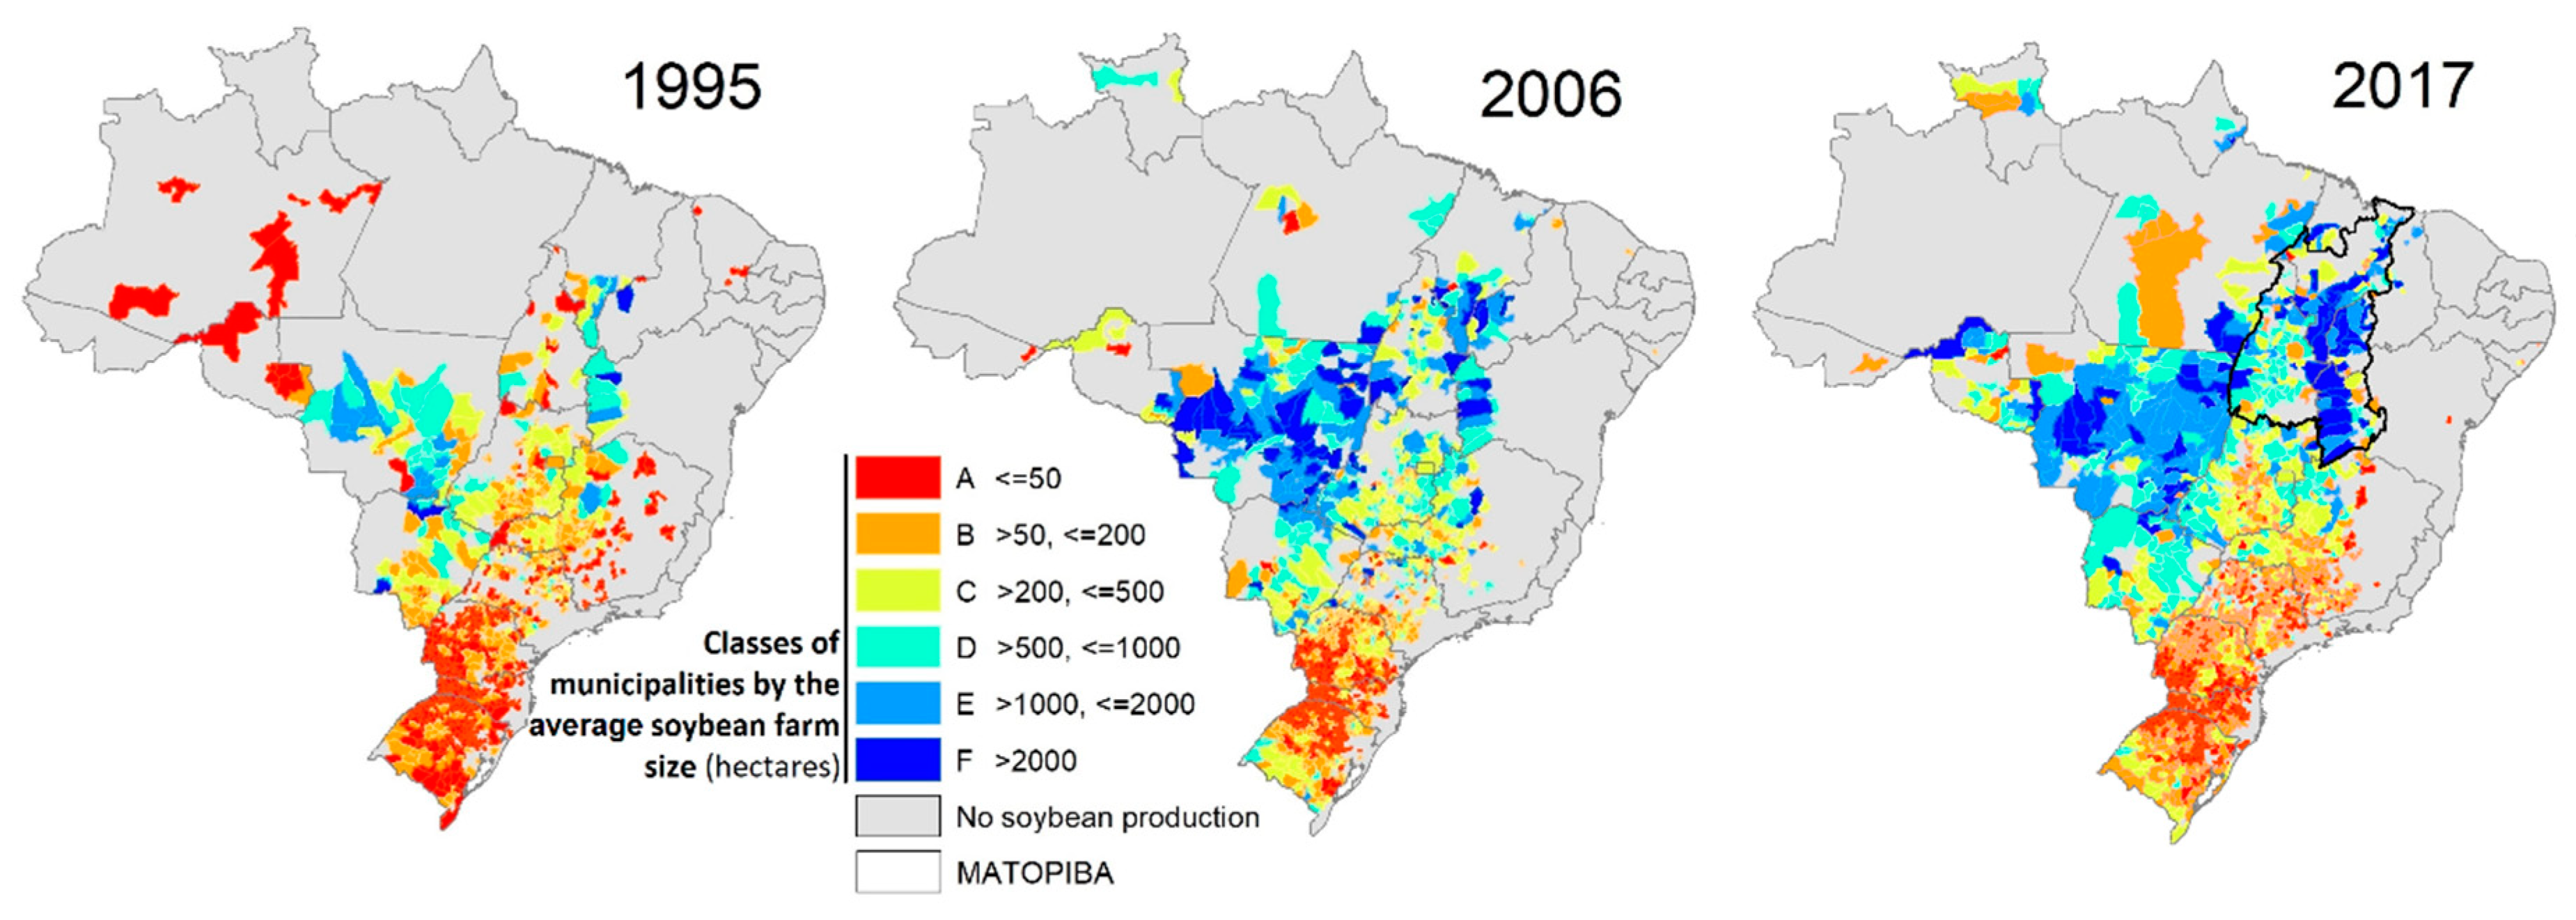
3.1. Changes in Soybean Farm Sizes and Spatiotemporal Patterns

The number of rural properties engaged in soybean cultivation increased by 11% from 211,993 (within 1136 municipalities) in 1995 to 235,329 in 2017 (within 2190 municipalities), while the soybean-planted area increased by 190% in the same period (from 11 to 34 Mha). In 2006, the number of properties producing soybean were 216,565 (within 1588 municipalities) with a total 22 Mha of planted area. The number of municipalities classified as having a large soybean farm size on average has increased at a faster rate than those classed as having small farm size (Figure 1). In 1995, the number of municipalities in groups E and F (planting at least 1000 ha) were 2% of total soybean farms, increasing to 10% in 2006 and 9% in 2017.
Additionally, Figure 2 reveals a spatial pattern across the country with higher increase in the average soybean farm size in the municipalities within the most recent agricultural frontier in Brazil (i.e., MATOPIBA, Cerrado biome), but also reinforcing the perception that Mato Grosso State (MT), the state with the largest total production, is also characterized by medium-large and large farms (planting at least 500 ha of soybean on average—shown by blue shades in Figure 2). The results demonstrate that the agricultural expansion frontier of MATOPIBA had increased the number of municipalities with large soybean farm size on average (i.e., two municipalities of class F and five of class E in 1995, increasing to 38 and 33 respectively, in 2017). In contrast, former frontier state of Mato Grosso, was entering a different process where the number of municipalities in class F decreased between 2006 and 2017. Additionally, other states such as Rondônia (RO) and Pará (PA), both considered new soybean expansion frontiers and within the Amazon biome, increased the number of municipalities of large soybean farm on average. In RO, it changed from zero municipalities ingroups E and F in 1995 to six and two in 2017, respectively. In PA, it changed from zero municipalities with soybean production at all in 1995 to three municipalities in group E and two in group F in 2017. The Local Moran’s I test confirms a trend of higher spatial autocorrelation (i.e., spatial clustering) for municipalities within the groups of large soybean farm sizes, indicating that the agricultural frontiers were being predominantly occupied by large land holders dedicated to commodity production (Figure 2). Additionally, the test indicates a spatial clustering trend for small/medium farm size groups in the South. The local Moran’s I test was significant at a 95% confidence level.
Interesting dynamics are also revealed in Southern States of Brazil, where the average soybean farm size is increasing in the municipality of Paraná State (PR), the second major soybean producer in Brazil. Here, agricultural landscapes were changing with the majority of municipalities of average soybean farm size around 50 ha per producer (small producers, class A shown as red in Figure 2) in 1995 changing to medium ones (classes B and C, orange and yellow, respectively) in 2017. During the same period, Rio Grande do Sul State (RS), also a pioneer state in soybean production in Brazil, is still dominated by municipalities having small soybean farms, but with a trend of increasing numbers of municipalities having medium-size farms (Figure 2).

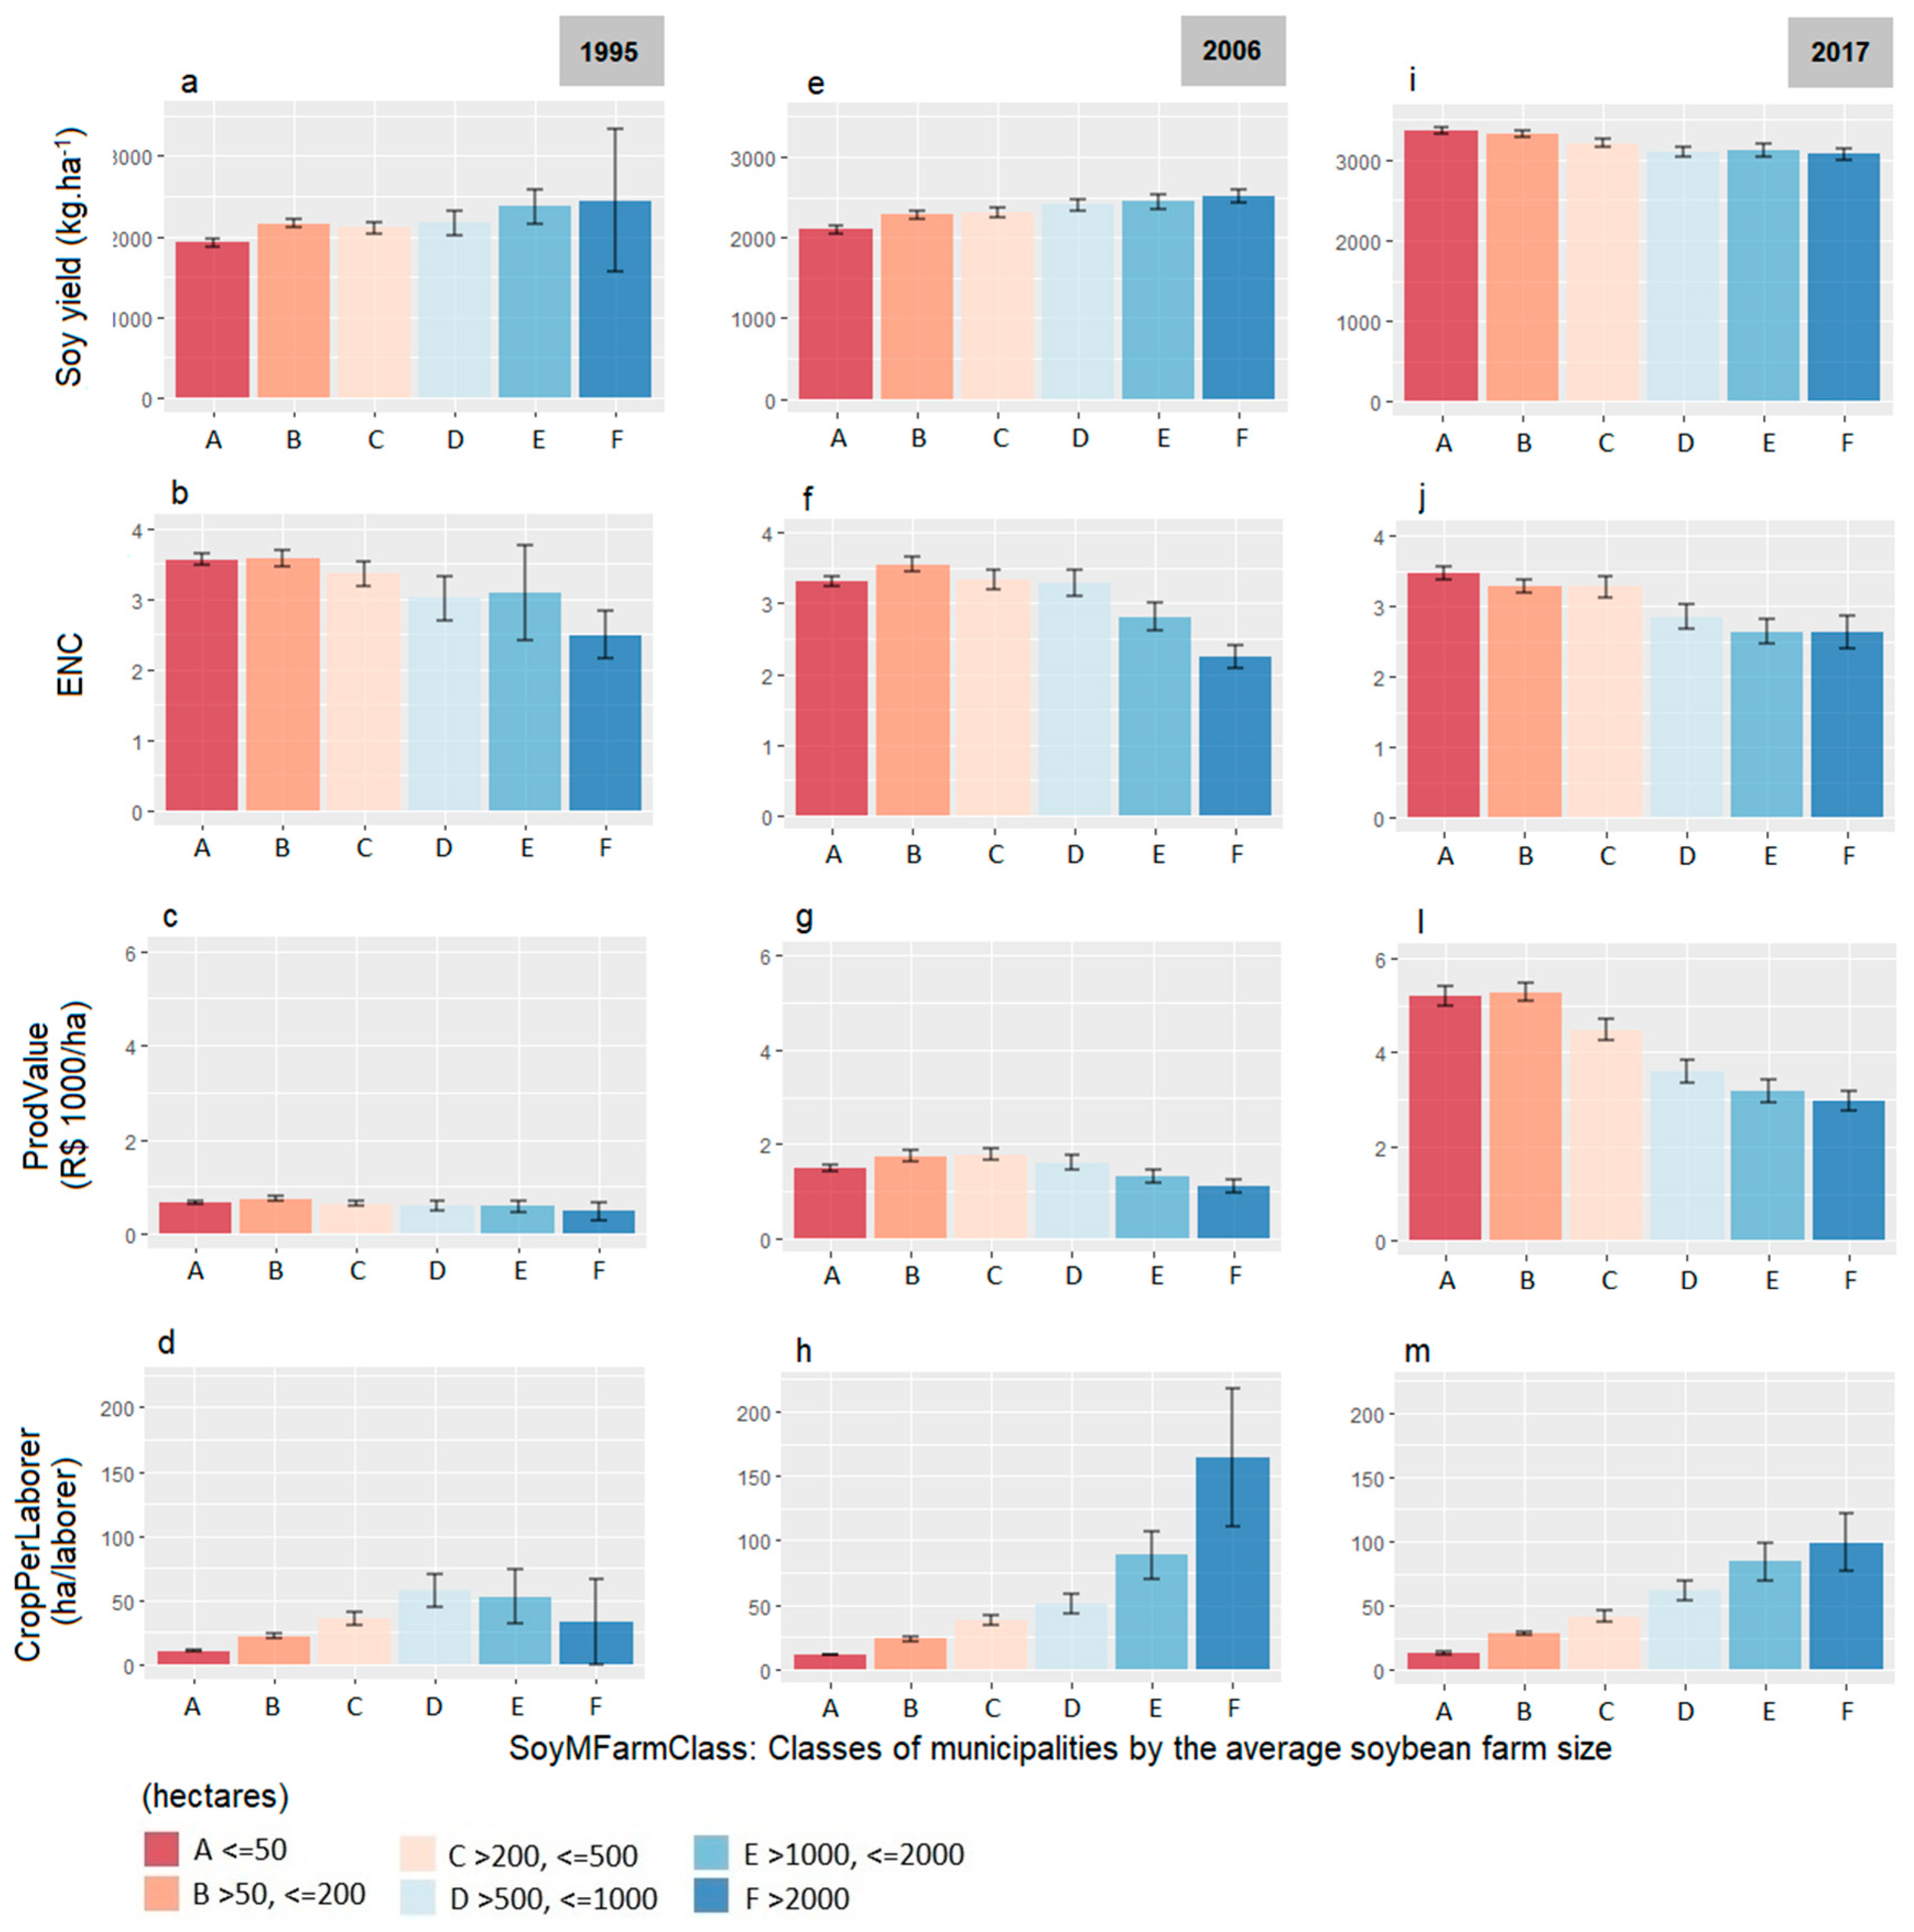
3.2. Yield, Crop Diversity, Production Value, and Rural Labor Dynamics

From the Kruskal–Wallis’ results, soybean yield, crop diversity, production value per hectare, and rural labor are different (p < 0.01) between soybean farm size classes in different years (Figure 3). In Brazil, from 1995 to 2017, the average soybean yield (kg.ha−1) increased by 53.5%. Summary statistics for variables used in the study are presented in Table 2. Through the 1990s and 2000s, the results from statistical analysis reveal significant differences in soybean yield among different classes of municipalities according to their respective average soybean farm size. Figure 3a,e shows that municipality classes D, E, and F obtained significantly higher yields compared to small and medium ones in 2006 (e.g., municipalities in class F obtained around 350 kg.ha−1 more than the average yield of smaller, class A municipalities).
However, in 2017, a surprising opposite trend was observed (Figure 3i). The regions with prevalence of large soybean farms (classes E and F) lost the dominance in the yield results. The average soybean yield of class A in 1995 was 1928 kg.ha−1, reaching 3349 kg.ha−1 in 2017 (a 42.5% increase), while of class F increased by 25.7% from 2439 to 3068 kg.ha−1. Although large farms achieving lower yields in 2017, all the classes of soybean farm sizes increased yields during this last period.
Figure 3b,f,j shows that crop diversity measured by the effective number of crops (ENC) was higher (p < 0.01) in municipalities of small and medium soybean farms in average. Higher crop diversity in municipalities within the classes of small and medium soybean farm sizes indicates that those regions are not as specialized in a single crop, but that they explore a variety of crops including fruits and other grains. Although significant statistical differences in the production value per hectare (p < 0.01) among the classes of soybean farm size exist for all years, consistent differences between small to large farms were observed in 2006 and 2017 (Figure 3c,g,l).
Kruskal–Wallis’ results indicate that the number of hectares per rural laborers differs between classes of municipalities of small, medium, medium-large, and large soybean farm sizes for 1995, 2006, and 2017 (p < 0.01). Mean values for 2006 and 2017 (Figure 3h,m) showed an increasing trend in the number of hectares of cultivated crops per laborer with increasing average municipality soybean farm size. This trend was not consistent in 1995 (Figure 3d). The mean of hectares per laborer in 2017 was seven times higher in municipalities within the class F compared to A (an additional 85 ha per each laborer in class F, in average). In 2006, we observed an even higher difference of fourteen times (an additional 153 ha per each laborer in class F, on average), while in 1995, the difference was three times higher, adding in average 23 ha for laborers, in municipalities class F. Results from 2006 and 2017 indicate that food systems typical of large-scale farming heavily rely on mechanization, which decreases human labor demand.

3.3. Synergies and Trade-Offs Across Space and Time

The results revealed that in 1995, synergies and trade-offs were less obvious or difficult to achieve, between production value, crop diversity, soybean yield, and labor within any soybean farm size class—i.e., the higher or lower performance of variable outcomes within the same soybean farm size class (Table 3). This suggests that soybean farm size in 1995 was not a proxy variable driving synergies or trade-offs, as we did not consistently find significant increasing or decreasing trends in outputs associated with farm size (municipality classes). In 2006, trade-offs appeared to be clear, although municipalities of large soybean farms (classes E and F) obtained significant higher soybean yields (i.e., higher variable performance), crop diversity and production value remained lower and labor uptake drastically decreased. Therefore, the lower performance for variable outcomes (i.e., mean values lower at p < 0.01 compared to small and medium classes) of number of laborers per cropland area (CropPerLaborer), effective number of crops (ENC) and production value (ProdValue) found in classes E and F (Table 3) lead them to great trade-off situations. We found that the average annual wages (for 2006, but also for 2017, in thousand Reais) were not significantly different (p < 0.01) among the classes B (3.4; 6.9), C (4.6; 7.9), D (2.8; 5.9), E (7.1; 7.5), and F (3.3; 6.3), but only significant for class A (0.9; 2.8) with lower values. Even in municipalities with large average soybean farm size, the laborers were not paid significantly higher than in municipalities with soybean farms of smaller size. In this case, low numbers of rural laborers in municipalities with fewer but large soybean farms does not mean higher wages than obtained by rural laborers in more populated municipalities with small to medium farm sizes.
For 2017, results indicate that municipalities with large soybean farms have lower performance outcomes for all variables, indicating that classes E and F performed poorly compared to other classes (Table 3). Here, we find a new trade-off situation where municipalities with large average soybean farm size were operating at the expense of lower performance in crop diversity, soybean yield, labor, and production values.
In 2006, a synergistic situation seems to have been reached in classes C and D, with relatively high soybean yield results in classes A and B (Table 3), but also significantly higher (p < 0.01) outcome performance (positively contributing to achieve SDGs) in the other variables, compared to outcomes in classes E and F. However, synergies became clear in 2017. Figure 3 shows classes A, B, and C with consistently better outcomes (variable outcomes reached higher performance compared to classes medium-large and large) for the variables analyzed, suggesting a threshold for synergy in class C. From class D (medium-large soybean farms), mean values for all variables decay without significant results for any of the variables, indicating increasing trade-offs with increasing average farm size per municipality class. Class A, with small soybean farm size on average, reached greatest synergy in 2017. We found a Spearman’s rank correlation of 0.38 between ENC and ProdValue, indicating that classes of greater production value per hectare in 2017 generally have a more diversified production portfolio (p < 0.01, n = 2190). For 1995 and 2006, lower correlations were found (0.15 and 0.28, respectively), but still significant (p < 0.01, n = 1136 for 1995, and n = 1588 for 2006). In municipalities of small-to-medium soybean farm sizes, Spearman’s correlation results revealed more synergies, between economic outcomes with higher crop diversity, reinforcing results in Table 3. Therefore, results for 2017 demonstrate that returns for each hectare of cultivated land are greater in more diversified food systems, classes A, B, and C.
Spearman’s rank correlation showed that crop diversity (ENC) and the distribution of cropland area per laborer (CropPerLaborer) were negatively correlated at significant levels for 3 years (p < 0.01). The result supports the assumption that the higher the ENC in a given municipality, the higher the number of rural laborers working in the farm, which, in turn, decreased the number of hectares per laborer (i.e., more densely populated food systems). The correlation in 1995 was −0.304 (n = 1136), −0.272 (n = 1588) in 2006, and −0.493 (n = 2190) in 2017. The increased value in 2017 indicates a stronger correlation than in previous years, indicating a higher synergy in municipalities with small and medium soybean farm sizes on average (i.e., increases in crop diversity underpinning rural labor uptake).
Considering SDGs, we found that in 2017, the food systems as characterized by soybean farm size and together with socioeconomic and production variable outcomes, reached greater synergies after three decades of change in municipalities of small and medium soybean farms (Table 3). Those changes observed through time indicate that greater agricultural productivity and incomes were achieved for small and medium food producers at the same time as more equal access to land (Targets 2.3 and 2.4) and higher levels of economic productivity through agricultural diversification (Target 8.2). This provides insights regarding the planning of food systems at the municipality level that it is reasonable to achieve poverty reduction in higher diverse agricultural areas with potential positive benefits for ecosystem and biodiversity (Target 15.9).

4. Discussion

4.1. Trade-Offs in the Food System

Our results show that regional soybean specialization in the Brazilian Midwest and North drove increases in the number of municipalities with large soybean farm sizes on average, correlated with lower crop diversification, soybean yield, rural labor uptake, and monetary values per hectare compared to municipalities with small and medium soybean farm sizes, in 2017. This process of land concentration (i.e., great amounts of land unit per producer) led soybean producers to become large landholders in the Midwest, which propelled the advance of the agricultural frontier in Brazil through the logic of economies of scale as a strategy to deal with the lack of infrastructure and to increase profit margins in frontiers [5,16,18]. Export-oriented agricultural frontiers, as usually characterized by large farming systems in the case of soybean in Brazil [49], tend to follow processes of specialization, with simplified landscape structures and large-scale cropping systems [5,23]. This process is driven by the need to increase the scale of production (e.g., expanding planted area) as a way to spread fixed costs, increase marketing power, and to allow bulk purchases of agricultural inputs. This maximizes profits to reach favorable situations to enable farmers to pay-off the production costs [5,14], but as we demonstrated, leads the food system at higher hierarchical levels (i.e., municipality) to great trade-offs.
In this regard, our results suggest an important trade-off between production and socioeconomic outcomes in municipalities with large average soybean farm sizes, i.e., areas with large farms, have decreased human-labor dependency and crop diversity but increased soybean planted area as the lower value-added per each hectare demands large-scale operations. Additionally, the great lower demand of rural laborer was not reflected in higher labor incomes (wage) compared to regions where the human-labor demand was higher. In other words, the higher number of laborers did not create a wage gap [57] between entrepreneurial farming frontiers and small to medium, more highly diversified, farming regions. Previous studies demonstrated that entrepreneurial farming frontiers (i.e., export-oriented farming driven by global demand [13]) drive depopulation and emergence of large landholders [13,58,59]. The authors [58] highlight that capital-intensive crops (e.g., soybeans that heavily rely on machinery) in large-scale systems negatively impacts local rural labor market, a situation that is corroborated by our analysis that indicates a clear negative correlation between large farms and rural labor uptake. Here, it is important to highlight that lower rural labor uptake might be positive and desirable in situations where a given country or region have the capacity to absorb laborers in better paid jobs in rural nonagricultural business (e.g., tourism, agribusiness industry) or urban jobs. However, as Brazil currently faces high levels of unemployment [27] and very unequal land distribution [60], rural jobs associated with agricultural production are key to support a population distant from economically developed centers and to help in promoting “inclusive and sustainable economic growth, employment, and decent work for all”—i.e., SDGs 8. Previous studies have shown that crop diversity was found to be lower in municipalities formed by large farms compared to landscapes of small or medium farms [61]. In this regard, our findings of lower crop diversity in municipalities of large soybean farm sizes, while higher in smaller ones, proved the value of our research approach dealing with different soybean farm size classes, which found similar results.
The lower soybean yields in municipality classes E and F, in 2017, together with lower growth rates between 1995 and 2017, indicate that in exchange for achieving large-scale production in large farms, producers are jeopardizing potential gains in soybean yield and increasing the trade-offs between production and economic benefits of those food systems [62]. Such a trend highlights that the agrarian model may evolve in time, and is related to technology, management techniques, cost/benefit considerations, indebtedness, and environmental conditions/outcomes [4,8]. For the years of 1995 and 2006, our results of yields contradicted previous theoretical formulations on the inverse relationship between farm size and productivity [63]. However, that expected relationship was reached in 2017.
Over the last decade, land concentration in few hands for soybean production continued in Cerrado and Amazon biomes. These regions have lower natural soil fertility than Southern Brazil, which was previously the main soybean production area, and this regional move has challenged soybean production to overcome yield gaps [63,64]. The recruitment of new areas for soybean production in soils of low natural fertility (sometimes degraded pastures and areas limited by high aluminum content and low phosphorus availability) demands years of fertilizer input (usually at least three) to build capacity to reach yields comparable to national averages [63]. In this regard, these new agricultural frontiers, given the continual land expansion, will be at the cost of higher amounts of fertilizers to achieve desired yields—potentially increasing environmental impacts and production costs [62]. According to the “Indicator for Sustainable Development” [65], between 2007 and 2014, MATOPIBA increased the use of fertilizers (nitrogen, potassium, and phosphorus) by 48%, but large increases were also seen in the Amazonian States of Pará (182%) and Rondônia (225%). However, the same rates were not observed for Southern Brazil with a 21% increase in the South (RS, SC, and PR), but negative in Paraná (−1%), São Paulo (−20%), Goiás (−6%), and just 6% increase in Minas Gerais.
We highlight that in 2017, 55 municipalities with average soybean farm size classes E (38) and F (17) have emerged, and 27 municipalities in the MATOPIBA region, 12 in Mato Grosso State, and 7 in Amazon States were also observed. In this same year, when the northern agricultural frontiers had newcomers of large producers, the former agricultural areas of Brazil in the central and southern regions (RS, SC, PR, SP, MG, and GO), had up to 400 new soybean producing municipalities of small and medium sizes—the classes with higher yields in 2017.

4.2. Synergies in the Food System

In food systems where municipalities have small and medium soybean farm sizes, our results revealed higher synergies between variables in 2017, as their performance outcomes increased over time (Table 3). Previous studies on SDGs have pointed out that positive interactions between targets outweigh negative ones [35,66,67], and we found in our study that between 1995 and 2006, the different classes of soybean farm sizes obtained some gains while performing poorly in other variables, producing neither great trade-offs nor synergies, but suggesting a balance between both.
Biodiversity and greenhouse gas impacts caused by specialized soybean production areas in Brazil could be reduced if more multifunctional production systems were adopted, increasing crop diversity and crop rotation practices [16,68]. The decreasing share of dominant crop commodities results in more diversified food systems and landscapes [69], therefore favoring higher synergy between environmental, socioeconomic, and agronomic dimensions [70,71], as we found in our results. Agriculture based on diversity and practices sustaining heterogeneous landscape mosaics offers great potential to adaptation to climate and other changing conditions compared to intensive monocropping systems [70], which in our case, proven to be more effective in supporting synergies, potentially enhancing sustainability and resilience in food systems [22,23,72]. Previous studies have shown that diversification is positively interlinked with environmental and income outcomes [73]. Therefore, we expect that crop diversification in areas of large soybean farms would drive increases in rural labor uptake, increasing on-farm job opportunities, and monetary returns per hectare of production. This expectation comes from our result that the greatest synergies were observed in 2017 for municipalities of small and medium soybean farms on average. Mato Grosso State (MT), the largest soybean producer in Brazil, which decreased the number of municipalities of large farms in 2017, may demonstrate the forces pushing food systems to increase synergies over time as farm sizes cease to grow. In fact, it was found that in areas with smaller farm sizes, soybean producers increase their likelihood to obtain higher soybean yields given management decisions to avoid less fertile lands [5]. Those lands, sometimes avoided by producers (as considered a recent trend in management decisions), produce soybean but at lower yield results, leading producers to change planting strategies to obtain higher results just by planting less but in more suitable lands.

5. Conclusions

We evaluated trade-offs and synergies between socioeconomic and production outcomes associated with food systems across temporal and geographical scales in Brazil. We found that food systems exhibited greatest trade-offs and synergies in 2017, the former associated with large-scale soybean production municipalities and the latter with municipalities producing soybean in small and medium soybean farm sizes. The results highlight that synergies and trade-offs may evolve over time and for a given agricultural system, reflecting changes in technologies, management, and location. Therefore, trade-off/synergy analysis over time is key for supporting long-term strategies targeting poverty reduction, to alleviate unemployment, and to provide sustainable food production, essential to achieve SDGs.
Policy-makers should carefully consider the current trends of socioeconomic and production variables associated with the varied soybean production regions of Brazil and consequent trade-off and synergy results in order to better design policies and development plans considering food systems not as steady state entities but as the dynamic systems that they are. For instance, our results teach us that the efforts of the Brazilian national government over the last decade pushing the MATOPIBA frontier to become a large soybean producer may be happening at the cost of large farming operations performing poorly when compared to other production scales in the country.

Author Contributions

Conceptualization, R.F.B.d.S. and J.D.A.M.; methodology, R.F.B.d.S., J.D.A.M., and Y.D.; validation, J.D.A.M., Y.D., and L.A.M.; investigation, all authors; writing—original draft preparation, R.F.B.d.S. and J.D.A.M.; writing—review and editing, all authors; funding acquisition, M.B., E.M., J.L., and J.D.A.M. All authors have read and agreed to the published version of the manuscript.

Funding

We gratefully acknowledge the funding support by the São Paulo Research Foundation (FAPESP), processes 14/50628-9, 15/25892-7, and 18/08200-2. We also acknowledge the funding support by the UK Natural Environment Research Council (grant number NE/M021335/1), and NSF (grant numbers 1518518, 1531086, and 1924111). None of these agencies are responsible for the views expressed herein. They are the sole responsibility of the authors.

Acknowledgments

We acknowledge the Center of Environmental Studies and Research of the State University of Campinas, Brazil, the Centers for Global Environmental Change and Earth Observations and the Center for Systems Integration and Sustainability of the Michigan State University, USA, and the Department of Geography of King’s College London, UK, for providing the opportunity to develop the study. The opinions expressed herein are the sole responsibility of the authors.

Conflicts of Interest

The authors declare no conflict of interest.

References

  1. Samberg, L.H.; Gerber, J.S.; Ramankutty, N.; Herrero, M.; West, P.C. Subnational distribution of average farm size and smallholder contributions to global food production. Environ. Res. Lett. 2016, 11, 124010. [Google Scholar] [CrossRef]
  2. Maes, M.J.A.; Jones, K.E.; Toledano, M.B.; Milligan, B.M. Mapping synergies and trade-offs between urban ecosystems and sustainable development goals. Environ. Sci. Policy 2019, 93, 181–188. [Google Scholar] [CrossRef]
  3. FAO (Food and Agriculture Organization). Transforming Food and Agriculture to Achieve the SDGs: 20 Interconnected Actions to Guide Decision-Makers. 2018. Available online: http://www.fao.org/news/story/en/item/1139028/icode/ (accessed on 22 September 2020).
  4. Rada, N.E.; Fuglie, K.O. New perspectives on farm size and productivity. Food Policy 2019, 84, 147–152. [Google Scholar] [CrossRef]
  5. Silva, R.F.B.; Batistella, M.; Moran, E.; Celidonio, O.L.M.; Millington, J.D.A. The Soybean Trap: Challenges and Risks for Brazilian Producers. Front. Sustain. Food Syst. 2020, 4, 12. [Google Scholar] [CrossRef] [Green Version]
  6. Fan, S.; Chan-kang, C. Is small beautiful? Farm size, productivity, and poverty in Asian agriculture. Agric. Econ. 2005, 32, 135–146. [Google Scholar] [CrossRef] [Green Version]
  7. Rada, N.; Helfand, S.; Magalhães, M. Agricultural productivity growth in Brazil: Large and small farms excel. Food Policy 2019, 84, 176–185. [Google Scholar] [CrossRef]
  8. Zhang, A.; Hochman, Z.; Horan, H.; Navarro, J.G.; Das, B.T.; Waldner, F. Socio-psychological and management drivers explain farm level wheat yield gaps in Australia. Agron. Sustain. Dev. 2019, 39, 10. [Google Scholar] [CrossRef] [Green Version]
  9. Klapwijk, C.J.; Wijk, M.T.; Rosenstock, T.S.; Asten, P.J.A.; Thornton, P.K.; Giller, K.E. Analysis of trade-offs in agricultural systems: Current status and way forward. Curr. Opin. Environ. Sustain. 2014, 6, 110–115. [Google Scholar] [CrossRef] [Green Version]
  10. Meyfroidt, P. Mapping farm size globally: Benchmarking the smallholders debate. Environ. Res. Lett. 2017, 12, 031002. [Google Scholar] [CrossRef]
  11. Porter, M.E. Location, competition, and economic development: Local clusters in a global economy. Econ. Dev. Q. 2000, 14, 15–34. [Google Scholar] [CrossRef]
  12. Macdonald, J.M. Consolidation, Concentration, and Competition in the Food System. Farm. Policy J. 2017, 14, 25–35. [Google Scholar]
  13. Meyfroidt, P.; Chowdhury, R.R.; Bremond, A.D.; Ellis, E.C.; Erb, K.; Filatova, T.; Garrett, R.D.; Grove, J.M.; Heinimann, A.; Kuemmerle, T.; et al. Middle-range theories of land system change. Glob. Environ. Chang. 2018, 53, 52–67. [Google Scholar] [CrossRef]
  14. Abson, D.J. The Economic Drivers and Consequences of Agricultural Specialization. Agroecosyst. Divers. 2019. [Google Scholar] [CrossRef]
  15. Ricciardi, V.; Ramankutty, N.; Mehrabi, Z.; Jarvis, L. How much of the world’s food do smallholders produce? Glob. Food Secur. 2018, 17, 64–72. [Google Scholar] [CrossRef]
  16. Garrett, R.D.; Rausch, L.L. Green for gold: Social and ecological tradeoffs influencing the sustainability of the Brazilian soy industry. J. Peasant Stud. 2015, 326. [Google Scholar] [CrossRef] [Green Version]
  17. Herzberger, A.; Chung, M.G.; Kapsar, K.; Frank, K.A.; Liu, J. Telecoupled Food Trade affects Pericoupled Trade and Intracoupled Production. Sustainability 2019, 11, 2908. [Google Scholar] [CrossRef] [Green Version]
  18. Silva, R.F.B.; Batistella, M.; Dou, Y.; Moran, E.; Torres, S.M.; Liu, J. The Sino-Brazilian Telecoupled Soybean System and Cascading Effects for the Exporting Country. Land 2017, 6, 53. [Google Scholar] [CrossRef] [Green Version]
  19. Lowder, S.K.; Skoet, J.; Raney, T. The Number, Size, and Distribution of Farms, Smallholder Farms, and Family Farms Worldwide. World Dev. 2016, 87, 16–29. [Google Scholar] [CrossRef] [Green Version]
  20. Zhao, Z.; Cai, M.; Wang, F.; Winkler, J.A.; Connor, T.; Chung, M.G.; Zhang, J.; Yang, H.; Xu, Z.; Tang, Y.; et al. Synergies and tradeoffs among Sustainable Development Goals across boundaries in a metacoupled world. Sci. Total Environ. 2020, 751, 141749. [Google Scholar] [CrossRef] [PubMed]
  21. Cord, A.; Bartkowski, B.; Beckmann, M.; Dittrich, A.; Hermans-Neumann, K.; Kaim, A.; Lienhoop, N.; Locher-Krause, K.; Priess, J.; Schröter-Schlaack, C.; et al. Towards systematic analyses of ecosystem service trade-offs and synergies: Main concepts, methods and the road ahead. Ecosyst. Serv. 2017, 28, 264–272. [Google Scholar] [CrossRef]
  22. FAO (Food and Agriculture Organization). Trade-Offs in Future Food Systems—Consumer Perspectives. Food Futures Panel. 2017. Available online: www.dialoguebydesign.co.uk (accessed on 22 September 2020).
  23. Tälle, M.; Wiréhn, L.; Ellström, D.; Hjerpe, M.; Huge-Brodin, M.; Jensen, P.; Lindström, T.; Neset, T.; Wennergren, U.; Metson, G. Synergies and Trade-Offs for Sustainable Food Production in Sweden: An Integrated Approach. Sustainability 2019, 11, 601. [Google Scholar] [CrossRef] [Green Version]
  24. Vermeulen, S.; Zougmoré, R.; Wollenberg, E.; Thornton, P.K.; Nelson, G.; Kristjanson, P.; Kinyangi, J.; Jarvis, A.; Hansen, J.; Challinor, A.J.; et al. Climate change, agriculture and food security: Global partnership to link research and action for low-income agricultural producers and consumers. Curr. Opin. Environ. Sustain. 2011, 4, 128–133. [Google Scholar] [CrossRef] [Green Version]
  25. DeFries, R.; Rosenzweig, C. Toward a whole-landscape approach for sustainable land use in the tropics. Proc. Natl. Acad. Sci. USA 2010, 107, 19627–19632. [Google Scholar] [CrossRef] [Green Version]
  26. Foley, J.A.; Ramankutty, N.; Brauman, K.A.; Cassidy, E.S.; Gerber, J.S.; Johnston, M.; Mueller, N.D.; O’Connell, C.; Ray, D.K.; West, P.C.; et al. Solutions for a cultivated planet. Nature 2011, 478, 337–442. [Google Scholar] [CrossRef] [Green Version]
  27. IBGE (Brazilian Institute of Geography and Statistics). Pesquisa Nacional por Amostra de Domicílios Contínua; IBGE: Rio de Janeiro, Brazil, 2020; 108p. [Google Scholar]
  28. Aguilar, J.; Gramig, G.G.; Hendrickson, J.R.; Archer, D.W.; Forcella, F.; Liebig, M.A. Crop Species Diversity Changes in the United States: 1978–2012. PLoS ONE 2015, 10, e0136580. [Google Scholar] [CrossRef]
  29. Oliveira, C.M.; Santana, A.C.; Homma, A.K.O. The cost of production and profitability of soybeans in the municipalities of Santar’em and Belterra, State of Pará. Acta Amaz. 2013, 43, 23–32. [Google Scholar]
  30. Power, A.G. Ecosystem services and agriculture: Tradeoffs and synergies. Philos. Trans. R. Soc. B 2010, 365, 2959–2971. [Google Scholar] [CrossRef]
  31. Campanhola, C.; Pandey, S. Sustainable Food and Agriculture, 2nd ed.; FAO and Elsevier: London, UK, 2019. [Google Scholar]
  32. Tittonell, P.; Wijk, M.T.; Rufino, M.C.; Vrugt, J.A.; Giller, K.E. Analysing trade-offs in resource and labour allocation by smallholder farmers using inverse modelling techniques: A case-study from Kakamega distrisct, western Kenya. Agric. Syst. 2007, 95, 76–95. [Google Scholar] [CrossRef]
  33. Haase, D.; Schwarz, N.; Strohbach, M.; Kroll, F.; Seppelt, R. Synergies, Trade-offs, and Losses of Ecosystem Services in Urban Regions: An Integrated Multiscale Framework Applied to the Leipzig-halle Region. Ecol. Soc. 2012, 17, 22. [Google Scholar] [CrossRef]
  34. Lemaire, G.; Franzluebbers, A.; Carvalho, P.C.F.; Dedieu, B. Integrated crop-livestock systems: Strategies to achieve synergy between agricultural production and environmental quality. Agric. Ecosyst. Environ. 2014, 190, 4–8. [Google Scholar] [CrossRef]
  35. Fader, M.; Cranmer, C.; Lawford, R.; Engel-Cox, J. Toward and Understanding of Synergies and Trade-offs Between Water, Energy, and Food SDG Targets. Front. Environ. Sci. 2018, 6, 112. [Google Scholar] [CrossRef]
  36. Mier, M.; Cacho, T.G. Soybean agri-food systems dynamics and the diversity of farming styles on the agricultural frontier in Mato Grosso, Brazil. J. Peasant Stud. 2015, 43, 419–441. [Google Scholar] [CrossRef]
  37. FAO (Food and Agriculture Organization). Food and Agricultural Data. Available online: http://www.fao.org/faostat/en/#data (accessed on 22 September 2020).
  38. Empinotti, V. Beyond the dualities: A nuanced understanding of Brazilian soybean producers. Food Secur. 2015, 7, 1165–1174. [Google Scholar] [CrossRef]
  39. Chaddad, F.R.; Jank, M.S. The Evolution of Agricultural Policies and Agribusiness Development in Brazil. Choices 2014, 21, 81–90. [Google Scholar]
  40. Jepson, W. Private agricultural colonization on a Brazilian frontier, 1970–1980. Hist. Geogr. 2006, 32, 839–863. [Google Scholar] [CrossRef]
  41. Valencia, V.; Wittman, H.; Blesh, J. Structuring Markets for Resilient Farming Systems. Agron. Sustain. Dev. 2019, 39, 1–14. [Google Scholar] [CrossRef] [Green Version]
  42. Jepson, W.; Brannstrom, C.; Filippi, A. Access regimes and regional land change in the Brazilian Cerrado, 1972–2002. Ann. Am. Assoc. Geogr. 2009, 100, 87–111. [Google Scholar] [CrossRef]
  43. Galvão, J.A.C. Colonização e cidades em Mato Grosso. In XXVII Simpósio Nacional de História, ANPUH/Natal; ANPUH: Natal, Brazil, 2013; Available online: http://www.snh2013.anpuh.org/site/anaiscomplementares#J (accessed on 27 October 2020).
  44. Jia, F.; Peng, S.; Green, J.; Koh, L.; Chen, X. Soybean Supply Chain Management: A systematic literature review. J. Clean. Prod. 2020, 225, 120254. [Google Scholar] [CrossRef]
  45. Martinelli, L.A.; Batistella, M.; Silva, R.F.B.; Moran, E. Soy expansion and socioeconomic development in municipalities of Brazil. Land 2017, 6, 62. [Google Scholar] [CrossRef] [Green Version]
  46. Fuchs, R. US—China trade war imperils Amazon rainforest. Nature 2018, 567, 452. [Google Scholar] [CrossRef] [Green Version]
  47. Kennedy, C.M.; Hawthorne, P.L.; Miteva, D.A.; Baumggarten, L.; Sochi, K.; Matsumoto, M.; Evans, J.; Polasky, S.; Hamel, P.; Vieira, E.M.; et al. Optimizing land use decision-making to sustain Brazilian agricultural profits, biodiversity and ecosystem services. Biol. Conserv. 2016, 204, 221–230. [Google Scholar] [CrossRef] [Green Version]
  48. Vargas, M.C.; Oliveira, B.F. Estratégias de diversificação em áreas de cultivo de tabaco no Vale do Rio Pardo: Uma análise comparativa. Rev. Econ. Sociol. Rural 2012, 50, 175–192. [Google Scholar] [CrossRef] [Green Version]
  49. Goldsmith, P.D.; Martins, A.G.; Moura, A.D.D. The economics of post-harvest loss: A case study of the new large soybean-maize producers in tropical Brazil. Food Secur. 2015, 7, 875–888. [Google Scholar] [CrossRef]
  50. Fuganti, E.N.; Carvalho Júnior, L.C. Caracterização da cadeia produtiva da soja em Santa Catarina. Rev. Cad. Econ. 2015, 19, 5–29. [Google Scholar]
  51. Cutforth, L.B.; Francis, C.A.; Lynne, G.D.; Mortensen, D.A.; Eskridge, K.M. Factors affecting farmers’ crop diversity decisions: An integrated approach. Am. J. Altern. Agric. 2001, 16, 168–176. [Google Scholar] [CrossRef]
  52. Martin, A.R.; Cadotte, M.W.; Isaac, M.E.; Milla, R.; Vile, D.; Violle, C. Regional and global shifts in crop diversity through the Anthropocene. PLoS ONE 2019. [Google Scholar] [CrossRef] [Green Version]
  53. Gotelli, N.J.; Chao, A. Measuring and estimating species richness, species diversity, and biotic similarity from sampling data. In Encyclopedia of Biodiversity; Levin, S.A., Ed.; Academic Press: Waltham, MA, USA, 2013; pp. 195–211. [Google Scholar]
  54. Vennet, B.V.; Schneider, S.; Dessein, J. Different farming styles behind the homogenous soy production in southern Brazil. J. Peasant Stud. 2015, 43, 396–418. [Google Scholar] [CrossRef]
  55. Anselin, L. Local indicators of Spatial Association-LISA. Geogr. Anal. 1995, 27, 93–115. [Google Scholar] [CrossRef]
  56. Cumming, G.; Fidler, F.; Vaux, D. Error bars in experimental biology. J. Cell Biol. 2007, 177, 7–11. [Google Scholar] [CrossRef] [Green Version]
  57. Sen, A.K. Peasants and Dualism with or without Surplus Labor. J. Political Econ. 1966, 74, 425–450. [Google Scholar] [CrossRef]
  58. le Polain de Waroux, Y.; Baumann, M.; Gasparri, N.I.; Gavier-Pizarro, G.; Godar, J.; Kuemmerle, T.; Müller, R.; Vázquez, F.; Volante, J.N.; Meyfroidt, P. Rents, Actors, and the Expansion of Commodity Frontiers in the Gran Chaco. Ann. Am. Assoc. Geogr. 2018, 108, 204–225. [Google Scholar] [CrossRef]
  59. Nolte, K.; Ostermeier, M. Labour Market effect of large-scale agricultural investment: Conceptual consideration and estimated employment effects. World Dev. 2017, 98, 430–446. [Google Scholar] [CrossRef]
  60. Leite, A.C. Análise da concentração fundiária no Brasil: Desafios e limites do uso do índice de Gini. Nera 2018, 43, 10–28. [Google Scholar]
  61. Uthes, S.; Kelly, E.; König, H.J. Farm-level indicators for crop landscape diversity derived from agricultural beneficiaries data. Ecol. Indic. 2020, 108, 105725. [Google Scholar] [CrossRef]
  62. CONAB (National Company of Food and Supply). A produtividade da Soja: Análise e perspectivas. In Compêndio de Estudos CONAB; CONAB: Brasilia, Brazil, 2017. [Google Scholar]
  63. Helfand, S.M.; Levine, E.S. Farm size and the determinants of productive efficiency in the Brazilian Center-West. Agric. Econ. 2007, 31, 214–249. [Google Scholar] [CrossRef]
  64. Roy, E.D.; Willig, E.; Richards, P.D.; Martinelli, L.A.; Ferraz, F. Soil phosphorus sorption capacity after three decades of intensive fertilization in Mato Grosso, Brazil. Agric. Ecosyst. Environ. 2017, 249, 206–214. [Google Scholar] [CrossRef]
  65. IBGE (Brazilian Institute of Geography and Statistics). Indicadores de Desenvolvimento Sustentável: Brasil 2015; IBGE: Rio de Janeiro, Brazil, 2015; 348p. [Google Scholar]
  66. Nerini, F.F.; Tomei, J.; To, L.S.; Bisaga, I.; Parikh, P.; Black, M.; Borrion, A.; Spataru, C.; Broto, V.C.; Anandarajah, G.; et al. Mapping synergies and trade-offs between energy and the Sustainable Development Goals. Nat. Energy 2017, 3, 10–15. [Google Scholar] [CrossRef] [Green Version]
  67. McCollum, D.L.; Gomez, E.; Busch, S.; Pachauri, S.; Parkinson, S.; Rogelj, J. Connecting the sustainable development goals by their energy inter-linkages. Environ. Res. Lett. 2018, 13, 033006. [Google Scholar] [CrossRef]
  68. Balbino, L.C.; Cordeiro, L.A.M.; Porfírio-da-Silva, V.; Moraes, A.; Martínez, G.B.; Alvarenga, R.C.; Kichel, A.N.; Fontaneli, R.S.; Santos, H.P.D.; Franchini, J.C.; et al. Evolução tecnológica e arranjos produtivos de sistemas de integração lavoura-pecuária-floresta no Brasil. Pesqui. Agropecu. Bras. 2011, 46. [Google Scholar] [CrossRef] [Green Version]
  69. Peltonen-Sainio, P.; Jauhianinen, L.; Sorvali, J. Diversity of high-latitude agricultural landscapes and crop rotations: Increased, decreased or back and forth? Agric. Syst. 2017, 154, 25–33. [Google Scholar] [CrossRef]
  70. Halberg, N.; Peramaiyan, P.; Treyer, S. Eco-functional intensification and food security: Synergy or Compromise? Sustain. Agric. Res. 2015, 4, 3. [Google Scholar] [CrossRef]
  71. Dwivedi, S.L.; Bueren, E.T.L.; Ceccarelli, S.; Grando, S.; Upadhyaya, H.D.; Ortiz, R. Diversifying Food Systems in the Pursuit of Sustainable Food Production and Healthy Diets. Trends Plant Sci. 2017, 22, 842–856. [Google Scholar] [CrossRef] [Green Version]
  72. Berkes, F. Shifting Perspectives on Resource Management: Resilience and the Reconceptualization of ‘Natural Resources’ and ‘Management’. Marit. Stud. 2010, 9, 13–40. [Google Scholar]
  73. Khanal, A.R. Interlinked diversification strategies: Evidences from US farm business household. J. Agribus. Dev. Emerg. Econ. 2018, 10, 0144. [Google Scholar] [CrossRef]
Figure 1. Distribution of municipalities per classes of average soybean farm size in 1995, 2006, and 2017 for all Brazilian municipalities.
Land 09 00422 g001
Figure 2. Spatiotemporal changes in the average size of soybean farm size across Brazilian municipalities, in 1995, 2006, and 2017. The blue shade represents municipalities of large soybean farm size (mean values).
Land 09 00422 g002
Figure 3. Results from statistical analysis according to variable outcomes by farm size class across agricultural censuses years. Inferential error bars of confidence intervals at 95% for the mean value of each variable in classes of soybean farm size, for 1995, 2006, and 2017 in Brazil. The results are from Kruskal–Wallis tests for the 3 years (using statistical significance threshold p = 0.01) with n = 1136, 1588, and 2190 for soybean yield (a,e,i)/effective number of crops (ENC, (b,f,j))/ProdValue (c,g,l)/CropPerLaborer (d,h,m) observations (municipality) in 1995, 2006, and 2017, respectively.
Land 09 00422 g003
Table 1. Municipality-level data and variables used in this study.
IBGE CodeVariable NameVariable DescriptionSource *Year
5457AgriProdPlanted and harvested area, production, yield (kg ha−1), and production value for each annual and perennial cropIBGE/PAM1995/2006/2017
6899Wage17Wages paid for rural workers in 1 agricultural year (total of 1 year)IBGE/AC2017
6615RuralP17Number of rural properties producing per each annual cropIBGE/AC2017
6887Laborers17Number of rural laborers in annual and perennial cropsIBGE/AC2017
820Wage06Wages paid for rural workers in 1 agricultural year (total of 1 year)IBGE/AC2006
949RuralP06Number of rural properties producing per each annual cropIBGE/AC2006
956Laborers06Number of rural laborers in annual and perennial cropsIBGE/AC2006
492RuralP95Number of informants producing per each annual cropIBGE/AC1995
321Laborers95Number of rural laborers in annual and perennial cropsIBGE/AC1995
SoyMFarmAverage soybean farm sizeDerived1995/2006/2017
CropPerLaborerHectares of cropland per laborerDerived1995/2006/2017
ProdValueProduction value (R$) per hectareDerived1995/2006/2017
SDIShannon diversity index for cropsDerived1995/2006/2017
ENCEffective number of cropsDerived1995/2006/2017
SoyMFarmClassMunicipalities grouped in categories according the average soybean farm sizeDerived1995/2006/2017
WageAverageAverage spent as wage for 1 agricultural year with each rural laborDerived2006/2017
* All sources and data from IBGE are found at: https://sidra.ibge.gov.br/home/pimpfbr/brasil.
Table 2. Summary statistics for variables used in the study.
YearAverage Soybean Farm Size (Hectares)Soybean Yield (kg.ha−1)ENCProdValue
(R$ 1000/ha)
CropPerLaborer
(ha/Laborer)
MeanSDMeanSDMeanSDMeanSDMeanSD
199514033120335743.510.60.419.722.5
200640485322525603.311.513461.6
201734667432665443.21.24.72.63445.1
Table 3. Mean values for variables according to municipality classes of soybean farm size.
Farm Size Class
VariableYearABCDEF
Soybean yield1995192821602107216724002439
(kg.ha−1)2006209622802309240624452515
2017334933093200309731213068
ENC19953.53.53.332.92.4
20063.33.53.33.22.82.2
20173.43.23.22.82.62.6
ProdValue19950.60.70.60.50.50.4
(R$ 1000/ha)20061.41.71.71.51.31
20175.25.24.43.63.12.9
CropPerLaborer1995722.135.756.254.733
(ha/laborer)20061123.337.950.888.7164.8
201713.628.641.761.684.199.4
For statistically significant difference analysis, see Figure 3 where results are grouped by year and farm size class according to each Kruskal–Wallis test applied.
Publisher’s Note: MDPI stays neutral with regard to jurisdictional claims in published maps and institutional affiliations.

