Driving Factors of the Industrial Land Transfer Price Based on a Geographically Weighted Regression Model: Evidence from a Rural Land System Reform Pilot in China


Abstract
1. Introduction
2. Literature Review
2.1. Chinese Land Market
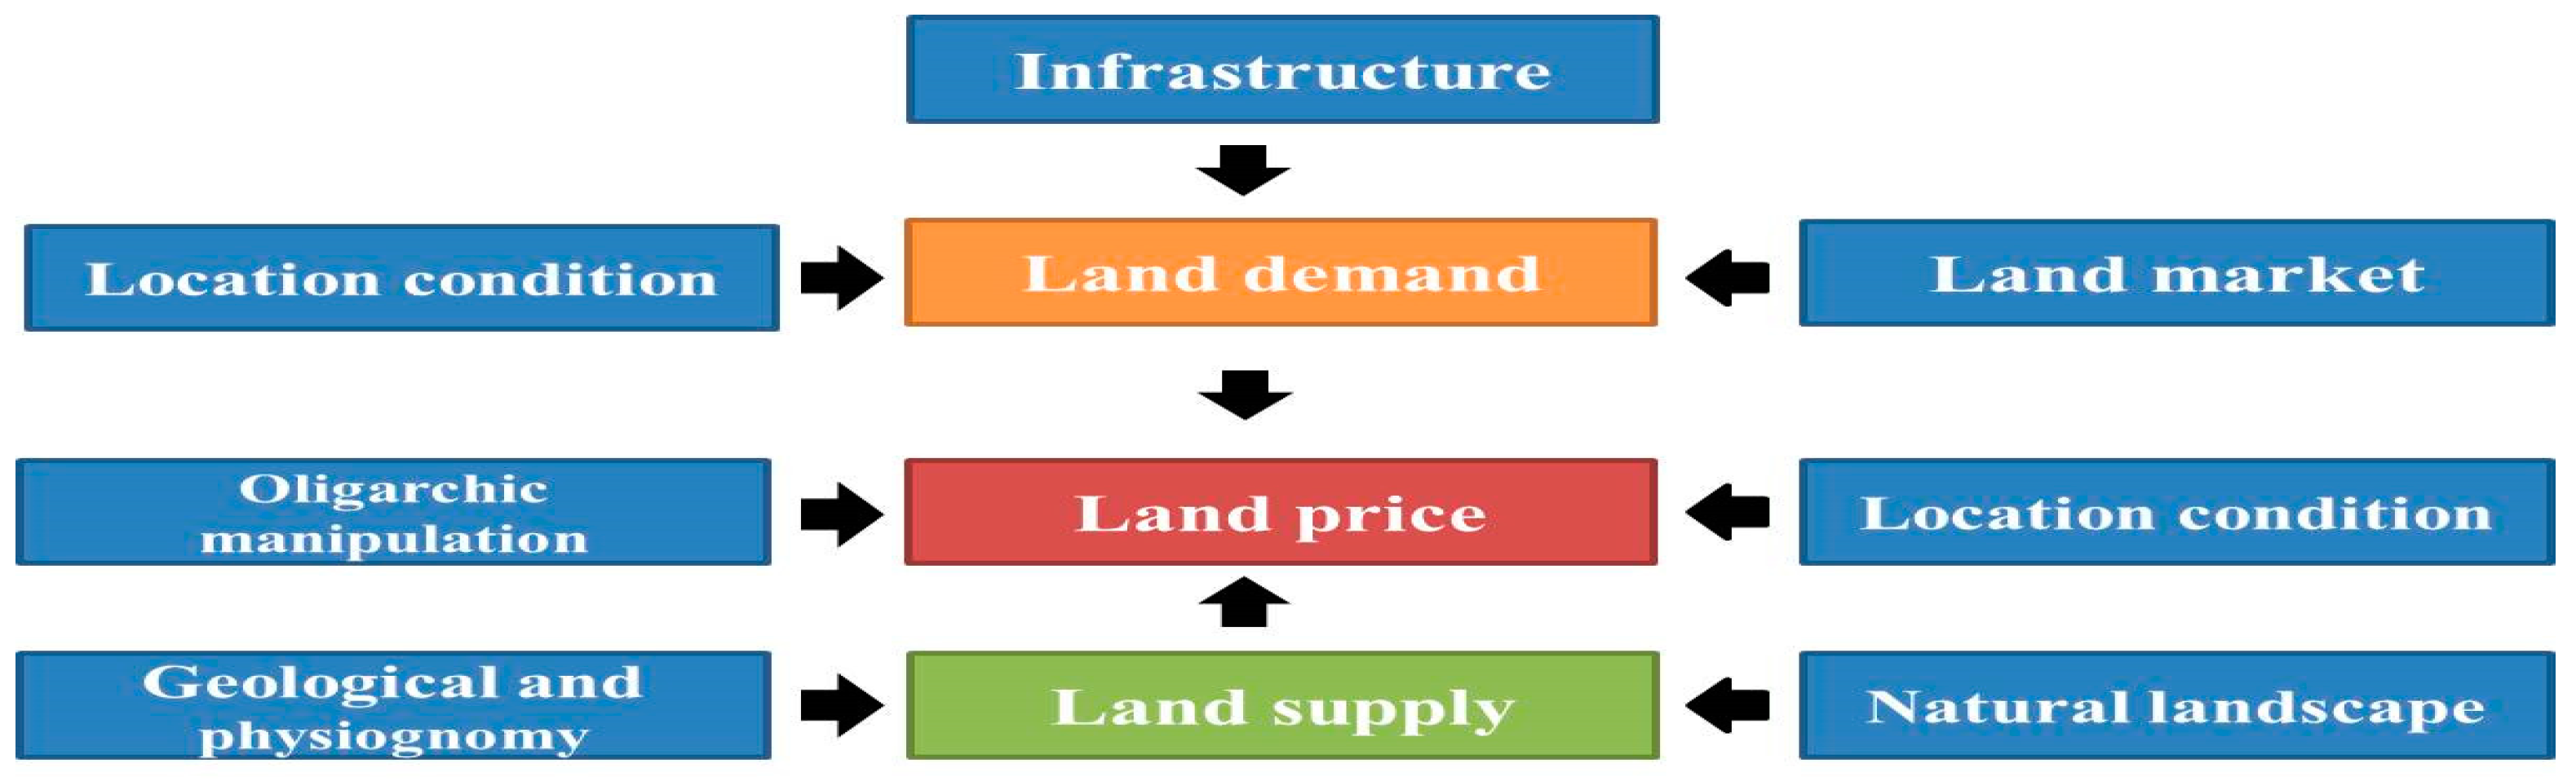
2.2. Land-Price-Influencing Factors
3. Study Area and Data
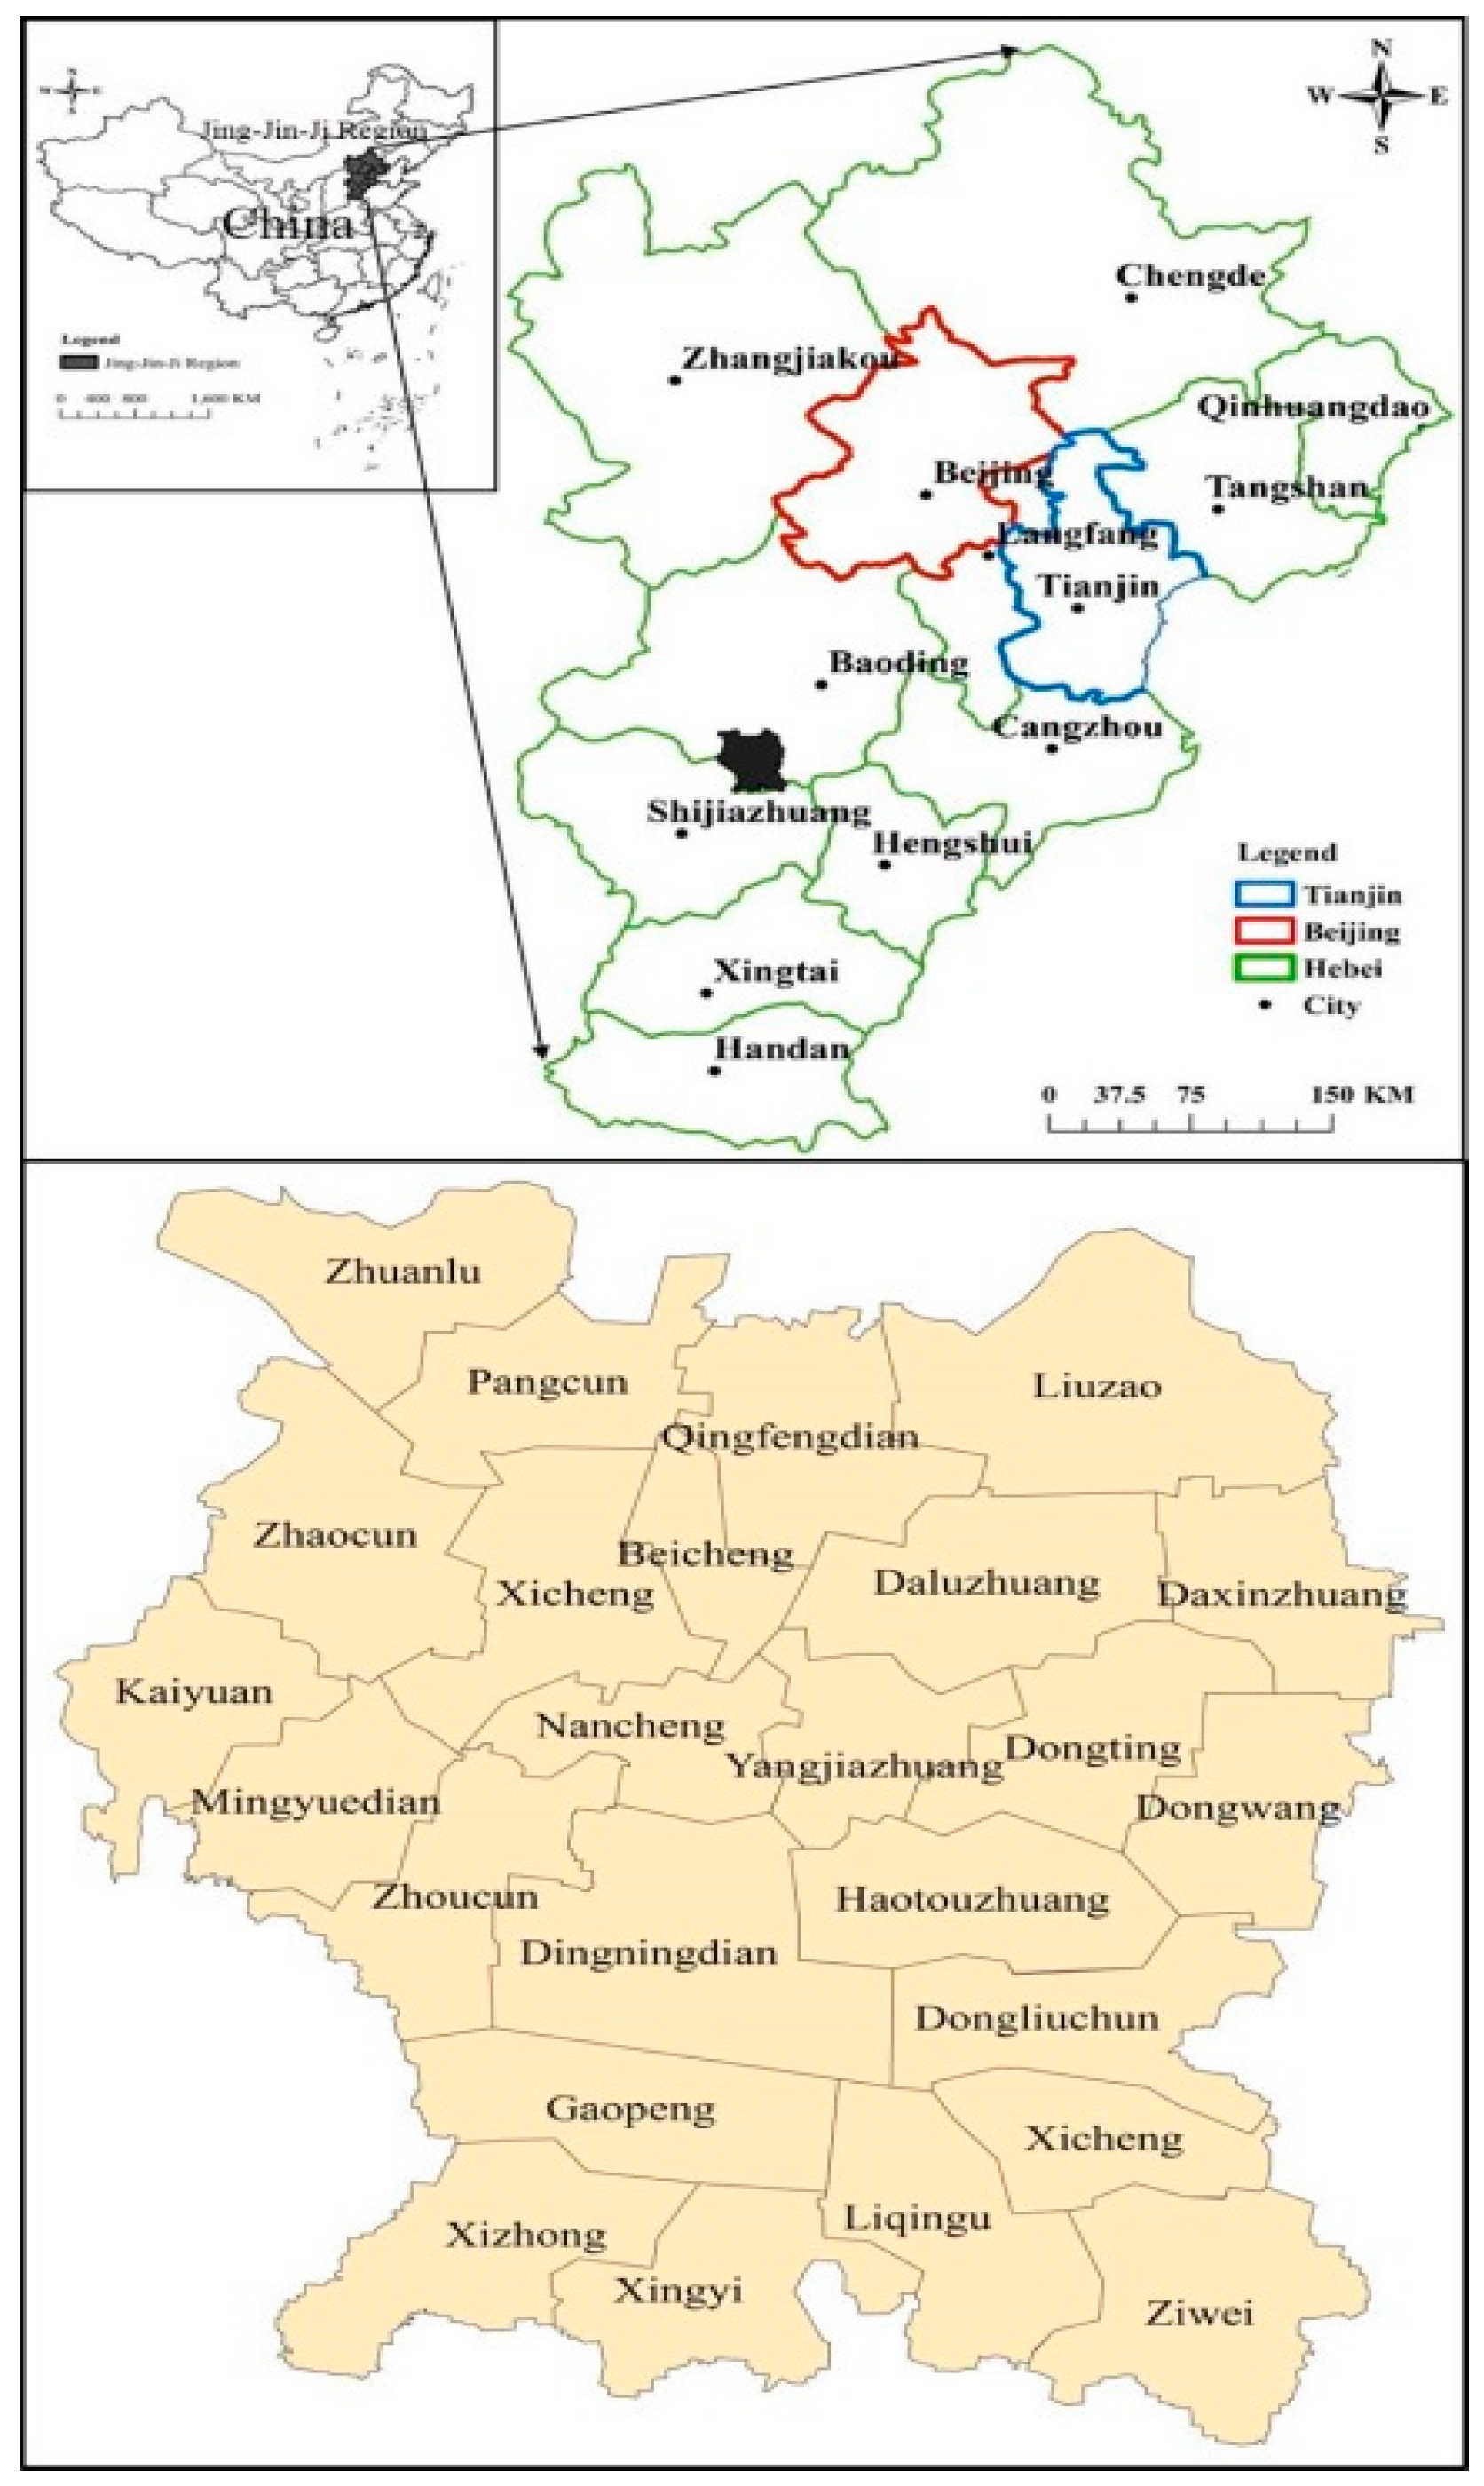
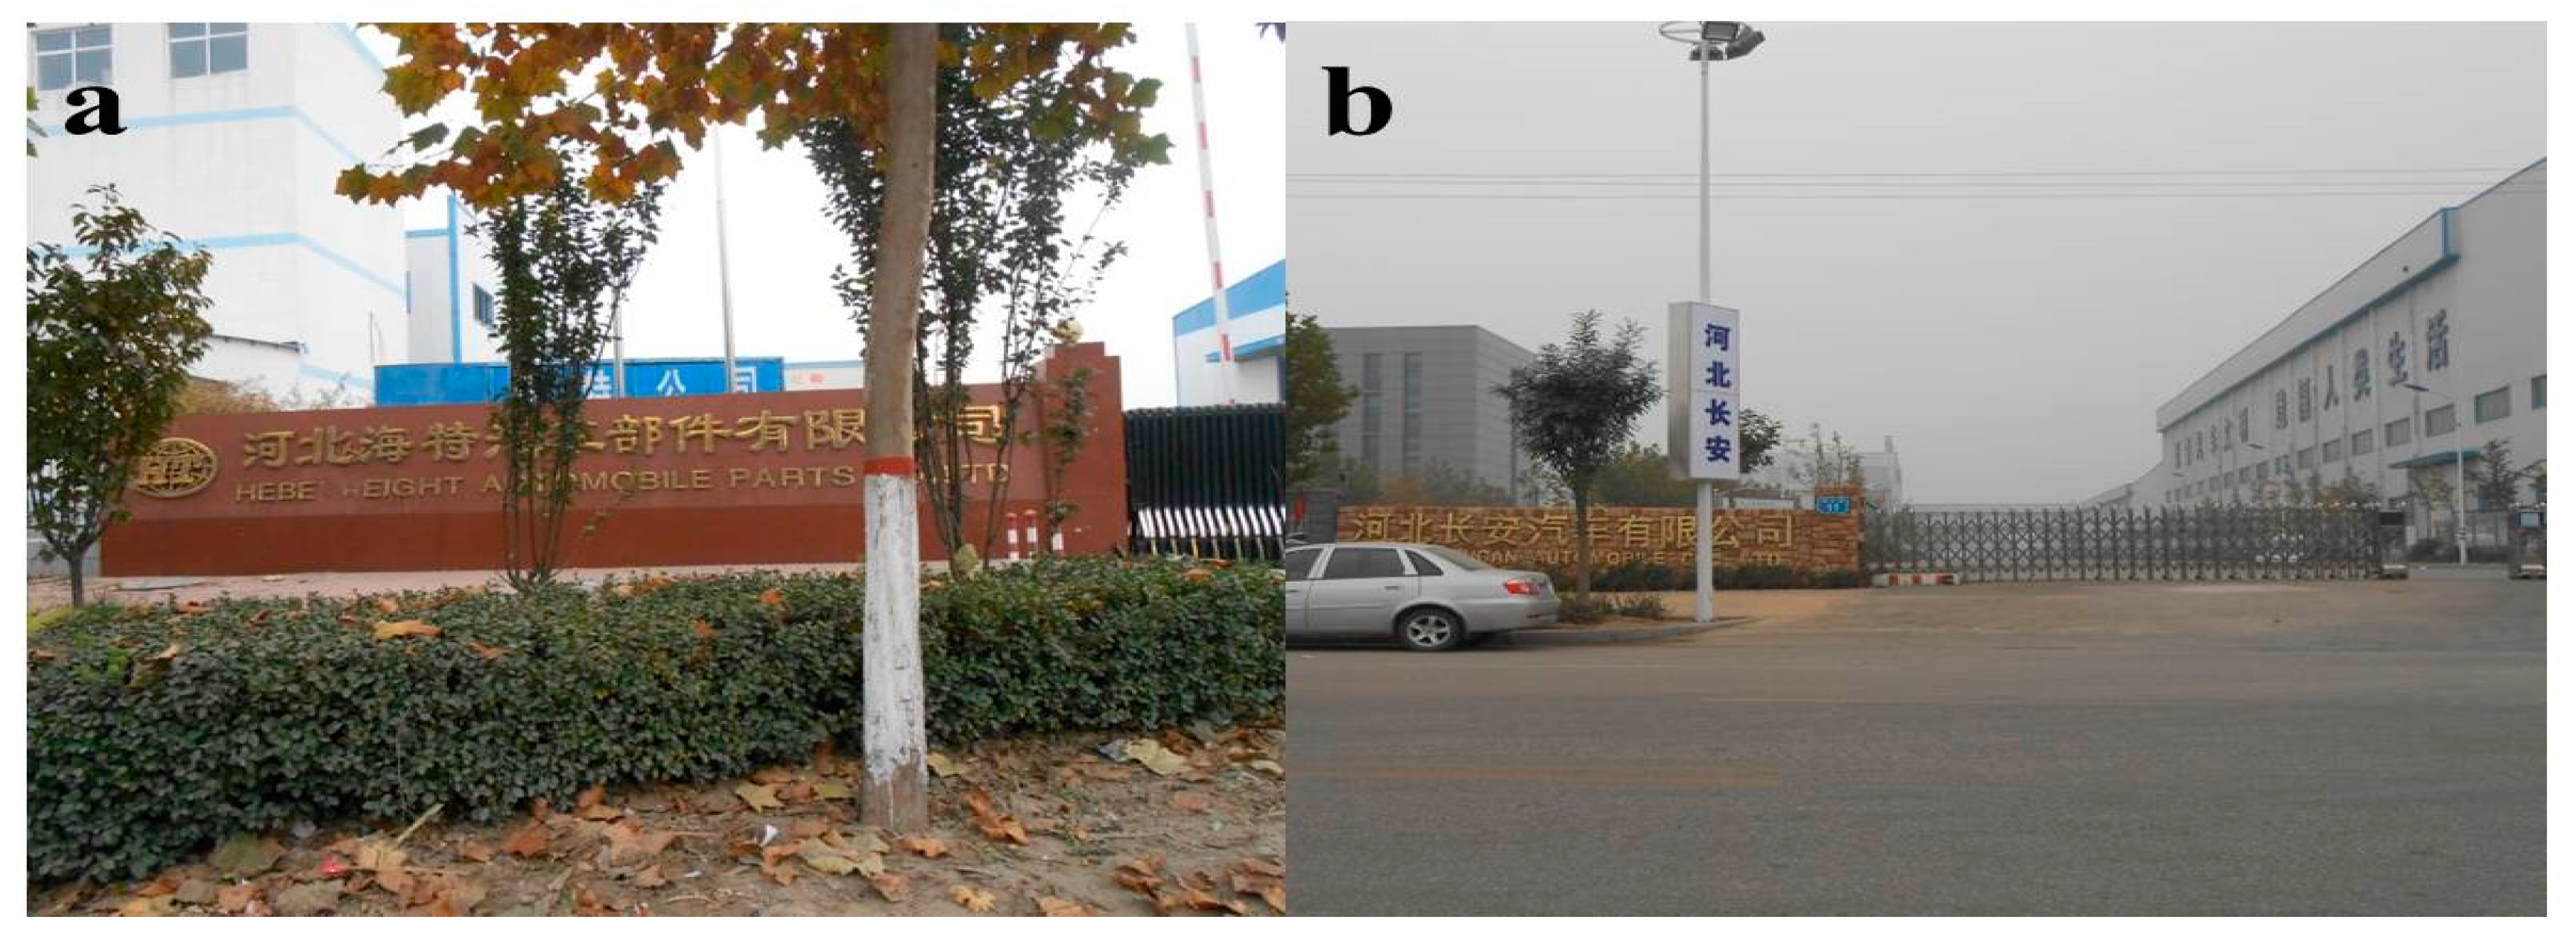
3.1. Study Area
3.2. Data
4. Methods
4.1. Selection of Driving Factors
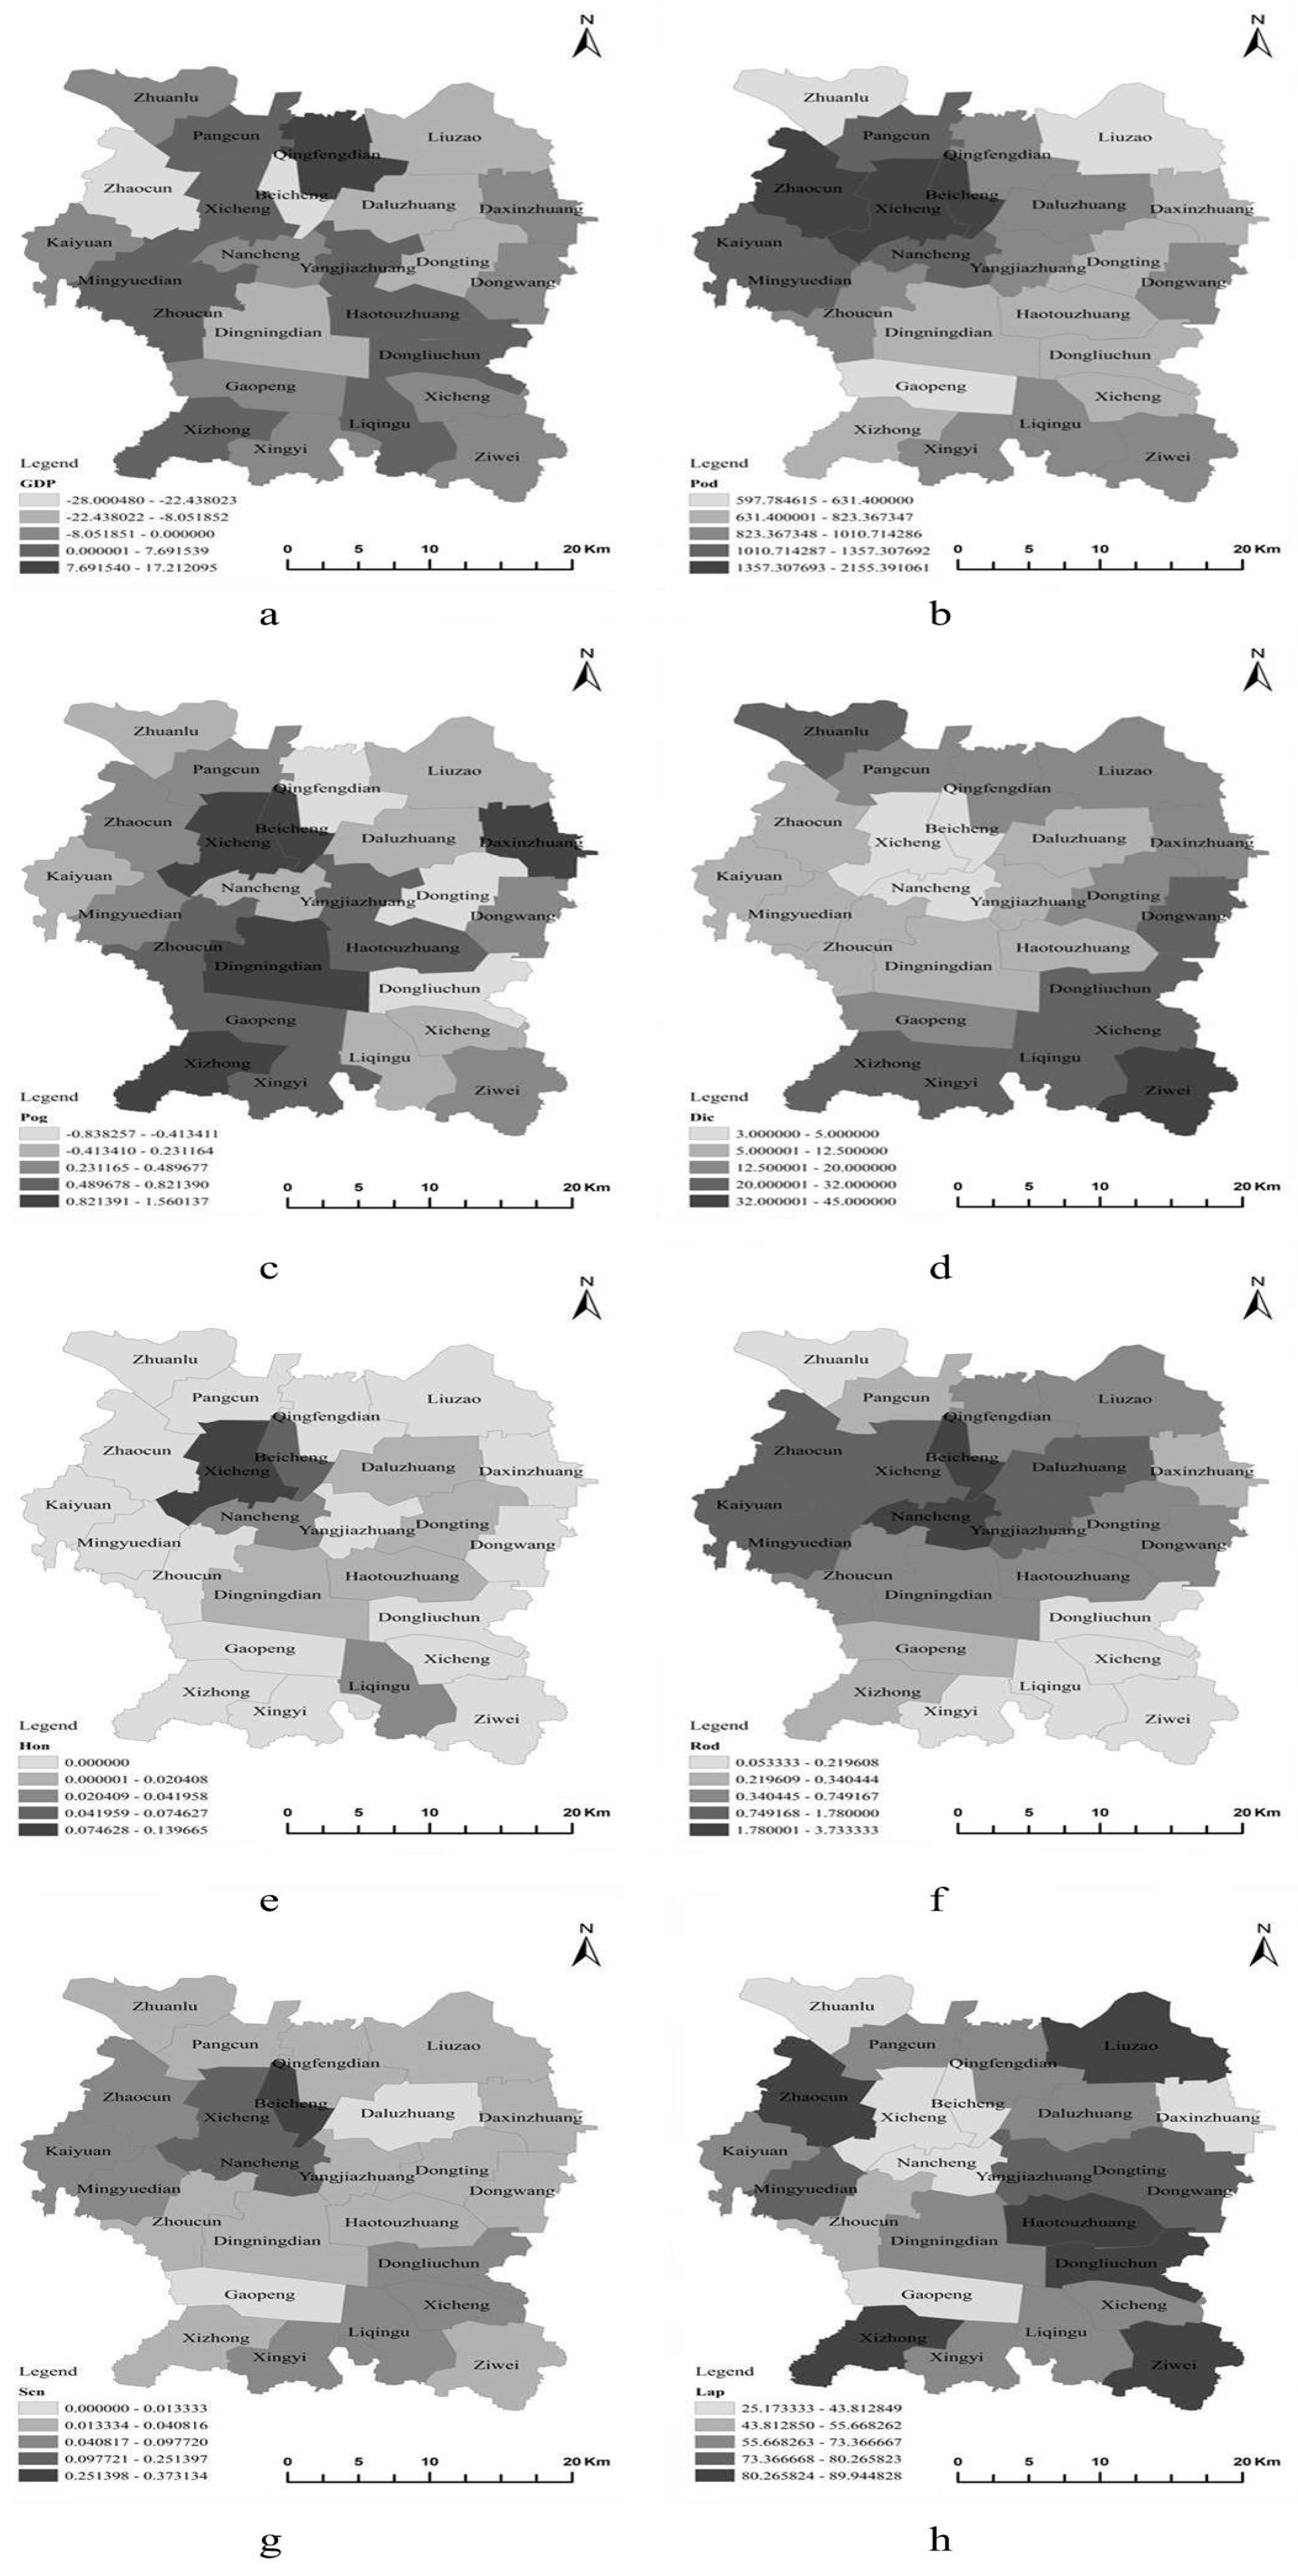
4.2. Industrial Land Transfer Price’s Spatial Distribution Features in Dingzhou City
4.3. OLS and GWR Method
5. Results
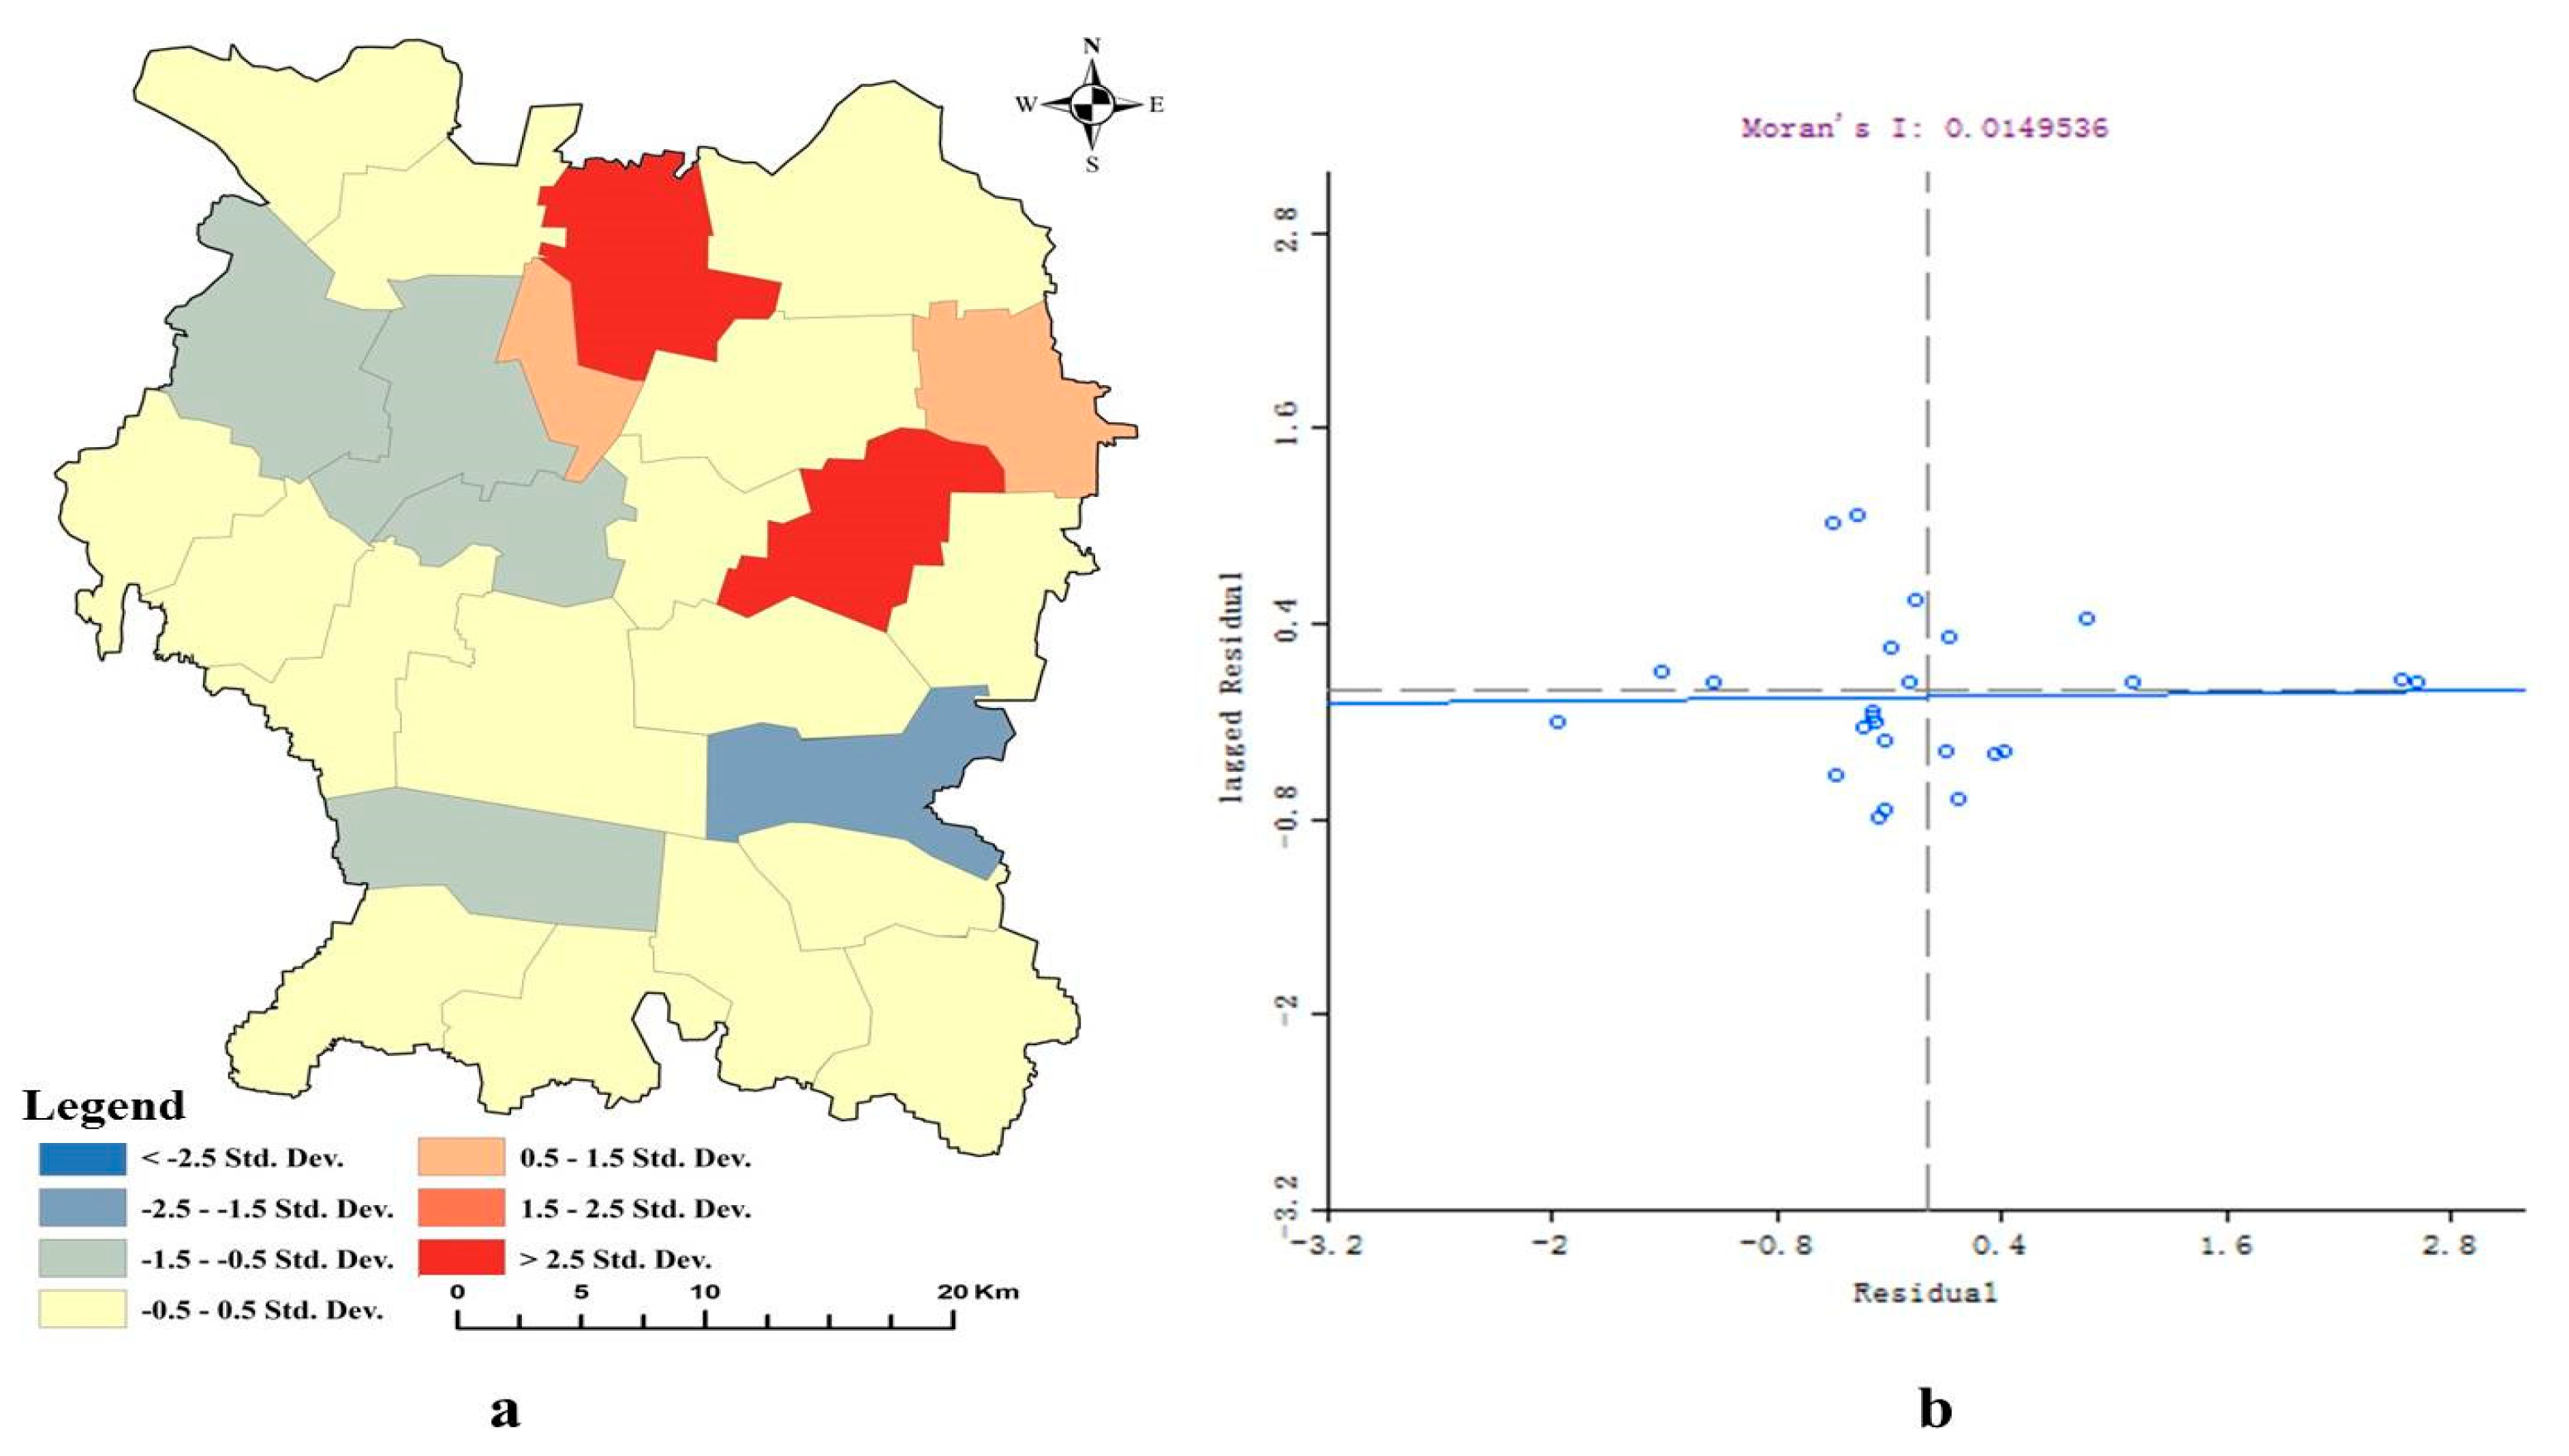
5.1. Results of OLS
5.2. Parameter Estimation Results by the OLS Model and GWR Model
6. Driving Factors’ Spatial Interaction Modes by the GWR Method
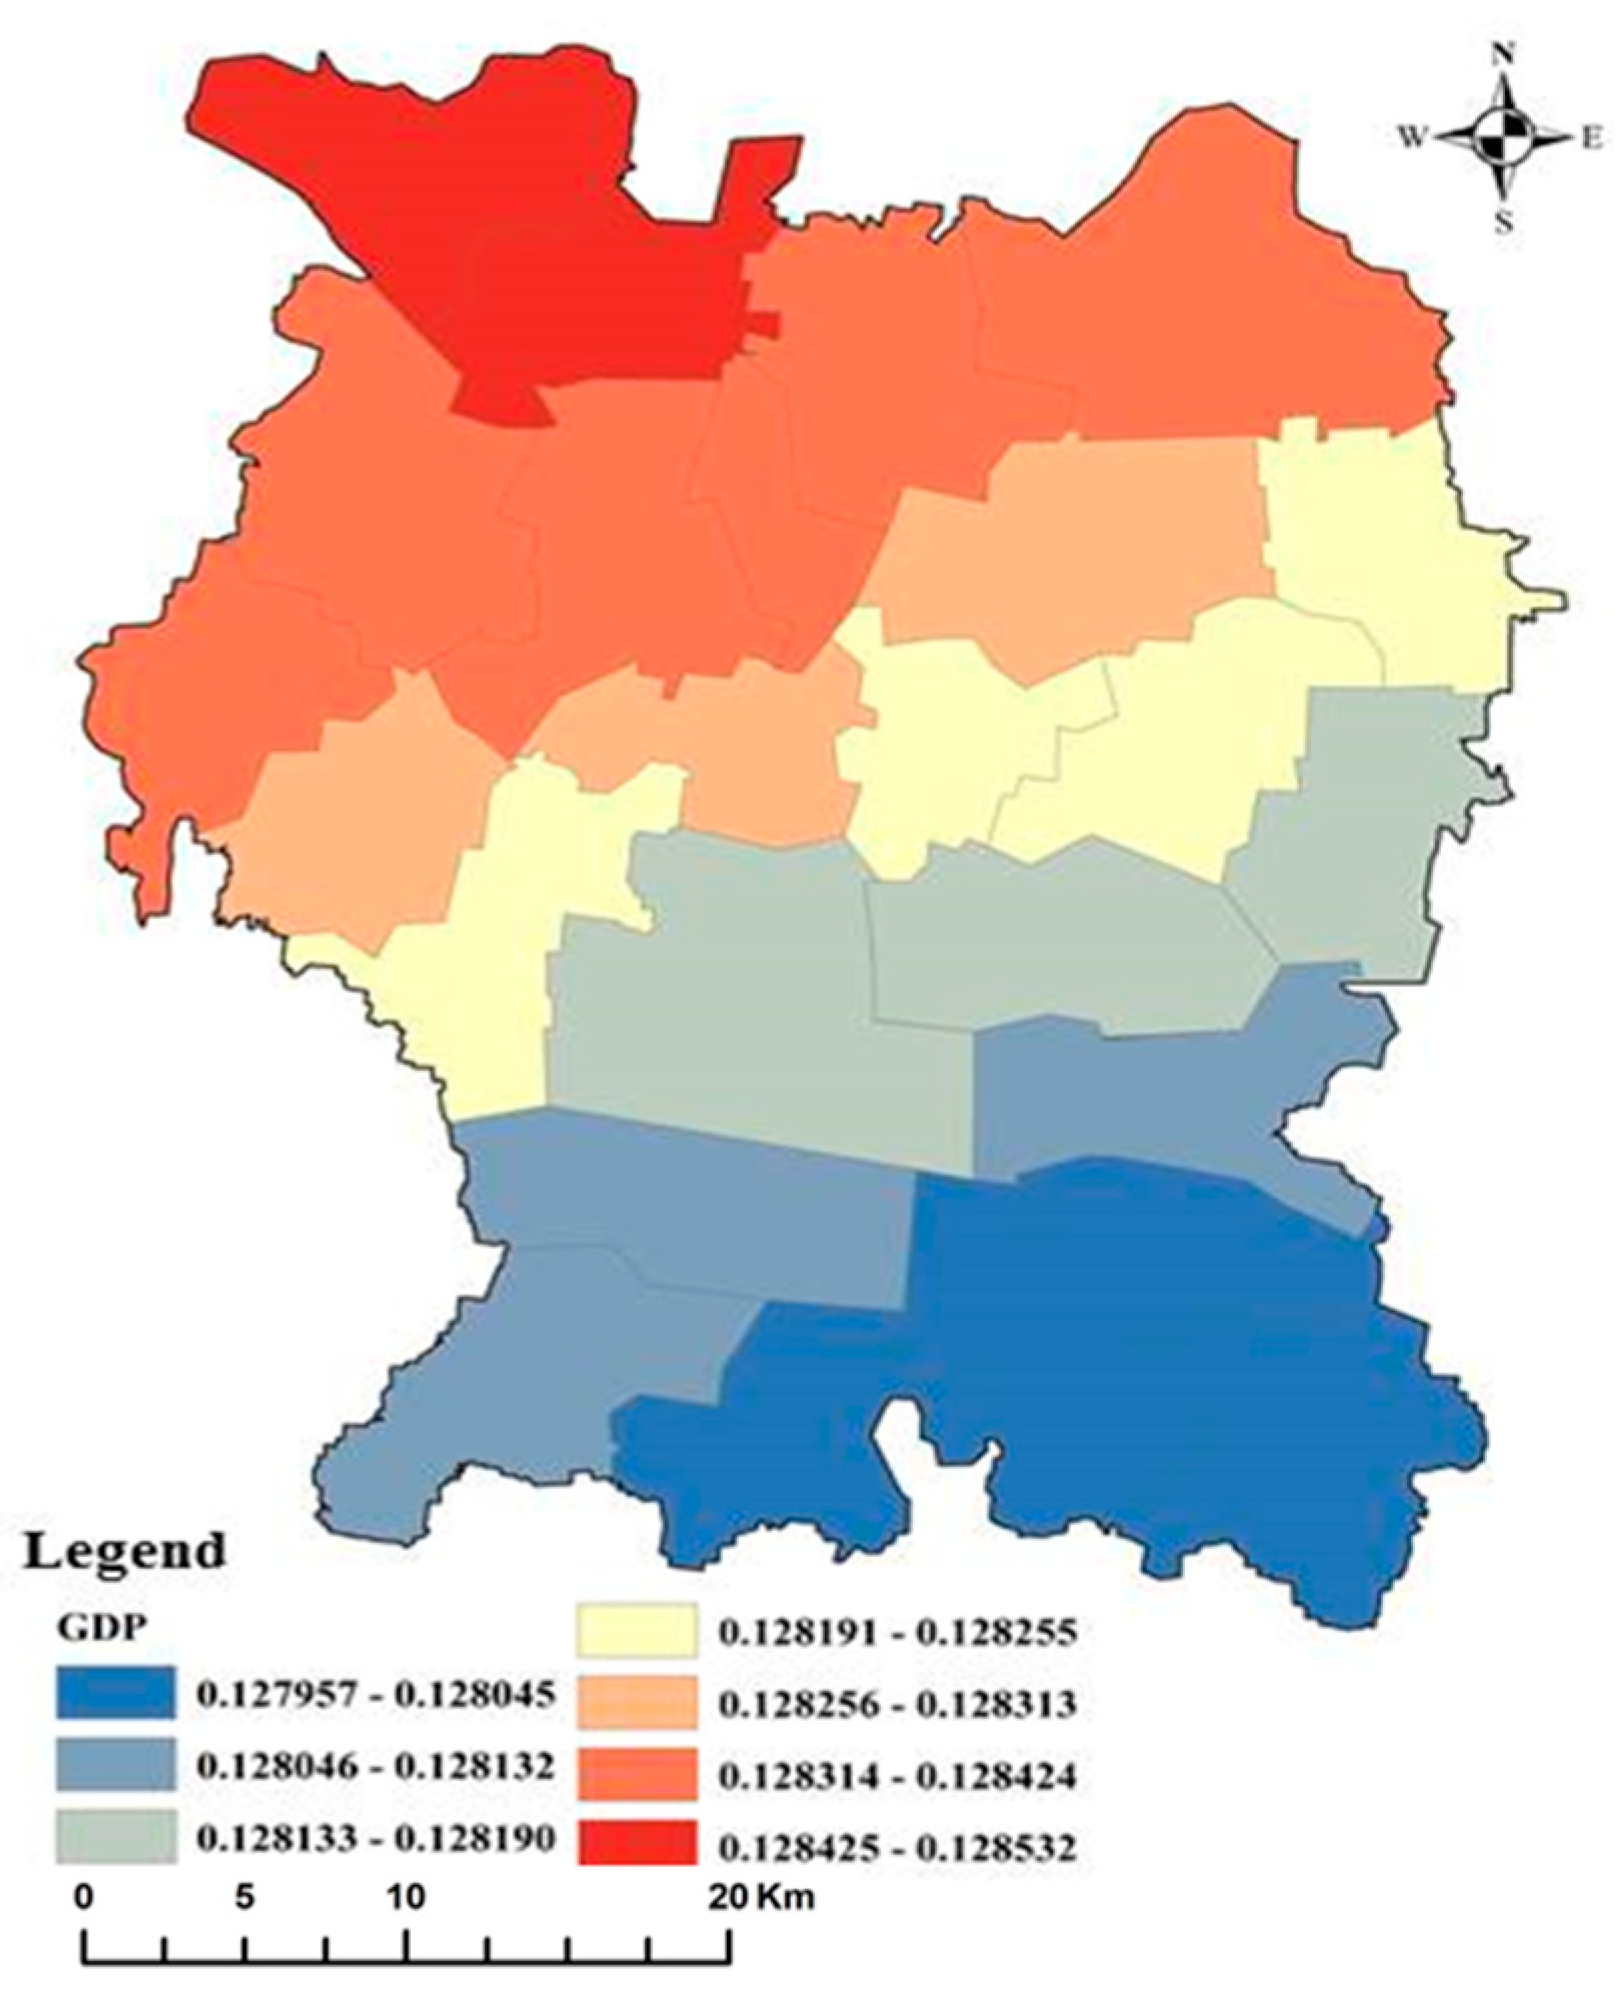
6.1. Spatial Driving Pattern by Economy Conditions
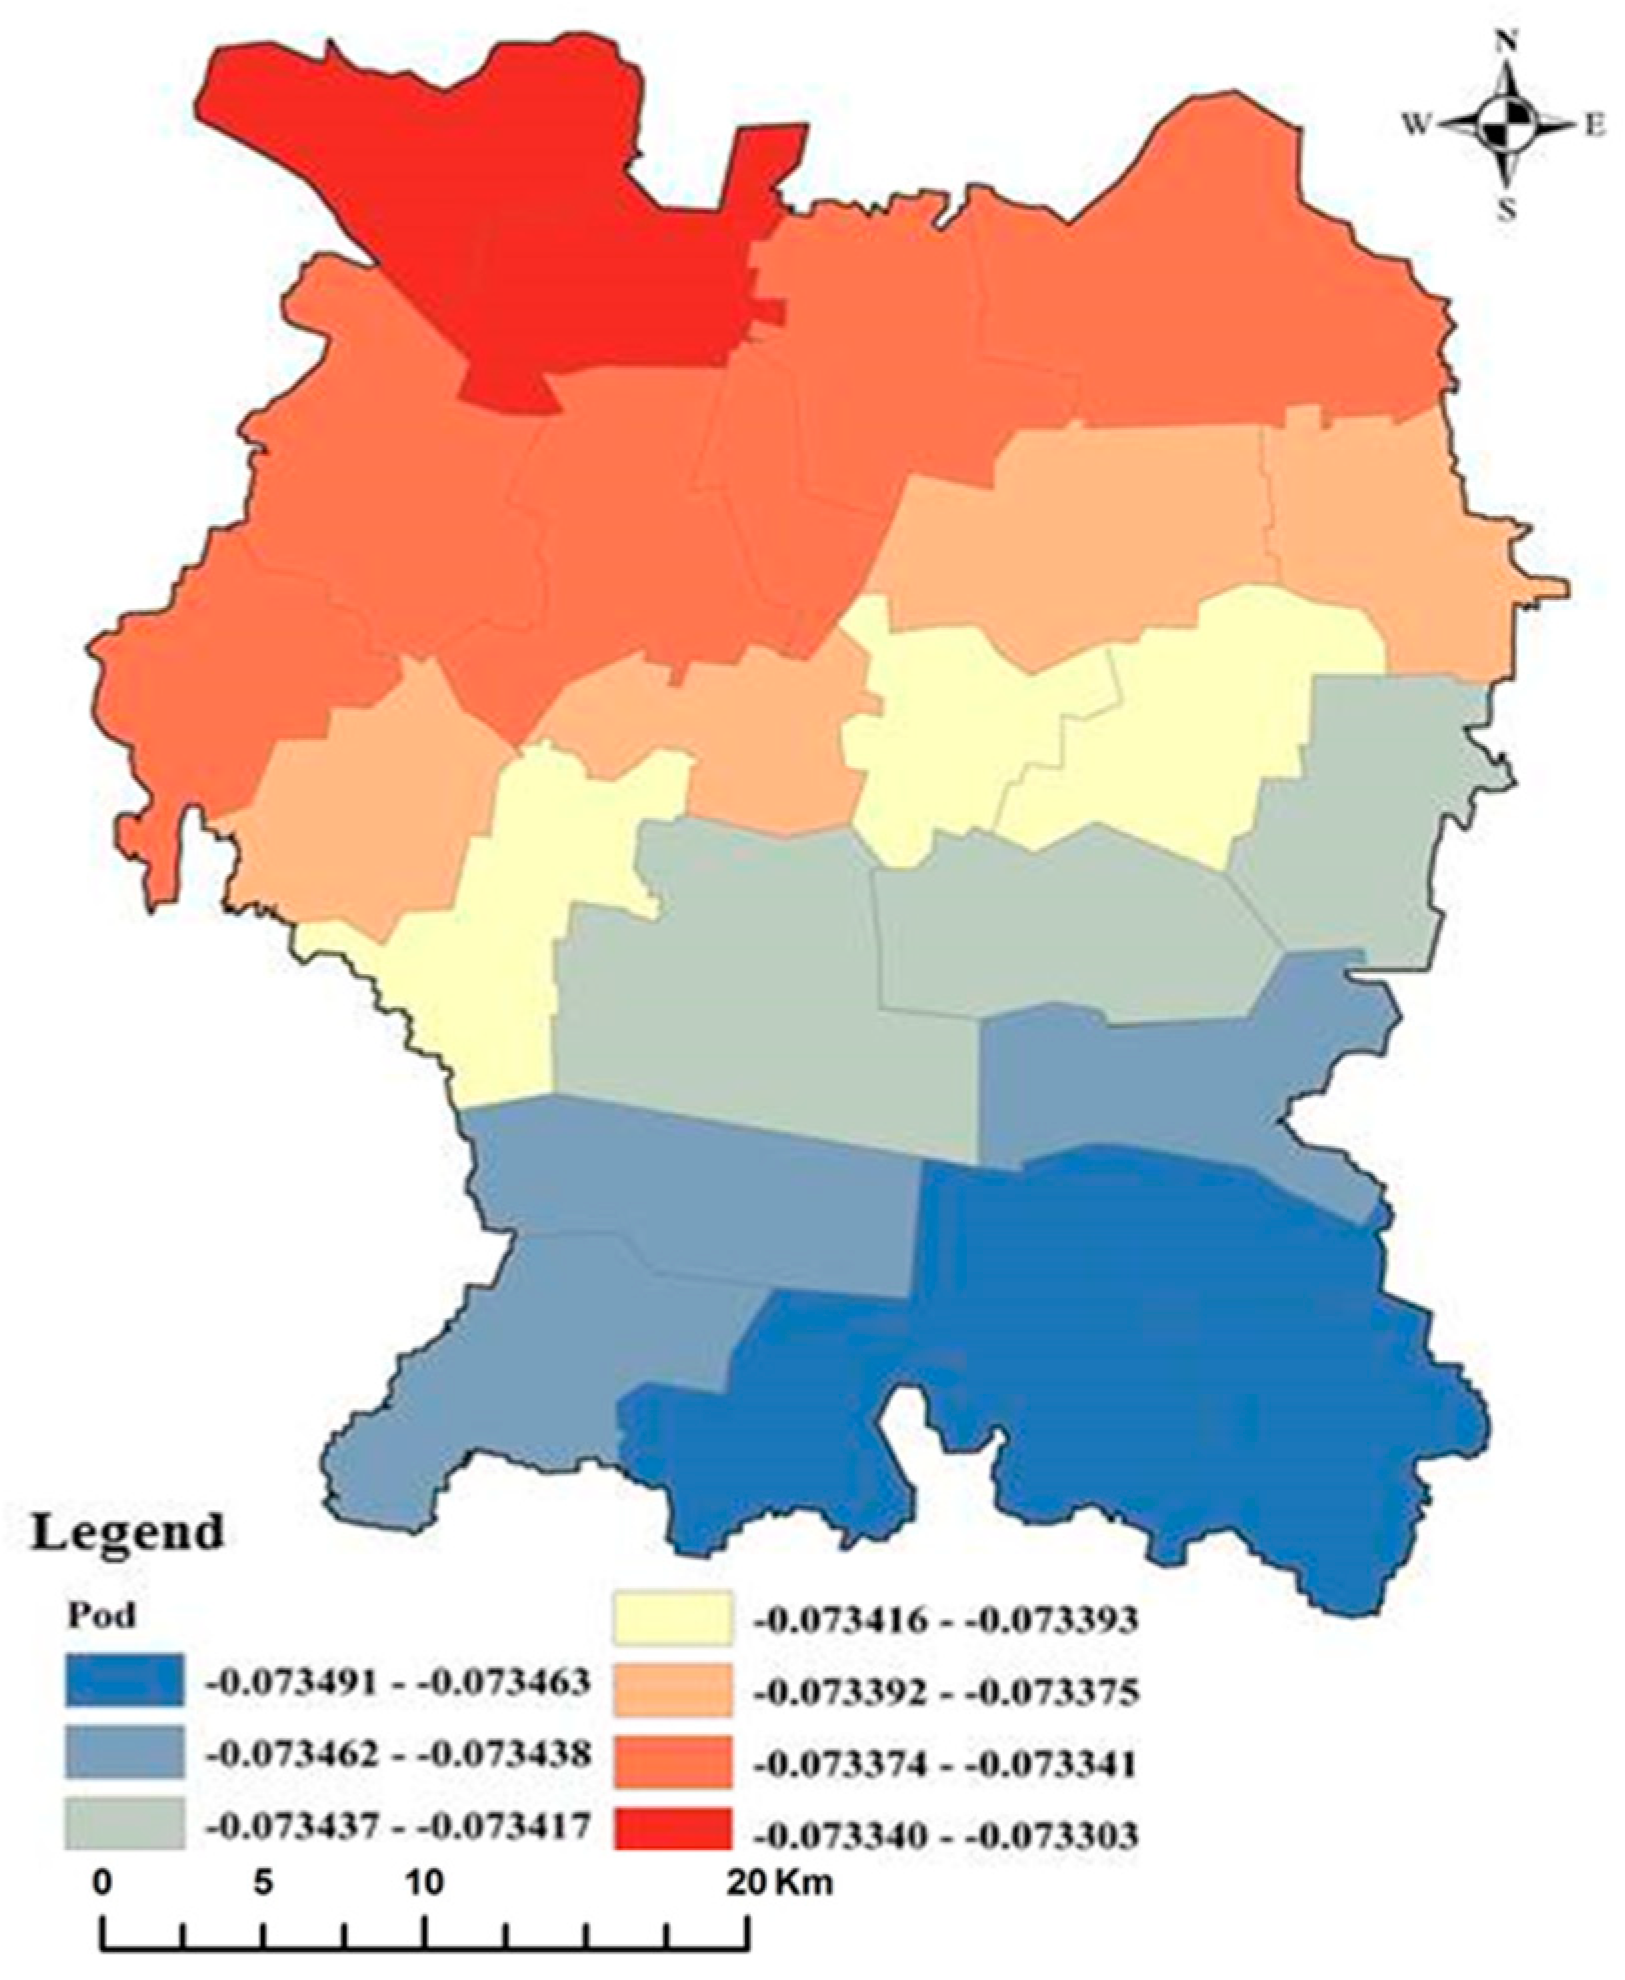
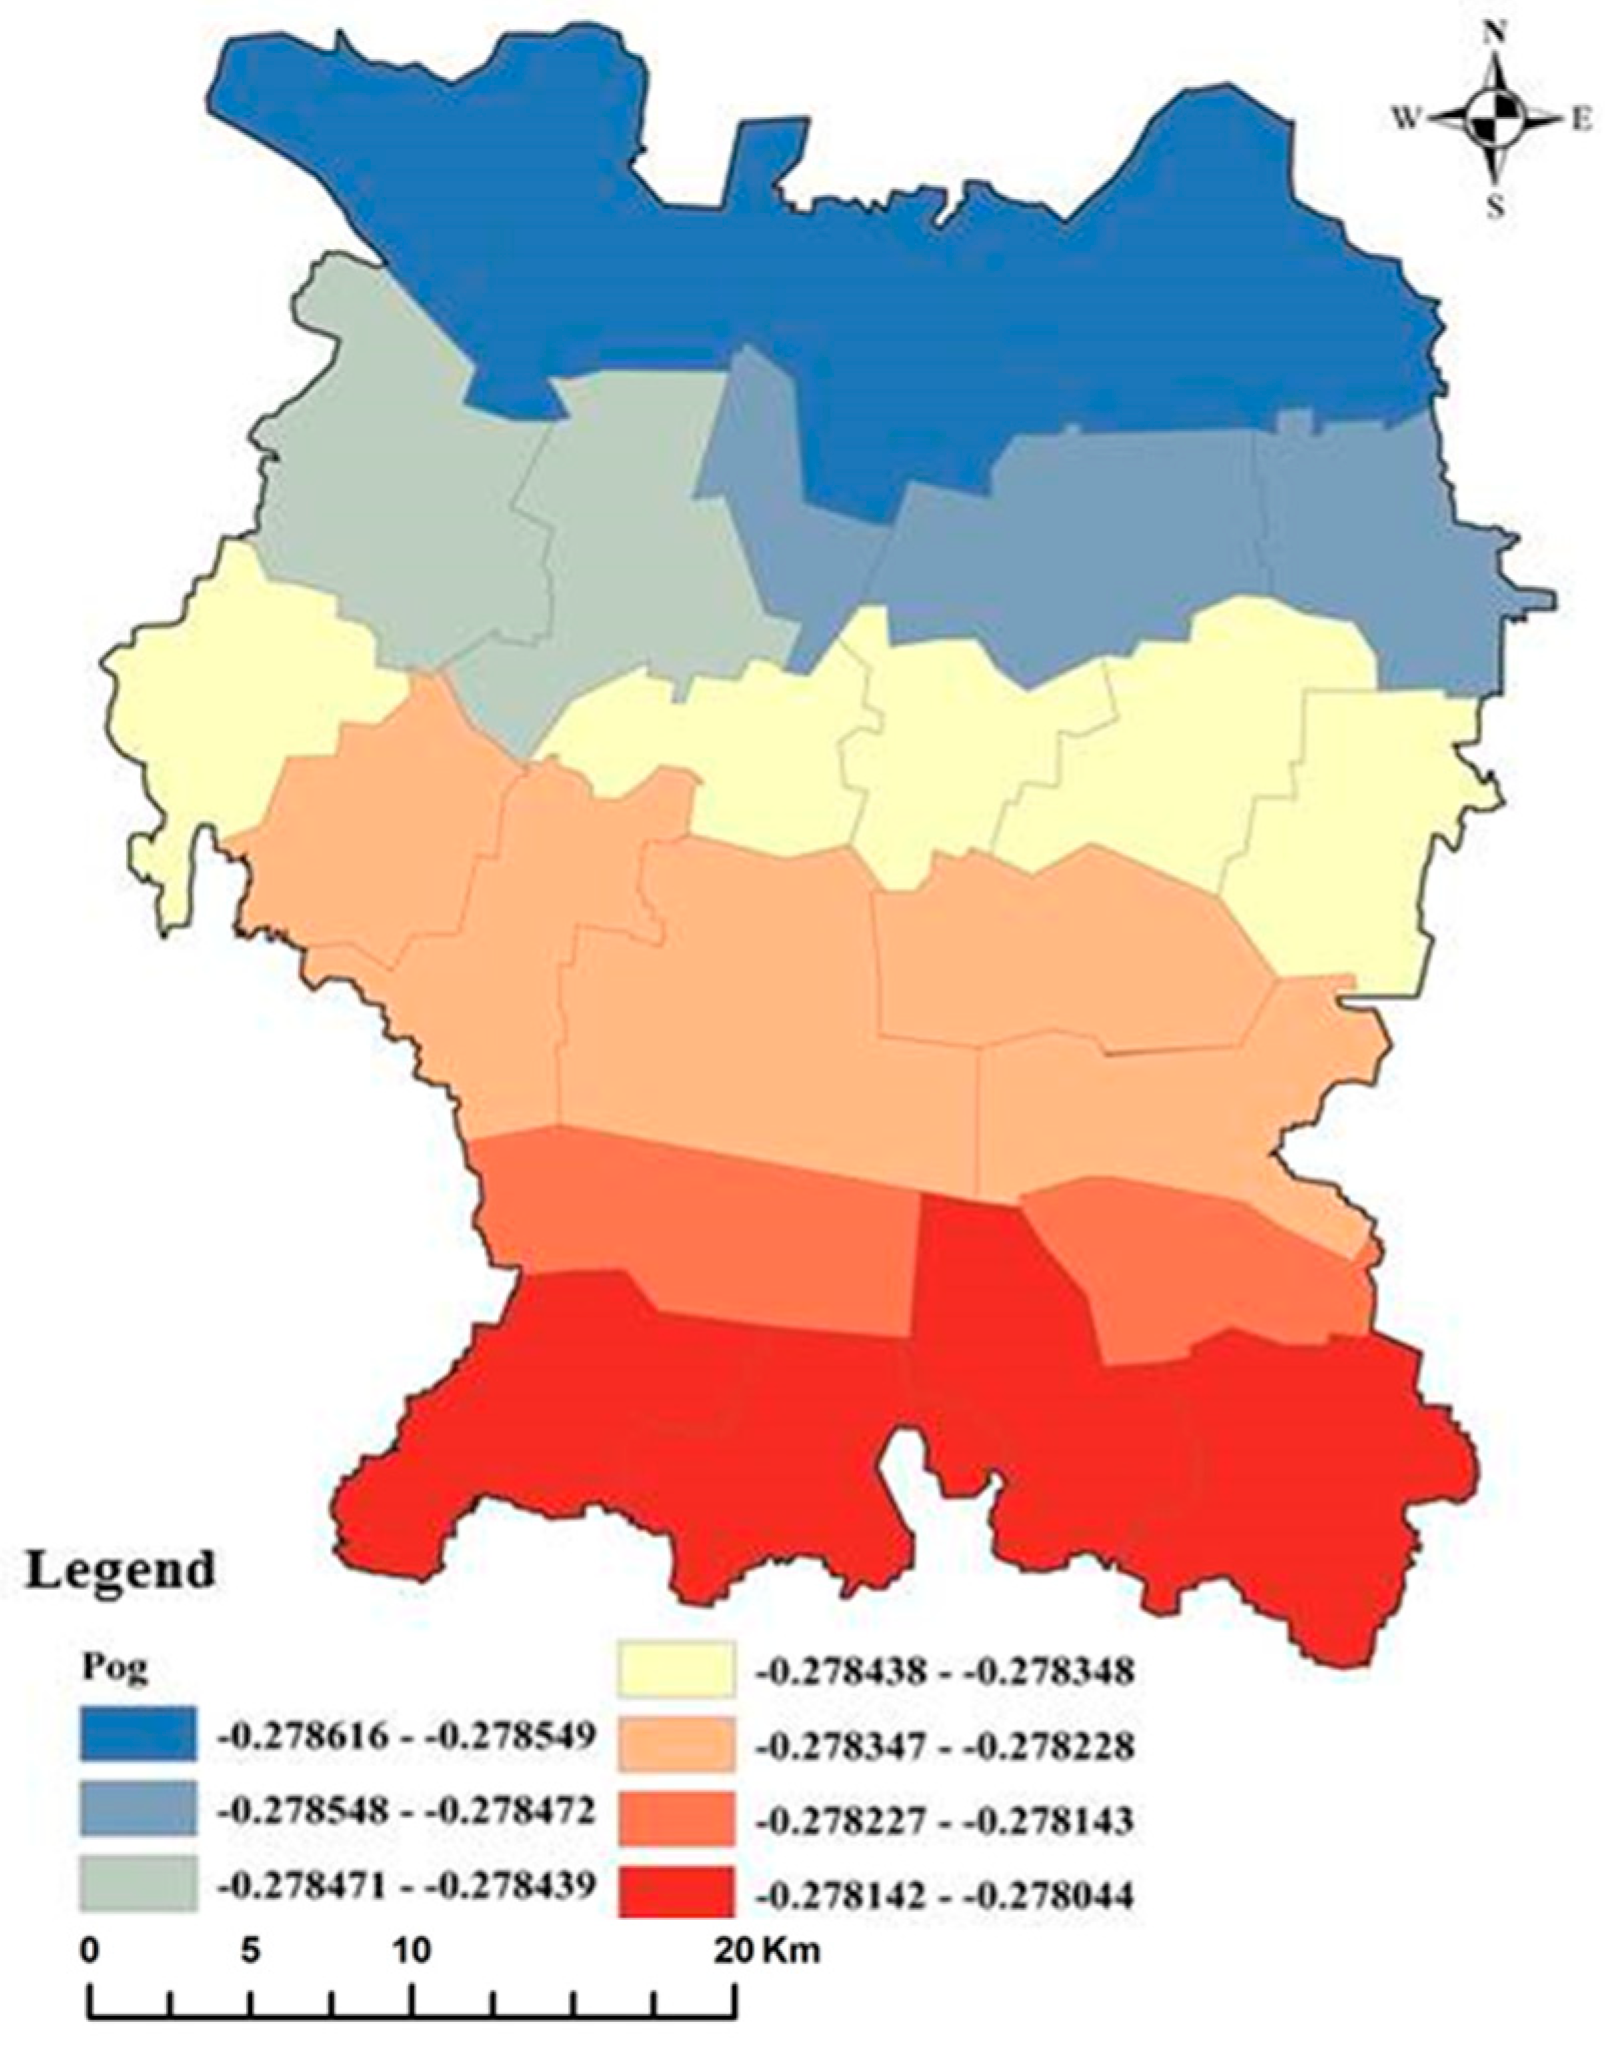
6.2. Spatial Driving Pattern by Population Conditions
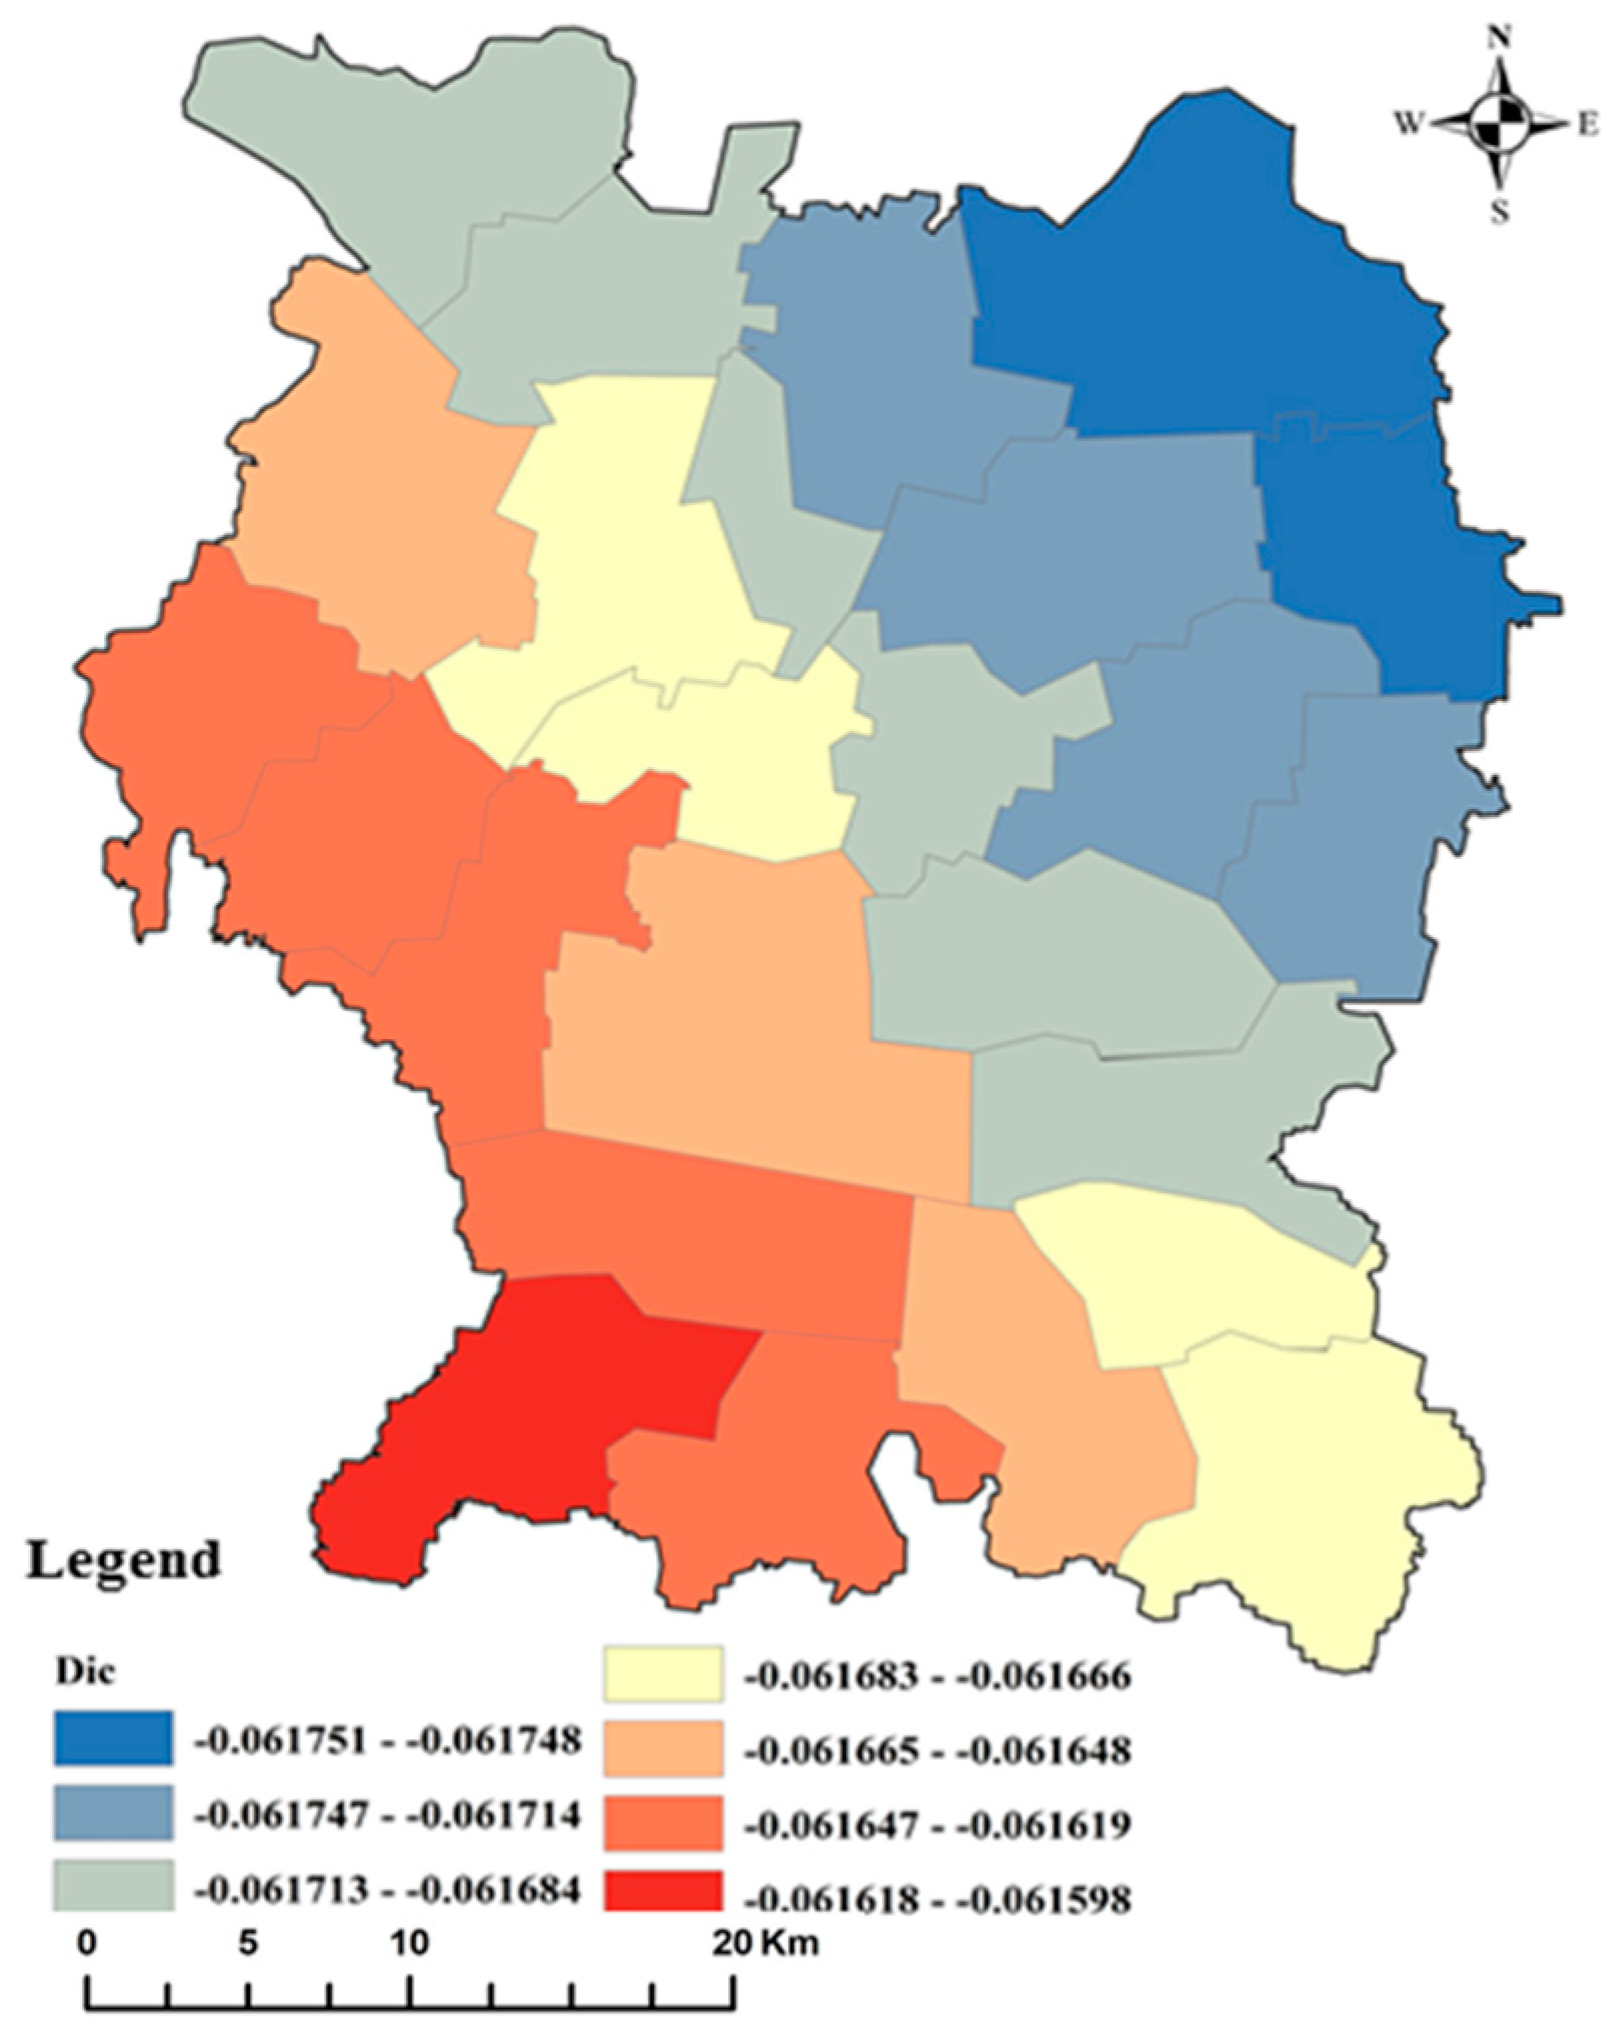
6.3. Spatial Driving Pattern by Location Conditions
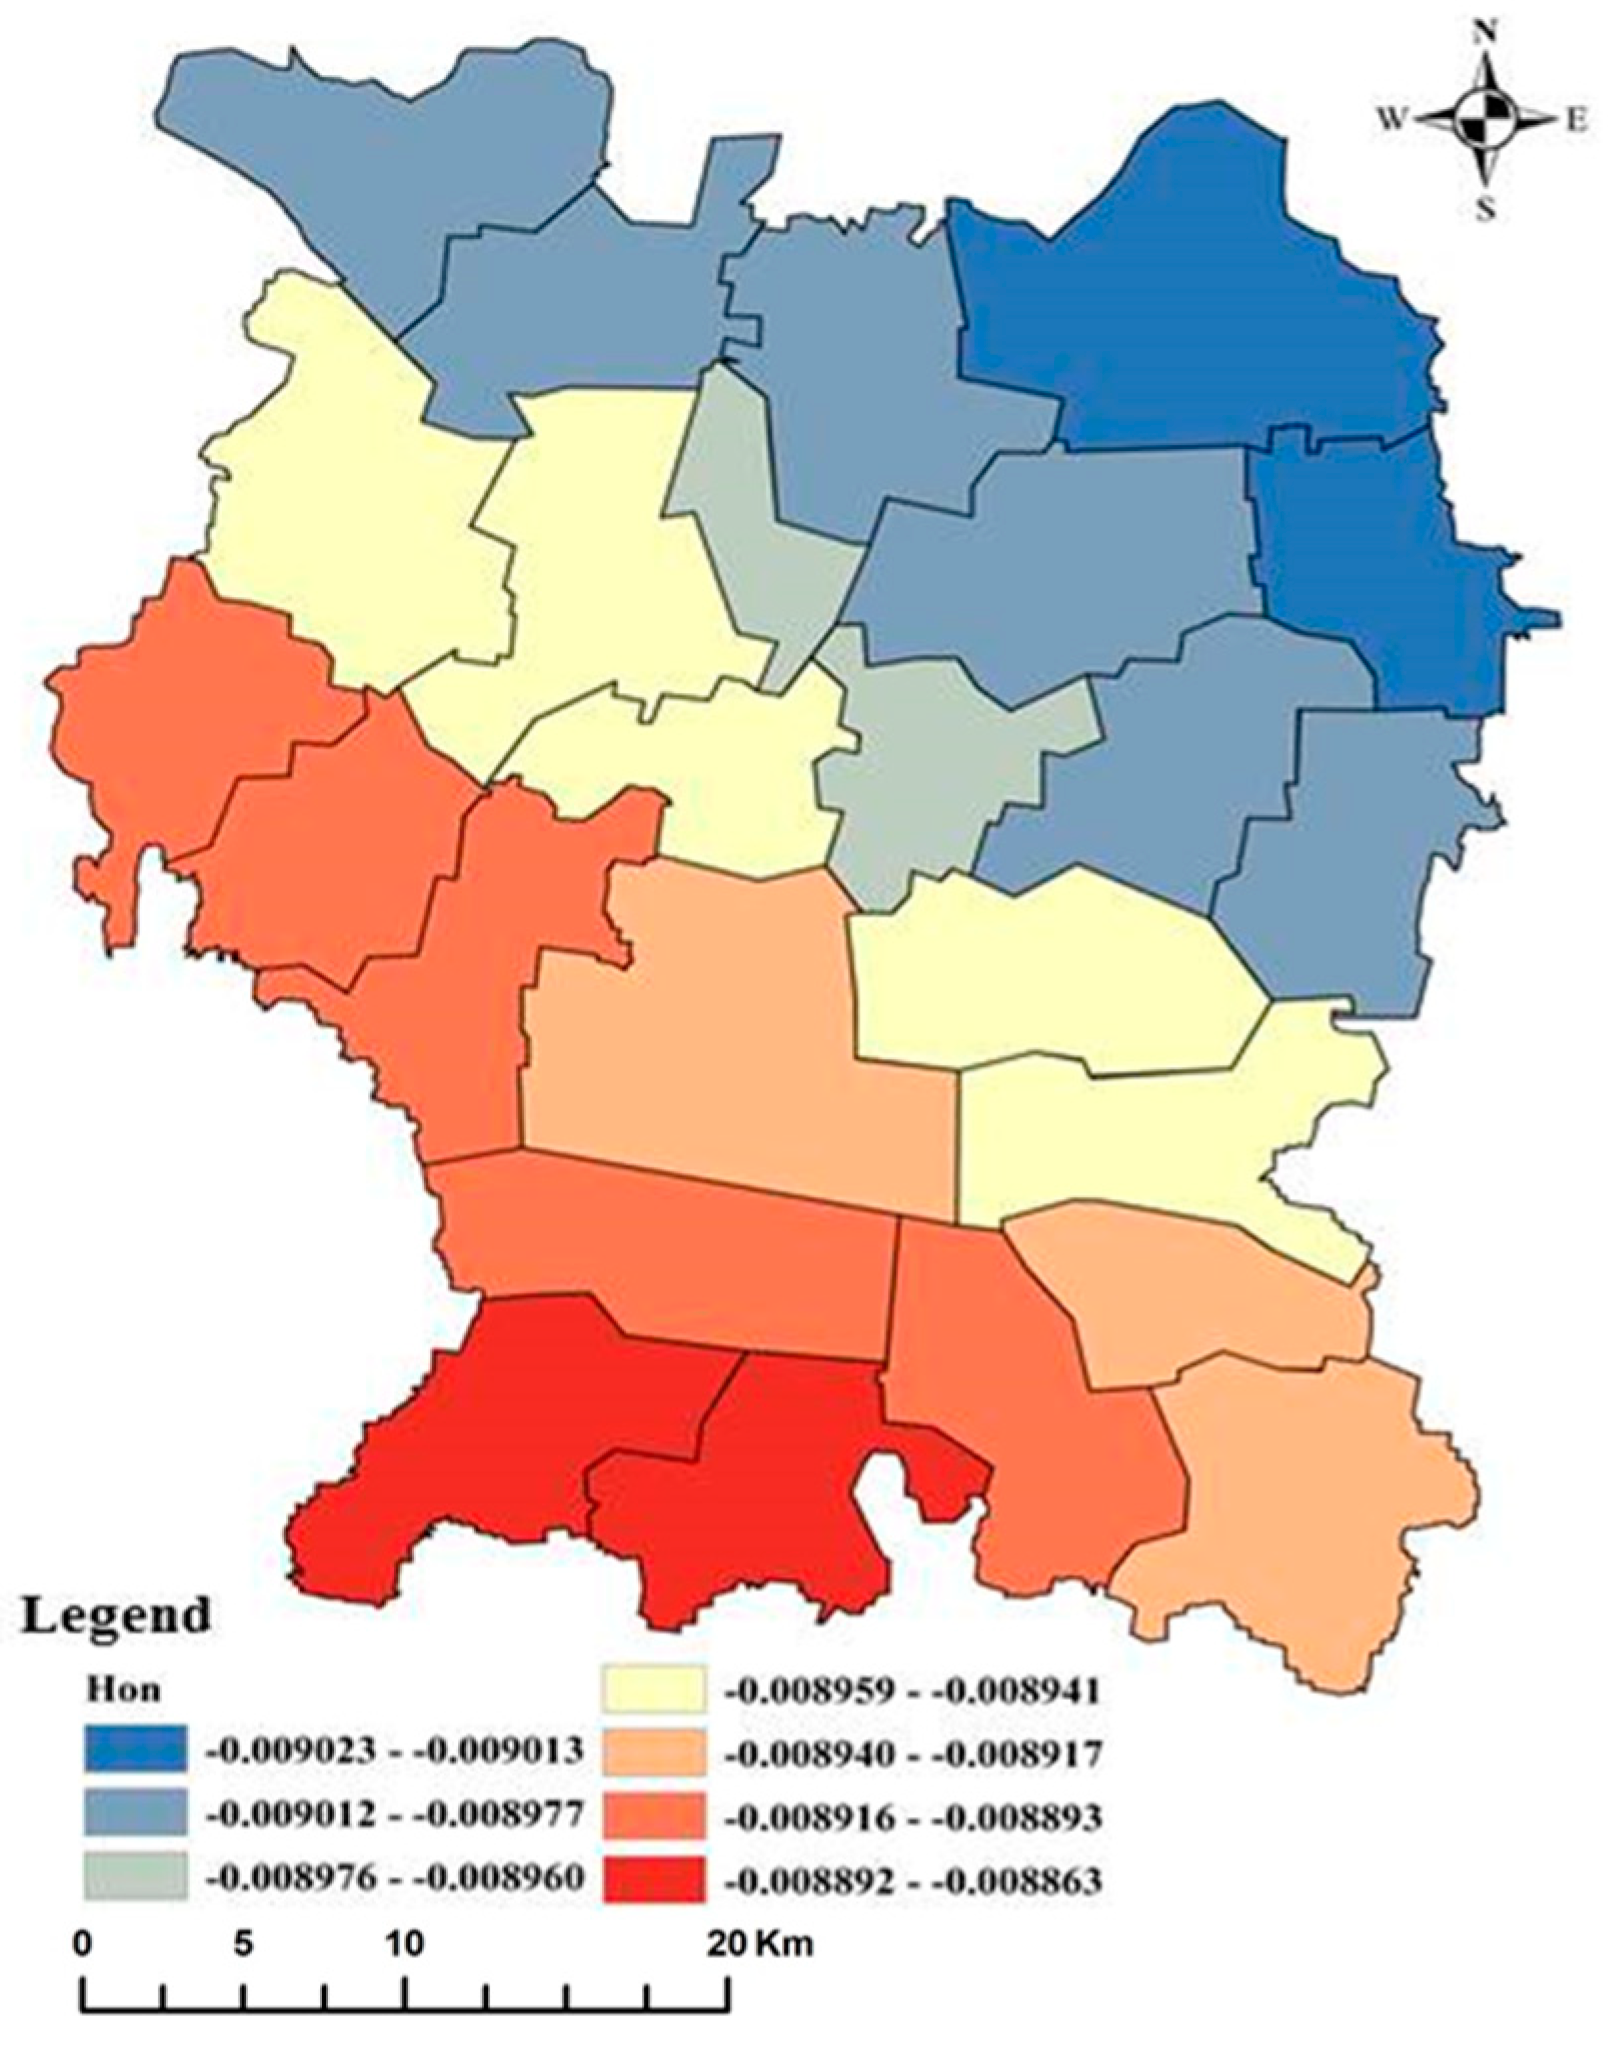
6.4. Spatial Driving Pattern by Infrastructure Conditions
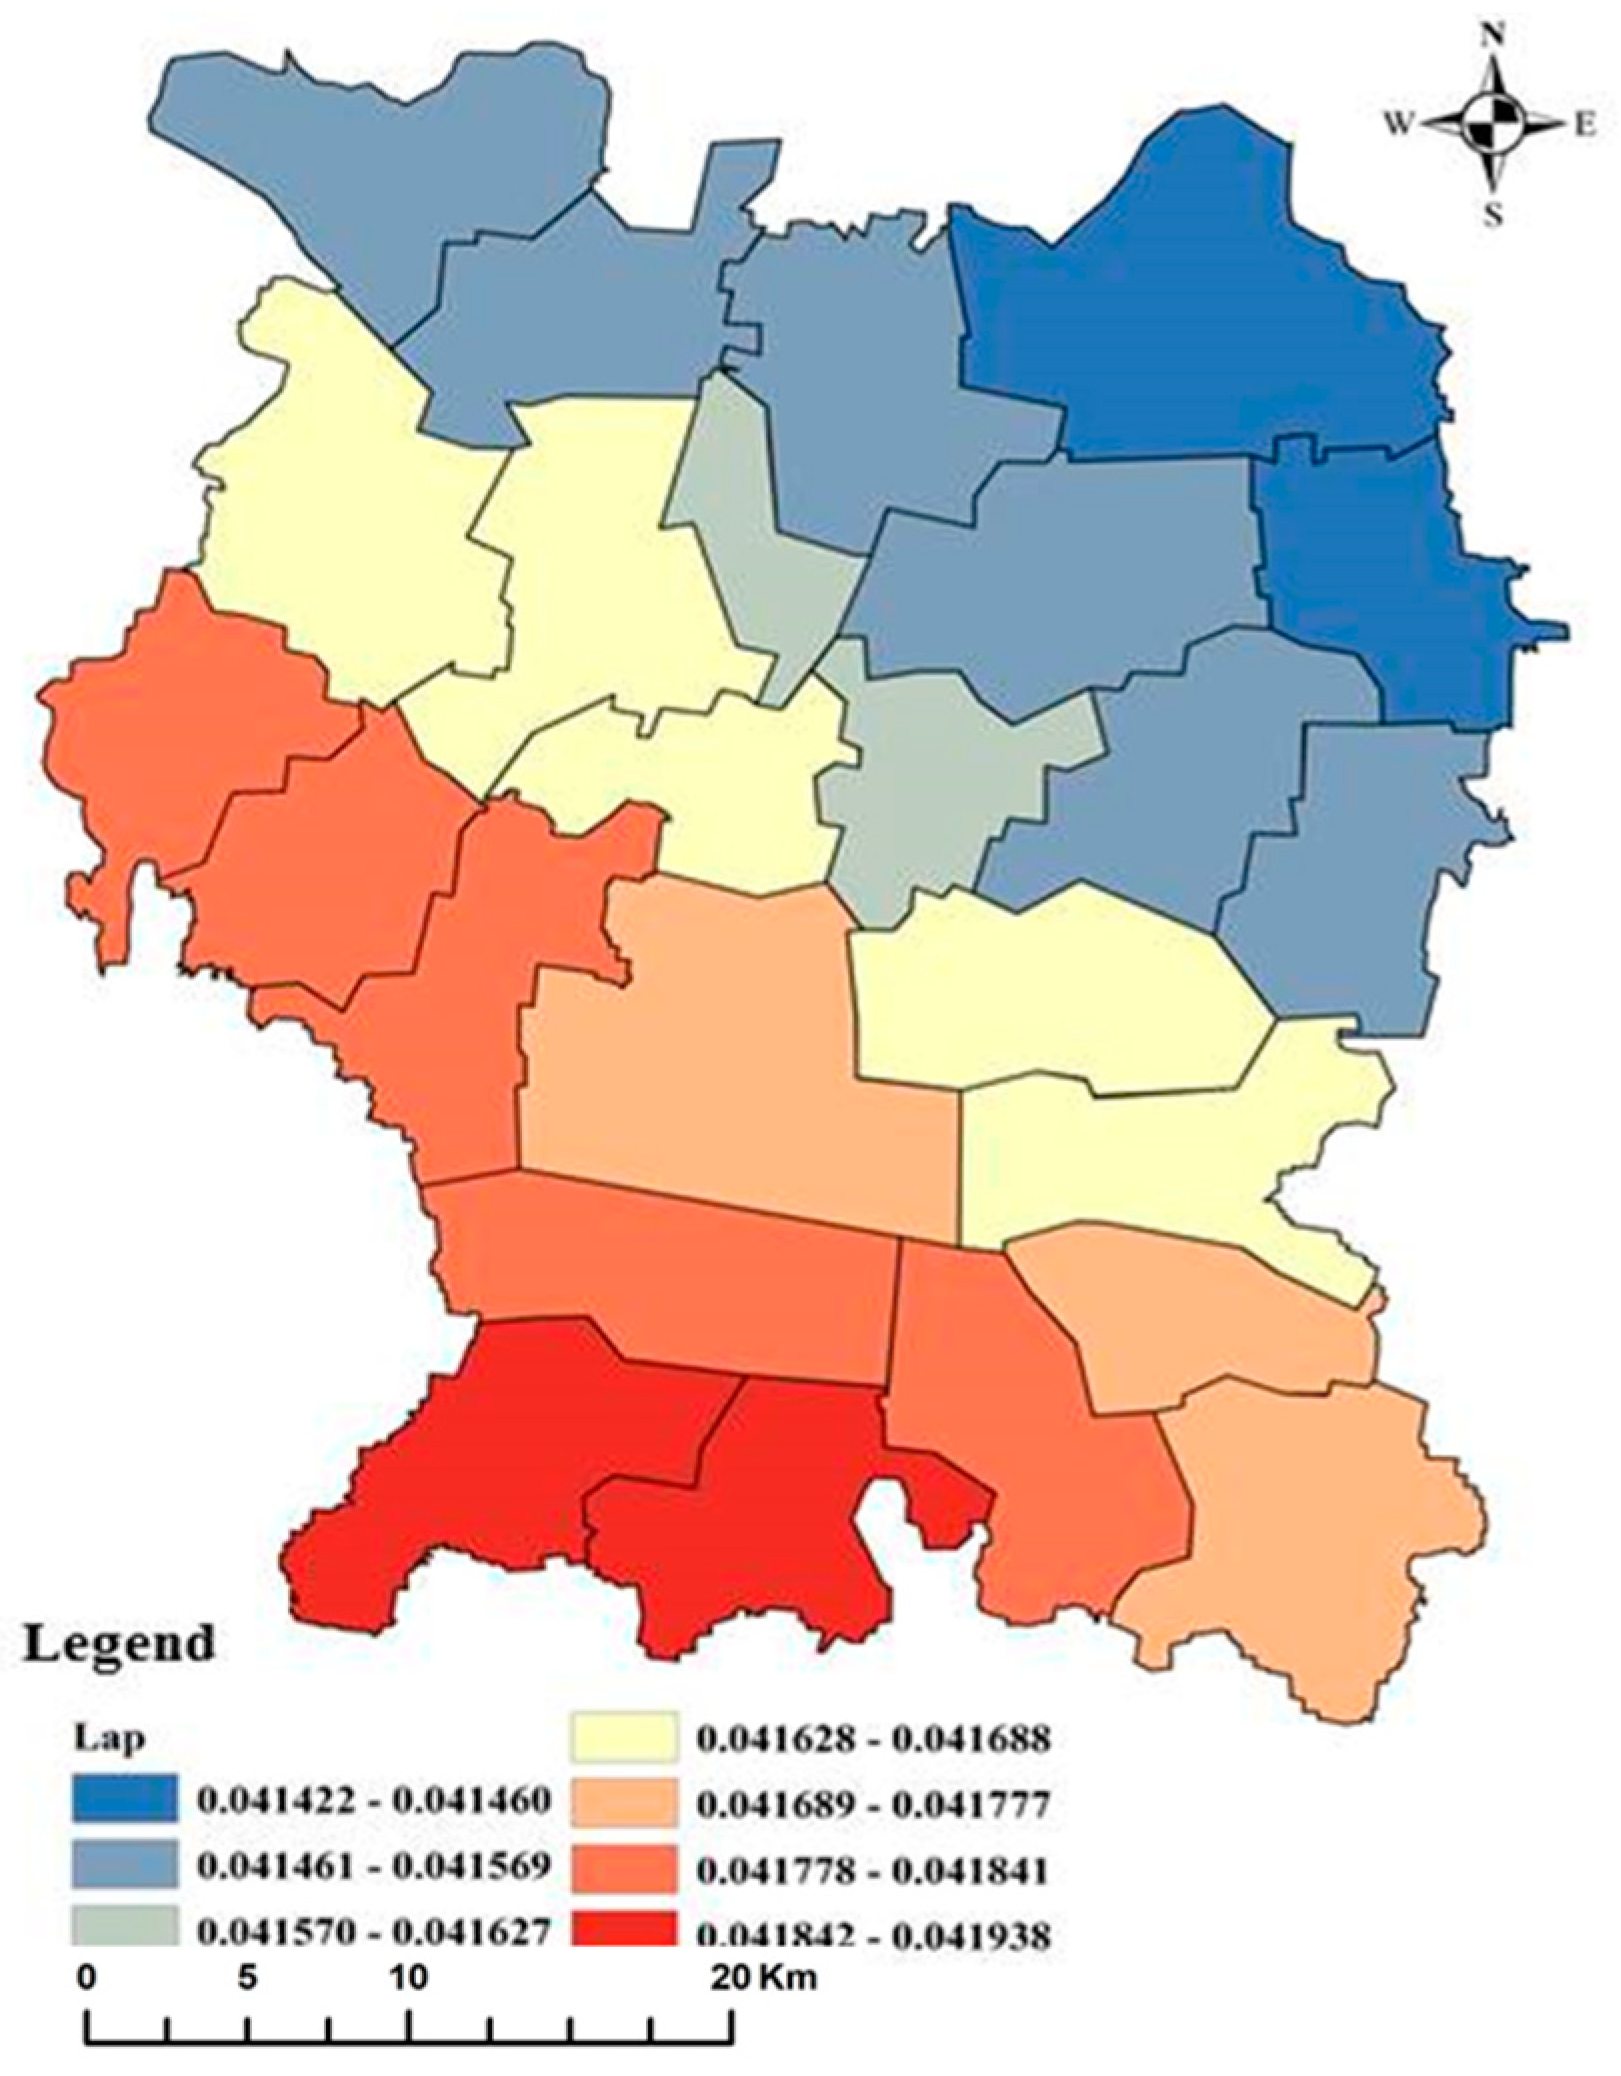
6.5. Spatial Driving Pattern by Natural Resource Conditions
7. Conclusions
Author Contributions
Funding
Acknowledgments
Conflicts of Interest
References
- Zhao, S.; Xiao, X. Analysis on the Land Price Factors in the Context of Macro-level Framework. China Land Sci. 2012, 26, 4–11. [Google Scholar]
- Li, C.; Gao, X.; He, B.-J.; Wu, J.; Wu, K. Coupling Coordination Relationships between Urban-industrial Land Use Efficiency and Accessibility of Highway Networks: Evidence from Beijing-Tianjin-Hebei Urban Agglomeration, China. Sustainability 2019, 11, 1446. [Google Scholar] [CrossRef]
- Demartini, E.; Gaviglio, A.; Gelati, M.; Cavicchioli, D. The effect of biogas production on farmland rental prices: Empirical evidences from Northern Italy. Energies 2016, 9, 965. [Google Scholar] [CrossRef]
- Ayazli, I.E. An Empirical Study Investigating the Relationship between Land Prices and Urban Geometry. ISPRS Int. J. Geo-Inf. 2019, 8, 457. [Google Scholar] [CrossRef]
- Cellmer, R.; Kobylińska, K.; Bełej, M. Application of Hierarchical Spatial Autoregressive Models to Develop Land Value Maps in Urbanized Areas. ISPRS Int. J. Geo-Inf. 2019, 8, 195. [Google Scholar] [CrossRef]
- Zhuang, X.; Zhao, S. Effects of land and building usage on population, land price and passengers in station areas: A case study in Fukuoka, Japan. Front. Archit. Res. 2014, 3, 199–212. [Google Scholar] [CrossRef]
- Burian, J.; Macků, K.; Zimmermannová, J.; Kočvarová, B. Spatio-Temporal Changes and Dependencies of Land Prices: A Case Study of the City of Olomouc. Sustainability 2018, 10, 4831. [Google Scholar] [CrossRef]
- Nakamura, H. Relationship among land price, entrepreneurship, the environment, economics, and social factors in the value assessment of Japanese cities. J. Clean. Prod. 2019, 217, 144–152. [Google Scholar] [CrossRef]
- Glumac, B.; Herrera-Gomez, M.; Licheron, J. A hedonic urban land price index. Land Use Policy 2019, 81, 802–812. [Google Scholar] [CrossRef]
- Shirota, T. What is the major source of business cycles: Spillovers from land prices, investment shocks, or anything else? J. Macroecon. 2018, 57, 138–149. [Google Scholar] [CrossRef]
- Li, S.; Zhao, Z.; Du, Q.; Qiao, Y. A GIS- and Fuzzy Set-Based Online Land Price Evaluation Approach Supported by Intelligence-Aided Decision-Making. ISPRS Int. J. Geo-Inf. 2016, 5, 126. [Google Scholar] [CrossRef]
- Ni, S.X.; Wang, L.X. A prelinary study on the approach to assessing integrated datum price of urban land. Geogr. Res. 1994, 13, 36–42. [Google Scholar]
- Wang, M.C. On spatial developing rule of urban land price and its driving factors. Trop. Geogr. 1997, 17, 347–353. [Google Scholar]
- Song, J.N.; Jin, X.B.; Tang, J.; Zhang, Z.; Zhao, J.; Zhou, Y. Analysis of influencing factors for urban land price and its changing trend in China in recent years. Acta Geogr. Sin. 2011, 66, 1045–1054. [Google Scholar]
- Gao, J.L.; Chen, J.L.; Yang, D.H. Spatial distribution of urban land prices in Nanjing. Prog. Geogr. 2013, 32, 361–371. [Google Scholar]
- Mou, Y.; He, Q.; Zhou, B. Detecting the Spatially Non-Stationary Relationships between Housing Price and Its Determinants in China: Guide for Housing Market Sustainability. Sustainability 2017, 9, 1826. [Google Scholar] [CrossRef]
- Li, C.; Meng, Y.; Li, Y.; Ge, J.; Zhao, C. Inter-Metropolitan Land-Price Characteristics and Patterns in the Beijing-Tianjin-Hebei Urban Agglomeration in China. Sustainability 2019, 11, 4726. [Google Scholar] [CrossRef]
- Yang, S.; Hu, S.; Li, W.; Zhang, C.; Torres, J.A. Spatiotemporal Effects of Main Impact Factors on Residential Land Price in Major Cities of China. Sustainability 2017, 9, 2050. [Google Scholar] [CrossRef]
- Huang, D.; Yang, X.; Liu, Z.; Zhao, X.; Kong, F. The Dynamic Impacts of Employment Subcenters on Residential Land Price in Transitional China: An Examination of the Beijing Metropolitan Area. Sustainability 2018, 10, 1016. [Google Scholar] [CrossRef]
- Ren, C.; Zhang, J.; Jia, S. An Empirical Study on the Effects of Land Price Signals on the Price of the Newly-built Residential Housing in a Region. China Land Sci. 2011, 25, 60–65. [Google Scholar]
- Ren, C.; Gu, J.; Zhang, J.; Jia, S. The spatial and temporal diffusion of housing price dynamics induced by land price signal. Geogr. Res. 2013, 32, 1121–1131. [Google Scholar]
- National People’s Congress. Amendment to the Constitution of the People’s Republic of China. 1988. Available online: http://www.npc.gov.cn/zgrdw/npc/zt/qt/gjxfz/2014-12/03/content_1888097.htm (accessed on 12 April 1988).
- State Council of the People’s Republic of China. Provisional Regulations on the Transfer and Transfer of the Right to Use of State Owned Land in People’s Republic of China. Available online: http://www.dhyj.gov.cn/gtj/Web/_F0_0_28D02IRFAF3D34QY7BL717POM9.htm (accessed on 19 May 1990).
- Ministry of Land and Resources. Provisions on the Transfer of the Right to the Use of State-Owned Land by Agreement. Available online: http://www.tdzyw.com/2012/0813/18783.html (accessed on 1 August 2003).
- Wang, H.; Wu, X.; Wu, D.; Nie, X. Will land development time restriction reduce land price? The perspective of American call options. Land Use Policy 2019, 83, 75–83. [Google Scholar] [CrossRef]
- Qu, S.; Hu, S.; Li, W.; Zhang, C.; Li, Q.; Wang, H. Temporal variation in the effects of impact factors on residential land prices. Appl. Geogr. 2020, 114, 102124. [Google Scholar] [CrossRef]
- Liu, Z.; Miao, J.; Zha, T. Land prices and unemployment. J. Monet. Econ. 2016, 80, 86–105. [Google Scholar] [CrossRef]
- Wu, Y.; Zhang, X.; Skitmore, M.; Song, Y.; Hui, E.C.M. Industrial land price and its impact on urban growth: A Chinese case study. Land Use Policy 2014, 36, 199–209. [Google Scholar] [CrossRef]
- Kim, K.S.; Park, S.J.; Kweon, Y. Highway traffic noise effects on land price in an urban area. Transp. Res. Part D Transp. Environ. 2007, 12, 275–280. [Google Scholar] [CrossRef]
- Wu, W.; Zhang, W. PLS path model building: A multivariate approach to land price studies—A case study in Beijing. Prog. Nat. Sci. 2009, 19, 1643–1649. [Google Scholar] [CrossRef]
- Zhong, S.; Wang, S.; Jiang, Y.; Yu, B.; Zhang, W. Distinguishing the land use effects of road pricing based on the urban form attributes. Transp. Res. Part A Policy Pract. 2015, 74, 44–58. [Google Scholar] [CrossRef]
- Zhuge, C.; Shao, C.; Gao, J.; Dong, C.; Zhang, H. Agent-based joint model of residential location choice and real estate price for land use and transport model. Comput. Environ. Urban Syst. 2016, 57, 93–105. [Google Scholar] [CrossRef]
- Komarek, A.M.; Shi, X.; Heerink, N. Household-level effects of China’s Sloping Land Conversion Program under price and policy shifts. Land Use Policy 2014, 40, 36–44. [Google Scholar] [CrossRef]
- Bigelow, D.P.; Plantinga, A.J. Town mouse and country mouse: Effects of urban growth controls on equilibrium sorting and land prices. Reg. Sci. Urban Econ. 2017, 65, 104–115. [Google Scholar] [CrossRef]
- Hu, S.; Yang, S.; Li, W.; Zhang, C.; Xu, F. Spatially non-stationary relationships between urban residential land price and impact factors in Wuhan city, China. Appl. Geogr. 2016, 68, 48–56. [Google Scholar] [CrossRef]
- Huang, Z.; Du, X. Holding the market under the stimulus plan: Local government financing vehicles’ land purchasing behavior in China. China Econ. Rev. 2018, 50, 85–100. [Google Scholar] [CrossRef]
- Xin, L.; Li, X. Rental rates of grain land for consolidated plots and their determinants in present-day China. Land Use Policy 2019, 86, 421–426. [Google Scholar] [CrossRef]
- Huang, J.; Shen, G.Q.; Zheng, H.W. Is insufficient land supply the root cause of housing shortage? Empirical evidence from Hong Kong. Habitat Int. 2015, 49, 538–546. [Google Scholar] [CrossRef]
- Jahanshahloo, L.; Salahshour, S. Fuzzy effects of urban landscapes on land prices. Procedia Comput. Sci. 2011, 3, 595–599. [Google Scholar] [CrossRef][Green Version]
- Gao, H. Public land leasing, public productive spending and economic growth in Chinese cities. Land Use Policy 2019, 88, 104076. [Google Scholar] [CrossRef]
- Wen, L.; Butsic, V.; Stapp, J.R.; Zhang, A. What happens to land price when a rural construction land market legally opens in China? A spatiotemporal analysis of Nanhai district from 2010 to 2015. China Econ. Rev. 2018. [Google Scholar] [CrossRef]
- Zhang, X.; Lin, Y.; Wu, Y.; Skitmore, M. Industrial land price between China’s Pearl River Delta and Southeast Asian regions: Competition or Coopetition? Land Use Policy 2017, 61, 575–586. [Google Scholar] [CrossRef]
- Du, J.; Peiser, R.B. Land supply, pricing and local governments’ land hoarding in China. Reg. Sci. Urban Econ. 2014, 48, 180–189. [Google Scholar] [CrossRef]
- Liang, W.; Lu, M.; Zhang, H. Housing prices raise wages: Estimating the unexpected effects of land supply regulation in China. J. Hous. Econ. 2016, 33, 70–81. [Google Scholar] [CrossRef]
- Shen, X.; Huang, X.; Li, H.; Li, Y.; Zhao, X. Exploring the relationship between urban land supply and housing stock: Evidence from 35 cities in China. Habitat Int. 2018, 77, 80–89. [Google Scholar] [CrossRef]
- Tan, Y.; Wang, Z.; Zhang, Q. Land-Use Regulation and the Intensive Margin of Housing Supply. J. Urban Econ. 2019, 103199. [Google Scholar] [CrossRef]
- Wang, R.; Hou, J.; He, X. Real estate price and heterogeneous investment behavior in China. Econ. Model. 2017, 60, 271–280. [Google Scholar] [CrossRef]
- Liu, M.; Dries, L.; Heijman, W.; Zhu, X.; Deng, X.; Huang, J. Land tenure reform and grassland degradation in Inner Mongolia, China. China Econ. Rev. 2019, 55, 181–198. [Google Scholar] [CrossRef]
- Du, H.; Ma, Y.; An, Y. The impact of land policy on the relation between housing and land prices: Evidence from China. Q. Rev. Econ. Financ. 2011, 51, 19–27. [Google Scholar] [CrossRef]
- Yuan, F.; Wei, Y.D.; Xiao, W. Land marketization, fiscal decentralization, and the dynamics of urban land prices in transitional China. Land Use Policy 2019, 89, 104208. [Google Scholar] [CrossRef]
- Wang, Y.; Potoglou, D.; Orford, S.; Gong, Y. Bus stop, property price and land value tax: A multilevel hedonic analysis with quantile calibration. Land Use Policy 2015, 42, 381–391. [Google Scholar] [CrossRef]
- Tang, L.; Ma, X.; Zhou, Y.; Shi, X.; Ma, J. Social relations, public interventions and land rent deviation: Evidence from Jiangsu Province in China. Land Use Policy 2019, 86, 406–420. [Google Scholar] [CrossRef]
- Li, C.; Xi, Z. Social Stability Risk Assessment of Land Expropriation: Lessons from the Chinese Case. Int. J. Environ. Res. Public Health 2019, 16, 3952. [Google Scholar] [CrossRef]
- Dingzhou Bureau of Statistics. Dingzhou Statistical Yearbooks 2016; China Statistical Press: Dingzhou, China, 2017.
- Li, C.; Wu, K. Driving forces of the villages hollowing based on geographically weighted regression model: A case study of Longde County, the Ningxia Hui Autonomous Region, China. Nat. Hazards 2017, 89, 1059. [Google Scholar] [CrossRef]
- Weatherhead, E.; Howden, N. The relationship between land use and surface water resources in the UK. Land Use Policy 2009, 26, 243–250. [Google Scholar] [CrossRef]
- Brown, S.; Versace, V.L.; Laurenson, L.; Ierodiaconou, D.; Fawcett, J.; Salzman, S. Assessment of spatiotemporal varying relationships between rainfall, land cover and surface water area using geographically weighted regression. Environ. Model. Assess. 2012, 17, 241–254. [Google Scholar] [CrossRef]
- Du, J.; Thill, J.; Peiser, R.B. Land pricing and its impact on land use efficiency in post-land-reform China: A case study of Beijing. Cities 2016, 50, 68–74. [Google Scholar] [CrossRef]
- Tsutsumi, M.; Seya, H. Measuring the impact of large-scale transportation projects on land price using spatial statistical models. Pap. Reg. Sci. 2008, 87, 385–401. [Google Scholar] [CrossRef]
- Chao, L.; Zhang, K.; Li, Z.; Zhu, Y.; Wang, J.; Yu, Z. Geographically weighted regression based methods for merging satellite and gauge precipitation. J. Hydrol. 2018, 558, 275–289. [Google Scholar] [CrossRef]
- Silva, A.R.; Lima, A.O. Geographically Weighted Beta Regression. Spat. Stat. 2017, 21, 279–303. [Google Scholar] [CrossRef]
- Soler, I.P.; Gemar, G. Hedonic price models with geographically weighted regression: An application to hospitality. J. Destin. Mark. Manag. 2018, 9, 126–137. [Google Scholar] [CrossRef]
- Fotheringham, A.S.; Brunsdon, C.; Charlton, M. Geographically Weighted Regression: The Analysis of Spatially Varying Relationships; Wiley: Chichester, UK, 2002; Volume 13. [Google Scholar]
- Fotheringham, A.S.; Charlton, M.E.; Brunsdon, C. Spatial variations in school performance: A local analysis using geographically weighted regression. Geogr. Environ. Model. 2012, 5, 43–66. [Google Scholar] [CrossRef]
- Shao, Y.; Li, M.; Chen, Z.; Yang, K.; Cai, D. Simulation on Regional Spatial Land Use Patterns Using Geographically Weighted Regression: A Case Study of Menghe Town, Changzhou. Sci. Geogr. Sin. 2010, 30, 92–97. [Google Scholar]
- Wang, X.; Kong, Y. Local Linear Geographically Weighted Regression Analysis on the Urban Housing Price: A Case Study of Huangshi City, Hubei Province. China Land Sci. 2015, 29, 82–89. [Google Scholar]
- Sultana, S.; Pourebrahim, N.; Kim, H. Household Energy Expenditures in North Carolina: A Geographically Weighted Regression Approach. Sustainability 2018, 10, 1511. [Google Scholar] [CrossRef]
- Lewandowska-Gwarda, K. Geographically Weighted Regression in the Analysis of Unemployment in Poland. ISPRS Int. J. Geo-Inf. 2018, 7, 17. [Google Scholar] [CrossRef]
- Wang, J.; Wang, S.; Li, S. Examining the spatially varying effects of factors on PM2.5 concentrations in Chinese cities using geographically weighted regression modeling. Environ. Pollut. 2019, 248, 92–803. [Google Scholar] [CrossRef] [PubMed]
- Zhou, Q.; Wang, C.; Fang, S. Application of geographically weighted regression (GWR) in the analysis of the cause of haze pollution in China. Atmos. Pollut. Res. 2019, 10, 835–846. [Google Scholar] [CrossRef]
- Wang, Y.; Li, X.; Kang, Y.; Chen, W.; Zhao, M.; Li, W. Analyzing the impact of urbanization quality on CO2 emissions: What can geographically weighted regression tell us? Renew. Sustain. Energy Rev. 2019, 104, 127–136. [Google Scholar] [CrossRef]
- Chun, H.; Chi, S.; Hwang, B.G. A Spatial Disaster Assessment Model of Social Resilience Based on Geographically Weighted Regression. Sustainability 2017, 9, 2222. [Google Scholar] [CrossRef]
- Yan, S.; Ge, X.J.; Wu, Q. Government intervention in land market and its impacts on land supply and new housing supply: Evidence from major Chinese markets. Habitat Int. 2014, 44, 517–527. [Google Scholar] [CrossRef]
- Patricia, A.; Inma, A. Farmland prices and land-use changes in periurban protected natural areas. Land Use Policy 2012, 29, 674–683. [Google Scholar]
- Peng, S.; Wang, Y.; Chen, C.; Wei, H.; Wang, J.; Wu, X. Analysis of the economic rationality of local government’s downtick of the industrial land: Evidence from the municipalities in Guangdong Province. J. Nat. Resour. 2015, 30, 1078–1091. [Google Scholar]
- Blachowski, J. Application of GIS spatial regression methods in assessment of land subsidence in complicated mining conditions: Case study of the Walbrzych coal mine (SW Poland). Nat. Hazards 2016, 84, 997. [Google Scholar] [CrossRef]
- Wang, A.; Miao, B.; Chen, S. Spatial differentiation and impact factors of industrial land-use in Guangzhou. Trop. Geogr. 2007, 27, 132–138. [Google Scholar]
- Nasr, K.; Boris, A.P. Economic, demographic and environmental factors affecting urban land prices in the Arab sector in Israel. Land Use Policy 2016, 50, 518–527. [Google Scholar]
- Yang, J.; Yang, Q. Growth pressures, stimulus plan and industrial land transfer. Econ. Res. 2016, 51, 99–113. [Google Scholar]
- Chen, W.; Shen, Y.; Wang, Y. Does industrial land price lead to industrial diffusion in China? An empirical study from a spatial perspective. Sustain. Cities Soc. 2018, 40, 307–316. [Google Scholar] [CrossRef]
- Chen, W.; Shen, Y.; Wang, Y.; Wu, Q. How do industrial land price variations affect industrial diffusion? Evidence from a spatial analysis of China. Land Use Policy 2018, 71, 384–394. [Google Scholar] [CrossRef]
- Chen, W.; Chen, W.; Ning, S.; Liu, E.-n.; Zhou, X.; Wang, Y.; Zhao, M. Exploring the industrial land use efficiency of China’s resource-based cities. Cities 2019, 93, 215–223. [Google Scholar] [CrossRef]
- Gao, J.; Chen, J.; Su, X. Influencing factors of land price in Nanjing Proper during 2001–2010. Prog. Geogr. 2014, 33, 211–221. [Google Scholar]
- Chen, W.; Shen, Y.; Wang, Y.; Wu, Q. The effect of industrial relocation on industrial land use efficiency in China: A spatial econometrics approach. J. Clean. Prod. 2018, 205, 525–535. [Google Scholar] [CrossRef]
- Huang, J.; Chen, L.; Zhang, Y.; Zhao, A. Research on the relationship between local government economic behavior and industrial land price under different industrial structure. Ind. Econ. Res. 2017, 3, 81–90. [Google Scholar]
- Kuang, W. Expectation, Speculation and Urban Housing Price Volatility in China. Econ. Res. J. 2010, 45, 67–78. [Google Scholar]
- Schaffartzik, A.; Haberl, H.; Kastner, T.; Wiedenhofer, D.; Eisenmenger, N.; Erb, K.H. Trading land: A review of approaches to accounting for upstream land requirements of traded products. J. Ind. Ecol. 2015, 19, 703–714. [Google Scholar] [CrossRef] [PubMed]
- Bertoni, D.; Aletti, G.; Ferrandi, G.; Micheletti, A.; Cavicchioli, D.; Pretolani, R. Farmland Use Transitions After the CAP Greening: A Preliminary Analysis Using Markov Chains Approach. Land Use Policy 2018, 79, 789–800. [Google Scholar] [CrossRef]
- Yang, J.; Guo, A.; Li, Y.; Zhang, Y.; Li, X. Simulation of landscape spatial layout evolution in rural-urban fringe areas: A case study of ganjingzi district. GISci. Remote Sens. 2018, 56, 388–405. [Google Scholar] [CrossRef]
- Chen, Y.; Zhou, S. Research on spatial-temporal variation of the price of land leased in the city of Nanjing. Soil 2003, 35, 216–221. [Google Scholar]


| Target | Element | Type | Variables | Symbol | Definition | Collinearity Statistics | |
|---|---|---|---|---|---|---|---|
| Tolerance | VIF | ||||||
| Industrial land transfer price | Demand | Economic conditions [14,15,16,17] | Economic growth rate | GDP | GDP growth rate of each town | 0.29 | 3.445 |
| Population size [18,19,20,27] | Population density | Pod | Total population/town’s area | 0.187 | 5.351 | ||
| Population growth rate | Pog | Annual growth rate of resident population of each town | 0.443 | 2.258 | |||
| Traffic location [29,31,32] | Distance to downtown | Dic | Distance from a town to city seat | 0.236 | 4.246 | ||
| Public facilities [38,40,52] | Number of hospitals per unit area | Hon | Number of hospitals/town’s area | 0.178 | 5.606 | ||
| Road density | Rod | Length of road/town’s area | 0.000 | / | |||
| Number of schools per unit area | Scn | Number of schools/town’s area | 0.098 | 10.216 | |||
| Supply | Natural resources [15,38] | Proportion of cultivated land | Lap | Rural settlements’ area/cultivated land’s area of the town | 0.204 | 4.904 | |
| Variable | Coefficient | p-Value | Significance (Sig.) |
|---|---|---|---|
| Con | 0.000 | 0 | *** |
| GDP | 0.128 | 0.027 | ** |
| Pod | 0.073 | 0.612 | - |
| Pog | 0.278 | 0.002 | *** |
| Dic | −0.062 | 0.004 | *** |
| Hon | 0.009 | 0.095 | * |
| Lap | −0.042 | 0.072 | * |
| Method | R2 | AICc | p-Value | Residual |
|---|---|---|---|---|
| OLS | 0.641 | 46.499 | <0.001 | 4.13 |
| GWR | 0.896 | −229.362 | <0.001 | 1.45 |
| Variable | Minimum | Lower Quartile | Median | Upper Quartile | Maximum |
|---|---|---|---|---|---|
| Con | −0.33172 | −0.14121 | 0.06055 | 0.10399 | 0.22170 |
| GDP | 0.12796 | 0.12805 | 0.12819 | 0.12825 | 0.12853 |
| Pod | −0.07349 | −0.07346 | −0.07342 | −0.07339 | −0.07330 |
| Pog | −0.27862 | −0.27855 | −0.27844 | −0.27835 | −0.27804 |
| Dic | −0.06175 | −0.06175 | −0.06168 | −0.06167 | −0.06159 |
| Hon | −0.00902 | −0.00901 | −0.00895 | −0.00894 | −0.00886 |
| Lap | 0.04142 | 0.04146 | 0.04162 | 0.04169 | 0.04193 |
© 2020 by the authors. Licensee MDPI, Basel, Switzerland. This article is an open access article distributed under the terms and conditions of the Creative Commons Attribution (CC BY) license (http://creativecommons.org/licenses/by/4.0/).
Share and Cite
Yang, Z.; Li, C.; Fang, Y. Driving Factors of the Industrial Land Transfer Price Based on a Geographically Weighted Regression Model: Evidence from a Rural Land System Reform Pilot in China. Land 2020, 9, 7. https://doi.org/10.3390/land9010007
Yang Z, Li C, Fang Y. Driving Factors of the Industrial Land Transfer Price Based on a Geographically Weighted Regression Model: Evidence from a Rural Land System Reform Pilot in China. Land. 2020; 9(1):7. https://doi.org/10.3390/land9010007
Chicago/Turabian StyleYang, Zhiheng, Chenxi Li, and Yongheng Fang. 2020. "Driving Factors of the Industrial Land Transfer Price Based on a Geographically Weighted Regression Model: Evidence from a Rural Land System Reform Pilot in China" Land 9, no. 1: 7. https://doi.org/10.3390/land9010007
APA StyleYang, Z., Li, C., & Fang, Y. (2020). Driving Factors of the Industrial Land Transfer Price Based on a Geographically Weighted Regression Model: Evidence from a Rural Land System Reform Pilot in China. Land, 9(1), 7. https://doi.org/10.3390/land9010007