Article

Short Term Effects of Revegetation on Labile Carbon and Available Nutrients of Sodic Soils in Northeast China

1
Chongqing Jinfo Mountain Field Scientific Observation and Research Station for Karst Ecosystem, School of Geographical Sciences, Southwest University, Chongqing 400715, China
2
Northeast Institute of Geography and Agroecology, Chinese Academy of Sciences, Changchun 130102, China
3
State Cultivation Base of Eco-agriculture for Southwest Mountainous Land, Southwest University, Chongqing 400715, China
4
College of Mobile Telecommunications, Chongqing University of Posts and Telecom, Chongqing 401520, China
*
Author to whom correspondence should be addressed.
Submission received: 26 November 2019 / Revised: 29 December 2019 / Accepted: 30 December 2019 / Published: 2 January 2020

Abstract

:
In response to land degradation and the decline of farmers’ income, some low quality croplands were converted to forage or grassland in Northeast China. However, it is unclear how such land use conversions influence soil nutrients. The primary objective of this study was to investigate the influences of short term conversion of cropland to alfalfa forage, monoculture Leymus chinensis grassland, monoculture Leymus chinensis grassland for hay, and successional regrowth grassland on the labile carbon and available nutrients of saline sodic soils in northeastern China. Soil labile oxidizable carbon and three soil available nutrients (available nitrogen, available phosphorus, and available potassium) were determined at the 0–50 cm depth in the five land uses. Results showed that the treatments of alfalfa forage, monoculture grassland, monoculture grassland for hay, and successional regrowth grassland increased the soil labile oxidizable carbon contents (by 32%, 28%, 15%, and 32%, respectively) and decreased the available nitrogen contents (by 15%, 19%, 34%, and 27%, respectively) in the 0–50 cm depth compared with cropland, while the differences in the contents of available phosphorus and available potassium were less pronounced. No significant differences in stratification ratios of soil labile carbon and available nutrients, the geometric means of soil labile carbon and available nutrients, and the sum scores of soil labile carbon and available nutrients were observed among the five land use treatments except the stratification ratio of 0–10/20–30 cm for available phosphorus and the values of the sum scores of soil labile carbon and available nutrients in the 0–10 cm depth. These findings suggest that short term conversions of cropland to revegetation have limited influences on the soil labile carbon and available nutrients of sodic soils in northeastern China.

1. Introduction

The structure, diversity, and production capacity of terrestrial ecosystems are strongly linked to the availability of soil nutrients, such as nitrogen, phosphorus, potassium, and soil organic carbon [1,2]. However, the soil labile carbon and soil nutrients’ availability in terrestrial ecosystems are usually influenced by various direct and indirect soil disturbances [3,4]. Land use conversions are major drivers of changes in soil labile carbon and soil nutrient availability, resulting in the degradation of soil ecosystem services (nutrient cycle, water conservation, pollution purification, etc.) and global environmental problems (soil degradation, climate change, water, soil erosion, etc.) [5,6]. One main mechanism by which they do this is by changing the quantity and quality of plant biomass supplied to the soils, affecting the rate of organic matter decomposition and the activity of soil microorganism and redistributing soil carbon and nutrients within soil profiles [7,8,9]. Another main mechanism is the impact of soil erosion, which preferentially removes the surficial and most carbon and nutrient rich material, thus accelerating the decline of the soil organic carbon and soil nutrient pool [10,11].
Characterizing the spatial and temporal variability of soil carbon and nutrients in relation to land use types is critical for predicting the influences of future land use conversion on soil quality changes and understanding how ecosystems’ function [12]. Changes of soil organic carbon (soil microbial biomass carbon, particulate organic carbon, water extractable organic carbon, etc.) and total nutrients (total nitrogen, total phosphorus, total potassium, etc.) under different land uses in different spatial and temporal scales induced by long term land use conversions have been well addressed [13,14,15,16,17]. However, the evaluation of the short term effects of land uses on soil labile carbon and soil available nutrients are rare due to the high spatial variability and the errors in the measurement methods of these soil properties [18,19]. Moreover, due to regional differences in environment conditions, initial soil properties, and management years and intensity, inconsistent and contradictory responses of soil labile carbon and soil available nutrients to short term land use conversions were observed, which failed to demonstrate a clear relationship between short term land uses and changes in soil labile carbon and available nutrients [14,20]. For instance, Madejon et al. [14] in the southwest of Spain found that after three year plantation of fast growing trees decreased the contents of available nitrogen (AN), available phosphorus (AP), and available potassium (AK). Lu et al. [21] in Tibet, China, reported that short term (nine years) grazing exclusion had no impact on soil AN, AP, microbial biomass carbon, and other soil properties. However, the results of Wang et al. [20] in Shanxi Province, China, showed that three years of plantation of grass and alfalfa significantly increased the contents of soil organic carbon, AN, AP, and AK.
As one of the largest salt affected soil regions in China, Songnen plain has suffered from substantial land salinization and alkalization because of the influences of human activity in recent decades [22]. The increases in soil alkalinity and sodicity have adversely influenced the soil properties by promoting crusting and low permeability and infiltration rates [23], thus leading to the reduction of grain production. Furthermore, with an increase in corn production in China from 1.06 × 10⁸ tons in 2003 to 2.25 × 10⁸ tons in 2016 due to the increase of yield per unit and the planting area, oversupply resulted, causing a notable reduction in corn price and planting benefit to farmers [22]. Therefore, the croplands with poor quality soils were abandoned in the Songnen plain. To address these problems in the Songnen plain, the Chinese government implemented a range of policies and subsidies to guide farmers to improve the efficiency and sustainable development of agriculture through revegetation in the areas where the soils were not suitable for growing crops. Revegetation, the conversion of cropland to a vegetation covered land, has become a well explored approach to rehabilitate degraded soil ecosystems [15,24]. In addition to combatting erosion and protect soils, revegetation has substantial effects on the accumulation of soil organic carbon and nutrients and the improvement of soil microbial biomass and activity [13,15]. Deng et al. [15] in the Loess Plateau, China, found that the contents of soil organic carbon, total N, and total P at a depth of 0–20 cm increased by more than 13%, 10% and 11%, respectively, after 30 years of grassland restoration. Our previous study in the same site showed that soil microbial biomass carbon and enzyme activity at a depth of 0–20 cm increased by 36% and 56%, respectively, after five years of conversion of cropland to grassland [22]. However, the short term influences of revegetation on soil oxidizable carbon and available nutrients have yet to be quantified in northeastern China.
In this study, we hypothesized that five years of revegetation from cropland could increase the contents of soil available nutrients and soil labile carbon and therefore be beneficial to the sustainable use of saline sodic soils in northeastern China. To address this hypothesis, the objective of this research was to investigate the changes in the contents of labile oxidizable carbon (LOC), AN, AP, and AK after conversion from cropland to alfalfa forage, monoculture Leymus chinensis grassland, monoculture Leymus chinensis grassland for hay, and successional regrowth grassland and examine whether short term revegetation could improve the LOC and soil available nutrients in the regions where the soils were not suitable for planting crops in northeastern China.

2. Materials and Methods
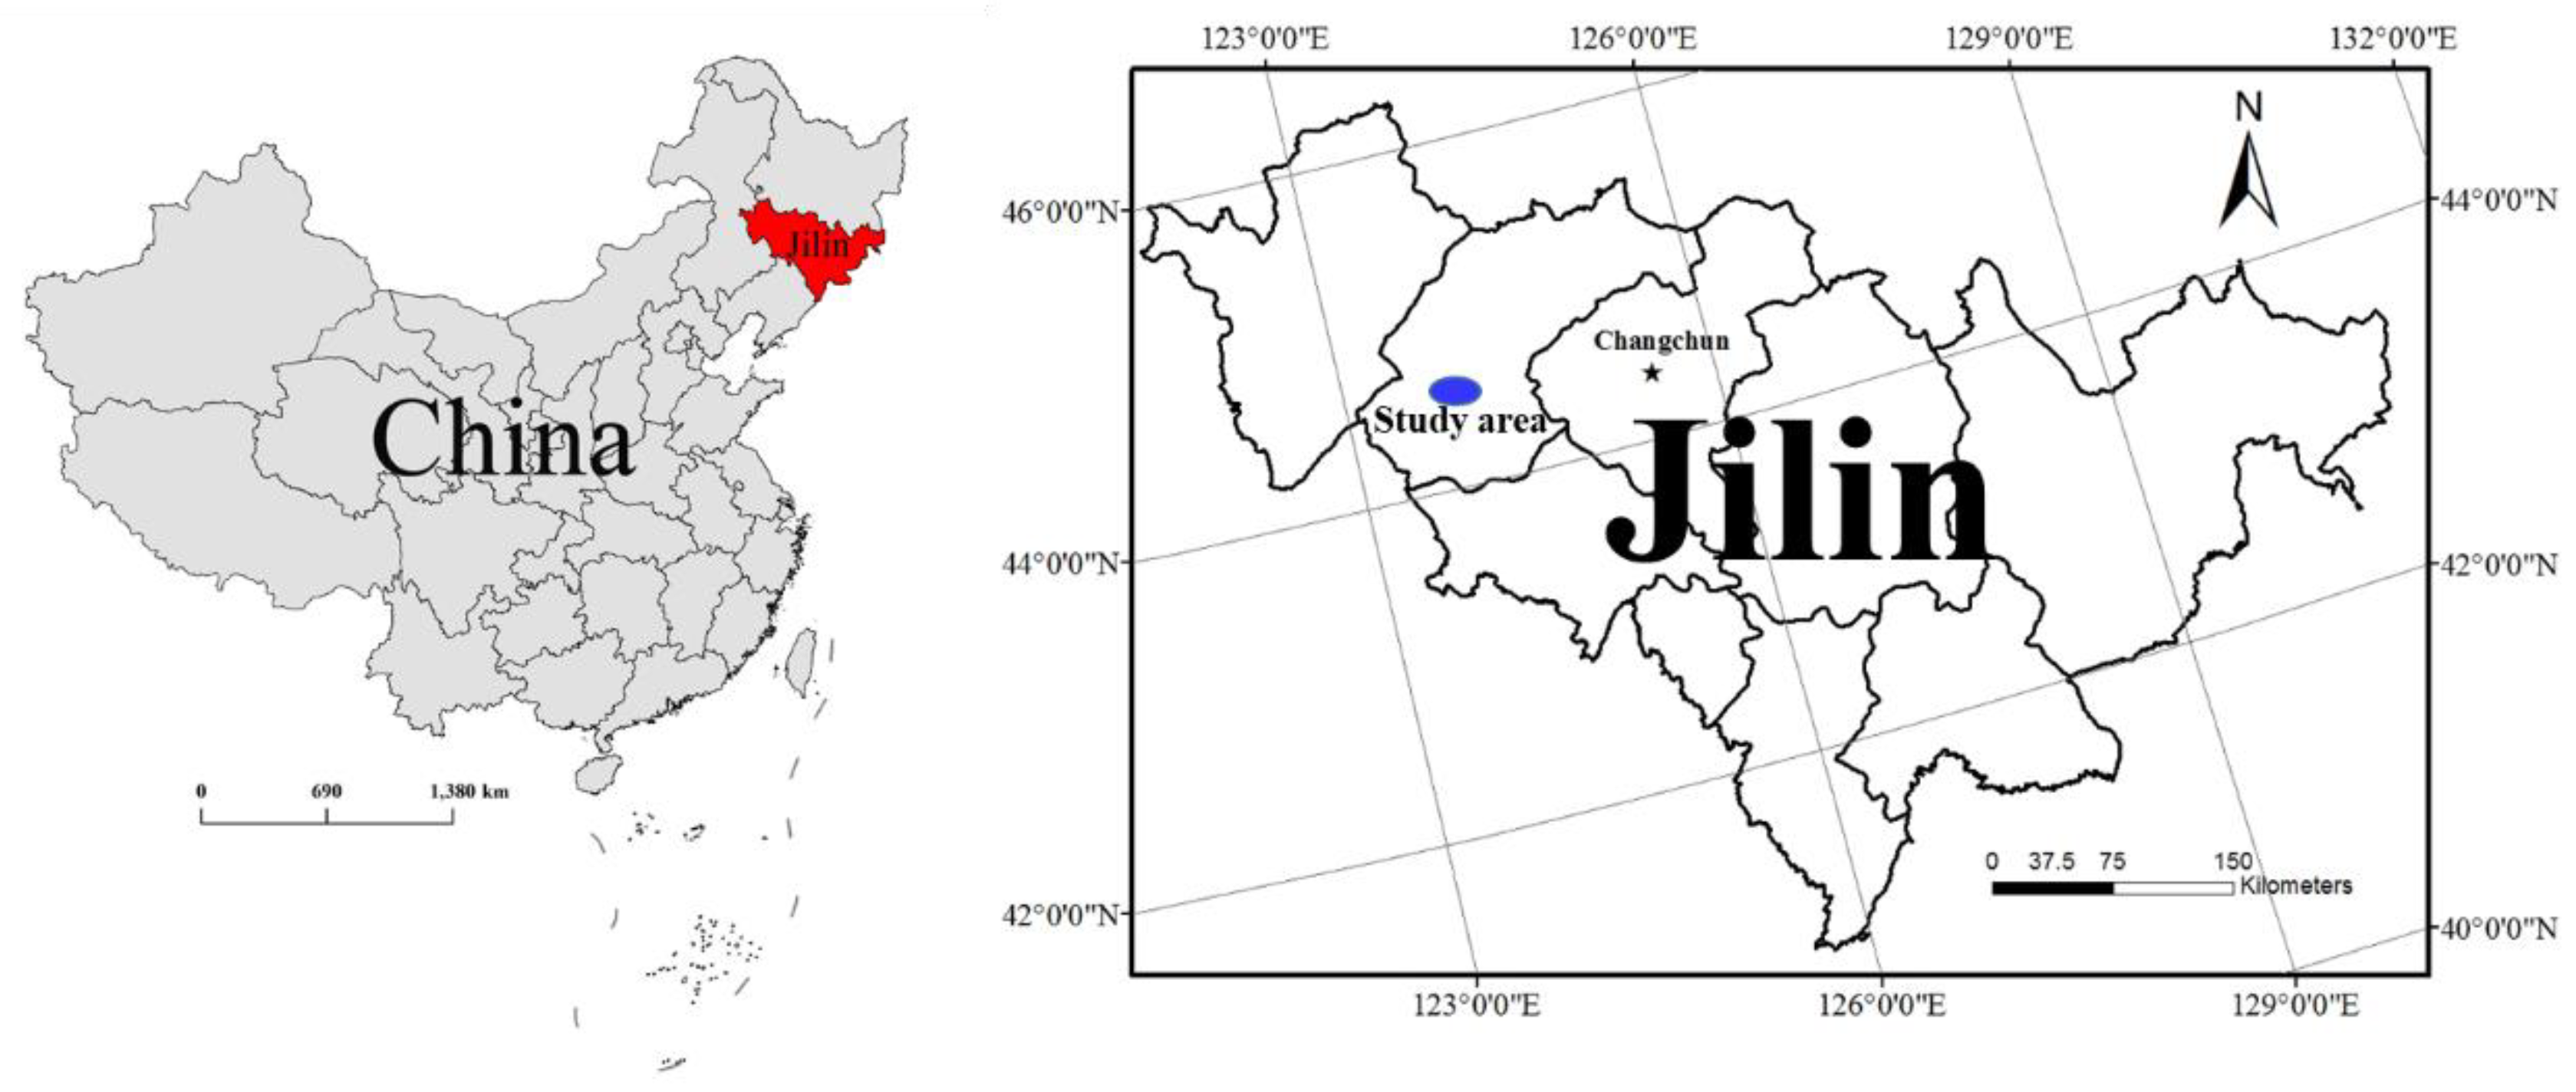
2.1. Study Area

The research was conducted in the Songnen plain located at the Grassland Farming and Ecological Research Station (123°31′ E, 44°33′ N) (Figure 1). The terrain surrounding the study area is relatively flat, and the altitude is approximately 145 m above sea level. The study area has a temperate, semiarid continental climate. The average annual temperature is 5.9 °C, and the mean annual precipitation is 427 mm (1980–2013). The soil is classified as Solonetz in the World Reference Base for Soil Resources with a soil texture of 22% sand, 33% silt, and 45% clay [25]. The main vegetation consists of perennial herbs such as Leymus chinensis and Puccinellia tenuiflora. Besides, some therophytes such as Chloris virgata and Suaeda heteroptera grow in the areas with higher soil pH and poor soil quality [26].

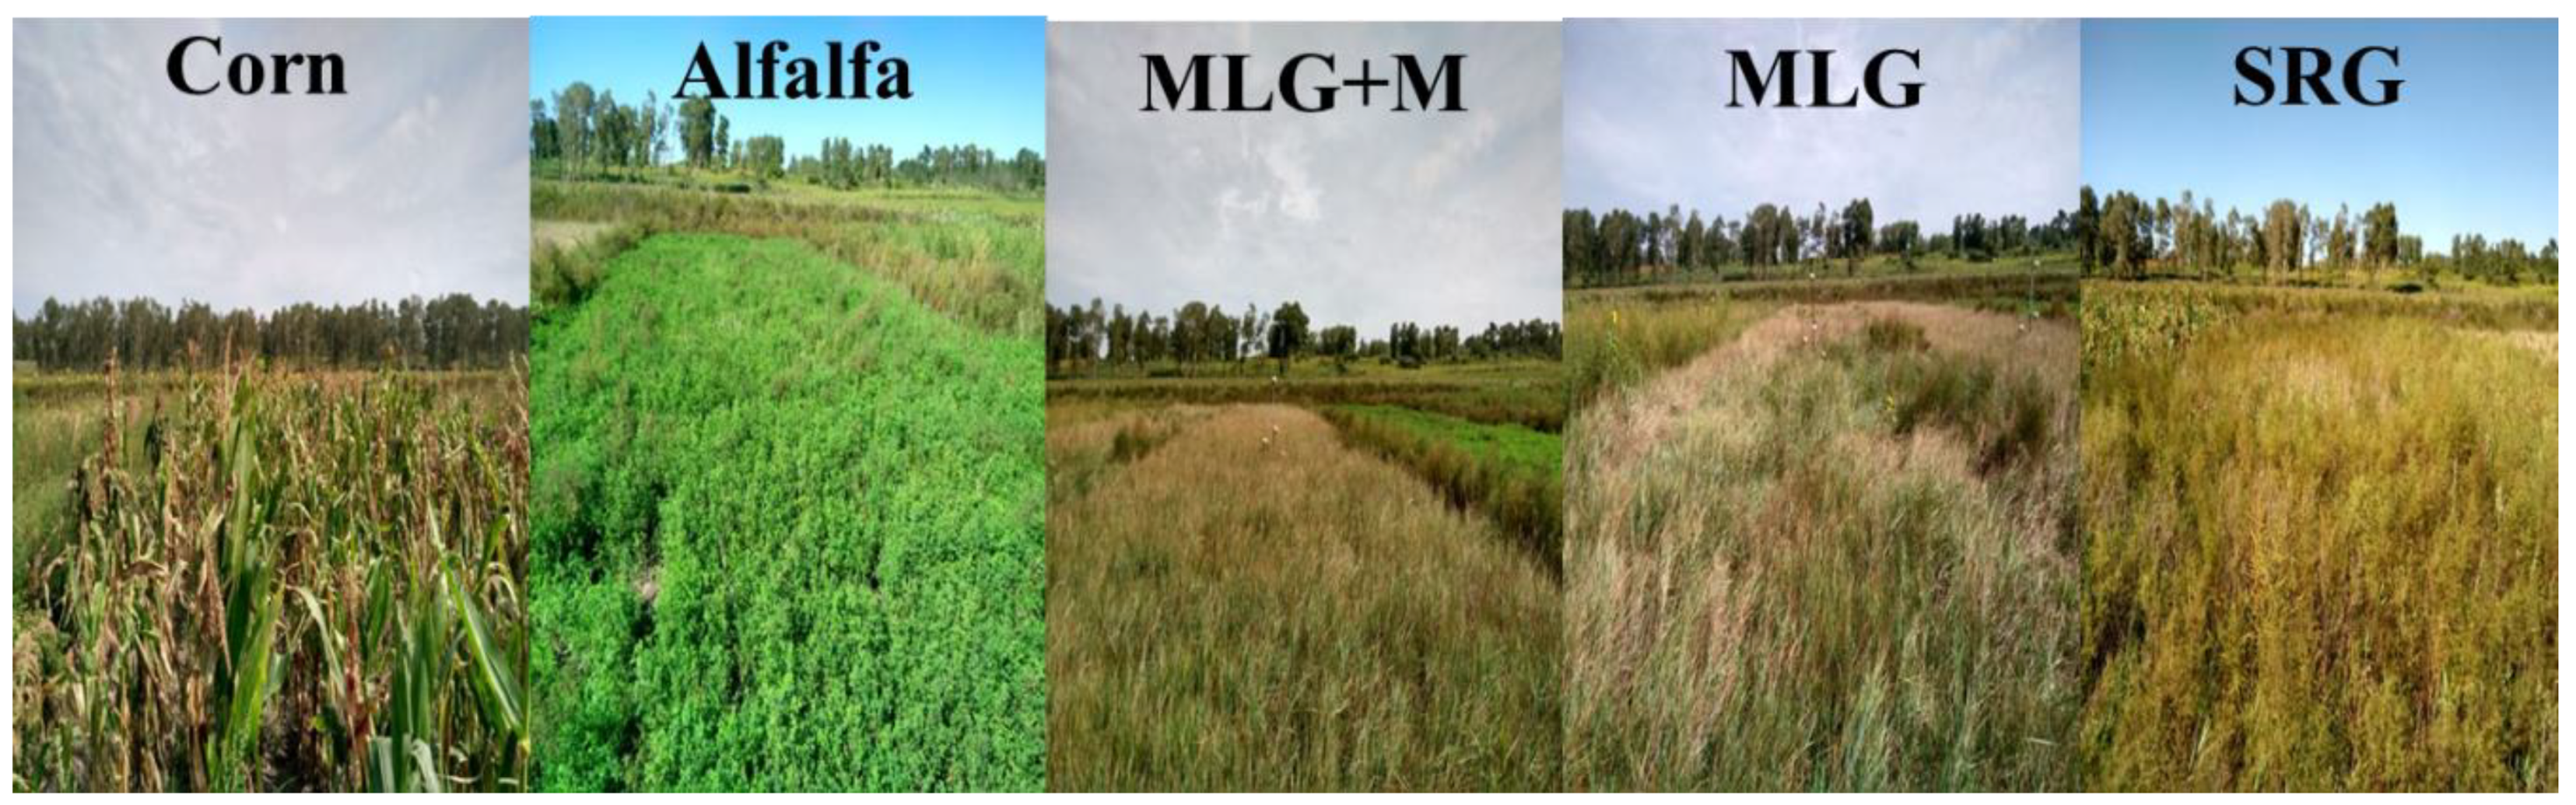
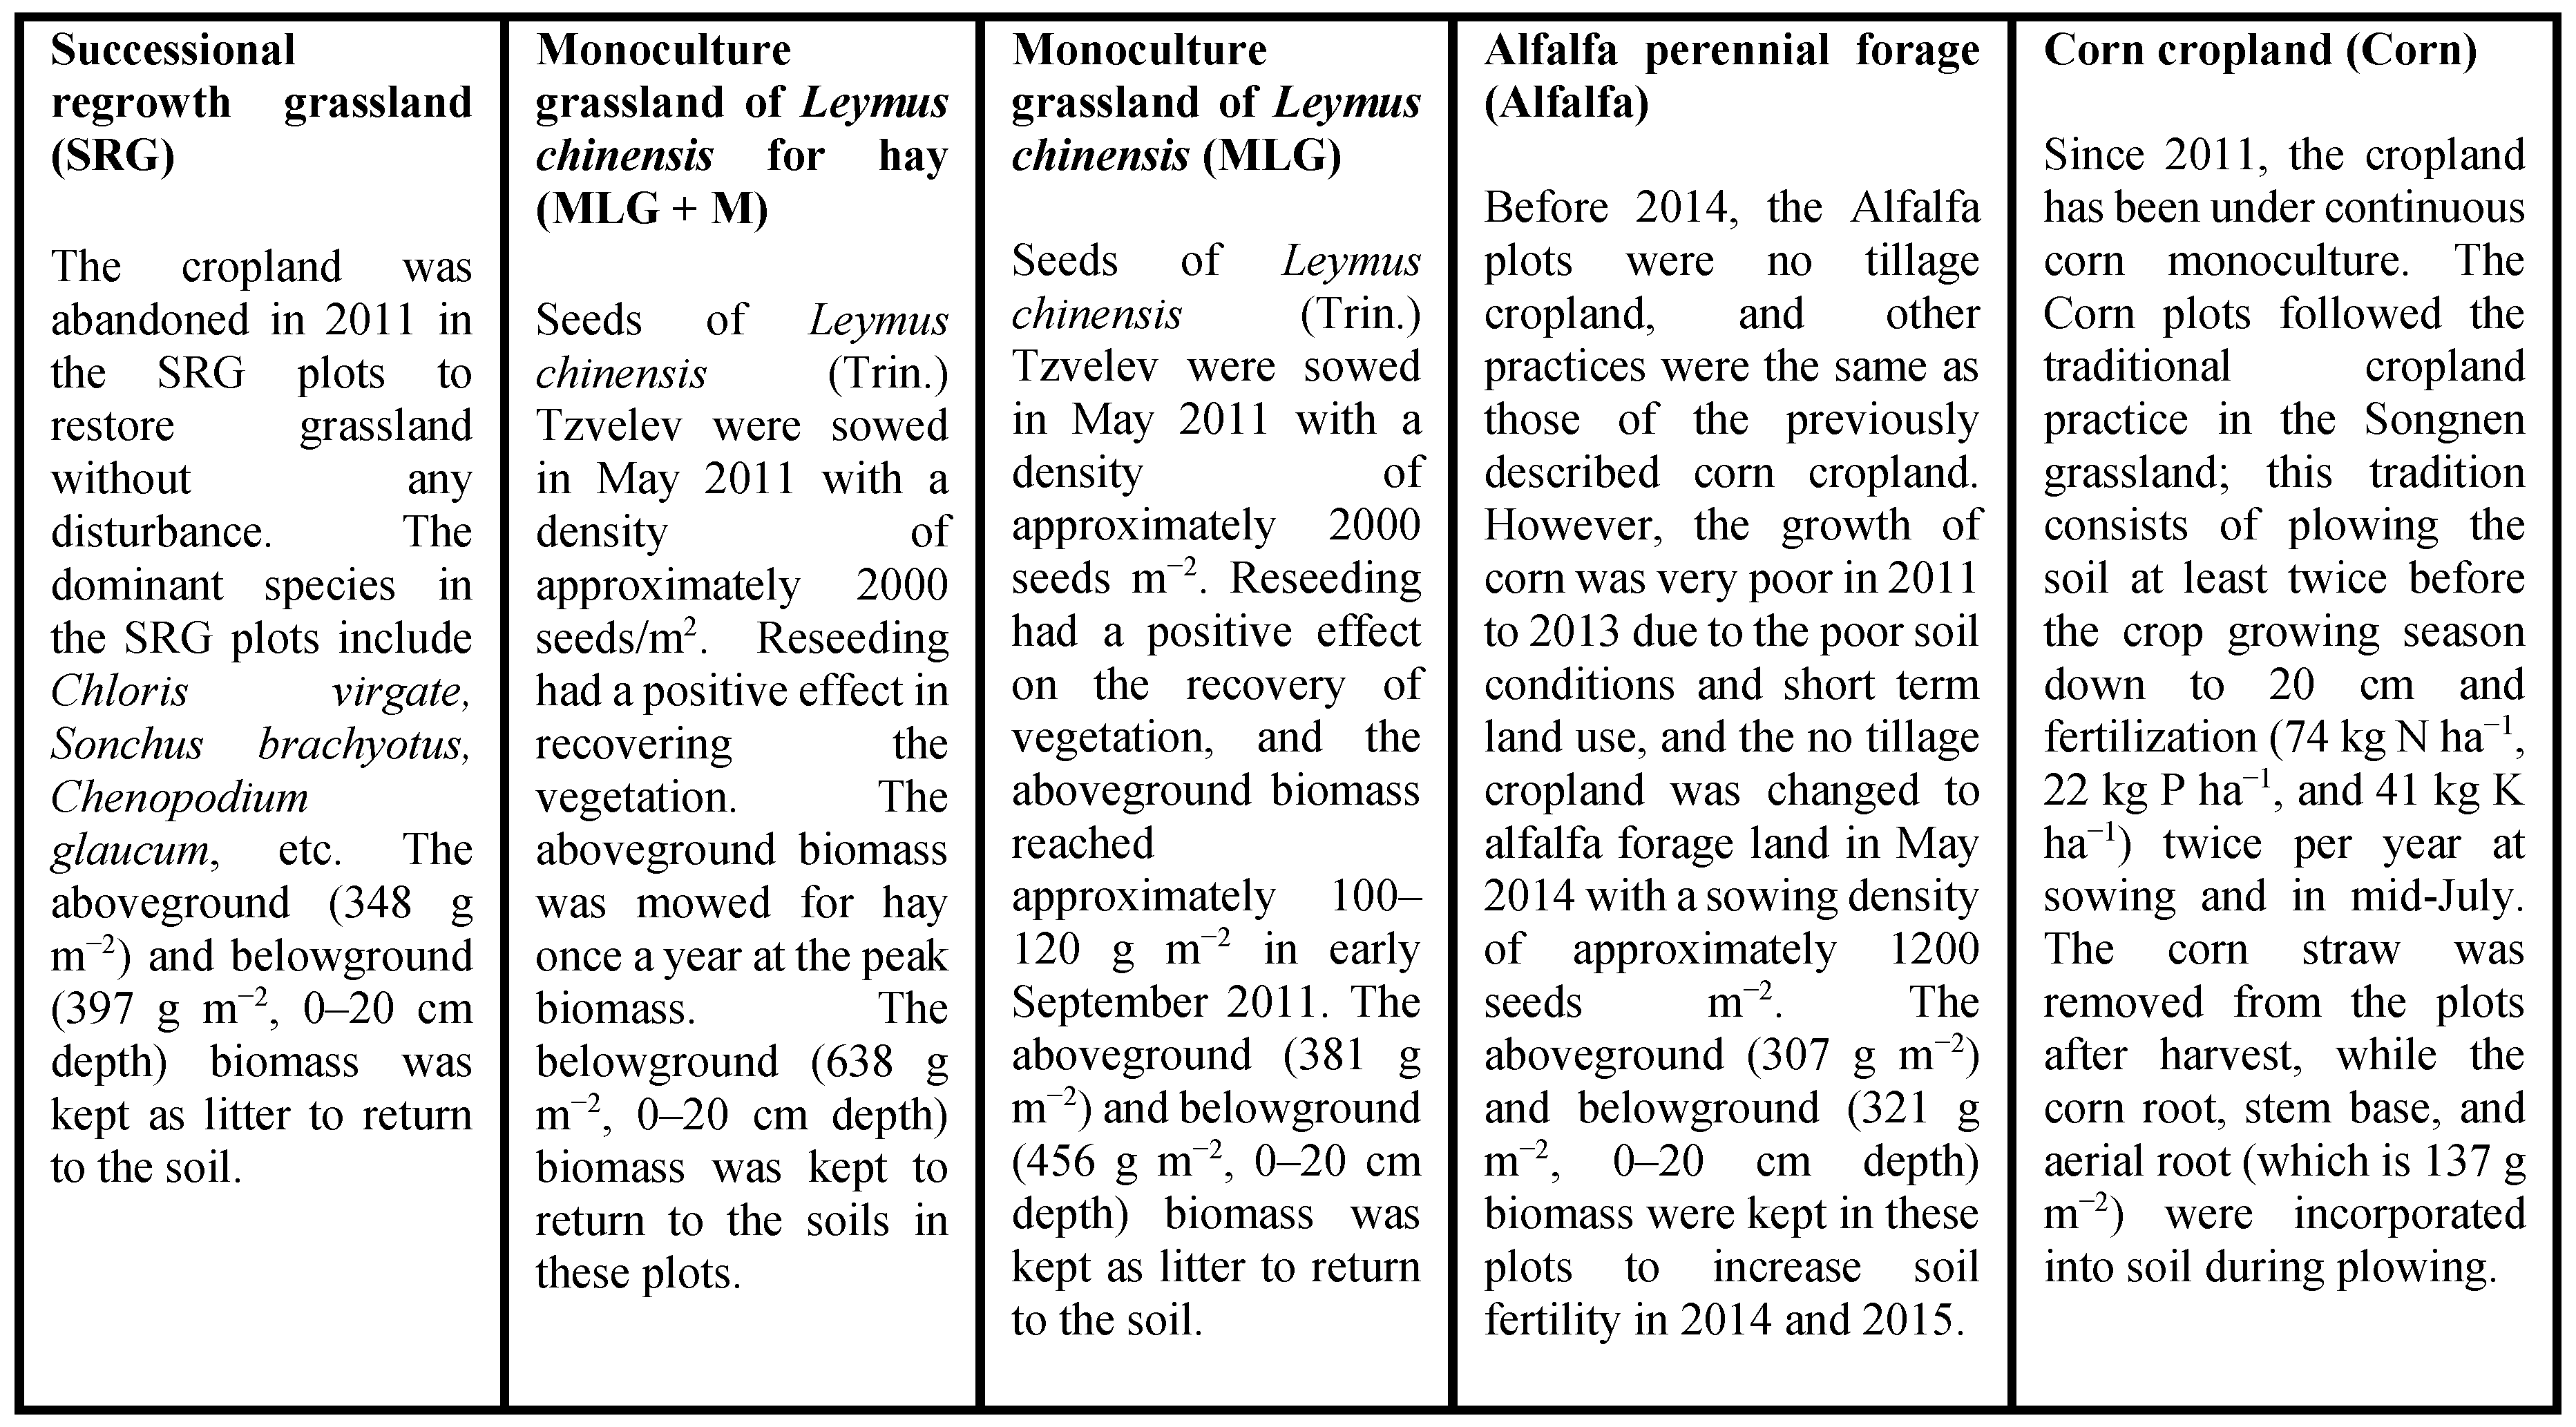
2.2. Experimental Design

This experiment was organized as a completed block design with five land use treatments. In early May 2011, four adjacent blocks (each 60 × 50 m, 2 m buffer between the blocks) in the study area based on similar land use history were identified. Before this experiment (2004–2010), farmers grew rain fed maize (Zea mays L.) and sunflower (Helianthus annuus) in these blocks, following the traditional planting practices in Northeast China, which consists of plowing the soil down to 20 cm depth and applying 50–96 kg N ha−1, 20–45 kg P ha−1, and 15–45 kg K ha−1 fertilizers into the soils. The soil properties in these four blocks were homogeneous due to the continuous plowing. The five land use treatments consisted of corn cropland (corn, used as an indication of how the revegetation influences the soils in this study), alfalfa perennial forage land (alfalfa), monoculture grassland of Leymus chinensis (MLG), monoculture grassland of Leymus chinensis for hay (Mowing) once a year (MLG + M), and successional regrowth grassland (SRG) (Figure 2). Leymus chinensis is the native vegetation and is usually used as forage grass for grazing animals in the Songnen grassland. In the mowing grassland, Leymus chinensis is harvested as hay, and farmers sell the hay to livestock farms. Alfalfa has high saline and alkaline tolerance, and it has been introduced into the Songnen grassland as a high forage plant due to the high N and protein content [22]. The planting of forage grass used in this study could improve the income of local farmers and the development of animal husbandry. In each block, two greater plots of 12 × 50 m were for corn and alfalfa treatments, while three plots of 6 × 50 m for land use treatments of MLG, MLG + M, and SRG. There was a 1 m buffer among the five plots. The was no irrigation under the five land uses in this study. More information about the treatments of land uses is presented in Figure 3 [22,26].

2.3. Soil Sampling and Analysis

Soil sampling was performed using an auger (4 cm in diameter) in early September 2015. The sampling depth was 0–50 cm with an interval of 10 cm increments. Five randomly distributed sub-samples from each plot were combined into a composite sample at each soil depth. After removing the visible vegetation materials and debris, soil samples were sieved through a 2 mm sieve, and then ground to pass through a 0.25 mm sieve for analyses.
Soil labile oxidizable carbon (LOC) was measured using the revised method defined by Chan et al. [27]. Available nitrogen (AN) was measured by the alkaline hydrolysis diffusion method [28]. The AN forms were primarily mixtures of ammonium nitrogen (NH3-N), nitrate nitrogen (NO3-N), and a small amount of water soluble organic nitrogen (e.g., amino acids and ammonium acyl, etc.). Available phosphorus (AP) was extracted with NaHCO3 at pH 8.5 and measured using UV spectrophotometer [28]. The AP forms were primarily the calcium phosphates due to the higher soil pH (Table 1) in the study area. Available potassium (AK) was measured based on the ammonium acetate extracted and emission flame spectrophotometer method [28]. The AK forms were primarily mixtures of exchangeable potassium and water soluble potassium. Furthermore, for the purpose of clearly understanding the nature of soils in the study area, a 1:5 soil:water solution was used to measure the soil pH and electrical conductivity (EC) using the PHS-3C instrument and the DDS-307 instrument, respectively.

2.4. Statistical Analysis

The soil stratification by certain properties (e.g., SOC, total N, total P, etc.) is very common, and the stratification ratio (SR) is widely used as a crucial indicator of soil condition [15]. A higher SR of soil properties indicates better soil conditions, because SR of degraded soils is usually less than 2 regardless of climatic or soil conditions [15]. The improvement of soil quality under specific land use is conducive to plant growth and agricultural sustainability [29,30]. Revegetation on the cropland will increase the input of organic matter and thus alter the SR of soil properties, which will provide an indication of soil responses to specific plant cover. The SR were calculated for each land use as follows:
SR = ANt/ANs
where ANt is the content of LOC, AN, AP, and AK in the 0–10 cm depth; ANs is the corresponding content of LOC, AN, AP, and AK in the 10–20 and 20–30 cm depth.
A unitary soil available nutrient is not complete to reveal the changes within the soil environment because soil available nutrients do not always respond similarly to different management practices [22]. Therefore, the comprehensive assessment of the responses of a series of soil available nutrients and LOC to factors of change is required. However, the various responses of LOC and soil available nutrients to land use change might result in inaccurate conclusions on soil quality and thus limit the suitability of LOC and soil available nutrients as soil quality indicators. The geometric mean and sum scores are two general indices to combine the variables with diverse units and ranges into one variable, which could clearly indicate the actual influences of environmental factor changes on these variables [31]. Here, the geometric means of LOC and available nutrients (GMSN) under different land uses and soil depths are calculated as follows:
GMSN = (LOC × AN × AP × AK)1/4
where LOC, AN, AP, and AK are oxidizable labile C, available nitrogen, available phosphorus, and available potassium, respectively.
The simple sum of the series of soil available nutrients and LOC with different units and ranges of variation may cover up the changes in some soil nutrients. Therefore, data normalization is needed for all the measured soil available nutrients and LOC before the sum scores of LOC and available nutrients (SSAN) are calculated. The min-normalization is a well explored approach to convert the data with different units or variation ranges into a dimensionless pure value, so that the data can remove the unit limit and can be easily compared and weighted [26]. The SSAN under different land uses and soil depths is as follows:
Si = X/Xmin
SSAN = i = 1 n S i
where Si is the score of LOC, AN, AP, and AK after data normalization; X is the measured value, and Xmin is the minimum value of each soil nutrient observed in this study; n is the number of soil nutrients.
We used one way ANOVA to analyze the influences of land use types on the LOC and soil available nutrients, soil pH, EC, SR, GMSN, and SSAN. Mean differences of soil available nutrient contents, LOC, SR, GMSN, and SSAN among land use treatments were examined using the least significant difference test (LSD). All comparisons were considered significant if p < 0.05. The mean and standard error of each soil property measured were provided at each soil depth under a given land use treatment. All data analyses were performed with SPSS 16.0 for Windows (SPSS, Inc., Chicago, USA).

3. Results

3.1. Changes in Soil pH and EC

Soil pH in the study area was notably high (Table 1). The values of soil pH were all more than 9.00 at the 0–50 cm depth; especially at the 10–50 cm depths, the values were close to or more than 10.00. Soil pH was not affected by the land use conversions. The average values of soil pH at the 0–50 cm depth were 9.88, 9.82, 9.83, 9.76, and 9.68 for corn, alfalfa, MLG, MLG + M, and SRG treatment, respectively.
Similar to the soil pH, the EC values in the subsoil (10–50 cm) were higher than that at the surface soil (0–10 cm). The average values of EC in the 0–50 cm depth were 333, 317, 430, 399, and 376 μS cm-1 for corn, alfalfa, MLG, MLG + M, and SRG treatment, respectively (Table 1). There was no significant difference of EC among the land use treatments because of the narrow values of EC in the same soil depth.

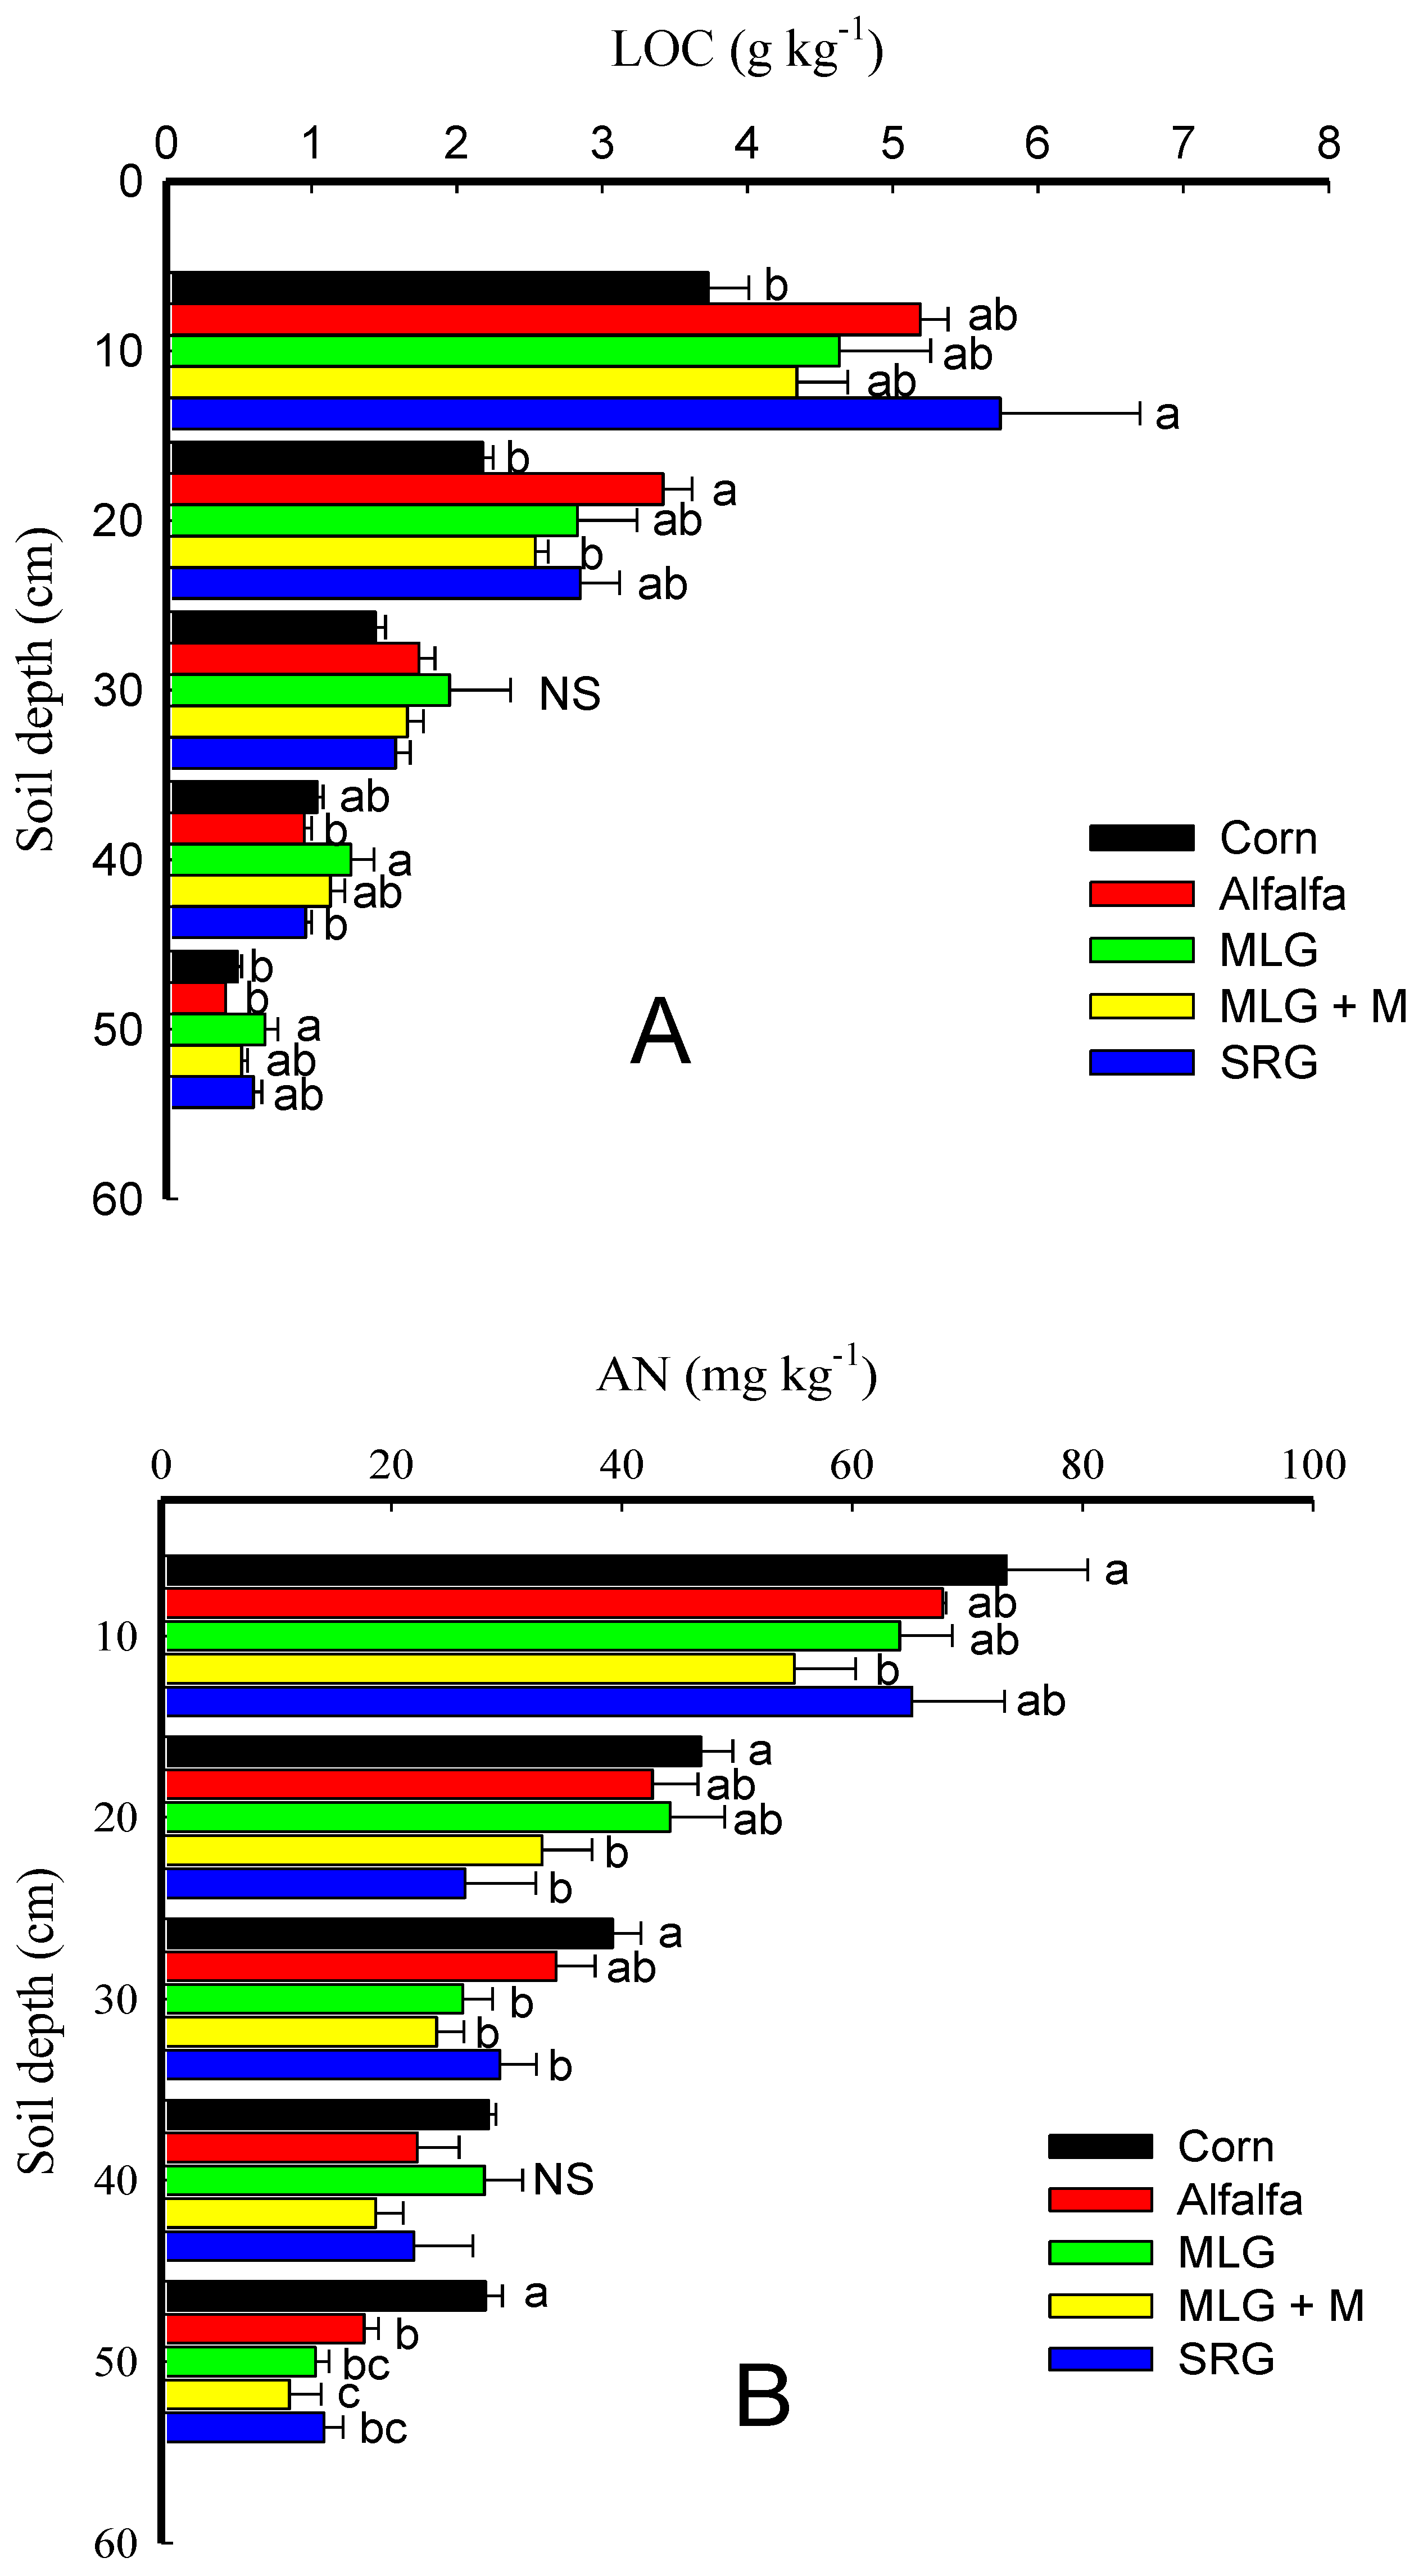
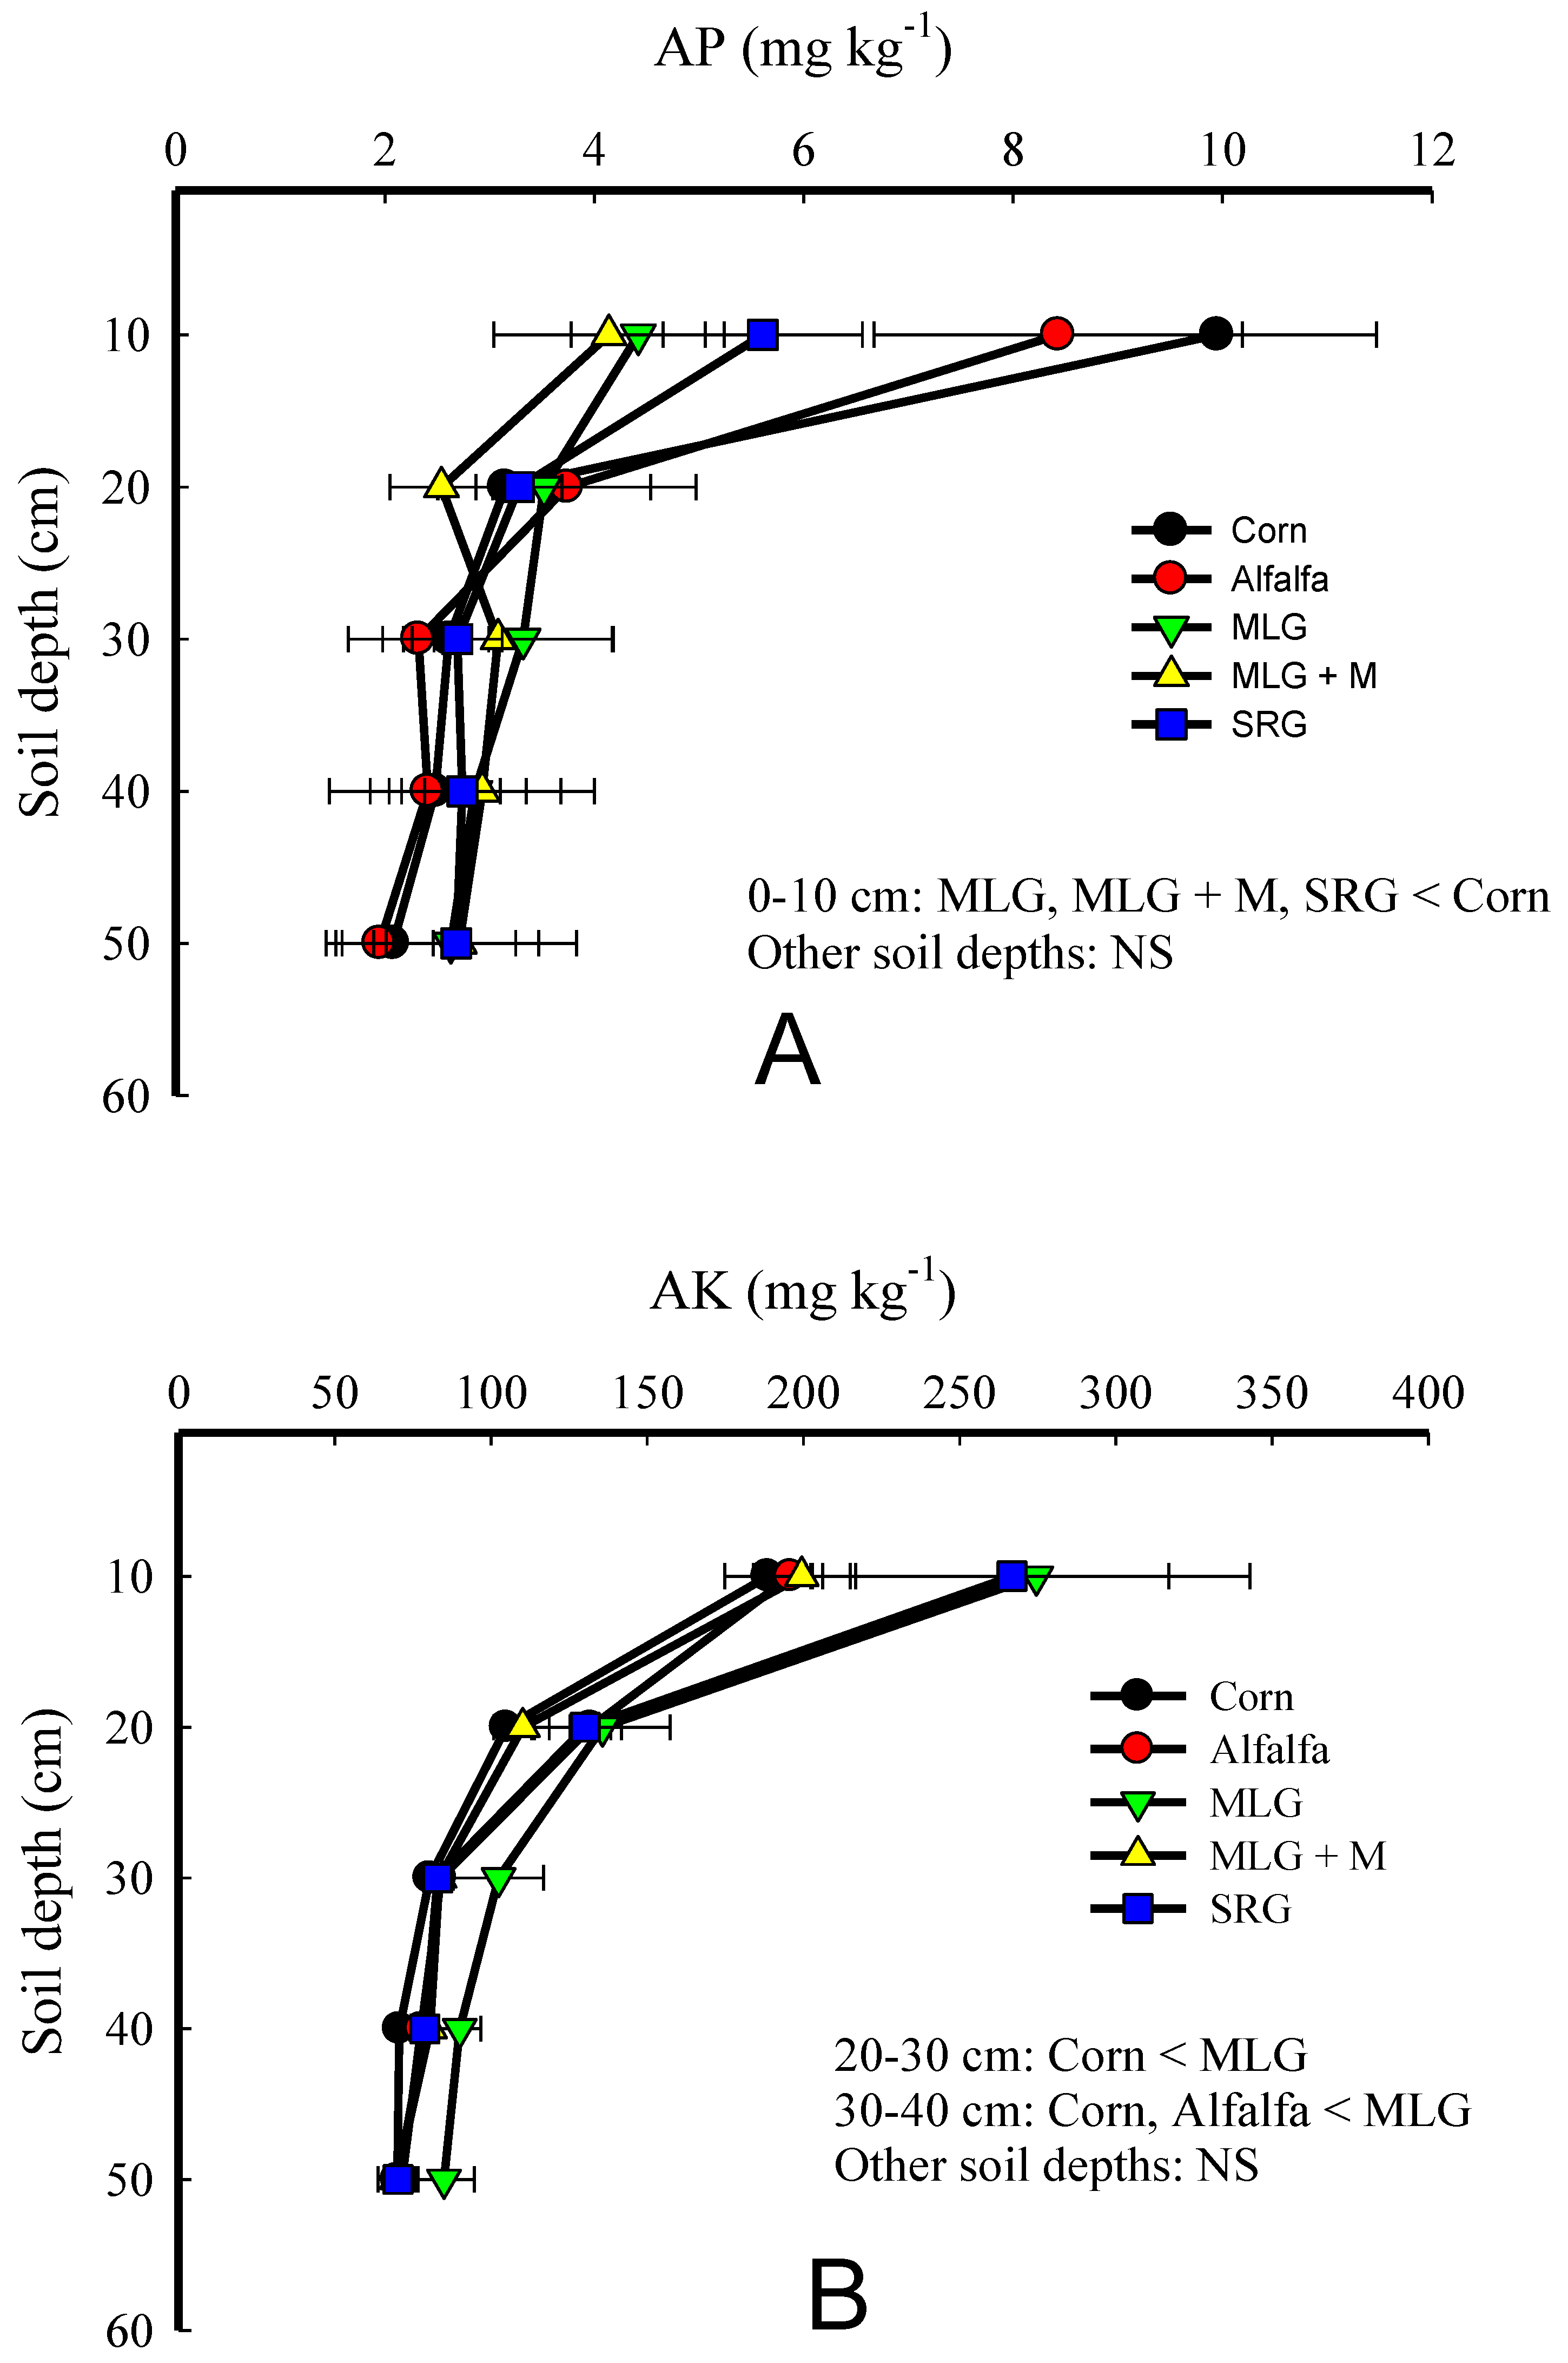
3.2. Changes in LOC, AN, AP, and AK Content

The LOC content under the land use of SRG was remarkably higher than that under corn in the 0–10 cm depth, while it was significantly higher under alfalfa in the 10–20 cm depth than the corn and MLG + M treatment (Figure 4A). In the 20–50 cm depth, the highest LOC content was found under the MLG treatment. The average LOC contents in the 0–50 cm depth were 32% (0.56 g kg−1), 28% (0.49 g kg−1), 15% (0.26 g kg−1), and 32% (0.57 g kg−1) higher under alfalfa, MLG, MLG + M, and SRG treatment, respectively, than that under corn treatment.
Land use conversions significantly (F = 8.76, p = 0.001) changed the AN contents (Figure 4B). The highest AN content was found under corn treatment in the 0–50 cm depth. In addition, the AN contents under corn treatment in the 20–30 cm and 40–50 cm depth were significantly higher than those under all the revegetation land except the alfalfa treatment in the 20–30 cm depth. The average AN contents in the 0–50 cm depth were 15% (6.3 mg kg−1), 19% (8.0 mg kg−1), 34% (14.9 mg kg−1), and 27% (11.8 mg kg−1) lower under alfalfa, MLG, MLG + M, and SRG treatment, respectively, than under corn treatment.
The differences of AP and AK contents among the soil depths in the 0–50 cm depth were very narrow except the 0–10 cm depth (Figure 5). Compared with the land uses of MLG, MLG + M, and SRG, land use of corn had a higher AP content at the 0–10 cm depth. However, land use treatments did not change the AP contents at the 10–50 cm depth (Figure 5A). The average AP contents in the 0–50 cm depth under the land uses of corn, alfalfa, MLG, MLG + M, and SRG were 4.1, 3.8, 3.4, 3.1, and 3.4 mg kg−1, respectively. The highest AK contents were all found under the MLG treatment in the 0–50 cm depth (Figure 5B). However, significant differences were only found between MLG and corn treatment in the 20–40 cm depth and between MLG and alfalfa treatment in the 30–40 cm depth. The average AK contents in the 0–50 cm depth under corn, alfalfa, MLG, MLG + M, and SRG treatment were 102.9, 112.2, 137.5, 108.7, and 125.8 mg kg−1, respectively.

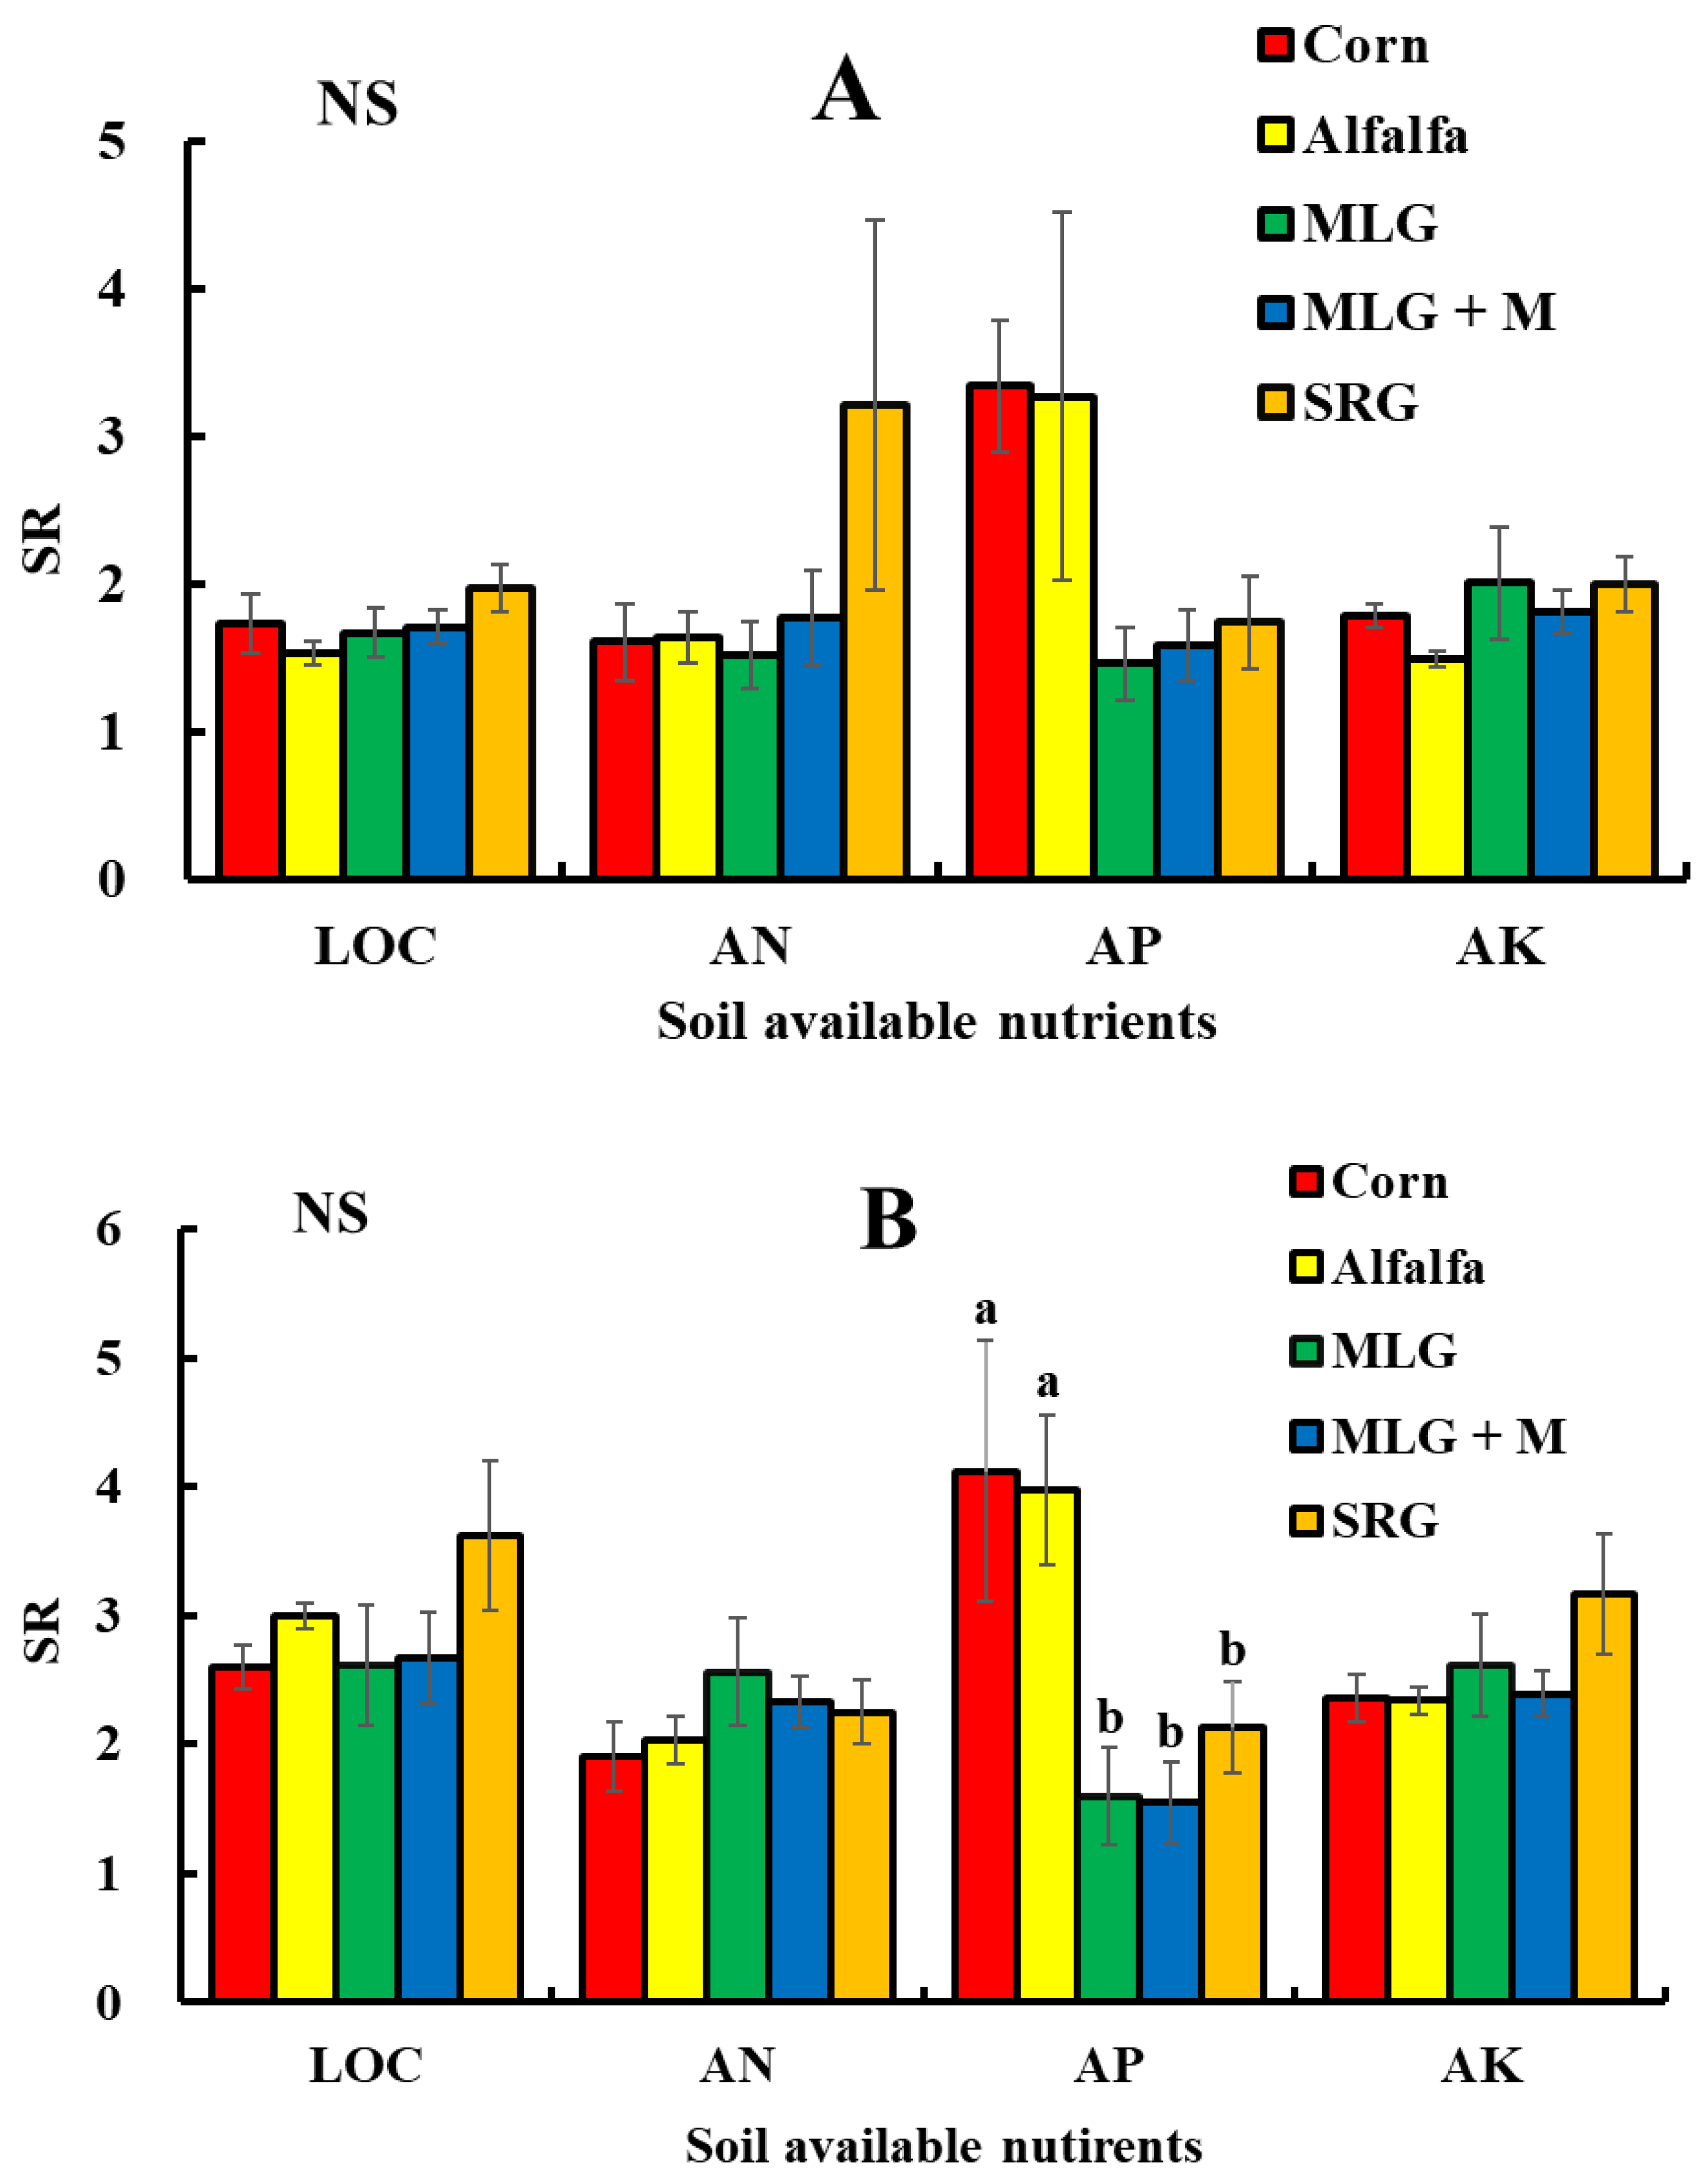
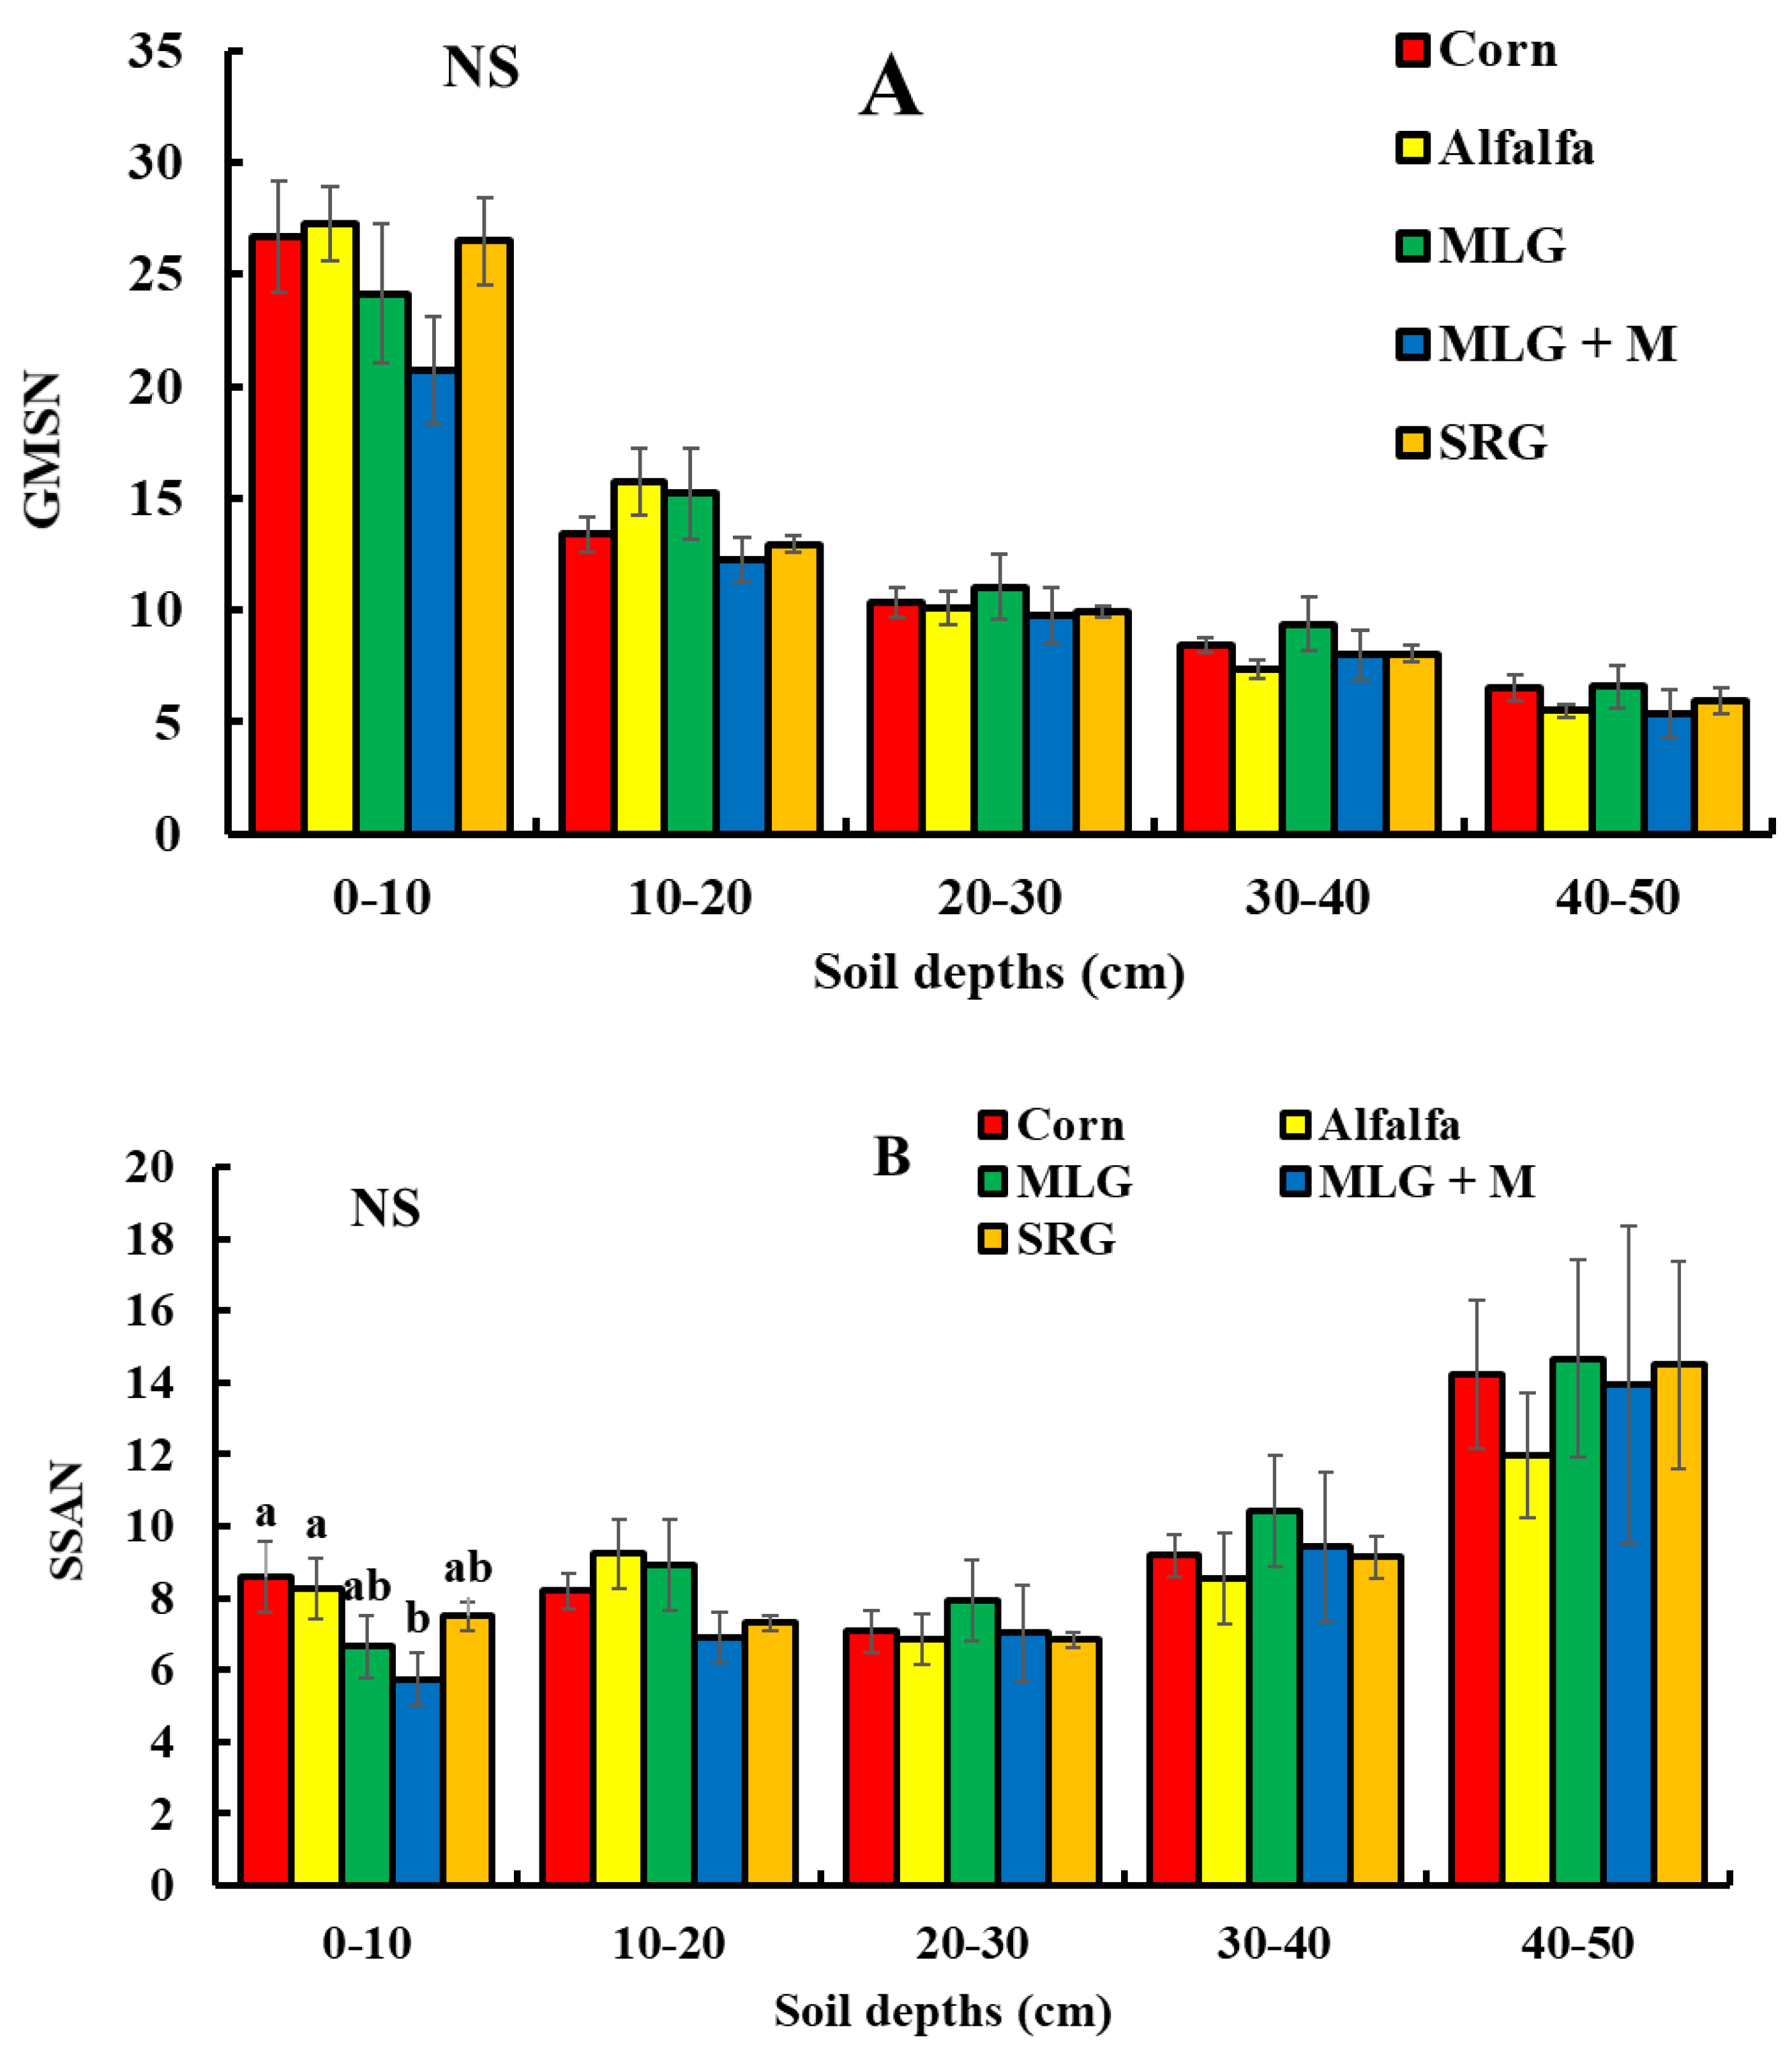
3.3. Changes in SR, GMSN, and SSAN

The SR of LOC, AN, and AK in the 0–10/10–20 cm and in the 0–10/20–30 cm (Figure 6) were not affected by the different land uses. Land uses of corn and alfalfa had remarkably higher SR values of AP in the 0–10/20–30 cm depth than the land uses of MLG, MLG + M, and SRG. However, the differences of the SR value for AP in the 0–10/10–20 cm depth were not significant among the five treatments. All the SR values of LOC, AN, AP, and AK in the 0–10/10–20 cm depth were all <2 except the values of AN under SRG treatment, AP under corn and alfalfa treatment, and AK under MLG treatment. However, the SR values of LOC, AN, AP, and AK in the 0–10/20–30 cm depth were all >2, except the values of AN under corn treatment and AP under MLG and MLG + M treatment.
Values of GMSN in the 0–50 cm depth and SSAN in the 10–50 cm depth were not influenced by the changes of land use (Figure 7). The highest GMSN value was found under alfalfa in 0–20 cm depth, while it was highest under MLG treatment in the 20–50 cm depth (Figure 7A). The average GMSN values in the 0–50 cm depth under corn, alfalfa, MLG, MLG + M, and SRG treatment were 13.1, 13.2, 13.3, 11.2, and 12.7, respectively. The SSAN values under corn and alfalfa treatment in the 0–10 cm depth were markedly greater than the land use of MLG + M (Figure 7B). The average SSAN values in the 0–50 cm depth under corn, alfalfa, MLG, MLG + M, and SRG treatment were 9.5, 9.0, 9.7, 8.6, and 9.1, respectively.

4. Discussion

The low content of soil organic carbon can limit microbial biomass and activity, nutrient cycling, soil structure formation, etc., and therefore indirectly limit plant growth [22]. Increasing the content of soil organic carbon and soil available nutrients is the common approach to improve soil productivity and agricultural sustainability. Land use changes could significantly alter the inputs and outputs of soil organic matter, thus resulting in the variations in the content and circulation of soil labile carbon and soil nutrients [32,33]. The present study showed that conversion of cropland to revegetation land increased the LOC content in the 0–50 cm depth (Figure 4A). Moreover, the increase of LOC content mainly occurred in the surface soil. Compared with the corn treatment, the LOC contents under revegetation land were 33%, 33%, and 20% higher in the 0 to 10, 10 to 20, and 20 to 30 cm depths, respectively. However, there were no significant differences for LOC contents between corn and revegetation treatments in the 30 to 40 and 40 to 50 cm depths. The higher LOC contents under revegetation land in surface soil (0–30 cm) were probably associated with the accumulation of above- and below-ground biomass incorporated into the surface soils [34,35]. In addition, revegetation on the cropland could reduce the loss of LOC in fine soil fractions caused by rain and wind erosion, thus increasing the LOC content [22,33]. Soil texture can affect the soil aggregation processes and, therefore, influences the soil capacity to sequester organic carbon [36]. Tian et al. [37] in the alpine grassland on the Tibetan Plateau reported that soil organic carbon and total nitrogen stocks positively correlated with clay content and silt content, while they negatively related to sand content. Land use changes can indirectly affect soil texture through the redistribution of soil by erosional processes or tillage. Revegetation on the cropland in this study could reduce the soil erosion by increasing the vegetation cover and decreasing soil disturbance, thus indirectly affecting the content of LOC and soil available nutrients.
Compared with corn treatment, revegetation did not increase the AN contents in the study area, and the corn treatment had the highest AN content in the 0 to 50 cm depth (Figure 4B). This might be due to the fertilization management in corn treatment, which applied approximately 74 kg N ha−1 every year. Another reason for the higher AN contents under corn treatment could partially result from the short term revegetation under the revegetation land, which had limited effects on the accumulation of AN and other soil nutrients. Besides, no significant differences among the forage and grasslands also suggested negligible effects of short term revegetation on the AN contents in the study area. The higher AN contents under the corn treatment were similar to the results by Zhang et al. [38] in Guizhou, China, who also reported that the AN content under fertilized and plowed cropland was higher than that under grassland and forestland. Soil AP and AK contents were not significantly different under most land use treatments (Figure 5), indicating that the short term land use treatments did not change the AP and AK contents in northeastern China. Similar to the changes in AN content, the negligible effects of short term revegetation on soil AP and AK may be the primary reason for the narrow changes in AP and AK content under the five land use treatments. These results were in agreement with the findings of Zhao et al. [39] in another region of Songnen plain, who also found that the changes in AP and AK content under cropland and grassland were very limited.
The SR of soil parameters was used as an indicator of the dynamics soil quality, and it could detect the management induced changes in the soil profiles of agricultural systems [15]. The increase in SR values of LOC and soil nutrient indicated the improvement of soil quality due to the accumulation of LOC and soil nutrients in the surface soil [30,40]. Land use treatments had no significant effects on the SR values of LOC, AN, AP, and AK contents at depths of 0–10/10–20 cm and 0–10/20–30 cm except the SR of AP at the depth of 0–10/20–30 cm, suggesting that short term revegetation had limited effects on the soil available nutrients in northeastern China. Studies in Columbia and Georgia showed that the SR values of SOC and total nitrogen were >2 under no tillage management, indicting an improvement of soil quality [29]. Peregrina et al. [41], Corral-Fernandez et al. [42], Francaviglia et al. [40], and Deng et al. [15] confirmed this finding, arguing that a high SR value (usually >2) indicated a better soil quality and contribution to agriculture sustainability. Our results showed that the SR values of LOC and soil available nutrients at the depth of 0–10/10–20 cm were mostly <2, and the SR values at the depth of 0–10/20–30 cm were mostly >2, indicating that soils under the same land use treatments had different soil quality. Similarly, the study by Deng et al. [15] also found that the SR values at the depth of 0–20/20–40 cm were generally higher than those at the depth of 0–5/10–20 cm found by Wang et al. [43] in the same region of the Loess Plateau. The SR values of LOC and soil nutrients in different soil depths in response to land use treatment were not consistent, suggesting that standard SR values of soil properties are needed in future studies to make the comparisons of soil quality under different management practices and different regions easier. Therefore, the SR values at the depth of 0–10/10–20 cm may be well suitable as a standard for evaluating significant changes in surface soils induced by management practices.
In this study, three soil available nutrients including AN, AP, and AK contents and LOC were evaluated, but similar trends were not found (Figure 4 and Figure 5). In fact, it is difficult to draw meaningful conclusions about soil quality changes when univariate indicators are used to analyze datasets involving many soil properties and reveal the changes within the soil environment [44]. The two indices of GMSN and SSAN were able to overcome the above weaknesses, and they were used as useful indictors of soil quality in other studies [22,26,31]. However, the results in this study showed no significant differences of GMSN and SSAN among the five land use treatments at each soil depth except SSAN under the MLG + M treatment in the 0 to 10 cm depth (Figure 7), indicating that short term conversions of cropland to revegetation land had limited demonstrable influences on the soil available nutrients and LOC in the salt affected region of Songnen plain. The inconclusive results suggested that a long term study is needed to examine the responses of the LOC and soil available nutrients to long term revegetation in northeastern China.

5. Conclusions

The present results showed that revegetation on the cropland enhanced the LOC contents and decreased the AN contents in the 0–50 cm depth compared with the Corn treatment, and the changes in AP and AK contents were very limited after the land use conversions. The SR values in different soil depths in response to land uses were not consistent, suggesting that standard SR values of soil properties are needed in the future studies and that the SR values at the depth of 0–10:10–20 may be suitable as the standard considering the notable changes in surface soils induced by management practices. However, more studies are needed to examine if the SR value at the 0–10:10–20 cm is suitable in other managements or regions. The values of SR, GMSA, and SSAN were not affected by the land use changes, indicating short term revegetation on the cropland had limited influences on the changes in soil nutrients and LOC in northeastern China. Compared with AG treatment, values of GMSA and SSAN were slightly lower than other land use treatments. These results were mainly due to the very short term (five years) revegetation because revegetation may need more time to be incorporated. Therefore, more studies are needed to assess the long term (more than 10 years) effects of revegetation on soil properties in the Songnen grassland in the future. Although changes in soil available nutrients were given in this study, variations in soil microbial populations, which are more sensitive to changes in land uses than soil nutrients, were not mentioned. The influences of short term revegetation on soil quality need to be comprehensively assessed. In addition, we recommend that farmers in Northeast China should use revegetation to rehab grassland in areas with poor quality soils in the long run.

Author Contributions

Conceptualization, P.Y., S.L., X.T., and W.L.; methodology, P.Y., X.T., and A.Z.; investigation, P.Y. and X.T.; data curation, P.Y. and A.Z.; writing, original draft preparation, P.Y.; writing, review and editing, S.L., W.L., X.T., and A.Z.; project administration, P.Y., S.L. and W.L.; funding acquisition, P.Y. and S.L. All authors have read and agreed to the published version of the manuscript.

Funding

This research was supported by the Fundamental Research Funds for the Central Universities in China, Grant Numbers SWU019024 and SWU019023; the National Natural Science Foundation of China, Grant Number 41601124 and 31500446; the Excellent Young Foundation of Jilin Province, Grant Number 20190103141JH; and the University Innovation Research Group of Chongqing (Remote sensing of fragile ecological environment in southwest China).

Conflicts of Interest

The authors declare no conflict of interest.

References

  1. Sardans, J.; Bartrons, M.; Margalef, O.; Gargallo-Garriga, A.; Janssens, I.A.; Ciais, P.; Obersteiner, M.; Sigurdsson, B.D.; Chen, H.Y.H.; Penuelas, J. Plant invasion is associated with higher plant-soil nutrient concentrations in nutrient-poor environments. Glob. Chang. Biol. 2017, 23, 1282–1291. [Google Scholar] [CrossRef] [PubMed]
  2. Yu, P.J.; Liu, S.W.; Xu, Q.; Fan, G.H.; Huang, Y.X.; Zhou, D.W. Response of soil nutrients and stoichiometric ratios to short-term land use conversions in a salt-affected region, northeastern China. Ecol. Eng. 2019, 129, 22–28. [Google Scholar] [CrossRef]
  3. Gomes, L.; Simoes, S.J.C.; Nora, E.L.D.; Sousa-Neto, E.R.; Forti, M.C.; Ometto, J.P.H.B. Agricultural expansion in the Brazilian Cerrado: Increased soil and nutrient losses and decreased agricultural productivity. Land 2019, 8, 12. [Google Scholar] [CrossRef] [Green Version]
  4. Craft, C.; Vymazal, J.; Kropfelova, L. Carbon sequestration and nutrient accumulation in floodplain and depressional wetlands. Ecol. Eng. 2018, 114, 137–145. [Google Scholar] [CrossRef]
  5. Yang, S.R.; Sheng, D.R.; Adamowski, J.; Gong, Y.F.; Zhang, J.; Cao, J.J. Effect of land use change on soil carbon storage over the last 40 years in the Shi Yang River Basin, China. Land 2018, 7, 11. [Google Scholar] [CrossRef] [Green Version]
  6. Yang, Z.N.; Zhu, Q.A.; Zhan, W.; Xu, Y.Y.; Zhu, E.X.; Gao, Y.H.; Li, S.Q.; Zheng, Q.Y.; Zhu, D.; He, Y.X.; et al. The linkage between vegetation and soil nutrients and their variation under different grazing intensities in an alpine meadow on the eastern Qinghai-Tibetan Plateau. Ecol. Eng. 2018, 110, 128–136. [Google Scholar] [CrossRef]
  7. Pulido-Fernández, M.; Schnabel, S.; Lavado-Contador, J.F.; Mellado, I.M.; Pérez, R.O. Soil organic matter of Iberian open woodland rangelands as influenced by vegetation cover and land management. Catena 2013, 109, 13–24. [Google Scholar] [CrossRef]
  8. Lal, R. Restoring soil quality to mitigate soil degradation. Sustainability 2015, 7, 5875–5895. [Google Scholar] [CrossRef] [Green Version]
  9. Yadav, G.S.; Lal, R.; Meena, R.S.; Babu, S.; Das, A.; Bhowmik, S.N.; Datta, M.; Layak, J.; Saha, P. Conservation tillage and nutrient management effects on productivity and soil carbon sequestration under double cropping of rice in north eastern region of India. Ecol. Indic. 2019, 105, 303–315. [Google Scholar] [CrossRef]
  10. Quinton, J.N.; Govers, G.; Oost, K.V.; Bardgett, R.D. The impact of agricultural soil erosion on biogeochemical cycling. Nat. Geosci. 2010, 3, 311–314. [Google Scholar] [CrossRef] [Green Version]
  11. Amundson, R.; Berhe, A.A.; Hopmans, J.W.; Olson, C.; Sztein, A.E.; Sparks, D.L. Soil and human security in the 21st century. Science 2015, 348, 1261071. [Google Scholar] [CrossRef] [PubMed] [Green Version]
  12. Wang, J.; Fu, B.J.; Qiu, Y.; Chen, L.D. Soil nutrients in relation to land use and landscape position in the semi-arid small catchment on the loess plateau in China. J. Arid Environ. 2001, 48, 537–550. [Google Scholar] [CrossRef]
  13. Korkanc, S.Y. Effects of afforestation on soil organic carbon and other soil properties. Catena 2014, 123, 62–69. [Google Scholar] [CrossRef]
  14. Madejon, P.; Alaejos, J.; Garcia-Albala, J.; Fernandez, M.; Madejon, E. Three-year study of fast-growing trees in degraded soils amended with composts: Effects on soil fertility and productivity. J. Environ. Manag. 2016, 169, 18–26. [Google Scholar] [CrossRef] [PubMed]
  15. Deng, J.; Sun, P.S.; Zhao, F.Z.; Han, X.H.; Yang, G.H.; Feng, Y.Z.; Ren, G.X. Soil C, N, P and its stratification ratio affected by artificial vegetation in subsoil, Loess Plateau China. PLoS ONE 2016, 11, E0151446. [Google Scholar] [CrossRef] [PubMed]
  16. Wang, M.M.; Chen, H.S.; Zhang, W.; Wang, K.L. Soil nutrients and stoichiometric ratios as affected by land use and lithology at country scale in a karst area, southwest China. Sci. Total Environ. 2018, 619–620, 1299–1307. [Google Scholar] [CrossRef] [PubMed]
  17. Ho, J.; Boughton, E.H.; Jenkins, D.G.; Sonnier, G.; Bohlen, P.J.; Chambers, L.G. Ranching practices interactively affect soil nutrients in subtropical wetlands. Agric. Ecosyst. Environ. 2018, 254, 130–137. [Google Scholar] [CrossRef]
  18. Guo, L.J.; Zhang, Z.S.; Wang, D.D.; Li, C.F.; Cao, C.G. Effects of short-term conservation management practices on soil organic carbon fractions and microbial community composition under a rice-wheat rotation system. Biol. Fertil. Soils 2015, 51, 65–75. [Google Scholar] [CrossRef]
  19. Qi, H.J.; Paz-Kagan, T.; Karnieli, A.; Jin, X.; Li, S.W. Evaluating calibration methods for predicting soil available nutrients using hyperspectral VNIR data. Soil Tillage Res. 2018, 175, 267–275. [Google Scholar] [CrossRef]
  20. Wang, S.Y.; Shi, Y.; Niu, J.J.; Fan, L.Y. Influence of vegetation restoration models on soil nutrient of coal gangue pile: A case study of No. 1 Coal Gangue Pile in Hedong, Shanxi. Acta Geogr. Sin. 2013, 68, 372–379. [Google Scholar]
  21. Lu, X.; Yan, Y.; Sun, J.; Zhang, X.; Chen, Y.; Wang, X.; Cheng, G. Short-term grazing exclusion has no impact on soil properties and nutrients of degraded alpine grassland in Tibet, China. Solid Earth 2015, 6, 1195–1205. [Google Scholar] [CrossRef] [Green Version]
  22. Yu, P.J.; Liu, S.W.; Han, K.X.; Guan, S.C.; Zhou, D.W. Conversion of cropland to forage land and grassland increases soil labile carbon and enzyme activities in northeastern China. Agric. Ecosyst. Environ. 2017, 245, 83–91. [Google Scholar] [CrossRef]
  23. Rasouli, F.; Pouya, A.K.; Karimian, N. Wheat yield and physic-chemical properties of a sodic soil from semi-arid area of Iran as affected by applied gypsum. Geoderma 2013, 193–194, 246–255. [Google Scholar] [CrossRef]
  24. Rui, Y.; Deng, H.; Wang, H.L.; Zhang, B. Vegetation type affects soil enzyme activities and microbial functional diversity following re-vegetation of a severely eroded red soil in sub-tropical China. Catena 2014, 115, 96–103. [Google Scholar]
  25. IUSS, Working Group. World reference base for soil resources 2014 (update 2015), International soil classification system for naming soils and creating legends for soil maps. World Soil Resour. Rep. 2015, 106, 166–168. [Google Scholar]
  26. Yu, P.J.; Fan, G.H.; Han, K.X.; Zhou, D.W. Soil quality assessment based on soil microbial biomass carbon and soil enzyme activities. Res. Agric. Mod. 2018, 39, 163–169. [Google Scholar]
  27. Chan, K.Y.; Bowman, A.; Oates, A. Oxidizible organic carbon fractions and soil quality changes in an oxic paleustalf under different pasture leys. Soil Sci. 2001, 166, 61–67. [Google Scholar] [CrossRef]
  28. Bao, S.D. Soil and Agricultural Chemistry Analysis, 3rd ed.; Agricultural Publishing House: Beijing, China, 2000. [Google Scholar]
  29. Franzluebbers, A.J. Soil organic matter stratification ratio as an indicator of soil quality. Soil Tillage Res. 2002, 66, 95–106. [Google Scholar] [CrossRef]
  30. Moraes Sa, J.C.; Lal, R. Stratification ratio of soil organic matter pools as an indicator of carbon sequestration in a tillage chronosequence on a Brazilian Oxisol. Soil Tillage Res. 2009, 103, 46–56. [Google Scholar]
  31. Raiesi, F.; Beheshti, A. Microbiological indicators of soil quality and degradation following conversion of native forest to continuous croplands. Ecol. Indic. 2015, 50, 173–185. [Google Scholar] [CrossRef]
  32. Ketema, H.; Yimer, F. Soil property variation under agroforestry based conservation tillage and maize based conventional tillage in Southern Ethiopia. Soil Tillage Res. 2014, 141, 25–31. [Google Scholar] [CrossRef]
  33. Negasa, T.; Ketema, H.; Legesse, A.; Sisay, M.; Temesgen, H. Variation in soil properties under different land use types managed by smallholder farmers along the toposequence in southern Ethiopia. Geoderma 2017, 290, 40–50. [Google Scholar] [CrossRef]
  34. Benbi, D.K.; Brar, K.; Toor, A.S.; Singh, P. Total and labile pools of soil organic carbon in cultivated and undisturbed soils in Northern India. Geoderma 2015, 237–238, 149–158. [Google Scholar] [CrossRef]
  35. Gabarron-Galeote, M.A.; Trigalet, S.; Wesemael, B. Effect of land abandonment on soil organic carbon fractions along a Mediterranean precipitation gradient. Geoderma 2015, 249–250, 69–78. [Google Scholar] [CrossRef]
  36. Creamer, C.A.; Jones, D.L.; Baldock, J.A.; Rui, Y.C.; Murphy, D.V.; Hoyle, F.C.; Farrell, M. Is the fate of glucose-derived carbon more strongly driven by nutrient availability, soil texture, or microbial biomass size. Soil Biol. Biochem. 2016, 103, 201–212. [Google Scholar] [CrossRef]
  37. Tian, L.M.; Zhao, L.; Wu, X.D.; Fang, H.B.; Zhao, Y.H.; Yue, G.Y.; Liu, G.M.; Chen, H. Vertical patterns and controls of soil nutrients in alpine grassland: Implications for nutrient uptake. Sci. Total Environ. 2017, 607–608, 855–864. [Google Scholar] [CrossRef] [PubMed]
  38. Zhang, Z.M.; Lin, S.X.; Zhang, Q.H.; Guo, Y.; Lin, C.H. The distribution characteristics of soil carbon, nitrogen and phosphorus under different land use patterns in Caohai Plateau wetland. J. Soil Water Conserv. 2013, 27, 199–204. [Google Scholar]
  39. Zhao, L.P.; Wang, Y.; Feng, J. The Amelioration and Utilization of the Saline Sodic Soils in Songnen Plain; Science Press: Beijing, China, 2013; pp. 94–100. [Google Scholar]
  40. Francaviglia, R.; Bebedetti, A.; Doro, L.; Madrau, S.; Ledda, L. Influence of land use on soil quality and stratification ratios under agro-silvo-pastoral Mediterranean management systems. Agric. Ecosyst. Environ. 2014, 183, 86–92. [Google Scholar] [CrossRef]
  41. Peregrina, F.; Perez-Alvarez, E.P.; Garcia-Escudero, E. Soil microbiological properties and its stratification ratios for soil quality assessment under different cover crop management systems in a semiarid vineyard. J. Plant Nutr. Soil Sci. 2014, 177, 548–559. [Google Scholar] [CrossRef]
  42. Corral-Fernandez, R.; Parras-Alcantara, L.; Lozano-Garcia, B. Stratification ratio of soil organic C, N and C:N in Mediterranean evergreen oak woodland with conventional and organic tillage. Agric. Ecosyst. Environ. 2013, 164, 252–259. [Google Scholar] [CrossRef]
  43. Wang, Y.F.; Fu, B.J.; Lv, Y.H.; Song, C.J.; Luan, Y. Local-scale spatial variability of soil organic carbon and its stock in the hilly area of the Loess Plateau, China. Quat. Res. 2010, 73, 70–76. [Google Scholar] [CrossRef] [Green Version]
  44. Wang, Q.Y.; Liu, J.S.; Wang, Y.; Guan, J.N.; Liu, Q.; Lv, D.A. Land use effects on soil quality along a native wetland to cropland chronosequence. Eur. J. Soil Biol. 2012, 53, 114–120. [Google Scholar] [CrossRef]
Figure 1. The location map of the study area.
Land 09 00010 g001
Figure 2. Images of the land use treatments in this study. Corn, corn cropland; Alfalfa, alfalfa forage land; MLG, monoculture grassland; MLG + M, monoculture grassland for hay (Mowing); SRG, successional regrowth grassland.
Land 09 00010 g002
Figure 3. Detailed information and history of land use treatments in this study.
Land 09 00010 g003
Figure 4. Mean values of labile oxidizable carbon (LOC) (A) and available nitrogen (AN) (B) under different land uses. The bars represent standard errors. Values without a common letter within land use treatments differed according to the LSD test (p < 0.05). NS = not significant among different land uses. See Figure 2 for the abbreviations.
Land 09 00010 g004
Figure 5. Mean values of AP (A) and AK (B) under different land uses. AP represents available phosphorus. AK represents available potassium. The bars represent standard errors. NS = not significant among different land uses.
Land 09 00010 g005
Figure 6. Changes in the stratification ratio (SR) of 0–10/10–20 cm (A) and 0–10/20–30 cm (B) under different land uses. The bars represent standard errors. Values without a common letter within land use treatments differed according to the LSD test (p < 0.05). NS = not significant among different land uses.
Land 09 00010 g006
Figure 7. Changes of GMSN (A) and SSAN (B) under different land uses. GMSN represent geometric means of LOC and available nutrients. SSAN represent sum scores of LOC and available nutrients. The bars represent standard errors. Values without a common letter within land use treatments differed according to the LSD test (p < 0.05). NS = not significant among different land uses.
Land 09 00010 g007
Table 1. Mean values (±SE) of soil pH and electrical conductivity (EC) under different land uses.
Soil DepthCornAlfalfaMLG + MMLGSRGANOVA
FP
pH
0–109.36 (±0.14)9.14 (±0.04)9.16 (±0.10)9.00 (±0.10)9.05 (±0.26)0.880.50
10–209.83 (±0.17)9.76 (±0.09)9.93 (±0.09)9.87 (±0.06)9.39 (±0.43)1.010.43
20–3010.06 (±0.08)10.04 (±0.09)10.03 (±0.04)10.00 (±0.06)9.96 (±0.08)0.290.88
30–4010.11 (±0.04)10.11 (±0.08)10.03 (±0.03)9.99 (±0.04)10.02 (±0.03)1.110.39
40–5010.06 (±0.06)10.04 (±0.09)9.99 (±0.04)9.92 (±0.04)9.98 (±0.05)0.780.56
EC
0–10204 (±16)155 (±11)162 (±5)157 (±21)164 (±24)1.430.27
10–20330 (±56)306 (±43)398 (±53)376 (±32)335 (±101)0.360.84
20–30391 (±49)385 (±65)531 (±55)491 (±39)435 (±95)1.000.44
30–40389 (±31)391 (±58)576 (±46)501 (±55)492 (±75) 2.120.13
40–50350 (±17)349 (±59)481 (±56)468 (±64)452 (±45)1.630.22
Abbreviations: Corn, corn cropland; Alfalfa, alfalfa forage land; MLG, monoculture grassland; MLG + M, monoculture grassland for hay; SGR, successional growth grassland.

