Assessment of Energy–Population–Urbanization Nexus with Changing Energy Industry Scenario in India


Abstract
:
1. Introduction
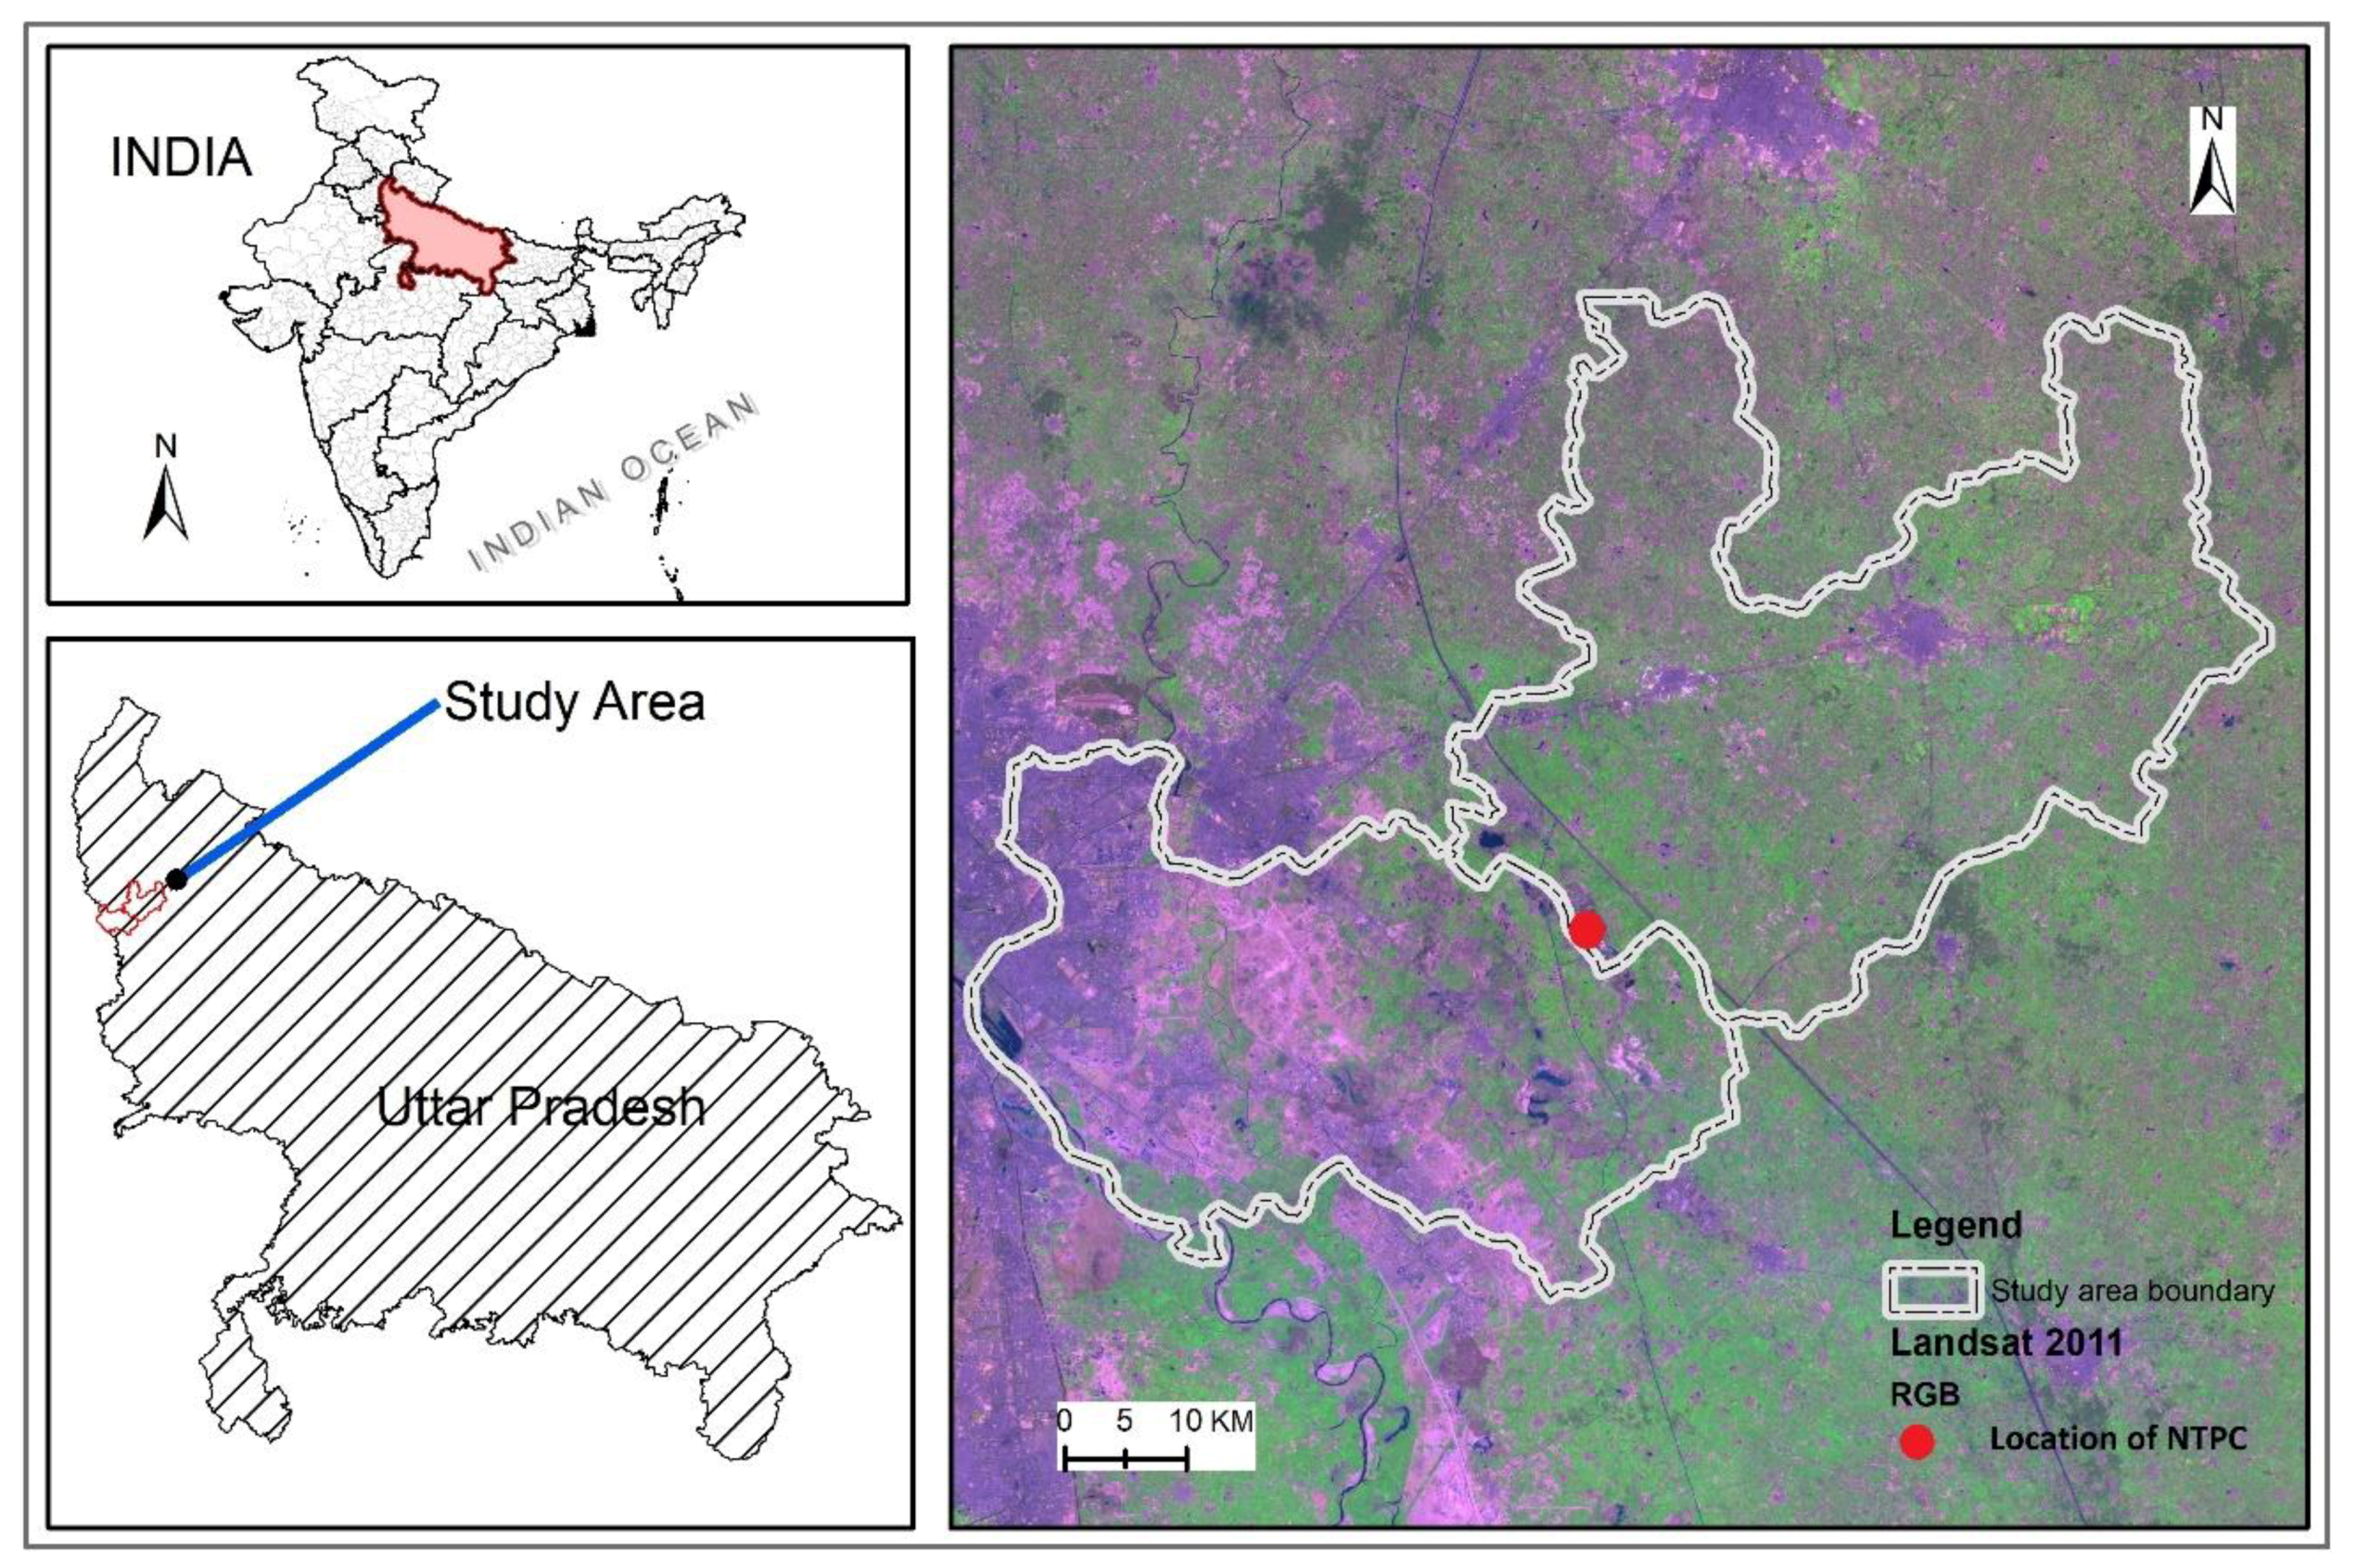
2. Study Area
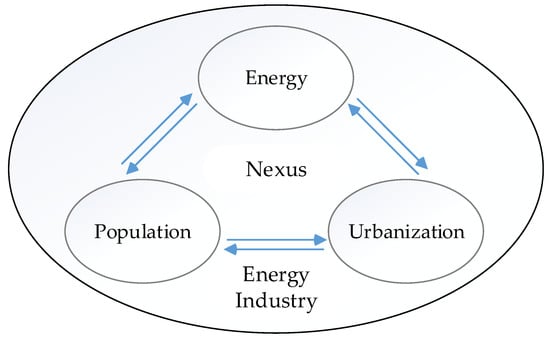
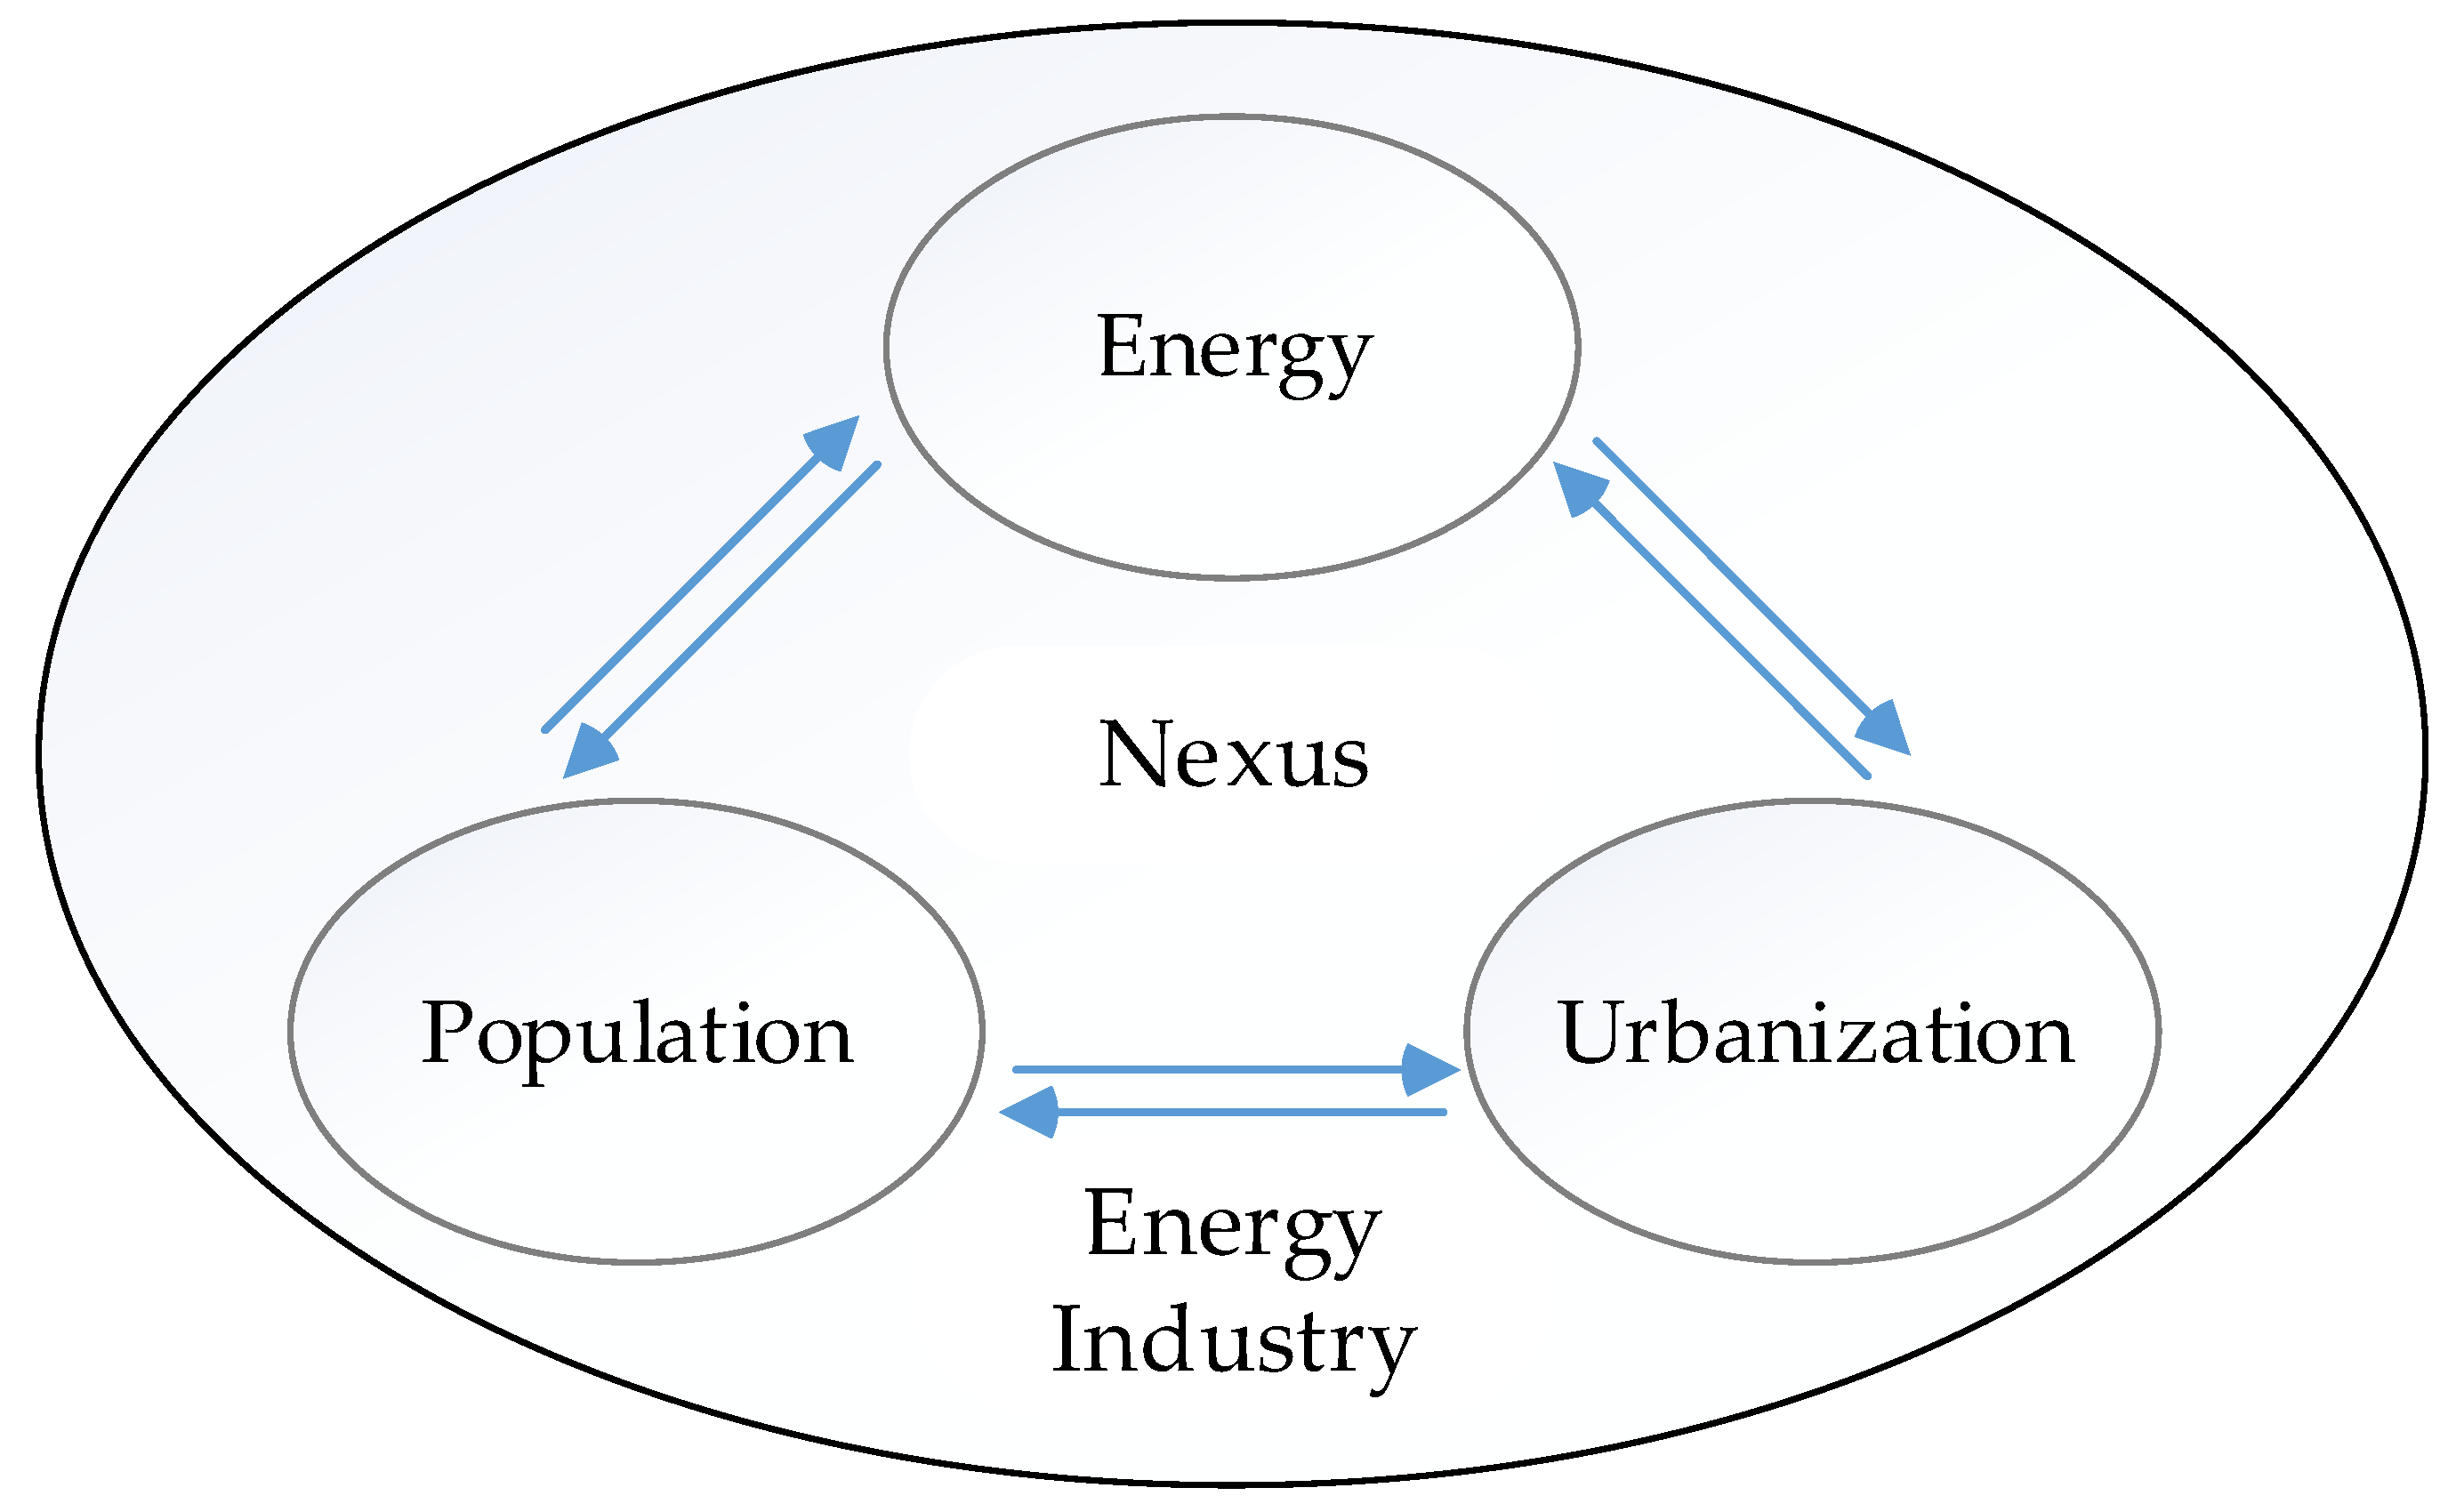
3. Interaction among Energy, Population, and Urbanization
3.1. Effects of Energy Industry Establishment on Population
3.2. Effects of Energy Industry Establishment on Urbanization
3.3. Effects of the Population on Energy
3.4. Effects of the Population on Urbanization
3.5. Effects of Urbanization on Energy
3.6. Effects of Urbanization on Population
4. Methodology
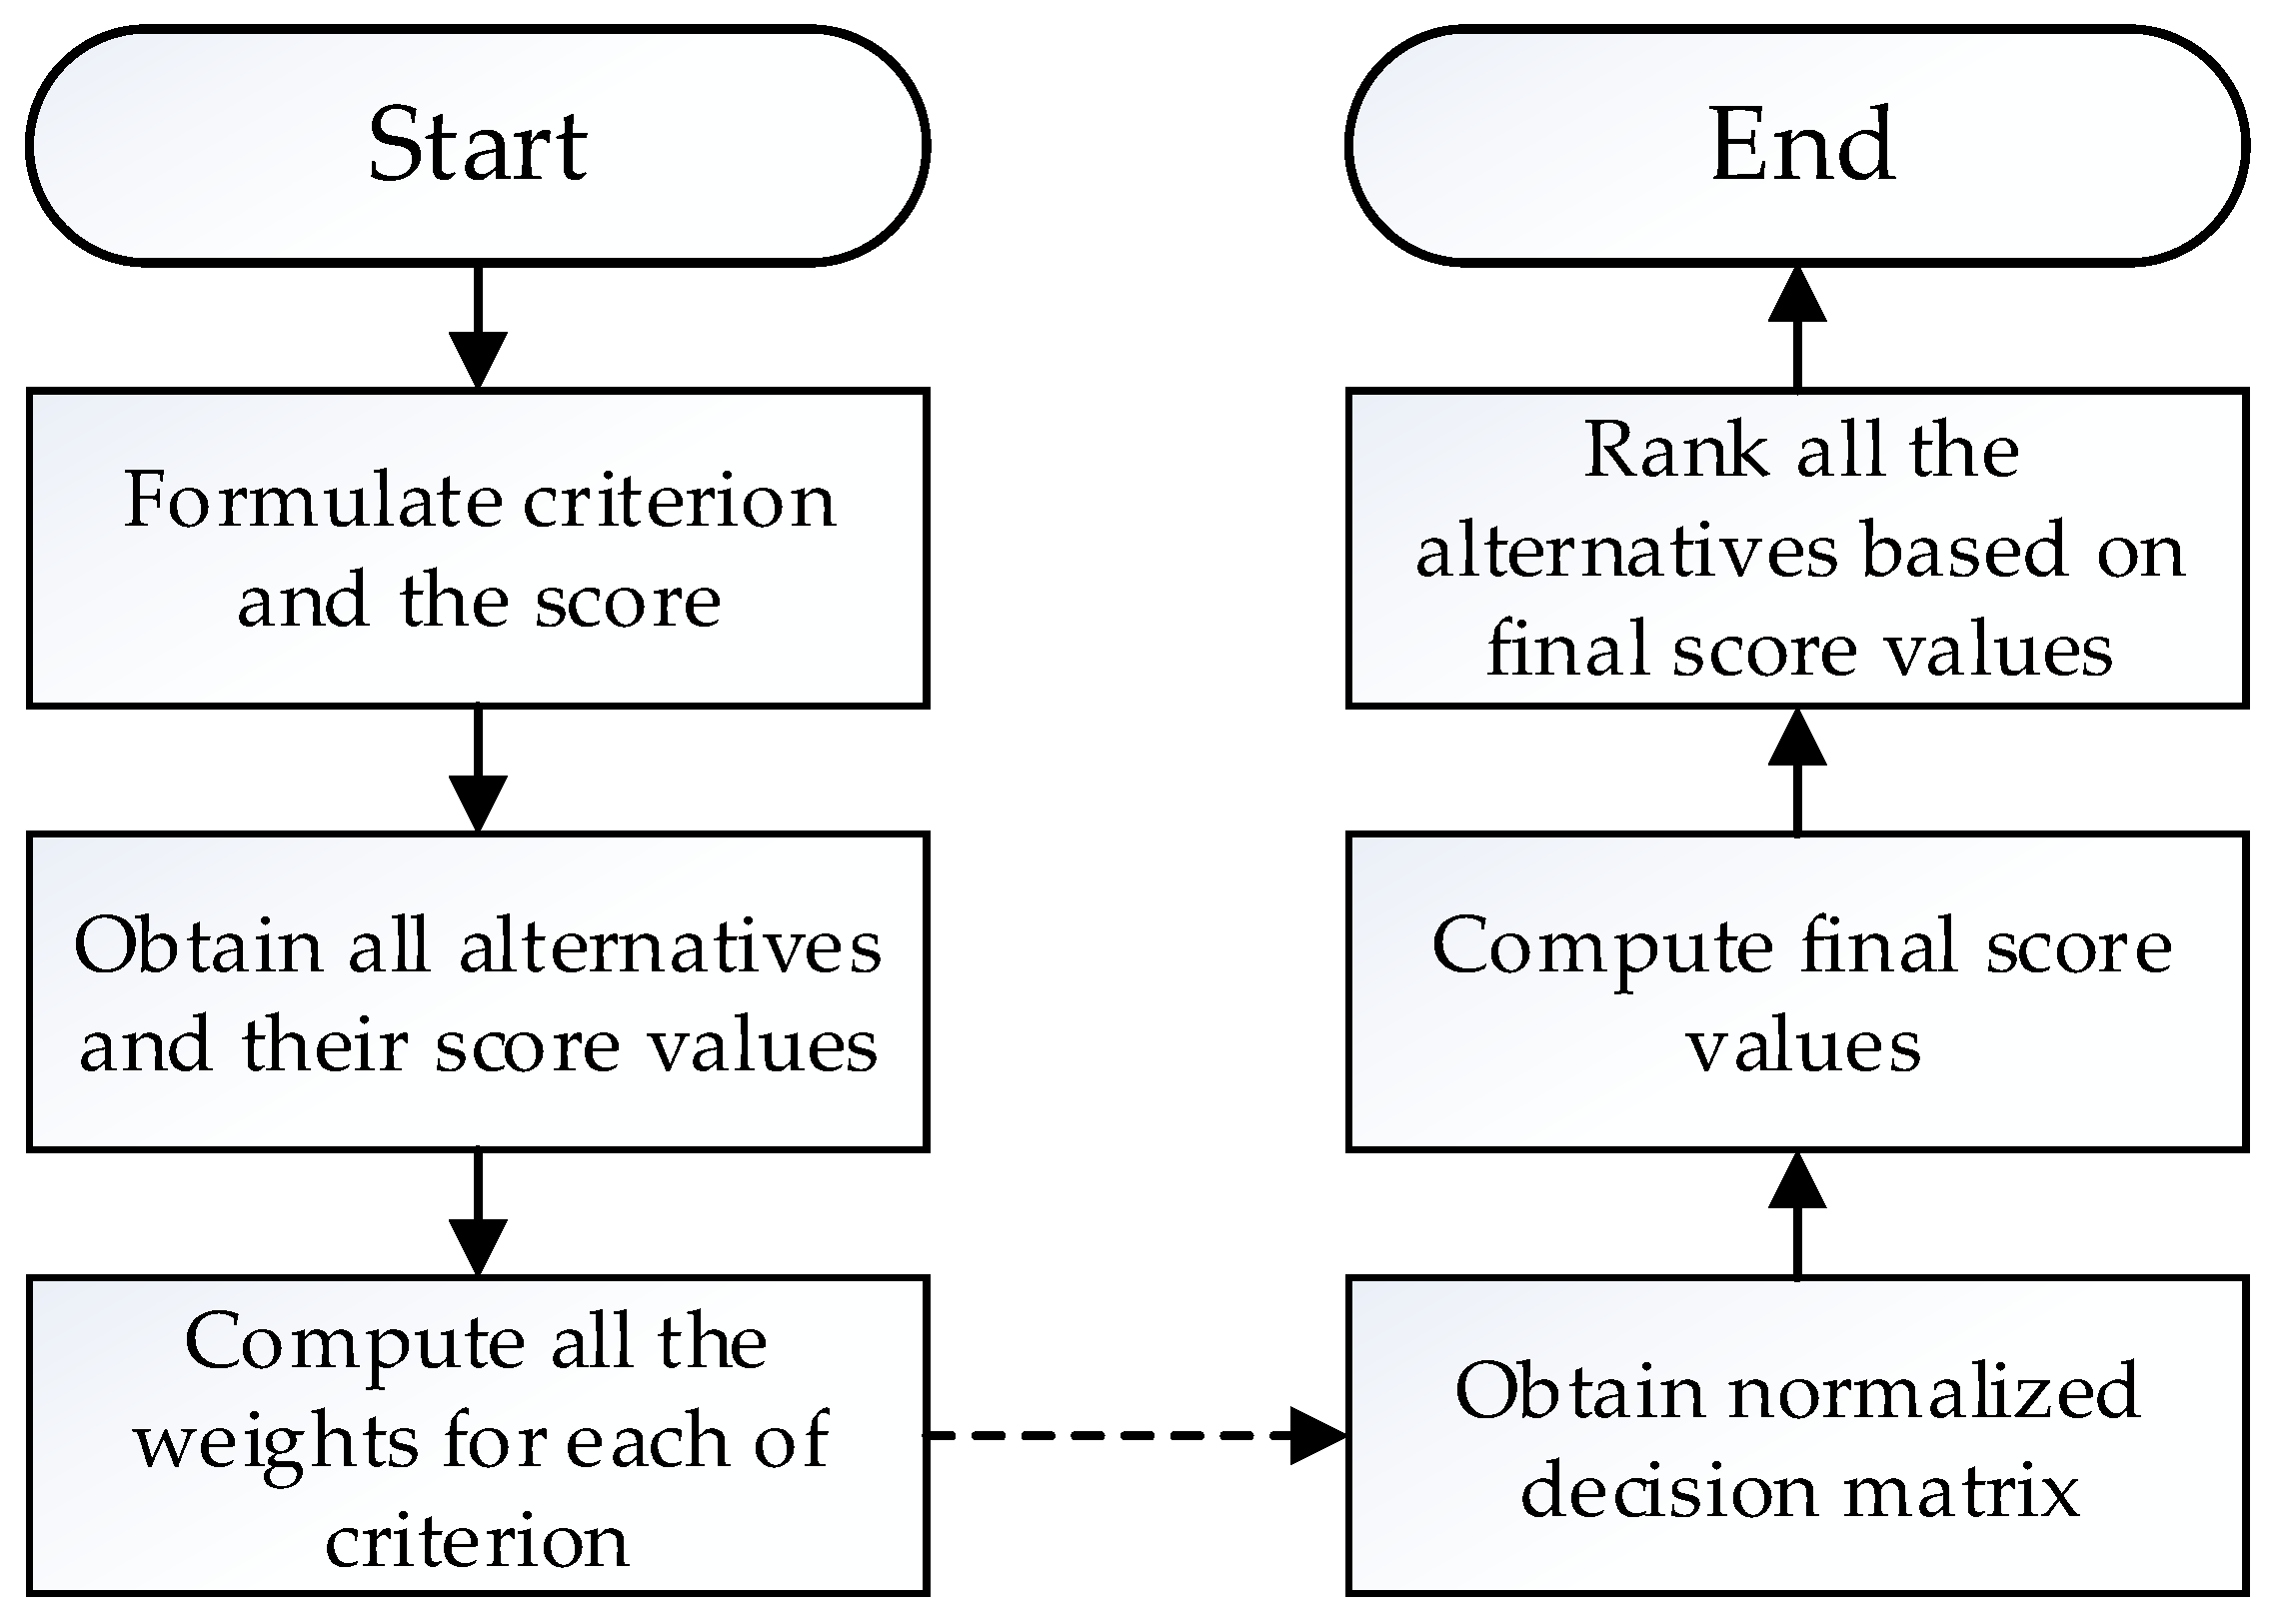
4.1. Simple Additive Weighting Method
- Step 1.
- Establish suitable criteria.
- Step 2.
- Find the score for each alternative of the criteria chosen in Step 1.
- Step 3.
- Construct a decision matrix based on the chosen criteria.
- Step 4.
- Normalize decision matrix.
- Step 5.
- Obtain the best alternative based on the values of the normalization matrix.
4.2. Weighted Product Method
4.3. TOPSIS Method
- Step 1.
- Perform the ranking of alternatives according to Equation (3). The number of alternatives n and number of attributes m may be the same or different.
- Step 2.
- Construct weight normalized decision matrix as in Equation (4). Weight of each alternative is chosen using an objective approach or subjective approach.
- Step 3.
- Determine probable solution vector as in Equation (5).
- Step 4.
- Calculate distance to the solution of the best alternative and worst alternative as given in Equations (6) and (7) respectively.
- Step 5.
- Obtain rank for each alternative as in Equation (8) and put the ranks in descending order in order to choose the best alternative.
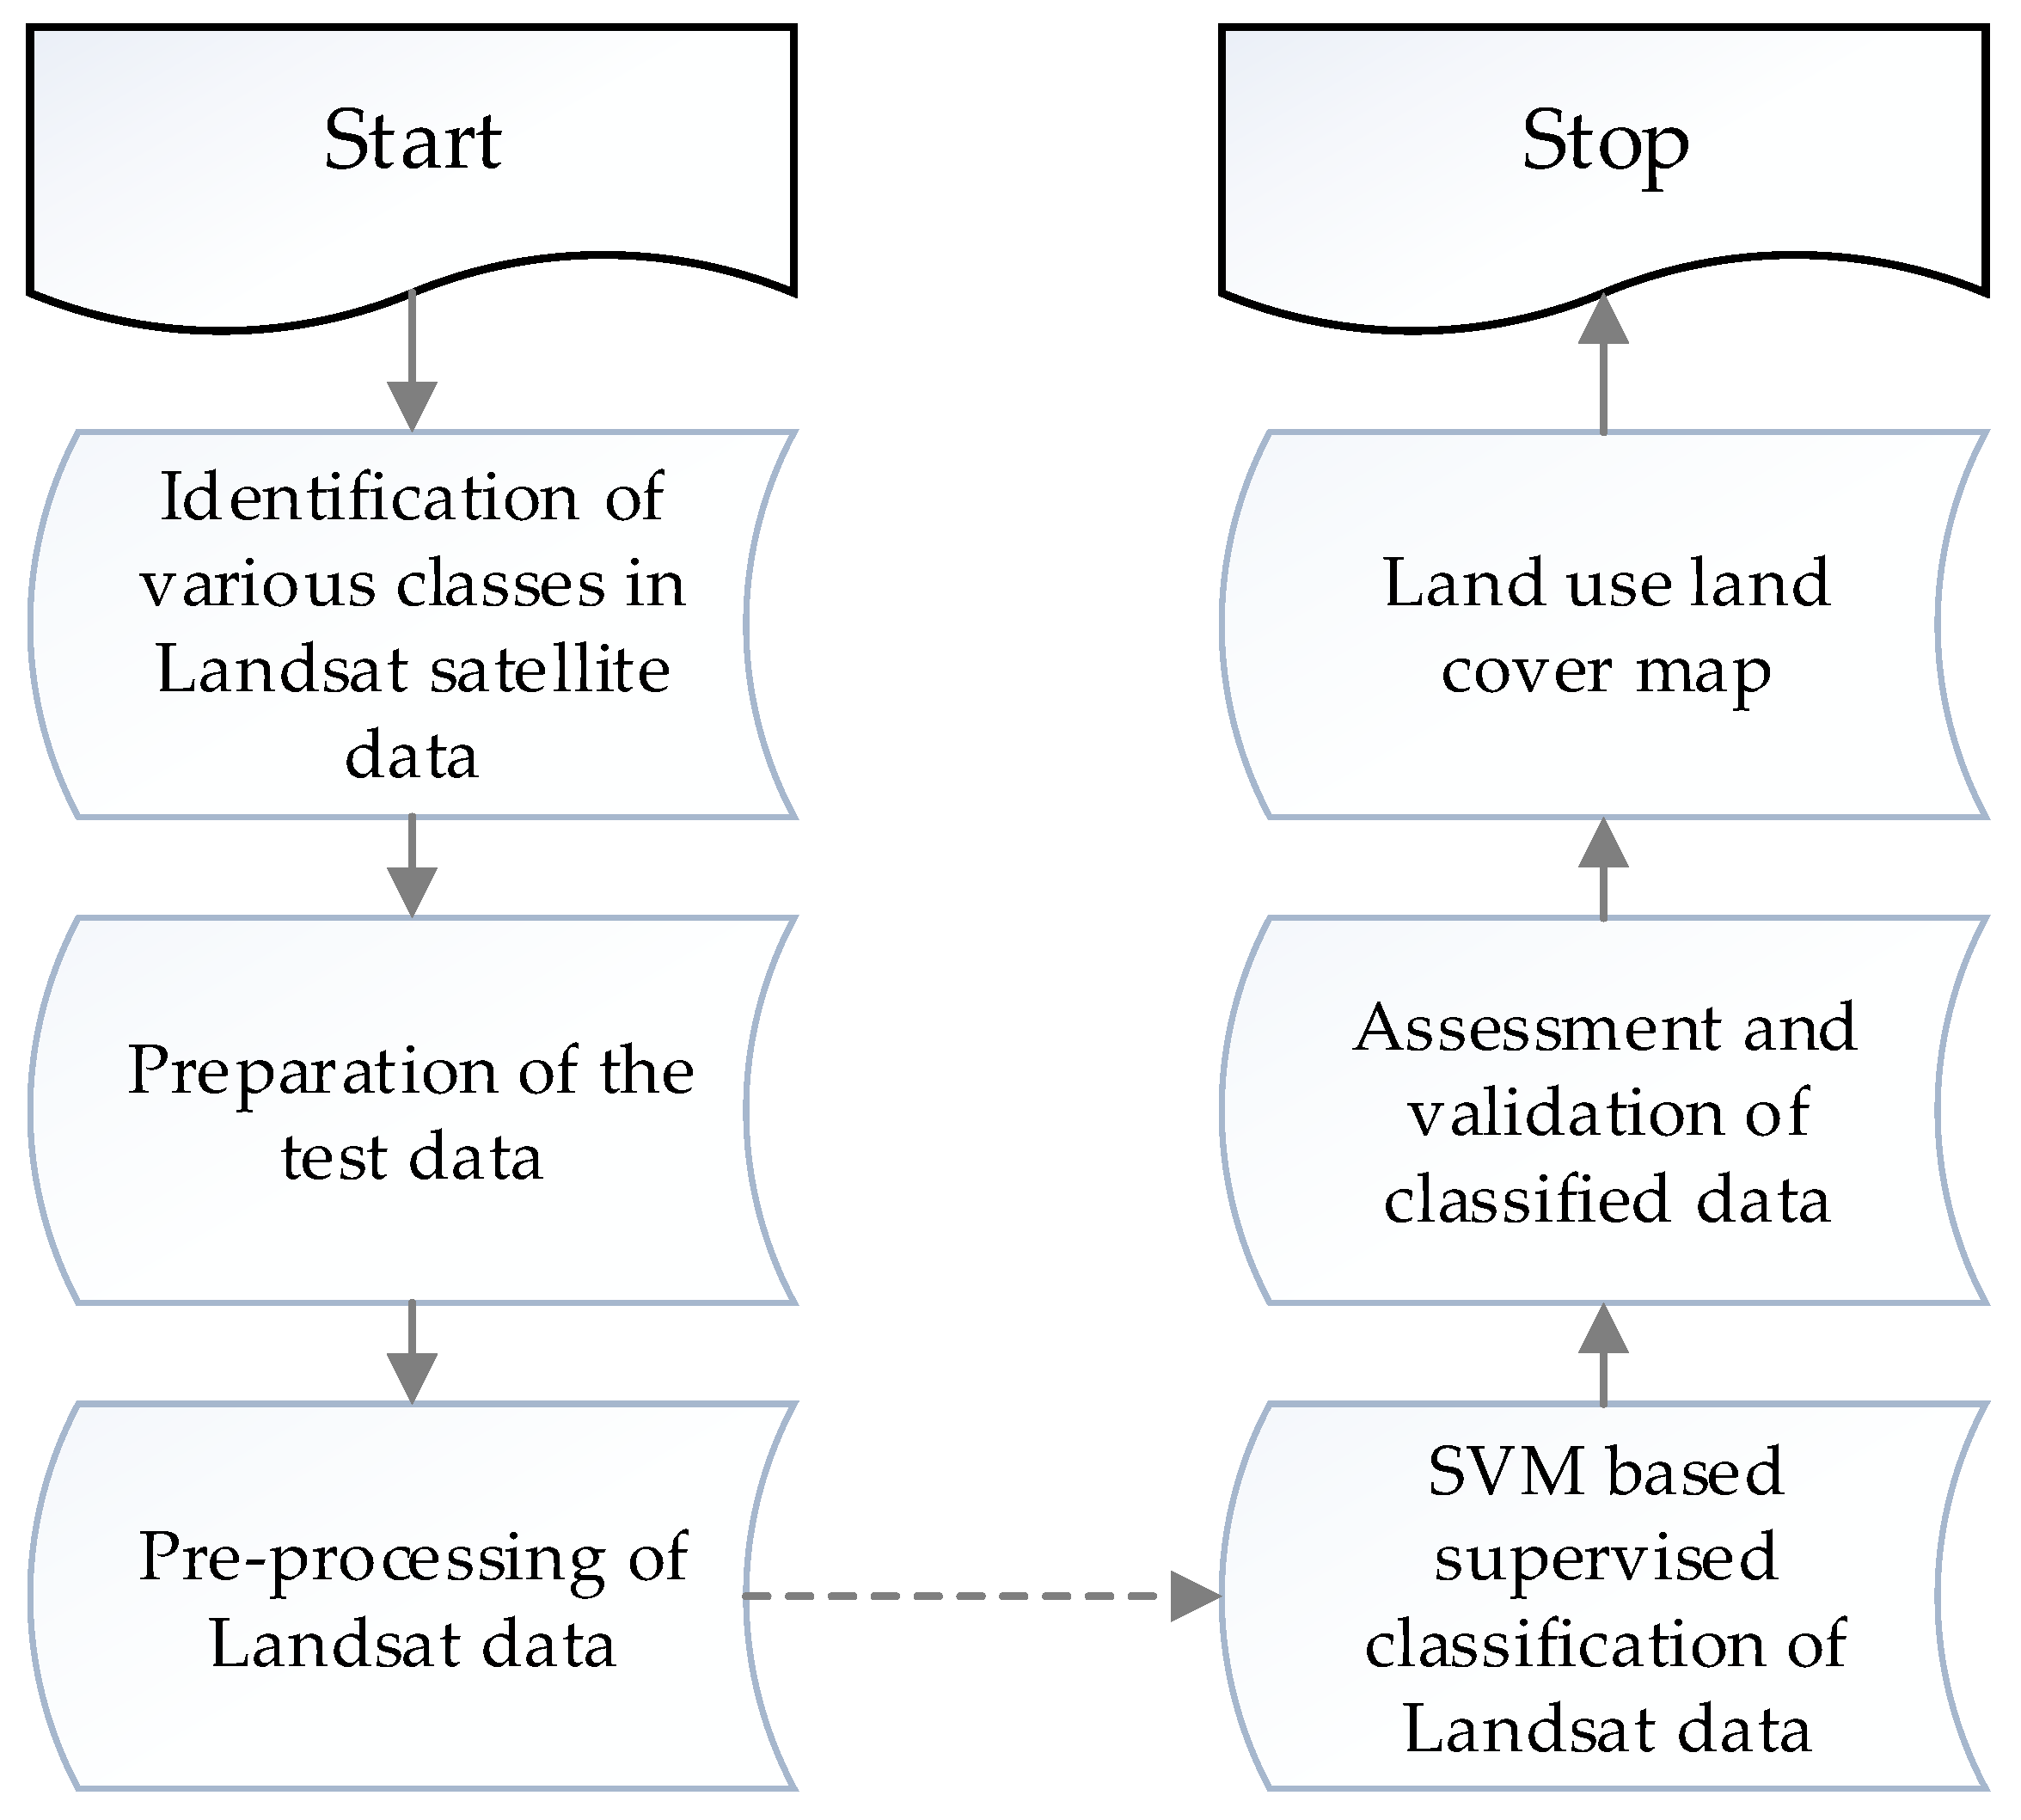
4.4. Remote Sensing Data
4.5. Census Data
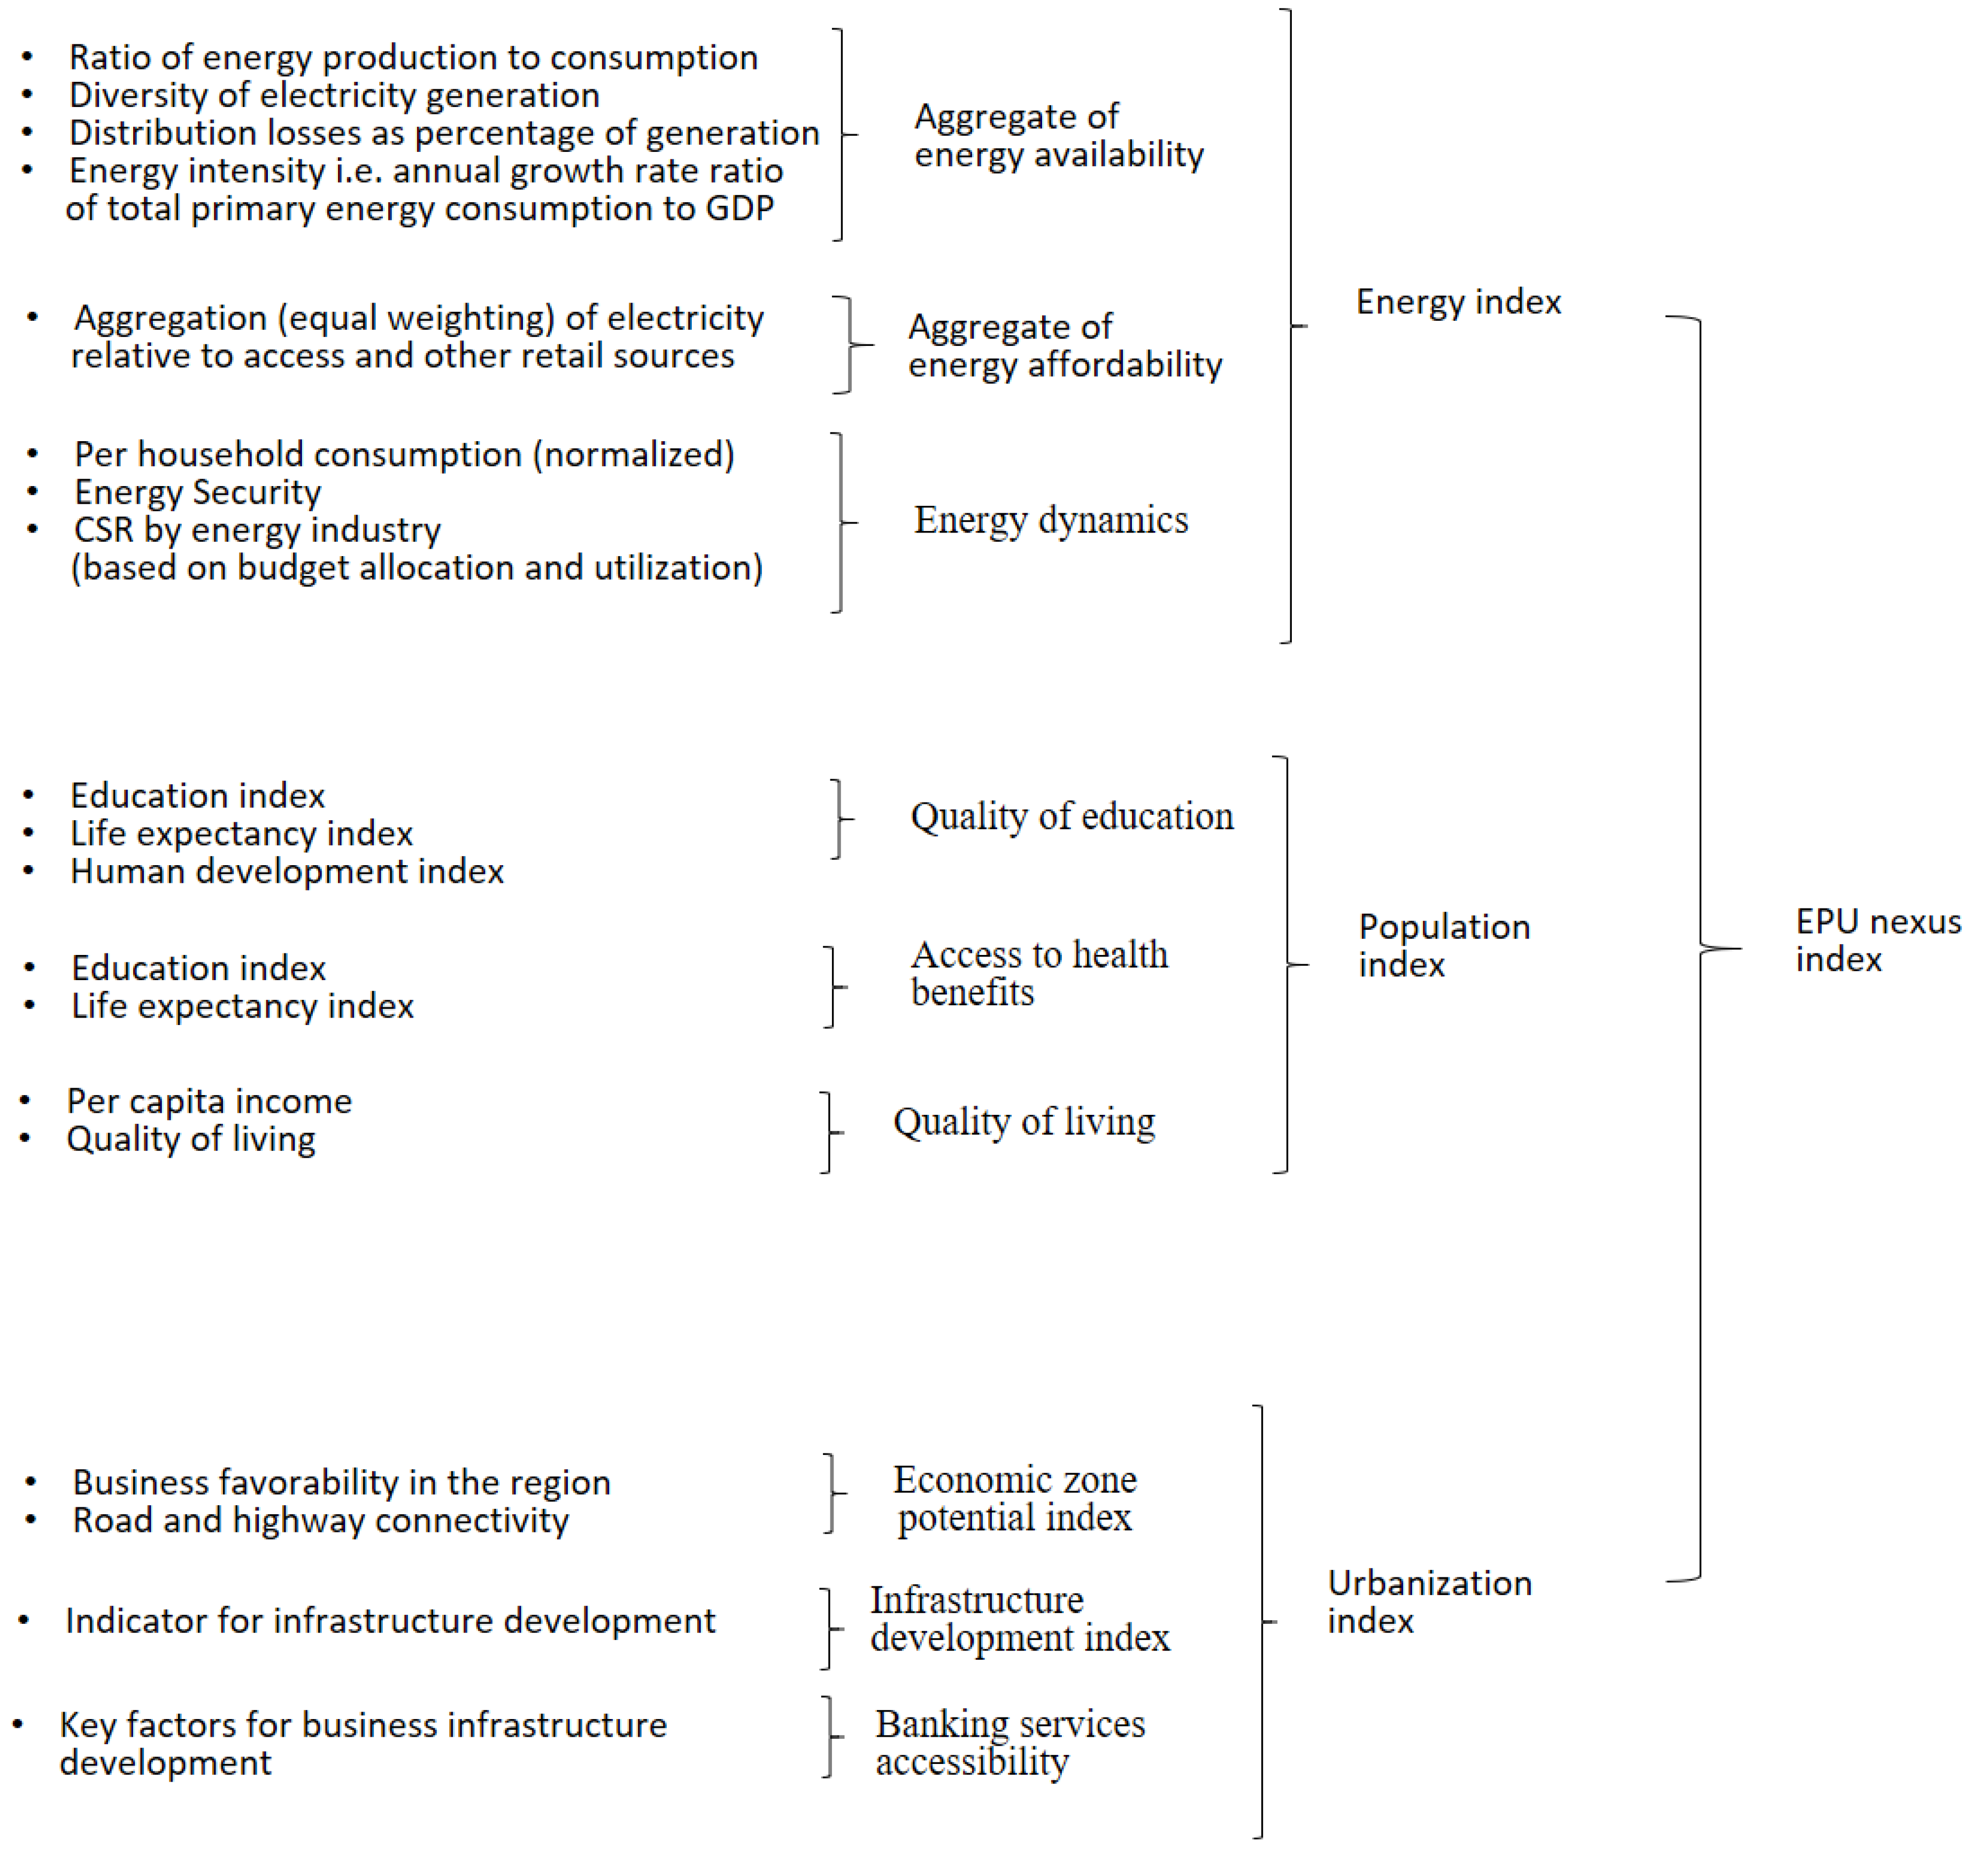
4.6. Selection of Indicators for EPU Nexus Index
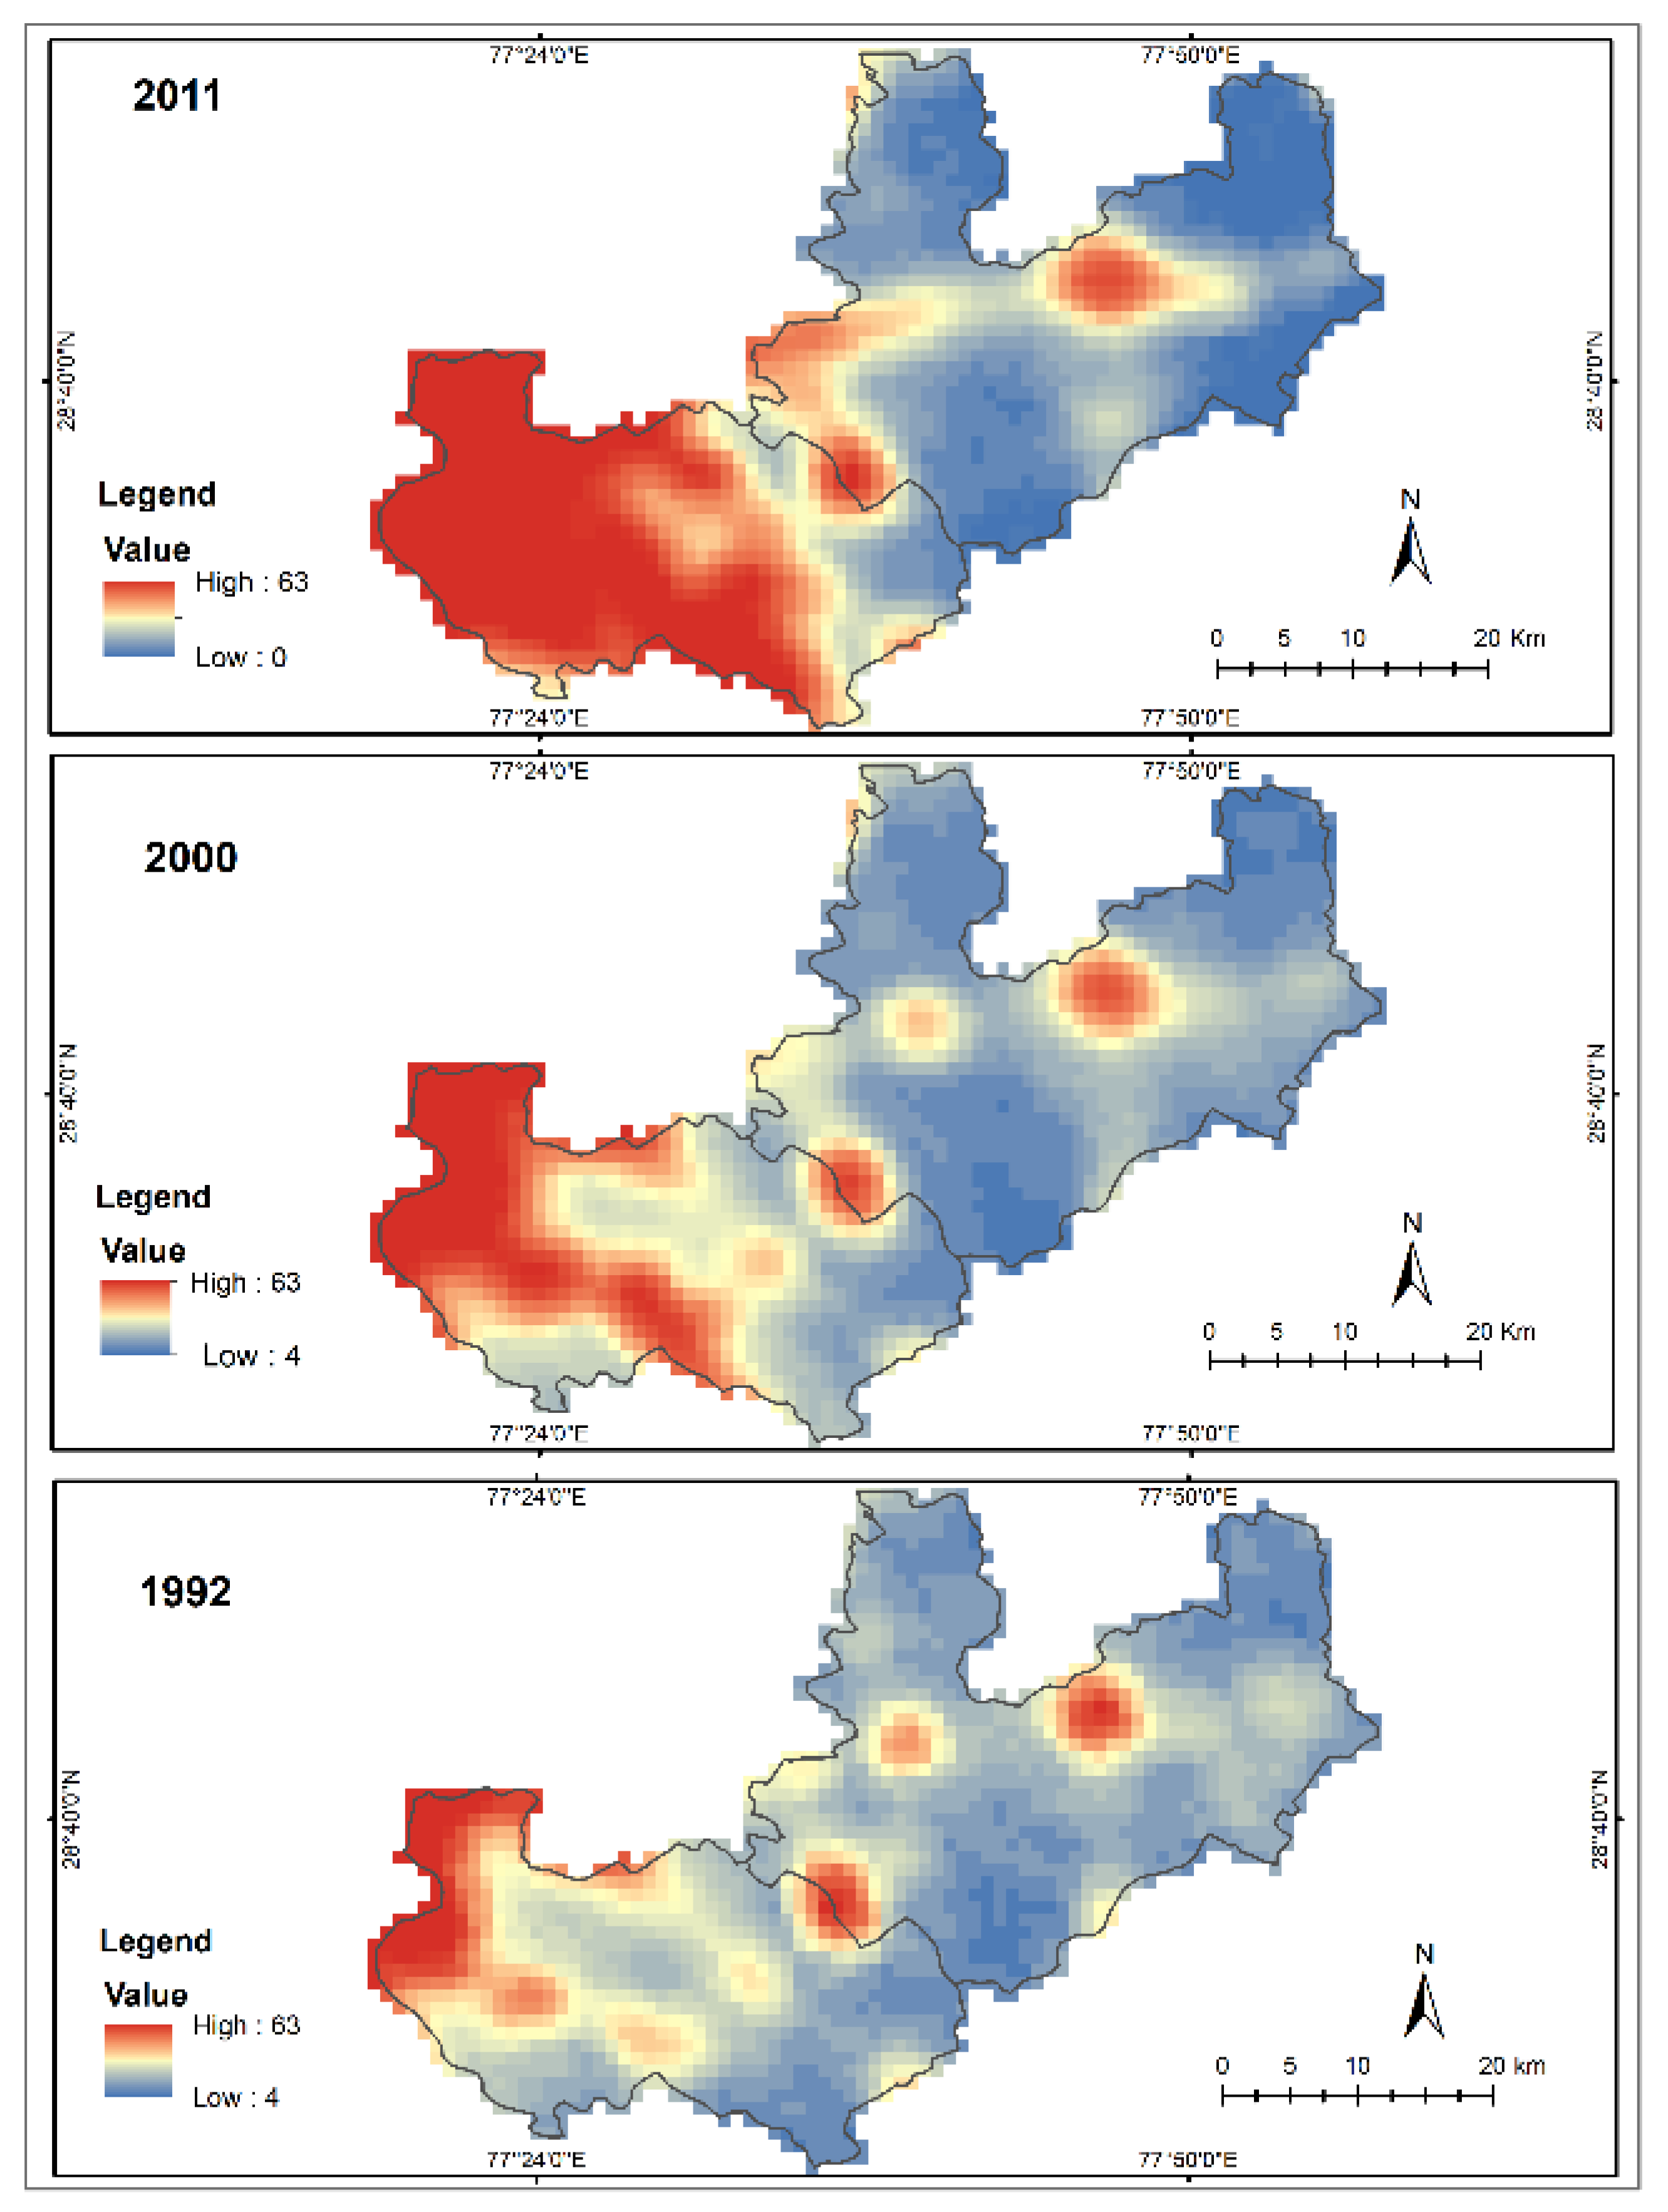
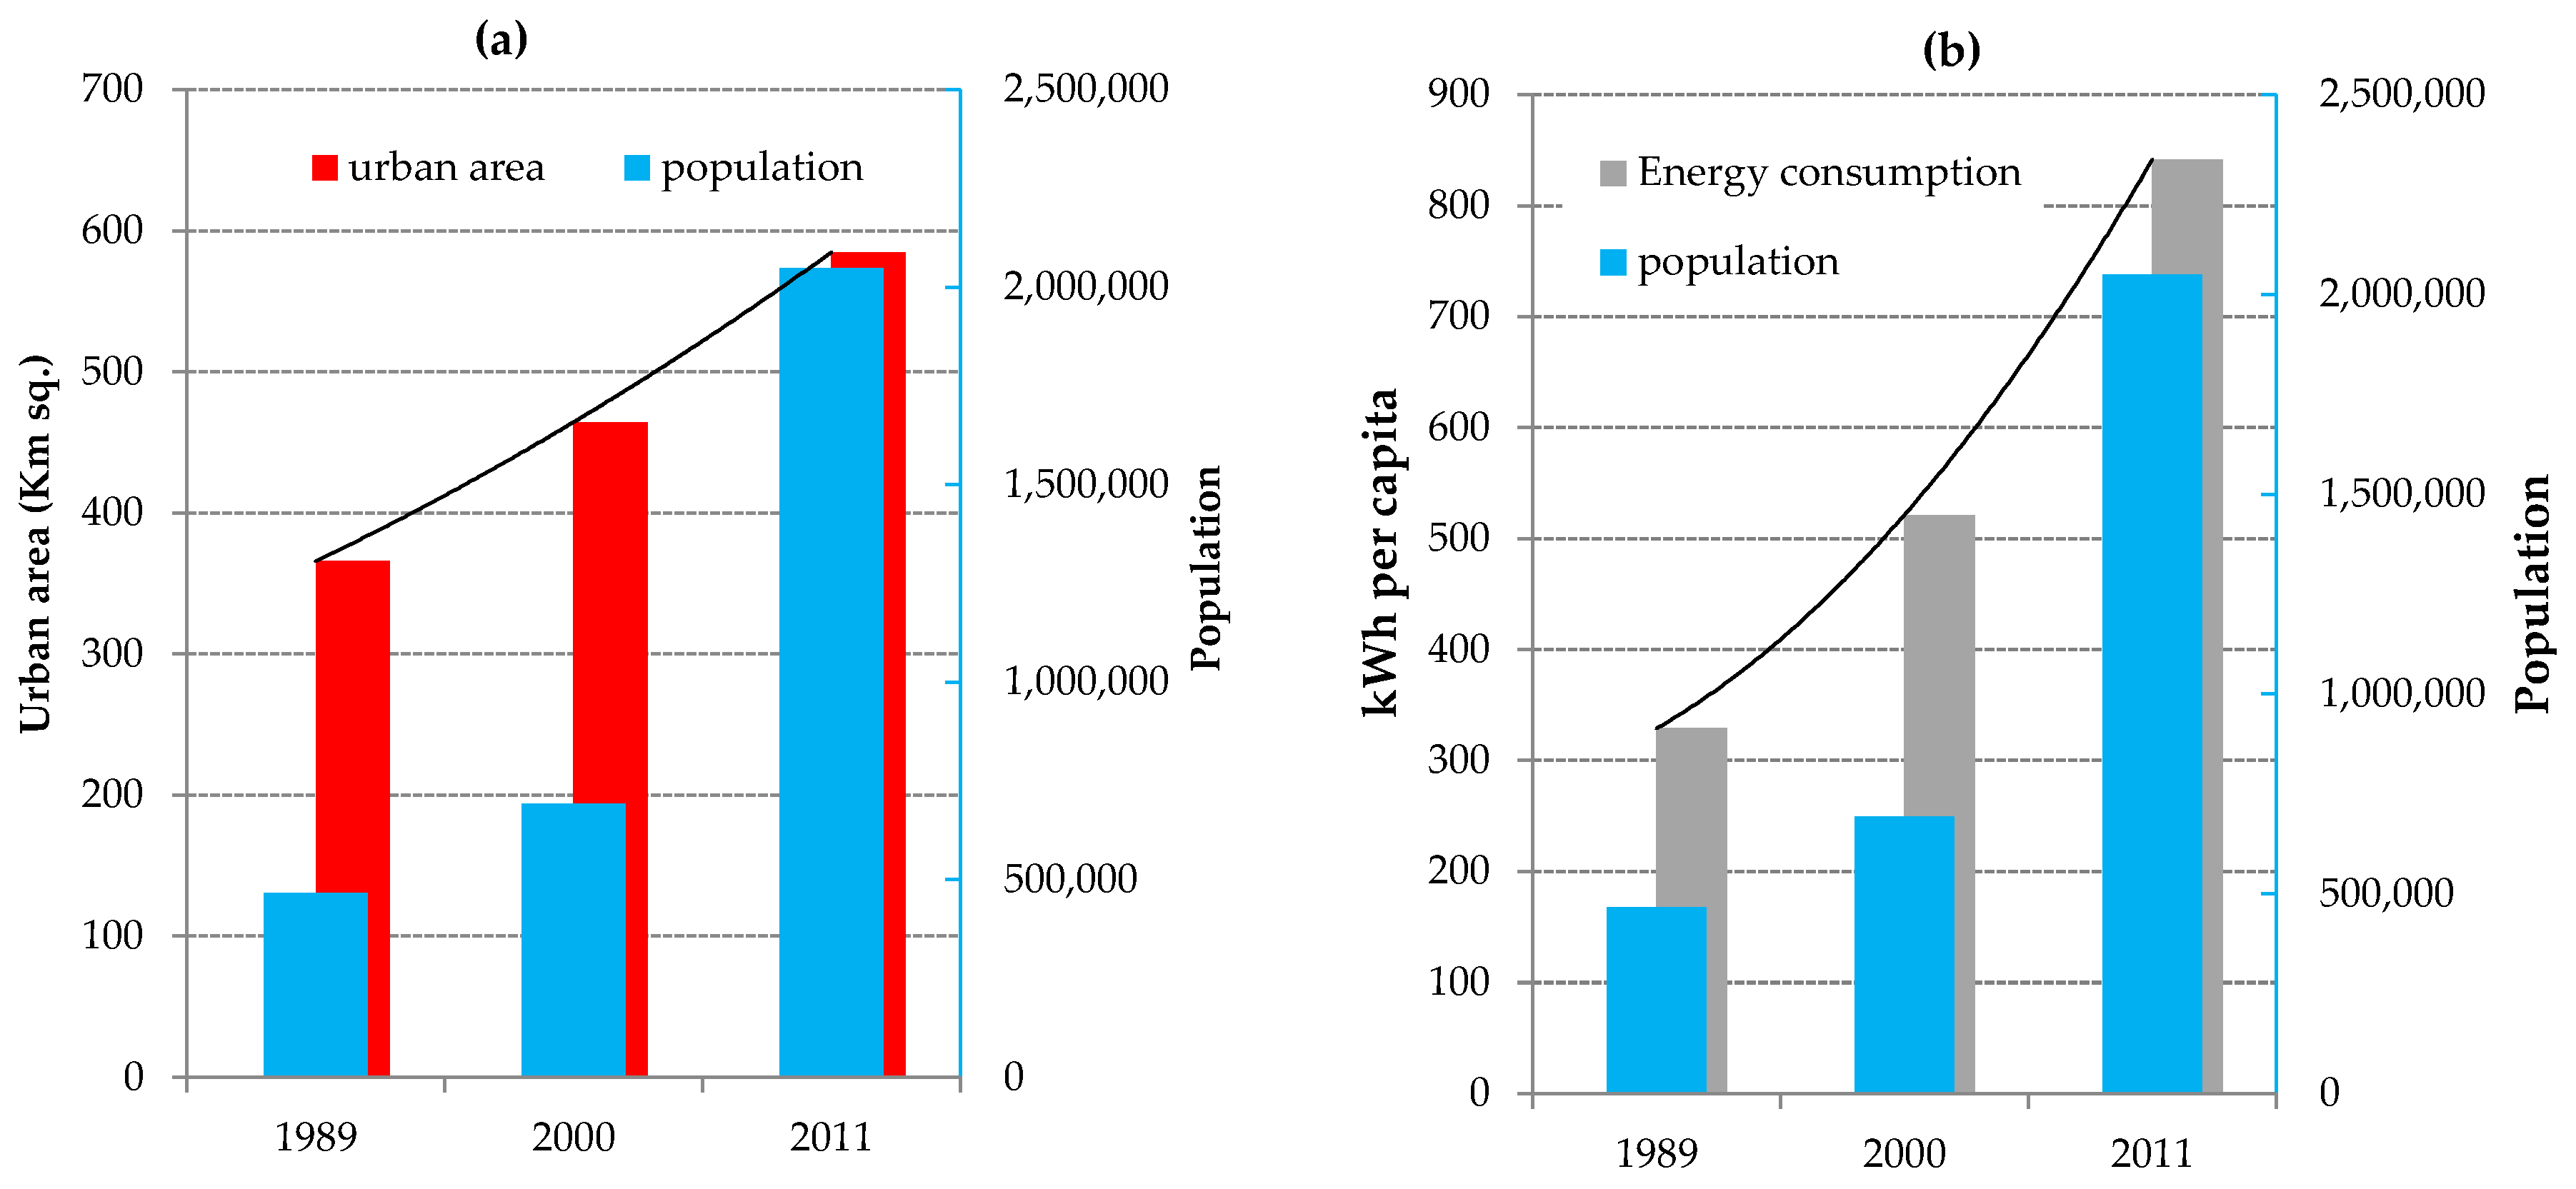
5. Results and Discussion
6. Conclusions
Author Contributions
Funding
Acknowledgments
Conflicts of Interest
Appendix A

| Urban Area | Vegetation | Water | Scrub Land | Total (Producer) | Producer’s Accuracy (%) | |
|---|---|---|---|---|---|---|
| Urban Area | 20 | 1 | 0 | 2 | 23 | 86.96% |
| Vegetation | 2 | 23 | 0 | 1 | 26 | 88.46% |
| Water | 0 | 0 | 10 | 1 | 11 | 90.91% |
| Scrub land | 2 | 1 | 1 | 13 | 17 | 76.47% |
| Total (User) | 24 | 25 | 11 | 17 | 77 | |
| User Accuracy (%) | 83.33% | 92.00% | 90.91% | 76.47% |
References
- Caetano, N.S.; Mata, T.M.; Martins, A.A.; Felgueiras, M.C. New Trends in Energy Production and Utilization. Energy Procedia 2017, 107, 7–14. [Google Scholar] [CrossRef]
- Dale, V.H.; Efroymson, R.A.; Kline, K.L. The land use-climate change-energy nexus. Landsc. Ecol. 2011, 26, 755–773. [Google Scholar] [CrossRef]
- Barthelmie, R.J.; Morris, S.D.; Schechter, P. Carbon neutral Biggar: Calculating the community carbon footprint and renewable energy options for footprint reduction. Sustain. Sci. 2008, 3, 267–282. [Google Scholar] [CrossRef]
- Avtar, R.; Tripathi, S.; Aggarwal, A.K.; Kumar, P. Population-Urbanization-Energy Nexus: A Review. Resources 2019, 8, 136. [Google Scholar] [CrossRef]
- Kumar, S.; Bhattacharyya, B.; Gupta, V.K. Present and Future Energy Scenario in India. J. Inst. Eng. Ser. B 2014, 95, 247–254. [Google Scholar] [CrossRef]
- Endo, A.; Tsurita, I.; Burnett, K.; Orencio, P.M. A review of the current state of research on the water, energy, and food nexus. J. Hydrol. Reg. Stud. 2017, 11, 20–30. [Google Scholar] [CrossRef] [Green Version]
- Pardoe, J.; Conway, D.; Namaganda, E.; Vincent, K.; Dougill, A.J.; Kashaigili, J.J. Climate change and the water–energy–food nexus: Insights from policy and practice in Tanzania. Clim. Policy 2018, 18, 863–877. [Google Scholar] [CrossRef]
- Lambin, E.F.; Geist, H.J.; Lepers, E. Dynamics of Land-Use and Land-Cover Change in Tropical Regions. Annu. Rev. Environ. Resour. 2003, 28, 205–241. [Google Scholar] [CrossRef] [Green Version]
- Pandey, Y.; Tare, V. Utilization of Coal Mixed Waste Aggregates Available at Thermal Power Plants for GSB and Asphalt Mixtures. Procedia Eng. 2016, 143, 170–177. [Google Scholar] [CrossRef] [Green Version]
- Coal Based Power Stations|NTPC. Available online: https://www.ntpc.co.in/power-generation/coal-based-power-stations/dadri (accessed on 21 June 2019).
- The Top 10 Biggest Thermal Power Plants in India. Available online: https://www.power-technology.com/features/feature-the-top-10-biggest-thermal-power-plants-in-india/ (accessed on 21 June 2019).
- Leck, H.; Conway, D.; Bradshaw, M.; Rees, J. Tracing the Water-Energy-Food Nexus: Description, Theory and Practice. Geogr. Compass 2015, 9, 445–460. [Google Scholar] [CrossRef]
- Momblanch, A.; Papadimitriou, L.; Jain, S.K.; Kulkarni, A.; Ojha, C.S.P.; Adeloye, A.J.; Holman, I.P. Untangling the water-food-energy-environment nexus for global change adaptation in a complex Himalayan water resource system. Sci. Total Environ. 2019, 655, 35–47. [Google Scholar] [CrossRef] [PubMed]
- Covarrubias, M. The nexus between water, energy and food in cities: Towards conceptualizing socio-material interconnections. Sustain. Sci. 2019, 14, 277–287. [Google Scholar] [CrossRef]
- Williams, J.; Bouzarovski, S.; Swyngedouw, E. The urban resource nexus: On the politics of relationality, water–energy infrastructure and the fallacy of integration. Environ. Plan. C Politics Space 2018, 37, 652–669. [Google Scholar] [CrossRef]
- Peak People: The Interrelationship between Population Growth and Energy Resources-Resilience. Available online: https://www.resilience.org/stories/2009-04-20/peak-people-interrelationship-between-population-growth-and-energy-resources/ (accessed on 21 June 2019).
- Holdren, J.P. Population and the energy problem. Popul. Environ. 1991, 12, 231–255. [Google Scholar] [CrossRef]
- Unfair and Unbalanced—How Will Population Growth Affect Energy?|HowStuffWorks. Available online: https://science.howstuffworks.com/environmental/energy/population-growth-affect-energy1.htm (accessed on 21 June 2019).
- De Sherbinin, A.; Carr, D.; Cassels, S.; Jiang, L. Population and enviornment. Annu. Rev. Environ. Resour. 2007, 32, 345–373. [Google Scholar] [CrossRef]
- Jones, D.W. How urbanization affects energy-use in developing countries. Energy Policy 1991, 19, 621–630. [Google Scholar] [CrossRef]
- Seto, K.C.; Güneralp, B.; Hutyra, L.R. Global forecasts of urban expansion to 2030 and direct impacts on biodiversity and carbon pools. Proc. Natl. Acad. Sci. USA 2012, 109, 16083–16088. [Google Scholar] [CrossRef] [Green Version]
- Pohekar, S.D.; Ramachandran, M. Application of multi-criteria decision making to sustainable energy planning—A review. Renew. Sustain. Energy Rev. 2004, 8, 365–381. [Google Scholar] [CrossRef]
- Qin, X.S.; Huang, G.H.; Chakma, A.; Nie, X.H.; Lin, Q.G. A MCDM-based expert system for climate-change impact assessment and adaptation planning—A case study for the Georgia Basin, Canada. Expert Syst. Appl. 2008, 34, 2164–2179. [Google Scholar] [CrossRef]
- Ciptayani, P.I.; Dewi, K.C. Decision support system of e-book provider selection for library using Simple Additive Weighting. J. Phys. Conf. Ser. 2018, 953. [Google Scholar] [CrossRef]
- Setyawan, A.; Arini, F.Y.; Akhlis, I. Comparative Analysis of Simple Additive Weighting Method and Weighted Product Method to New Employee Recruitment Decision Support System (DSS) at PT. Warta Media Nusantara. Sci. J. Inform. 2017, 4, 34–42. [Google Scholar] [CrossRef] [Green Version]
- Fitriasari, N.S.; Fitriani, S.A.; Sukamto, R.A. Comparison of weighted product method and technique for order preference by similarity to ideal solution method: Complexity and accuracy. In Proceedings of the 2017 3rd International Conference on Science in Information Technology: Theory and Application of IT for Education, Industry and Society in Big Data Era (ICSITech 2017), Bandung, Indonesia, 25–26 October 2017; pp. 453–458. [Google Scholar]
- USGS Earth Explorer. Available online: https://earthexplorer.usgs.gov/ (accessed on 1 May 2019).
- Chavare, S. Application of Remote Sensing and GIS in Landuse and Land Cover Mapping of Sub-Watershed of Wardha River Basin. In Proceedings of the National Conference on Development & Planning for Drought Prone Areas, India, 23–24 January 2015; pp. 221–224. [Google Scholar]
- Avtar, R.; Kumar, P.; Oono, A.; Saraswat, C.; Dorji, S.; Hlaing, Z. Potential application of remote sensing in monitoring ecosystem services of forests, mangroves and urban areas. Geocarto Int. 2016, 32, 1–12. [Google Scholar] [CrossRef]
- Avtar, R.; Sawada, H.; Kumar, P. Role of remote sensing and community forestry to manage forests for the effective implementation of REDD+ mechanism: A case study on Cambodia. Environ. Dev. Sustain. 2013, 15, 1593–1603. [Google Scholar] [CrossRef]
- Avtar, R.; Singh, C.K.; Shashtri, S.; Mukherjee, S. Identification of erosional and inundation hazard zones in Ken–Betwa river linking area, India, using remote sensing and GIS. Environ. Monit. Assess. 2011, 182, 341–360. [Google Scholar] [CrossRef]
- Arora, K.; Aggarwal, A.K. Approaches for Image Database Retrieval Based on Color, Texture, and Shape Features. In Handbook of Research on Advanced Concepts in Real-Time Image and Video Processing; IGI Global: Hershey, PA, USA, 2017; pp. 28–50. [Google Scholar]
- Avtar, R.; Herath, S.; Saito, O.; Gera, W.; Singh, G.; Mishra, B.; Takeuchi, K. Application of remote sensing techniques toward the role of traditional water bodies with respect to vegetation conditions. Environ. Dev. Sustain. 2014, 16, 995–1011. [Google Scholar] [CrossRef]
- Foody, G.M.; Mathur, A. Toward intelligent training of supervised image classifications: Directing training data acquisition for SVM classification. Remote Sens. Environ. 2004, 93, 107–117. [Google Scholar] [CrossRef]
- Cortes, C.; Vapnik, V. Support-Vector Networks. Mach. Learn. 1995, 20, 273–297. [Google Scholar] [CrossRef]
- Minh, H.V.T.; Avtar, R.; Mohan, G.; Misra, P.; Kurasaki, M. Monitoring and Mapping of Rice Cropping Pattern in Flooding Area in the Vietnamese Mekong Delta Using Sentinel-1A Data: A Case of An Giang Province. ISPRS Int. J. Geo-Inf. 2019, 8, 211. [Google Scholar] [CrossRef]
- Pai, M. Ensemble of support vector machines for land cover classification. Int. J. Remote Sens. 2008, 29, 3043–3049. [Google Scholar]
- Cavur, M.; Kemec, S.; Nabdel, L.; Sebnem Duzgun, H. An evaluation of land use land cover (LULC) classification for urban applications with Quickbird and WorldView2 data. In Proceedings of the 2015 Joint Urban Remote Sensing Event (JURSE), Lausanne, Switzerland, 30 May–1 April 2015; pp. 1–4. [Google Scholar]
- Elvidge, C.D.; Hsu, F.-C.; Baugh, K.E.; Ghosh, T. National trends in satellite-observed lighting. Glob. Urban Monit. Assess. Through Earth Obs. 2014, 23, 97–118. [Google Scholar]
- Elvidge, C.D.; Baugh, K.E.; Dietz, J.B.; Bland, T.; Sutton, P.C.; Kroehl, H.W. Radiance calibration of DMSP-OLS low-light imaging data of human settlements. Remote Sens. Environ. 1999, 68, 77–88. [Google Scholar] [CrossRef]
- NOAA Defense Meteorological Satellite Program. Available online: https://ngdc.noaa.gov/ngdc.html (accessed on 1 May 2019).
- Townsend, A.C.; Bruce, D.A. The use of night-time lights satellite imagery as a measure of Australia’s regional electricity consumption and population distribution. Int. J. Remote Sens. 2010, 31, 4459–4480. [Google Scholar] [CrossRef]
- Min, B.; Mensan Gaba, K. Tracking Electrification in Vietnam Using Nighttime Lights. Remote Sens. 2014, 6, 9511–9529. [Google Scholar] [CrossRef] [Green Version]
- Dugoua, E.; Kennedy, R.; Urpelainen, J. Satellite data for the social sciences: Measuring rural electrification with night-time lights. Int. J. Remote Sens. 2018, 39, 2690–2701. [Google Scholar] [CrossRef]
- Barton, J.O.E.; Weiner, A.D.; York, N.; Harper, G.; Lance, L. American Energy Security and Innovation: Generation Portfolio; CreateSpace Independent Publishing Platform: Scotts Valley, CA, USA, 2013; pp. 1–135. [Google Scholar]
- An Energy Security Index for India. 2016. Shakti Sustainable Energy Foundation report. Available online: https://shaktifoundation.in/report/india-energy-security-index/ (accessed on 26 August 2018).
- Dhaneshwar, A.; Pandey, P. Status of Corporate Social Responsibility among PSUs in India. India Environ. Portal 2015. [Google Scholar] [CrossRef]
- Maurya, N.K.; Singh, S.; Khare, S. Human Development in Uttar Pradesh: A District Level Analysis. Soc. Sci. Spectr. 2016, 1, 262–278. [Google Scholar]
- Roberts, M. Identifying the Economic Potential of Indian Districts; The World Bank: Washington, DC, USA, 2016. [Google Scholar]
- Kusharjanto, H.; Kim, D. Infrastructure and human development: The case of Java, Indonesia. J. Asia Pac. Econ. 2011, 16, 111–124. [Google Scholar] [CrossRef]
- Adeyemi, O.A.; Ola, O.S.; Oyewole, F.A. Internet Banking Functionality in Nigeria and Outcomes of Customer Satisfaction: An Empirical Investigation. Int. J. Acad. Res. Bus. Soc. Sci. 2014, 4, 50–65. [Google Scholar]
- Stanton, E.A. The Human Development Index: A History. Political Econ. Res. Inst. Work. Pap. Ser. 127 2007, 85, 37. [Google Scholar]
- Monti, A.; Di Virgilio, N.; Venturi, G. Mineral composition and ash content of six major energy crops. Biomass Bioenergy 2008, 32, 216–223. [Google Scholar] [CrossRef] [Green Version]
- Sutton, P.; Roberts, D.; Elvidge, C.; Baugh, K. Census from Heaven: An estimate of the global human population using night-time satellite imagery. Int. J. Remote Sens. 2001, 22, 3061–3076. [Google Scholar] [CrossRef]
- Small, C.; Pozzi, F.; Elvidge, C.D. Spatial analysis of global urban extent from DMSP-OLS night lights. Remote Sens. Environ. 2005, 96, 277–291. [Google Scholar] [CrossRef]
- Imhoff, M.L.; Lawrence, W.T.; Stutzer, D.C.; Elvidge, C.D. A technique for using composite DMSP/OLS “city lights” satellite data to map urban area. Remote Sens. Environ. 1997, 61, 361–370. [Google Scholar] [CrossRef]
- Doll, C.H.; Muller, J.-P.; Elvidge, C.D. Night-time imagery as a tool for global mapping of socioeconomic parameters and greenhouse gas emissions. AMBIO J. Hum. Environ. 2000, 29, 157–163. [Google Scholar] [CrossRef]
- Doll, C.N. Population detection profiles of DMSP-OLS night-time imagery by regions of the world. Proc. Asia-Pac. Adv. Netw. 2010, 30, 190–206. [Google Scholar] [CrossRef]
- Government of India Ministry of Power Center Electricity Authority. Available online: http://cea.nic.in/ (accessed on 1 May 2019).
- Giupponi, C.; Gain, A.K. Integrated spatial assessment of the water, energy and food dimensions of the Sustainable Development Goals. Reg. Environ. Chang. 2017, 17, 1881–1893. [Google Scholar] [CrossRef]


| Region and Population | Gautam Buddha Nagar (District) | Dadri (Sub-District) | ||||
|---|---|---|---|---|---|---|
| 2001 | 2011 | Change | 2001 | 2011 | Change | |
| Total | 202,030 | 4,223,633 | +251.40% | 692,259 | 2,049,262 | +196% |
| Literate | 675,669 | 2,930,045 | +333.65% | 423,431 | 1,469,288 | +346.9% |
| Working | 363,814 | 1,207,404 | +231.90% | 215,524 | 735,666 | +241.3% |
| Indicators | Definition/Notion | Data Source | Value | Weight |
|---|---|---|---|---|
| Aggregate of energy availability | The ratio of energy production to consumption | Central Electricity Authority (CEA) Govt. of India report, average energy deficit | 0.60 | 2 |
| Diversity of electricity generation | Based on power generation capacity i.e., coal 1820 MW, gas 829.78 MW Solar 5 MW, other sources [45] | 0.29 | 1 | |
| Distribution losses as percentage of generation | Uttar Pradesh electricity regulatory commission report | 0.08 | 3 | |
| Energy intensity i.e., annual growth rate ratio of total primary energy consumption to GDP | Central statistics office ministry of statistics and program implementation government of India | 0.45 | 1 | |
| Aggregate of energy affordability | Aggregation (equal weighting) of electricity relative to access and other retail sources | Calculated based on data from district census handbook 2011, Govt. of India UP | 0.54 | 5 |
| Energy dynamics | Per household consumption (normalized) | Calculated based on CEA report | 0.35 | 2 |
| Energy Security | Calculated from McKinsey and Co. Report—An energy security index for India [46] | 0.67 | 4 | |
| CSR by energy industry (based on budget allocation and utilization) | Status of Corporate Social Responsibility among PSUs in India [47] | 0.72 | 3 | |
| Quality of education | Education Index | Human Development in Uttar Pradesh: A District Level Analysis, [48] | 0.76 | 5 |
| Access to health benefits | Life expectancy index | |||
| Quality of living | Human Development Index | |||
| Per capita income | GDP index | Calculated based on GDP of ROI and normalized by DEP deflator process with 2004-05 as base GDP | 0.52 | 2 |
| Business favorability in the region | Economic zone potential index | Identifying the Economic Potential of Indian Districts [49] | 0.60 | 3 |
| Road and highway connectivity | ||||
| Infrastructure development index | Indicator for infrastructure development | Infrastructure and human development [50] | 0.61 | 3 |
| Banking services accessibility | A key factor for business infrastructure development | Census of India 2011 and [51] | 0.75 | 3 |
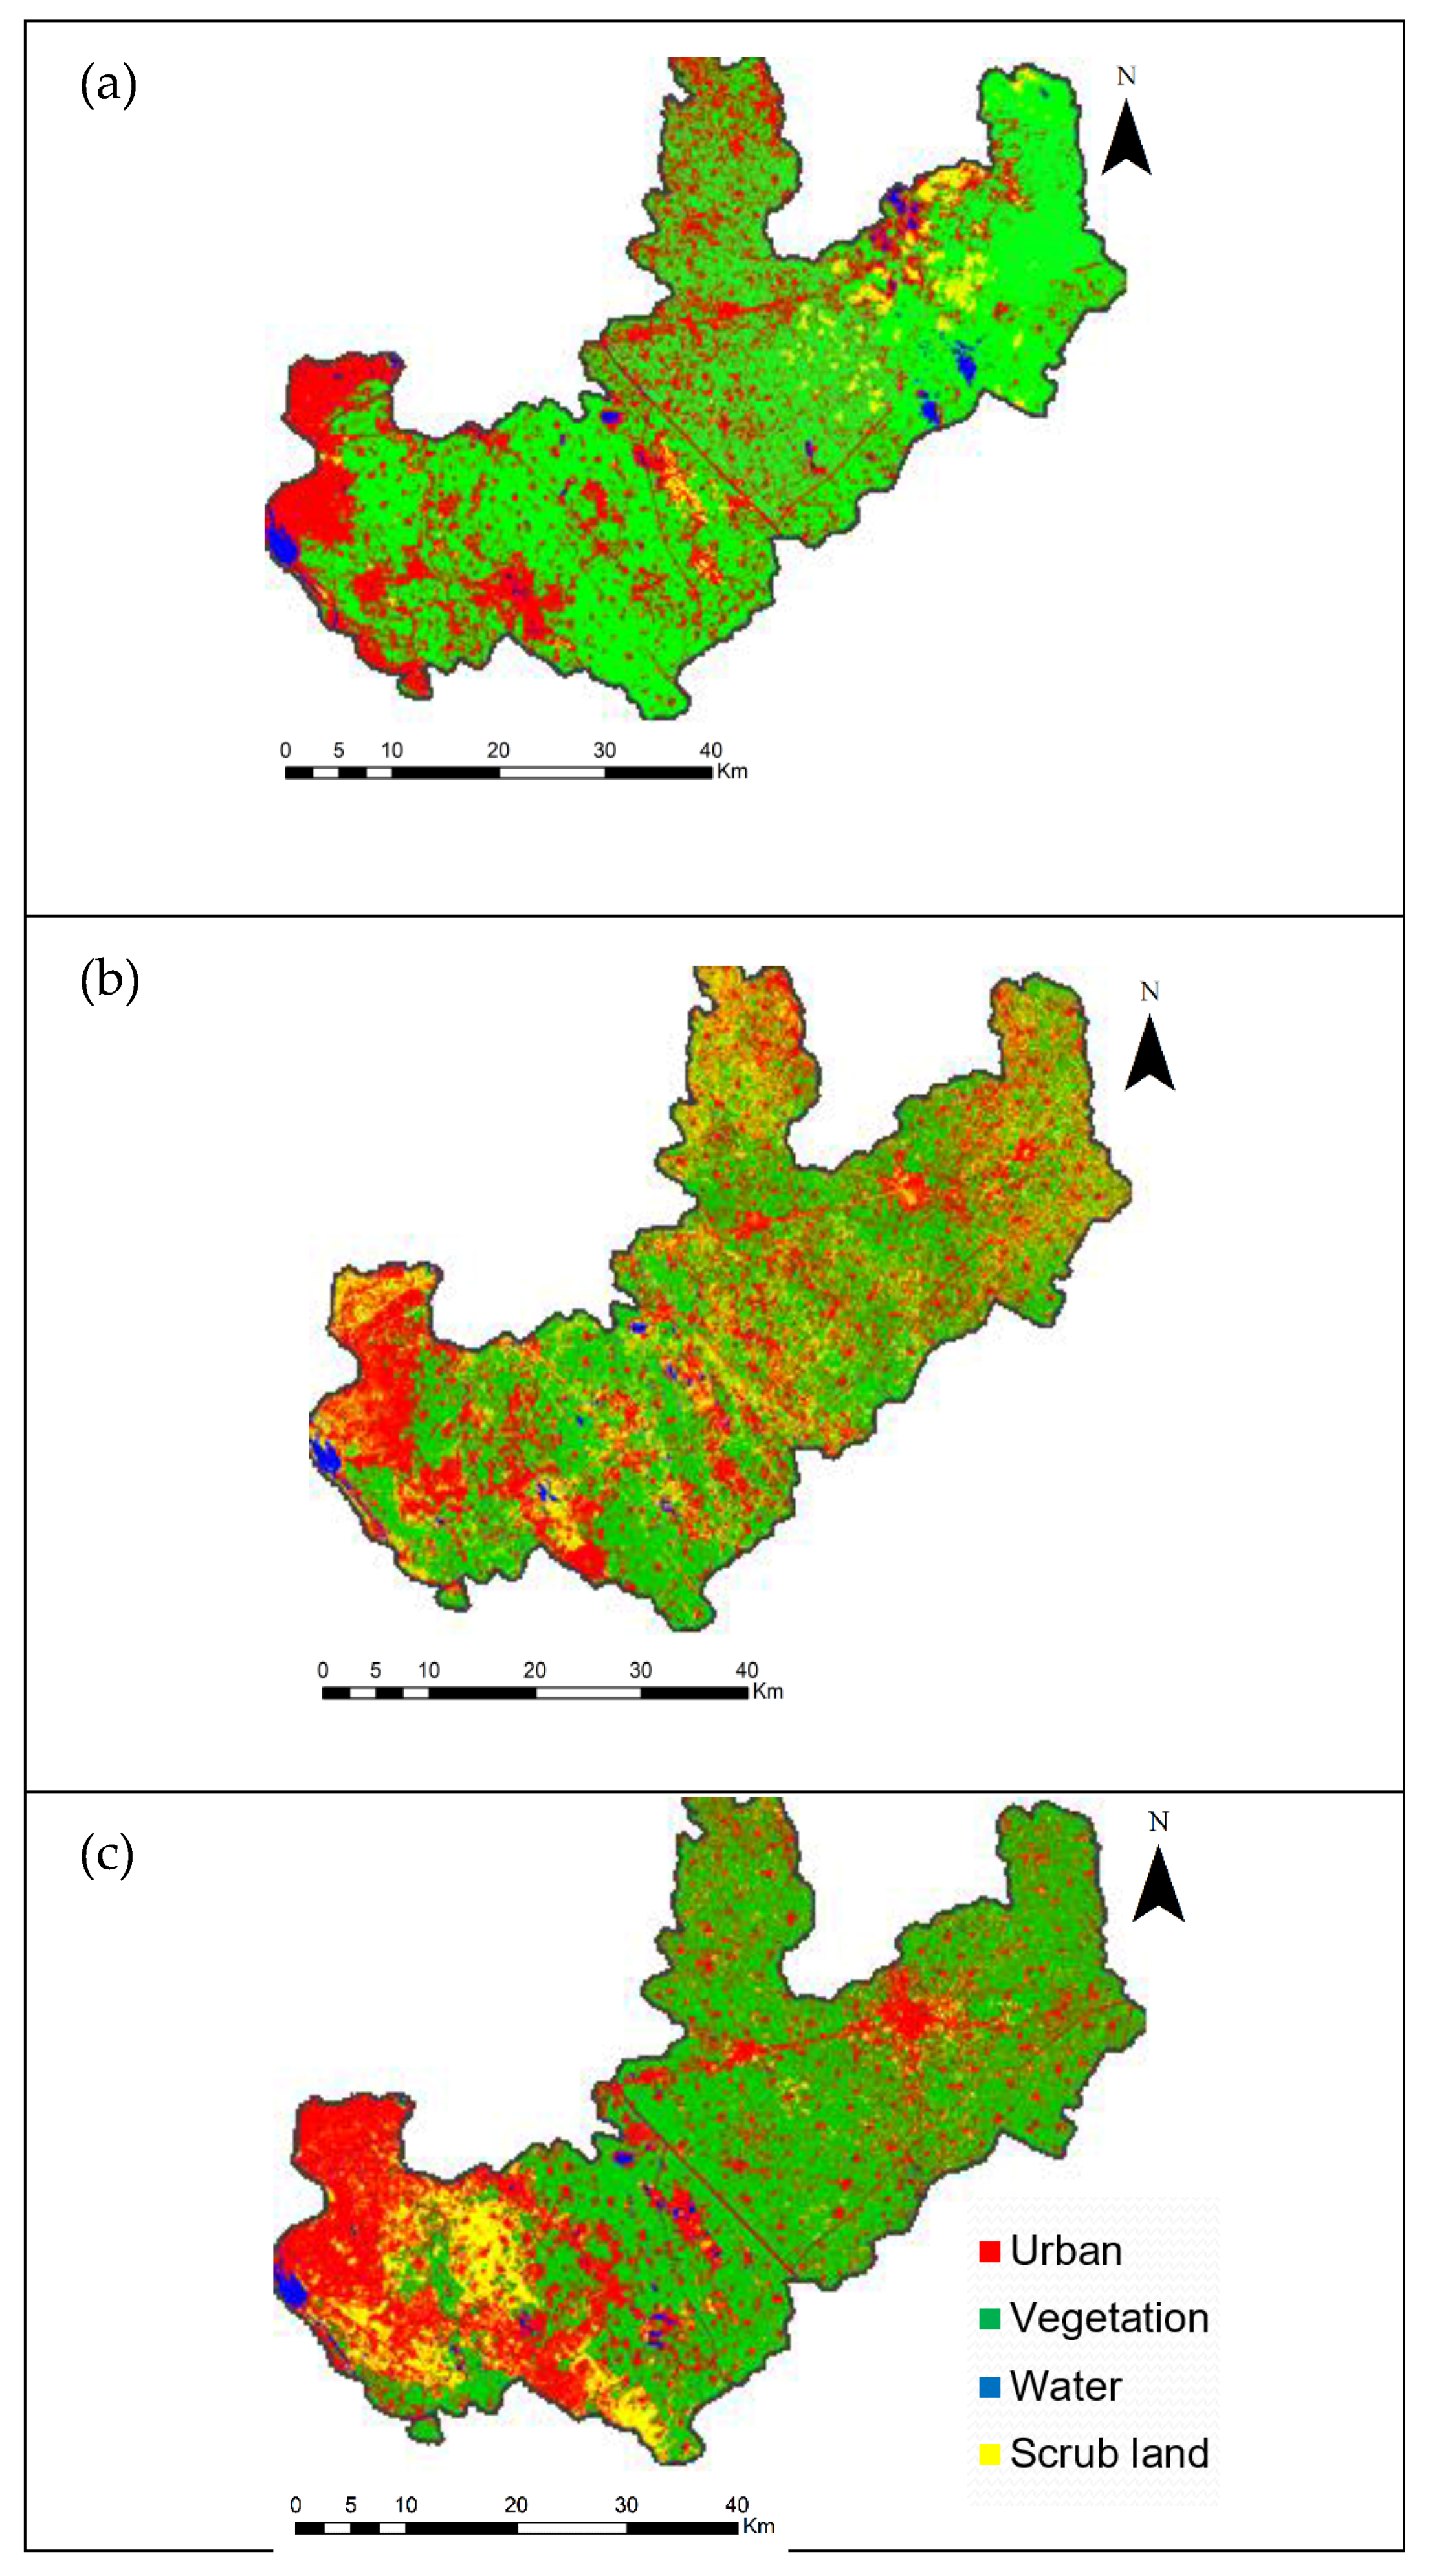
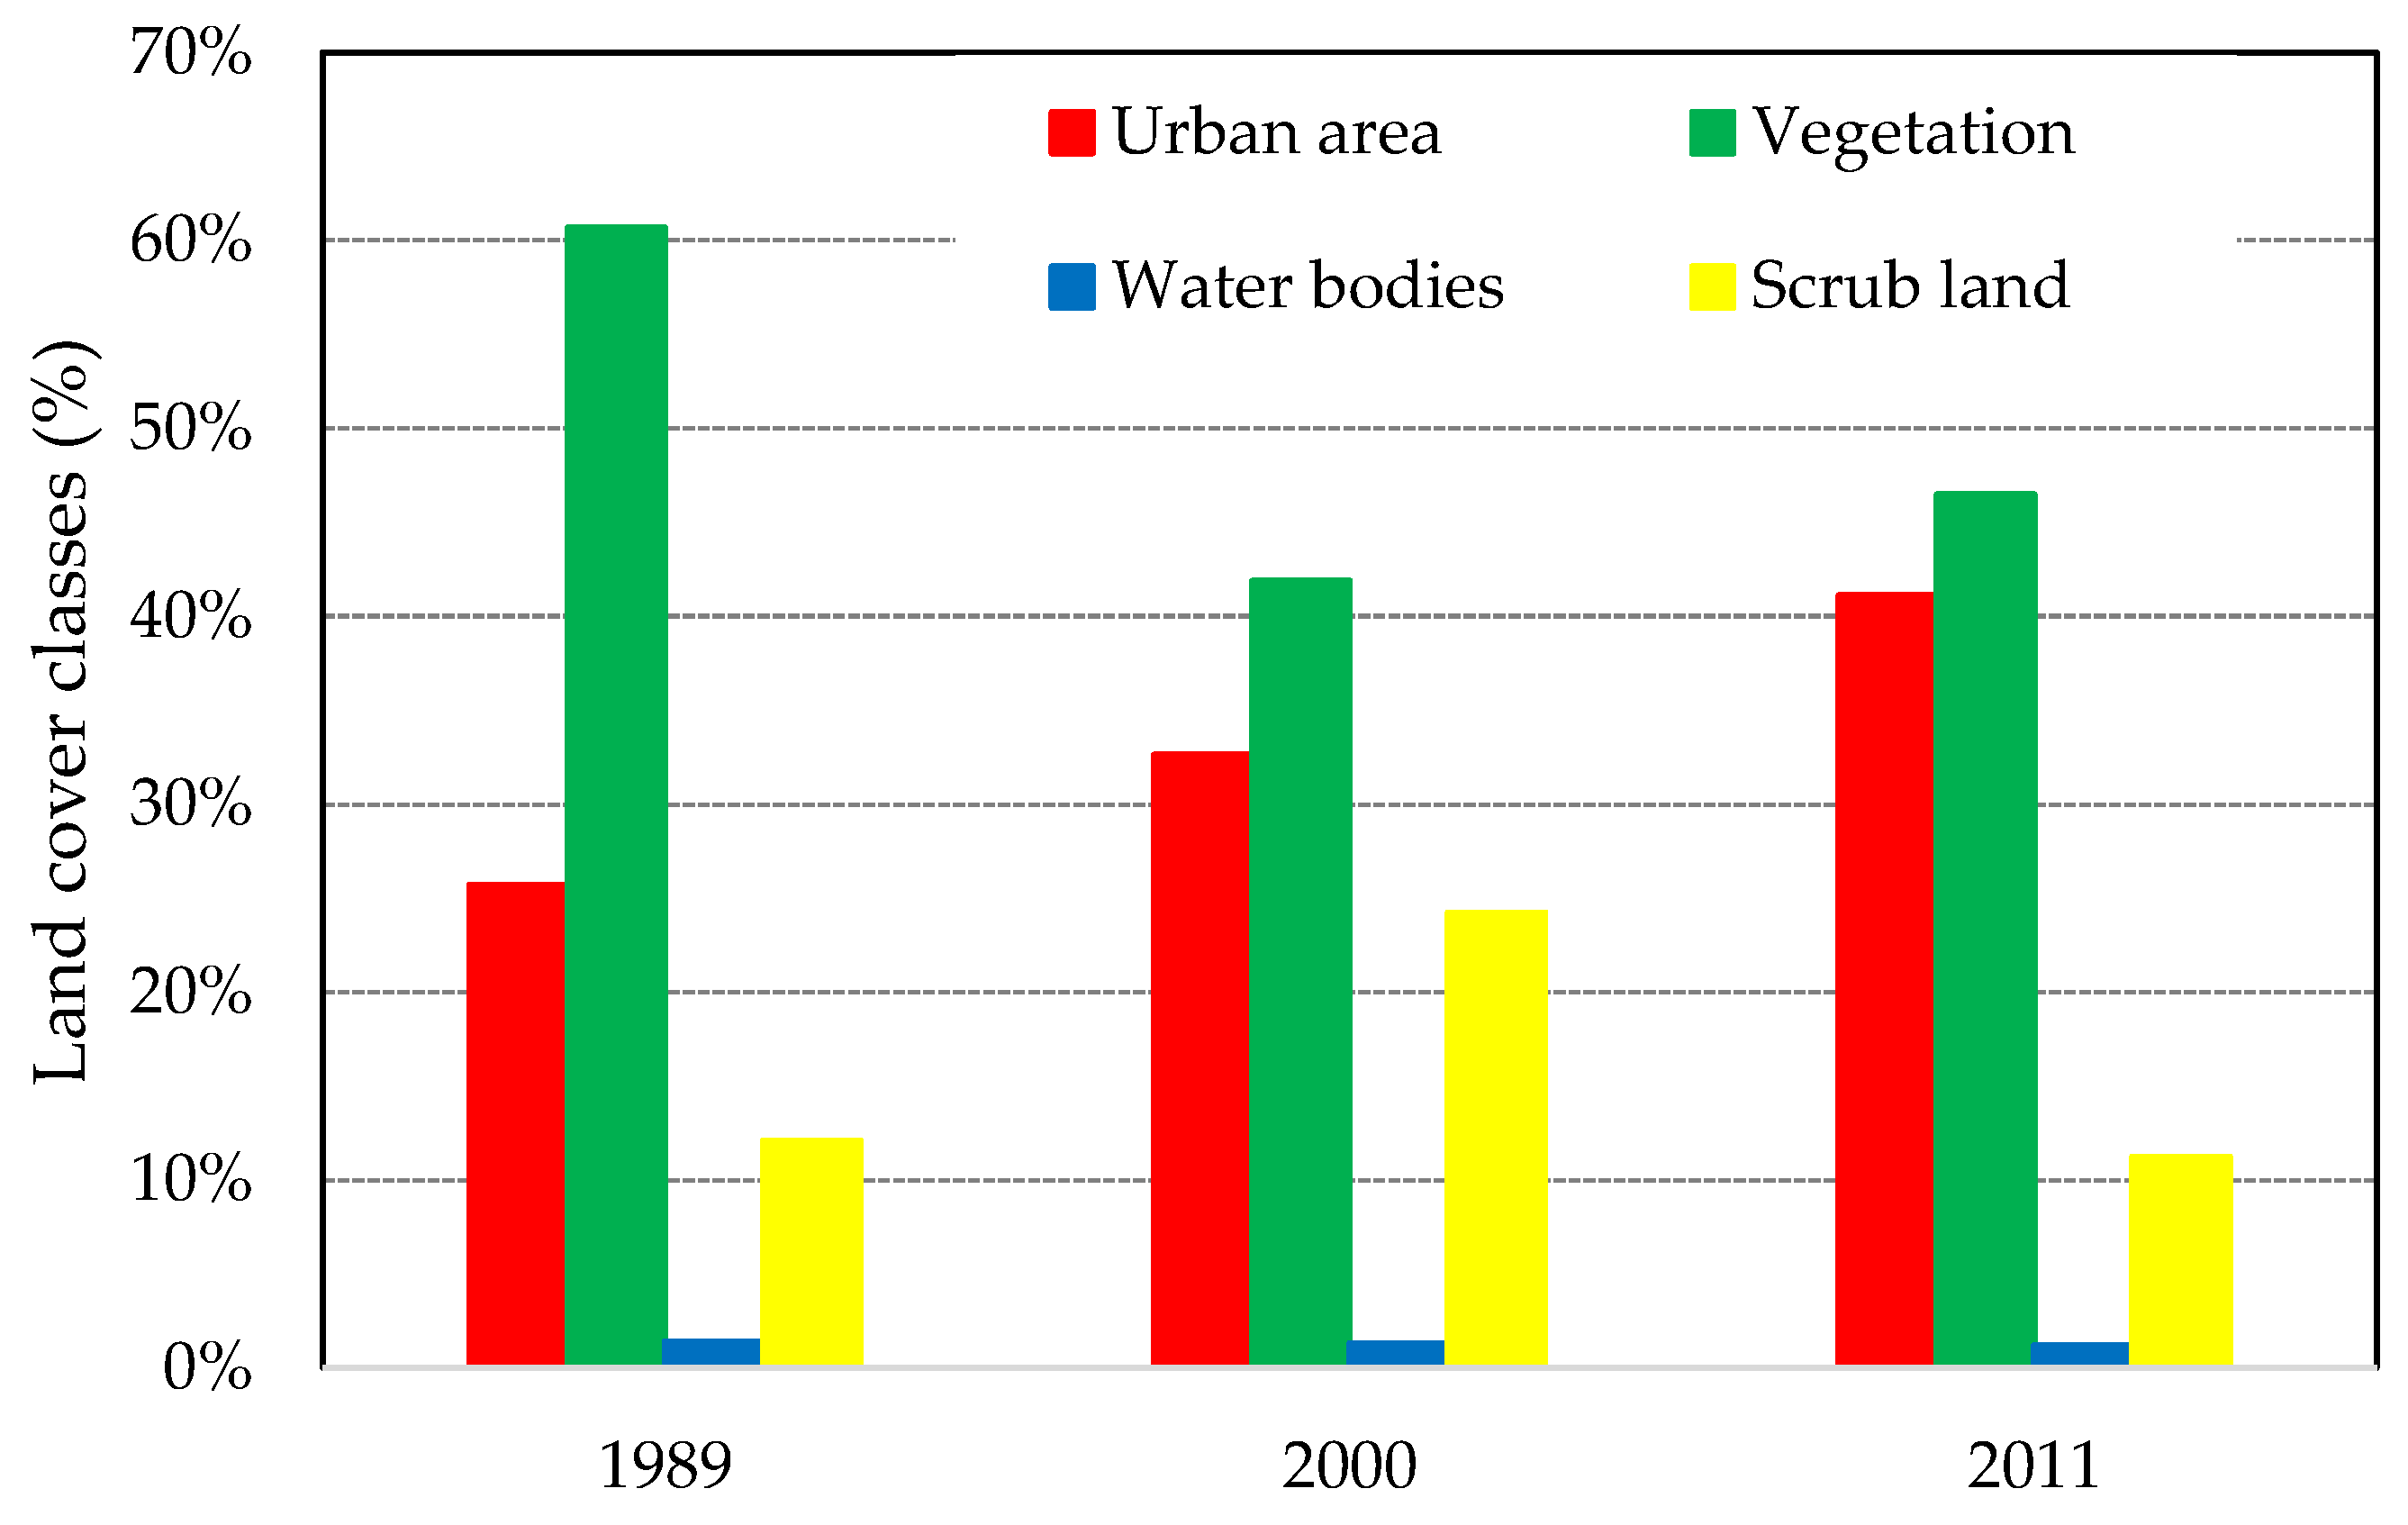
| Year | Urban area | Vegetation | Water | Scrubland | ||||
|---|---|---|---|---|---|---|---|---|
| Area (km2) | % | Area (km2) | % | Area (km2) | % | Area (km2) | % | |
| 1989 | 365.9 | 25.7 | 865.5 | 60.7 | 20.5 | 1.4 | 172.9 | 12.1 |
| 2000 | 464.4 | 32.6 | 596.7 | 41.9 | 18.8 | 1.3 | 344.1 | 24.2 |
| 2011 | 584.8 | 41.1 | 662.8 | 46.5 | 17.6 | 1.2 | 158.8 | 11.2 |
© 2019 by the authors. Licensee MDPI, Basel, Switzerland. This article is an open access article distributed under the terms and conditions of the Creative Commons Attribution (CC BY) license (http://creativecommons.org/licenses/by/4.0/).
Share and Cite
Avtar, R.; Tripathi, S.; Aggarwal, A.K. Assessment of Energy–Population–Urbanization Nexus with Changing Energy Industry Scenario in India. Land 2019, 8, 124. https://doi.org/10.3390/land8080124
Avtar R, Tripathi S, Aggarwal AK. Assessment of Energy–Population–Urbanization Nexus with Changing Energy Industry Scenario in India. Land. 2019; 8(8):124. https://doi.org/10.3390/land8080124
Chicago/Turabian StyleAvtar, Ram, Saurabh Tripathi, and Ashwani Kumar Aggarwal. 2019. "Assessment of Energy–Population–Urbanization Nexus with Changing Energy Industry Scenario in India" Land 8, no. 8: 124. https://doi.org/10.3390/land8080124
APA StyleAvtar, R., Tripathi, S., & Aggarwal, A. K. (2019). Assessment of Energy–Population–Urbanization Nexus with Changing Energy Industry Scenario in India. Land, 8(8), 124. https://doi.org/10.3390/land8080124