Dynamics of Land Use and Land Cover Changes in Harare, Zimbabwe: A Case Study on the Linkage between Drivers and the Axis of Urban Expansion


Abstract
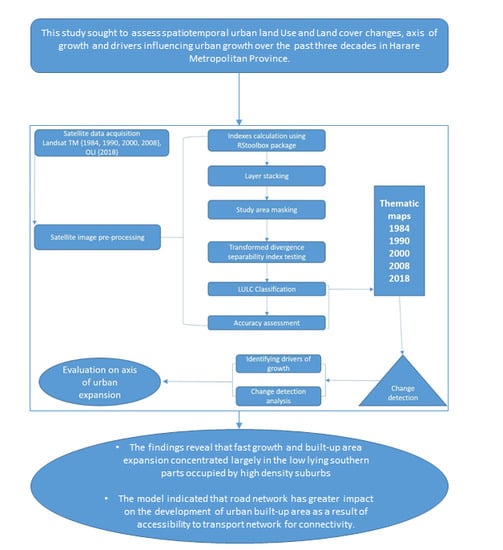
1. Introduction
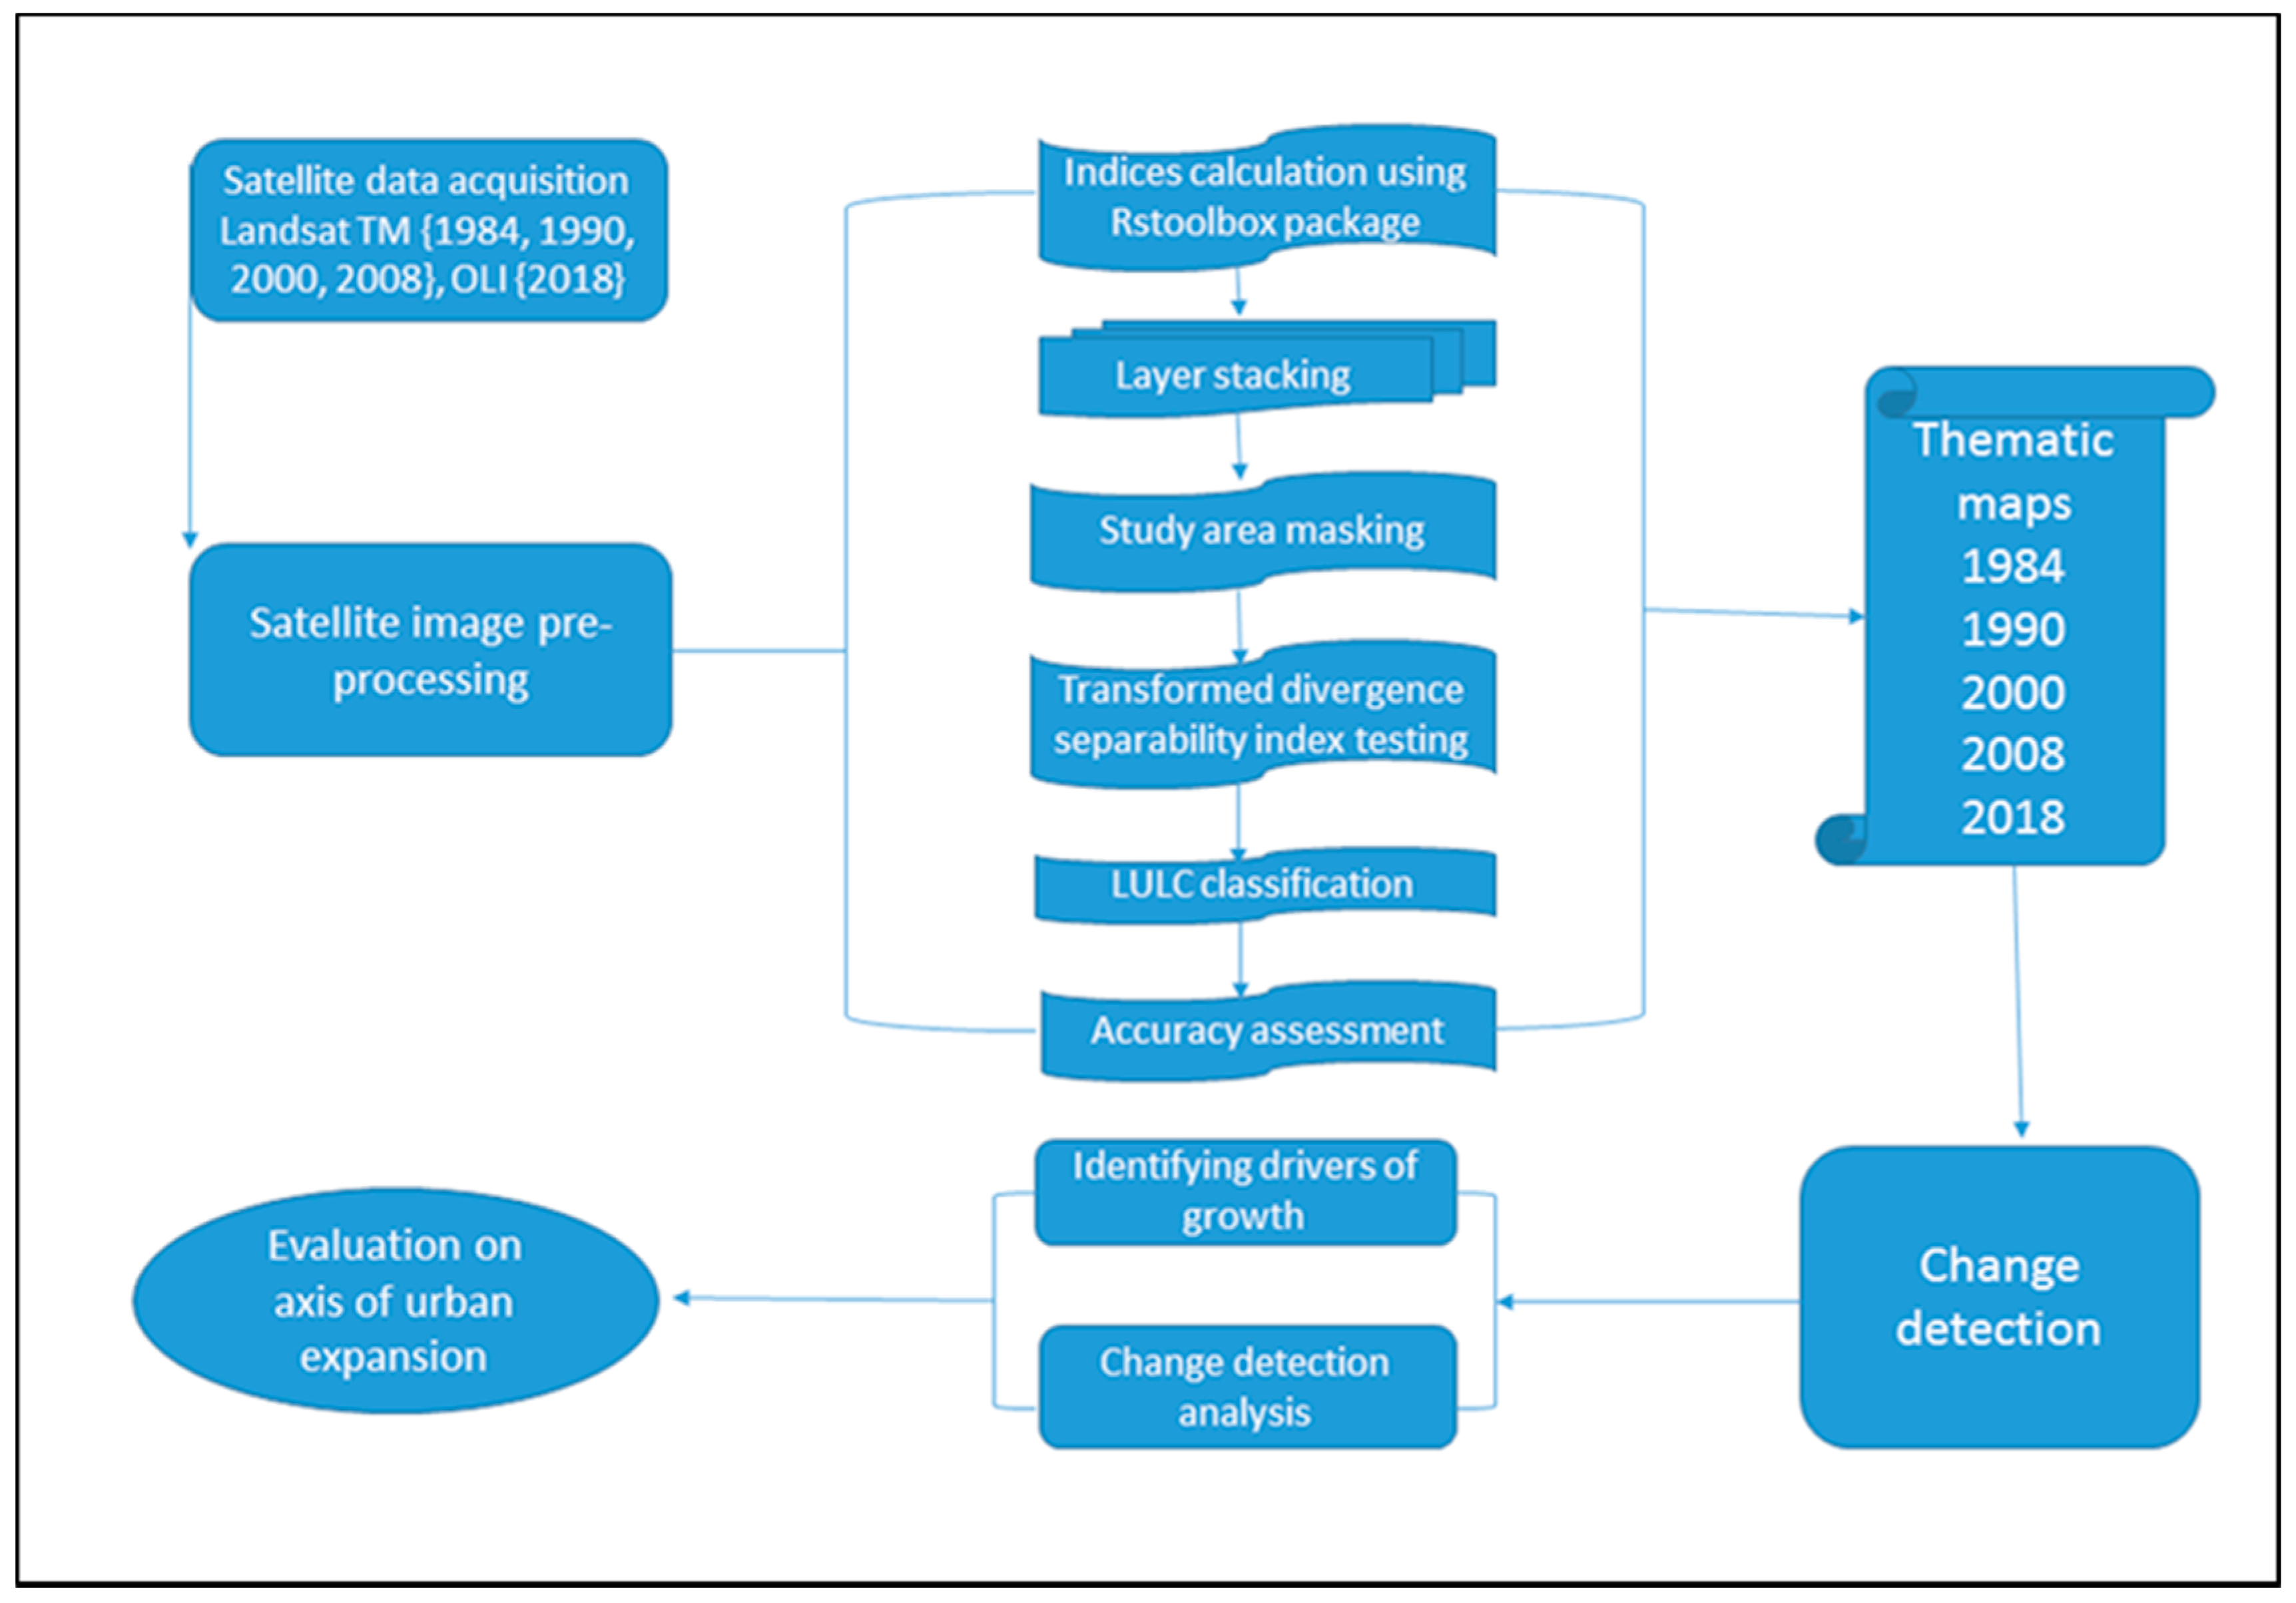
2. Materials and Methods
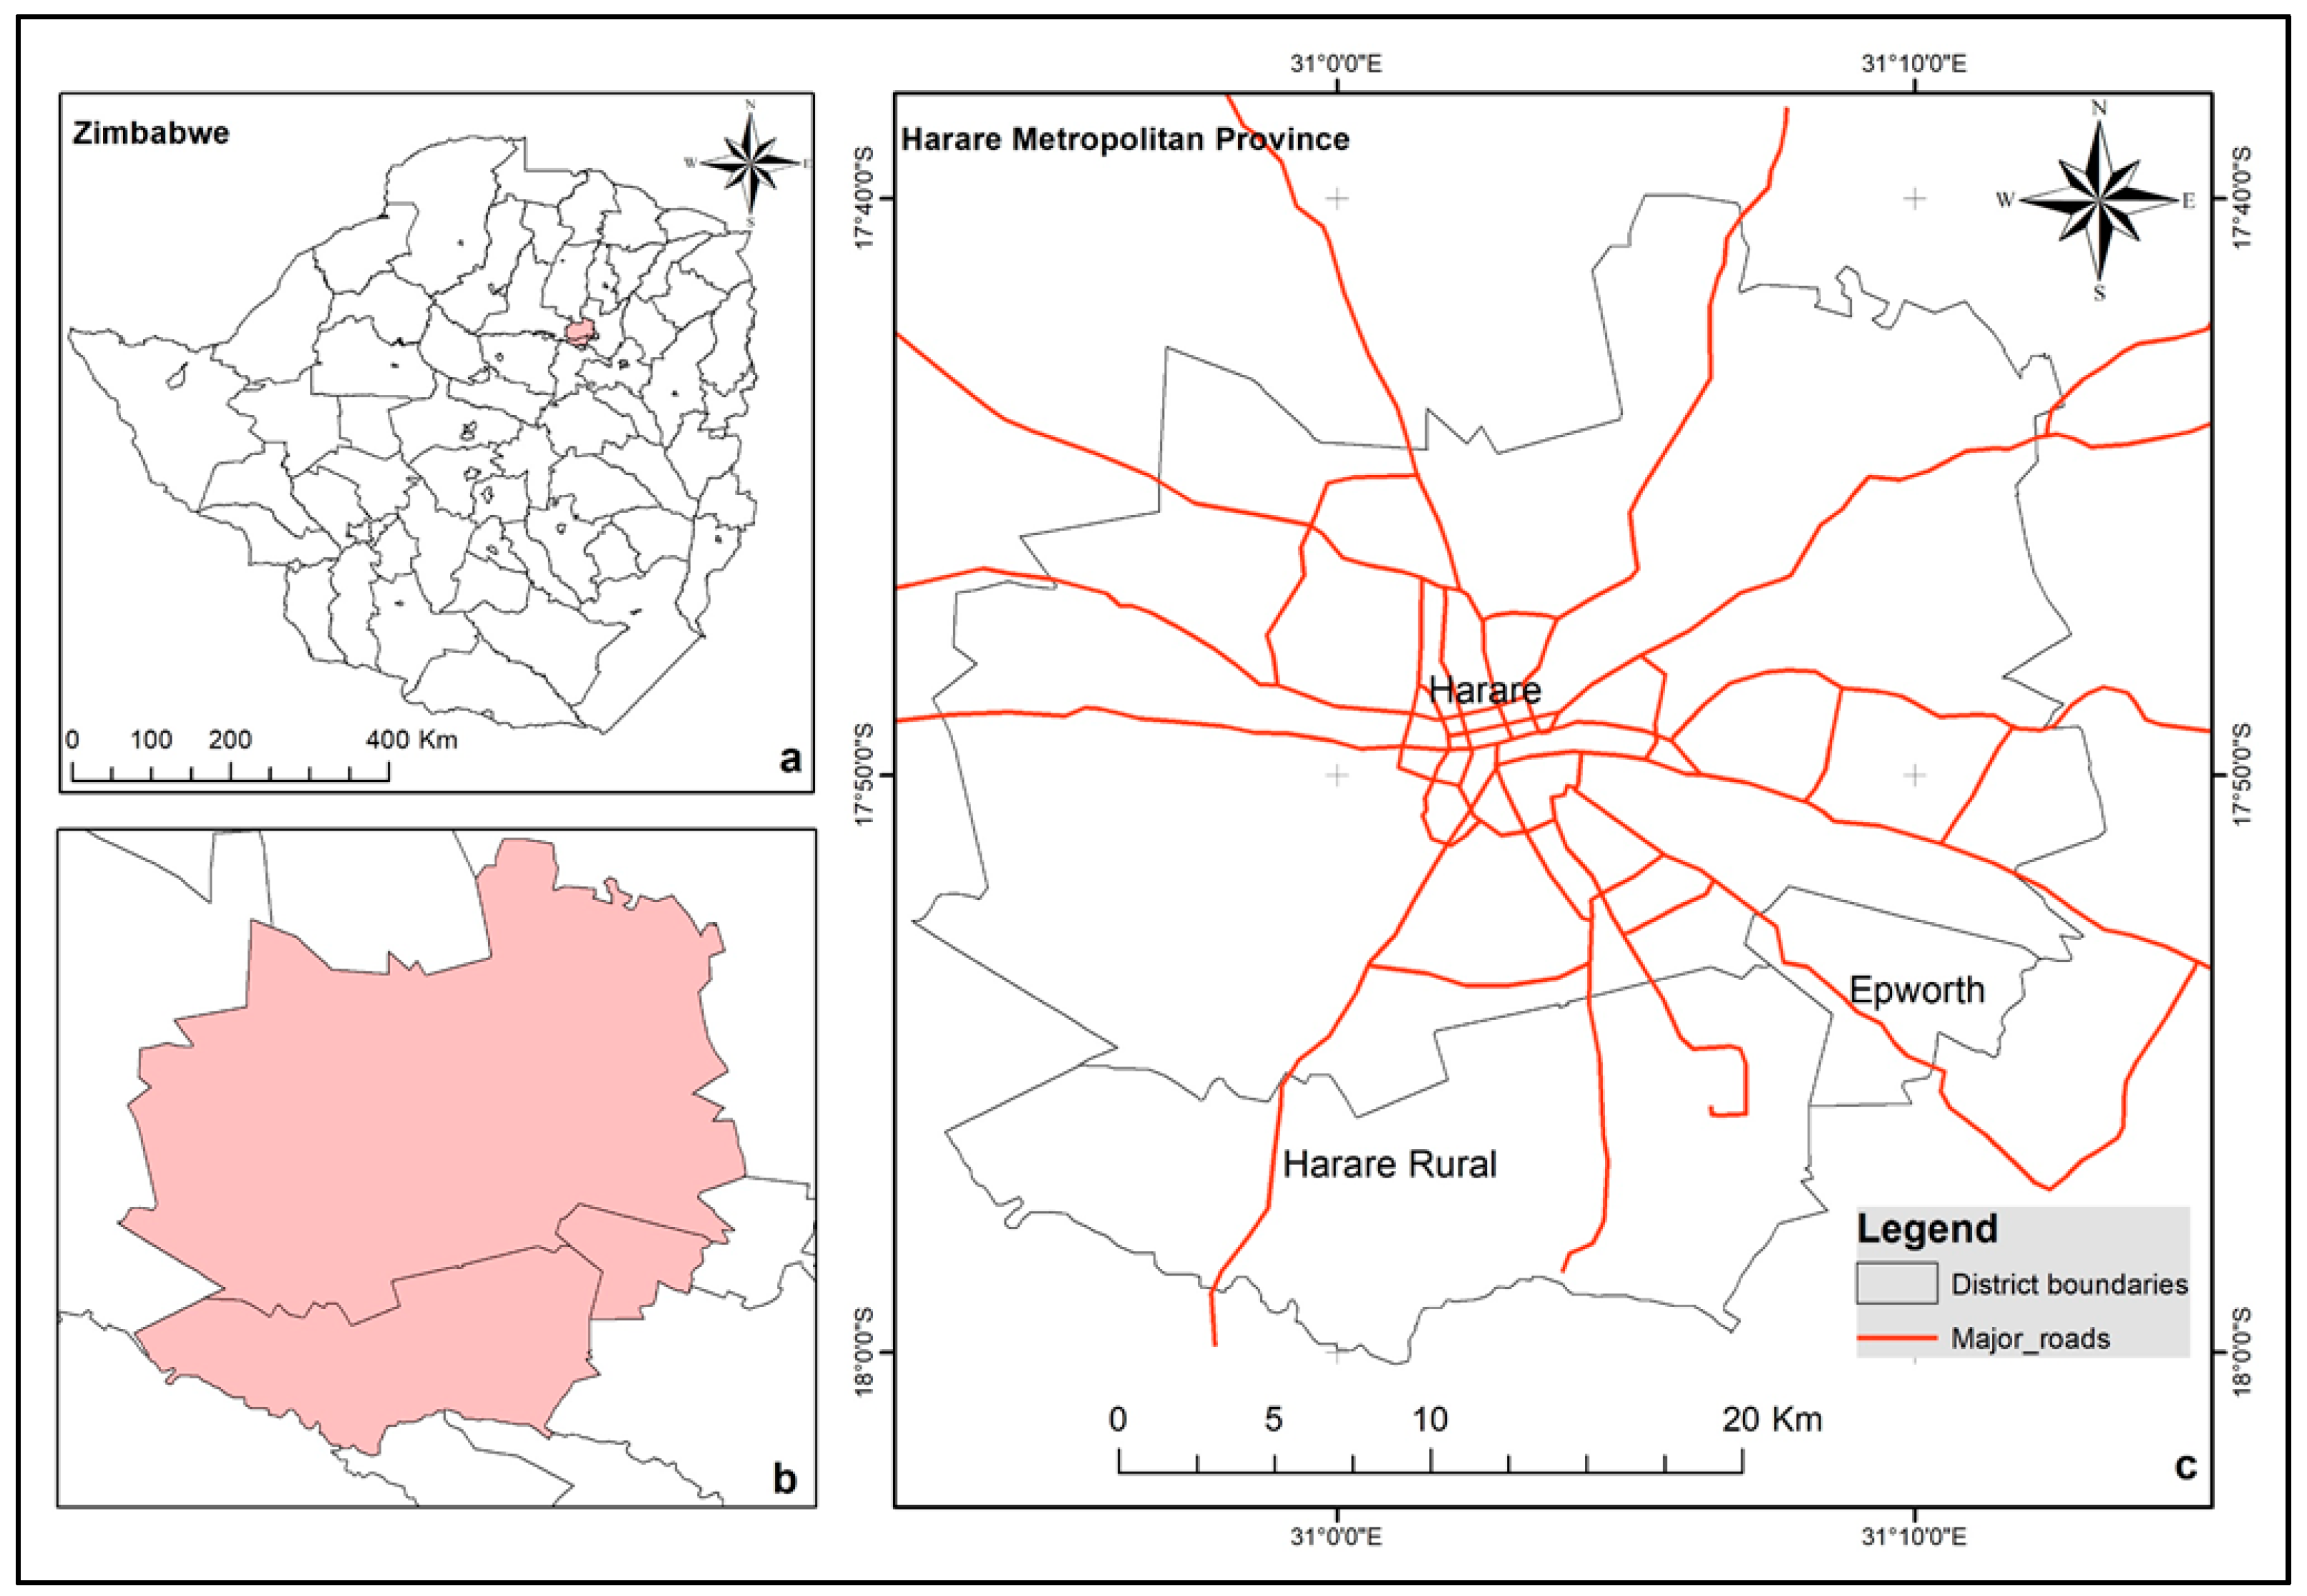
2.1. Study Area
2.2. Data Acquisition and Pre-Processing
2.3. Field Data Collection and Processing
2.4. Land Cover Classification
2.5. Computation of Spectral Indices
2.6. Binomial Logistic Regression
3. Results
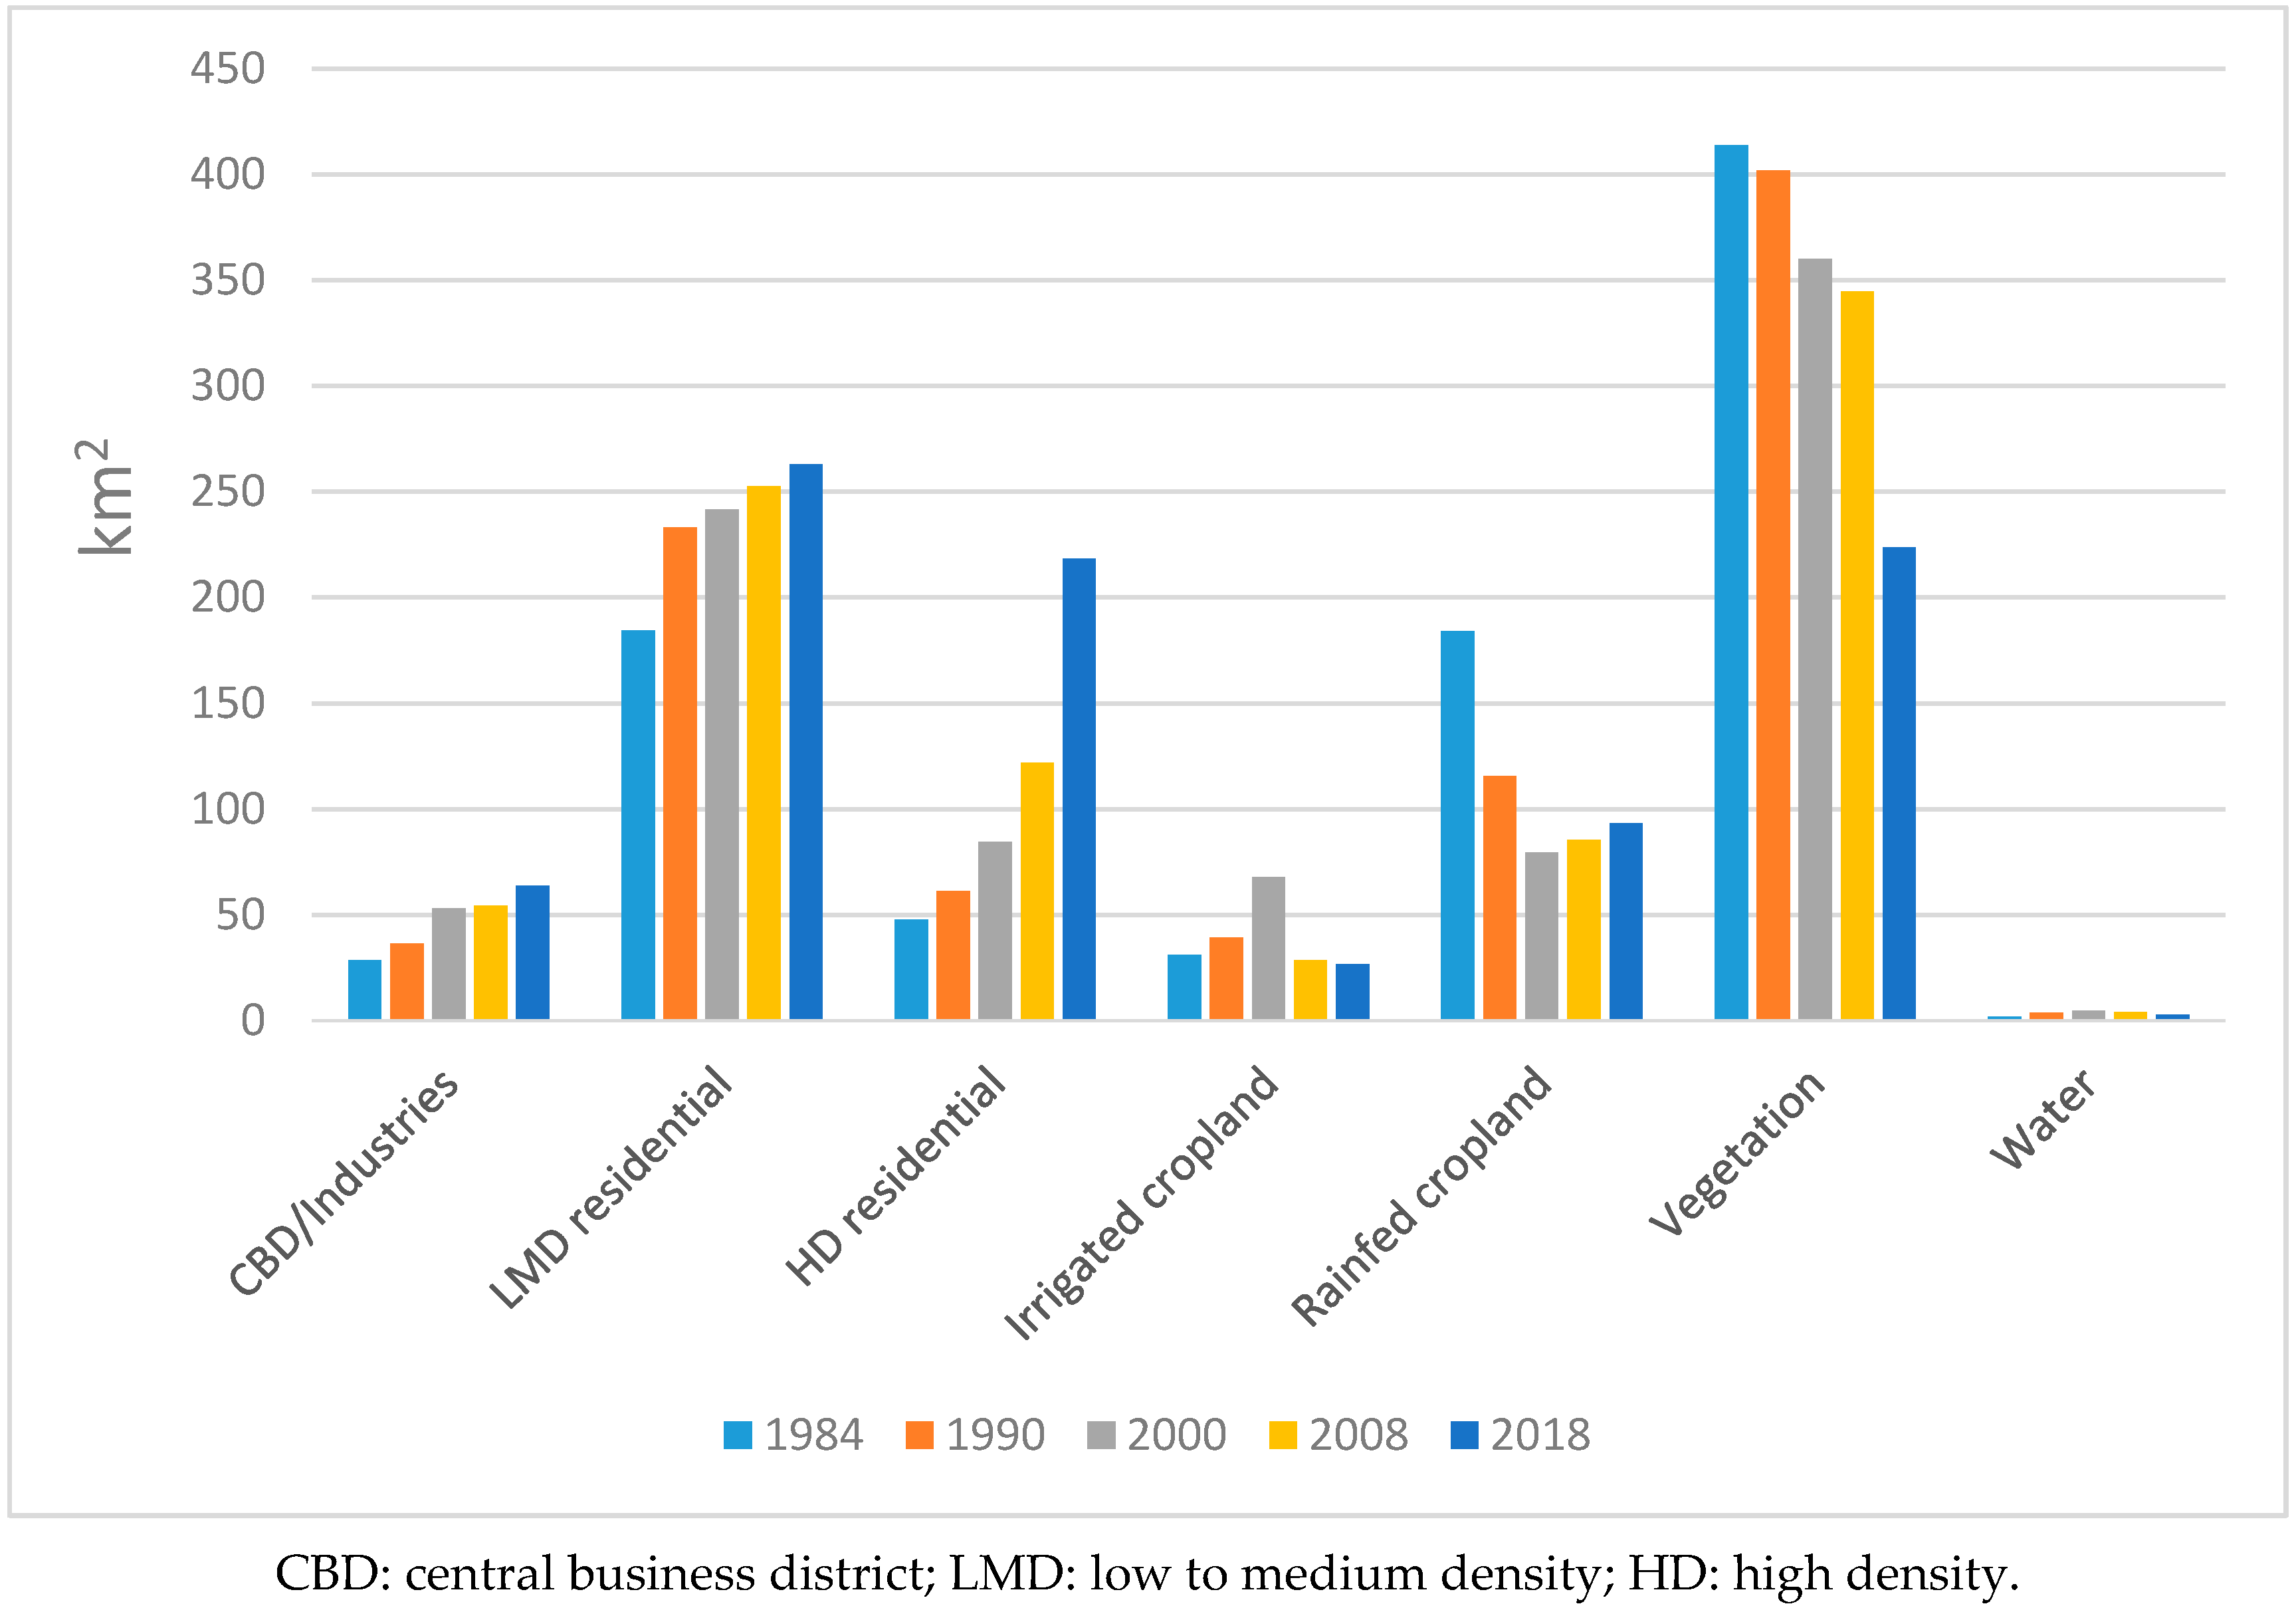
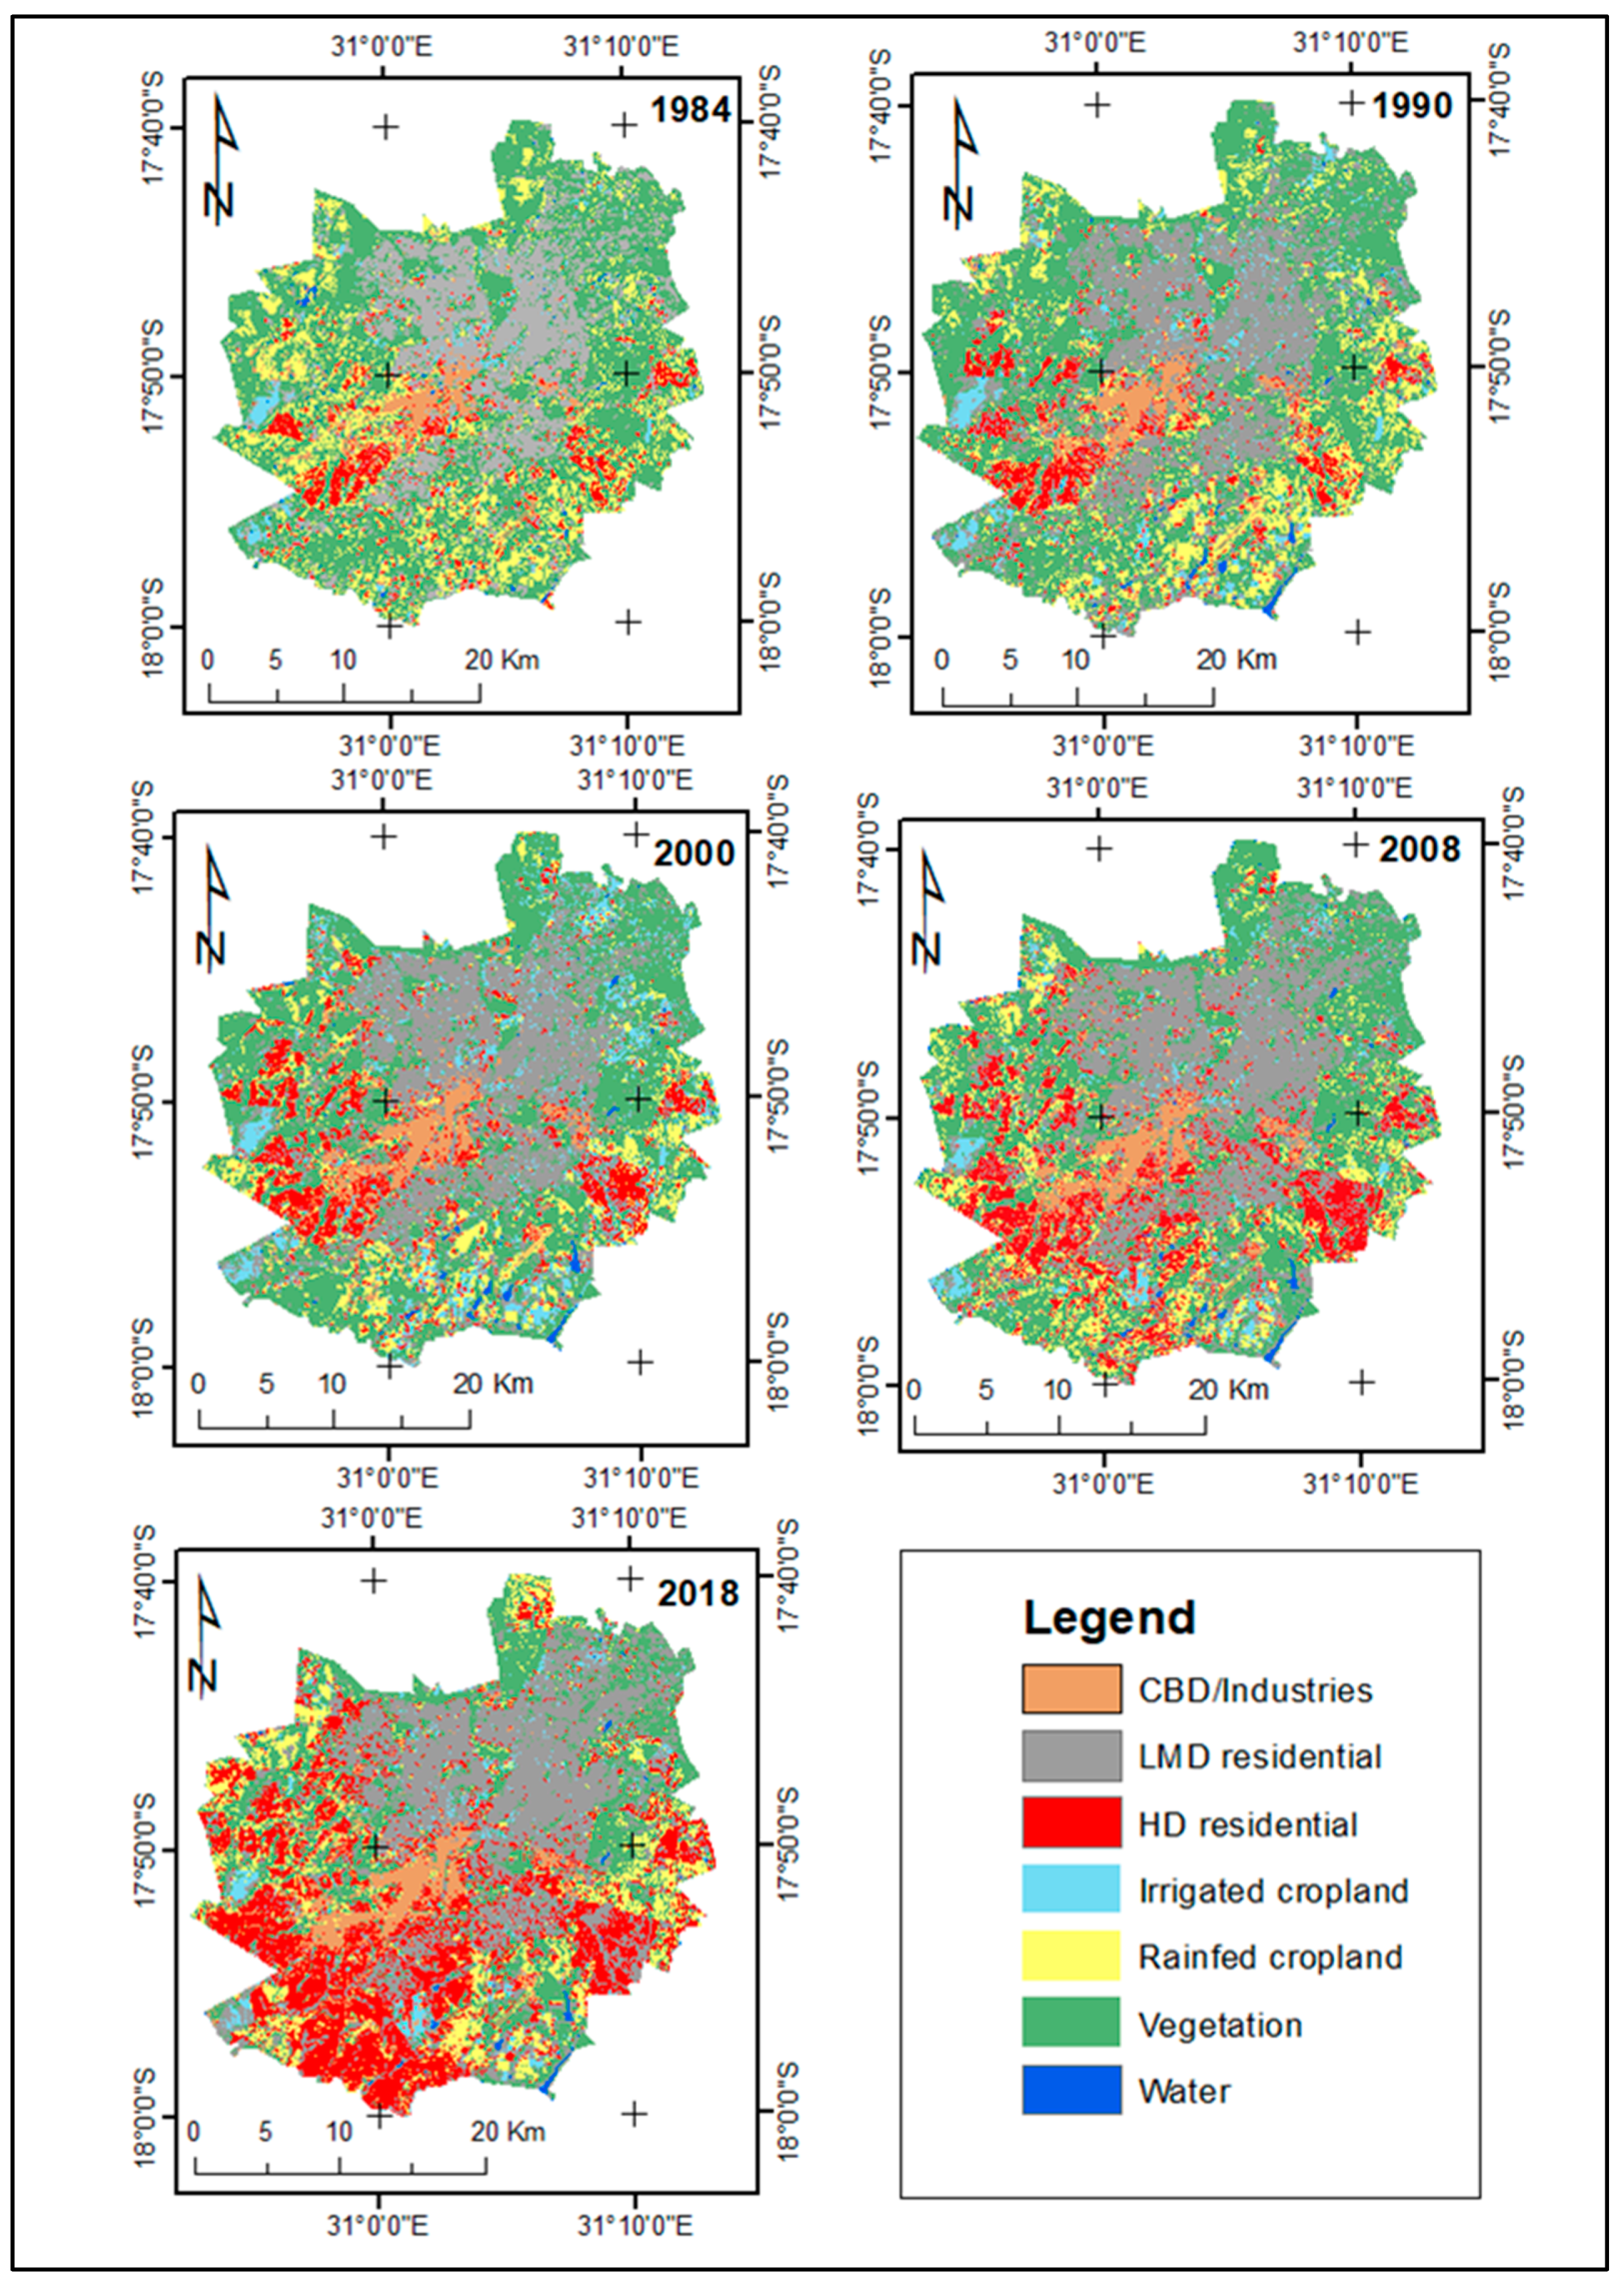
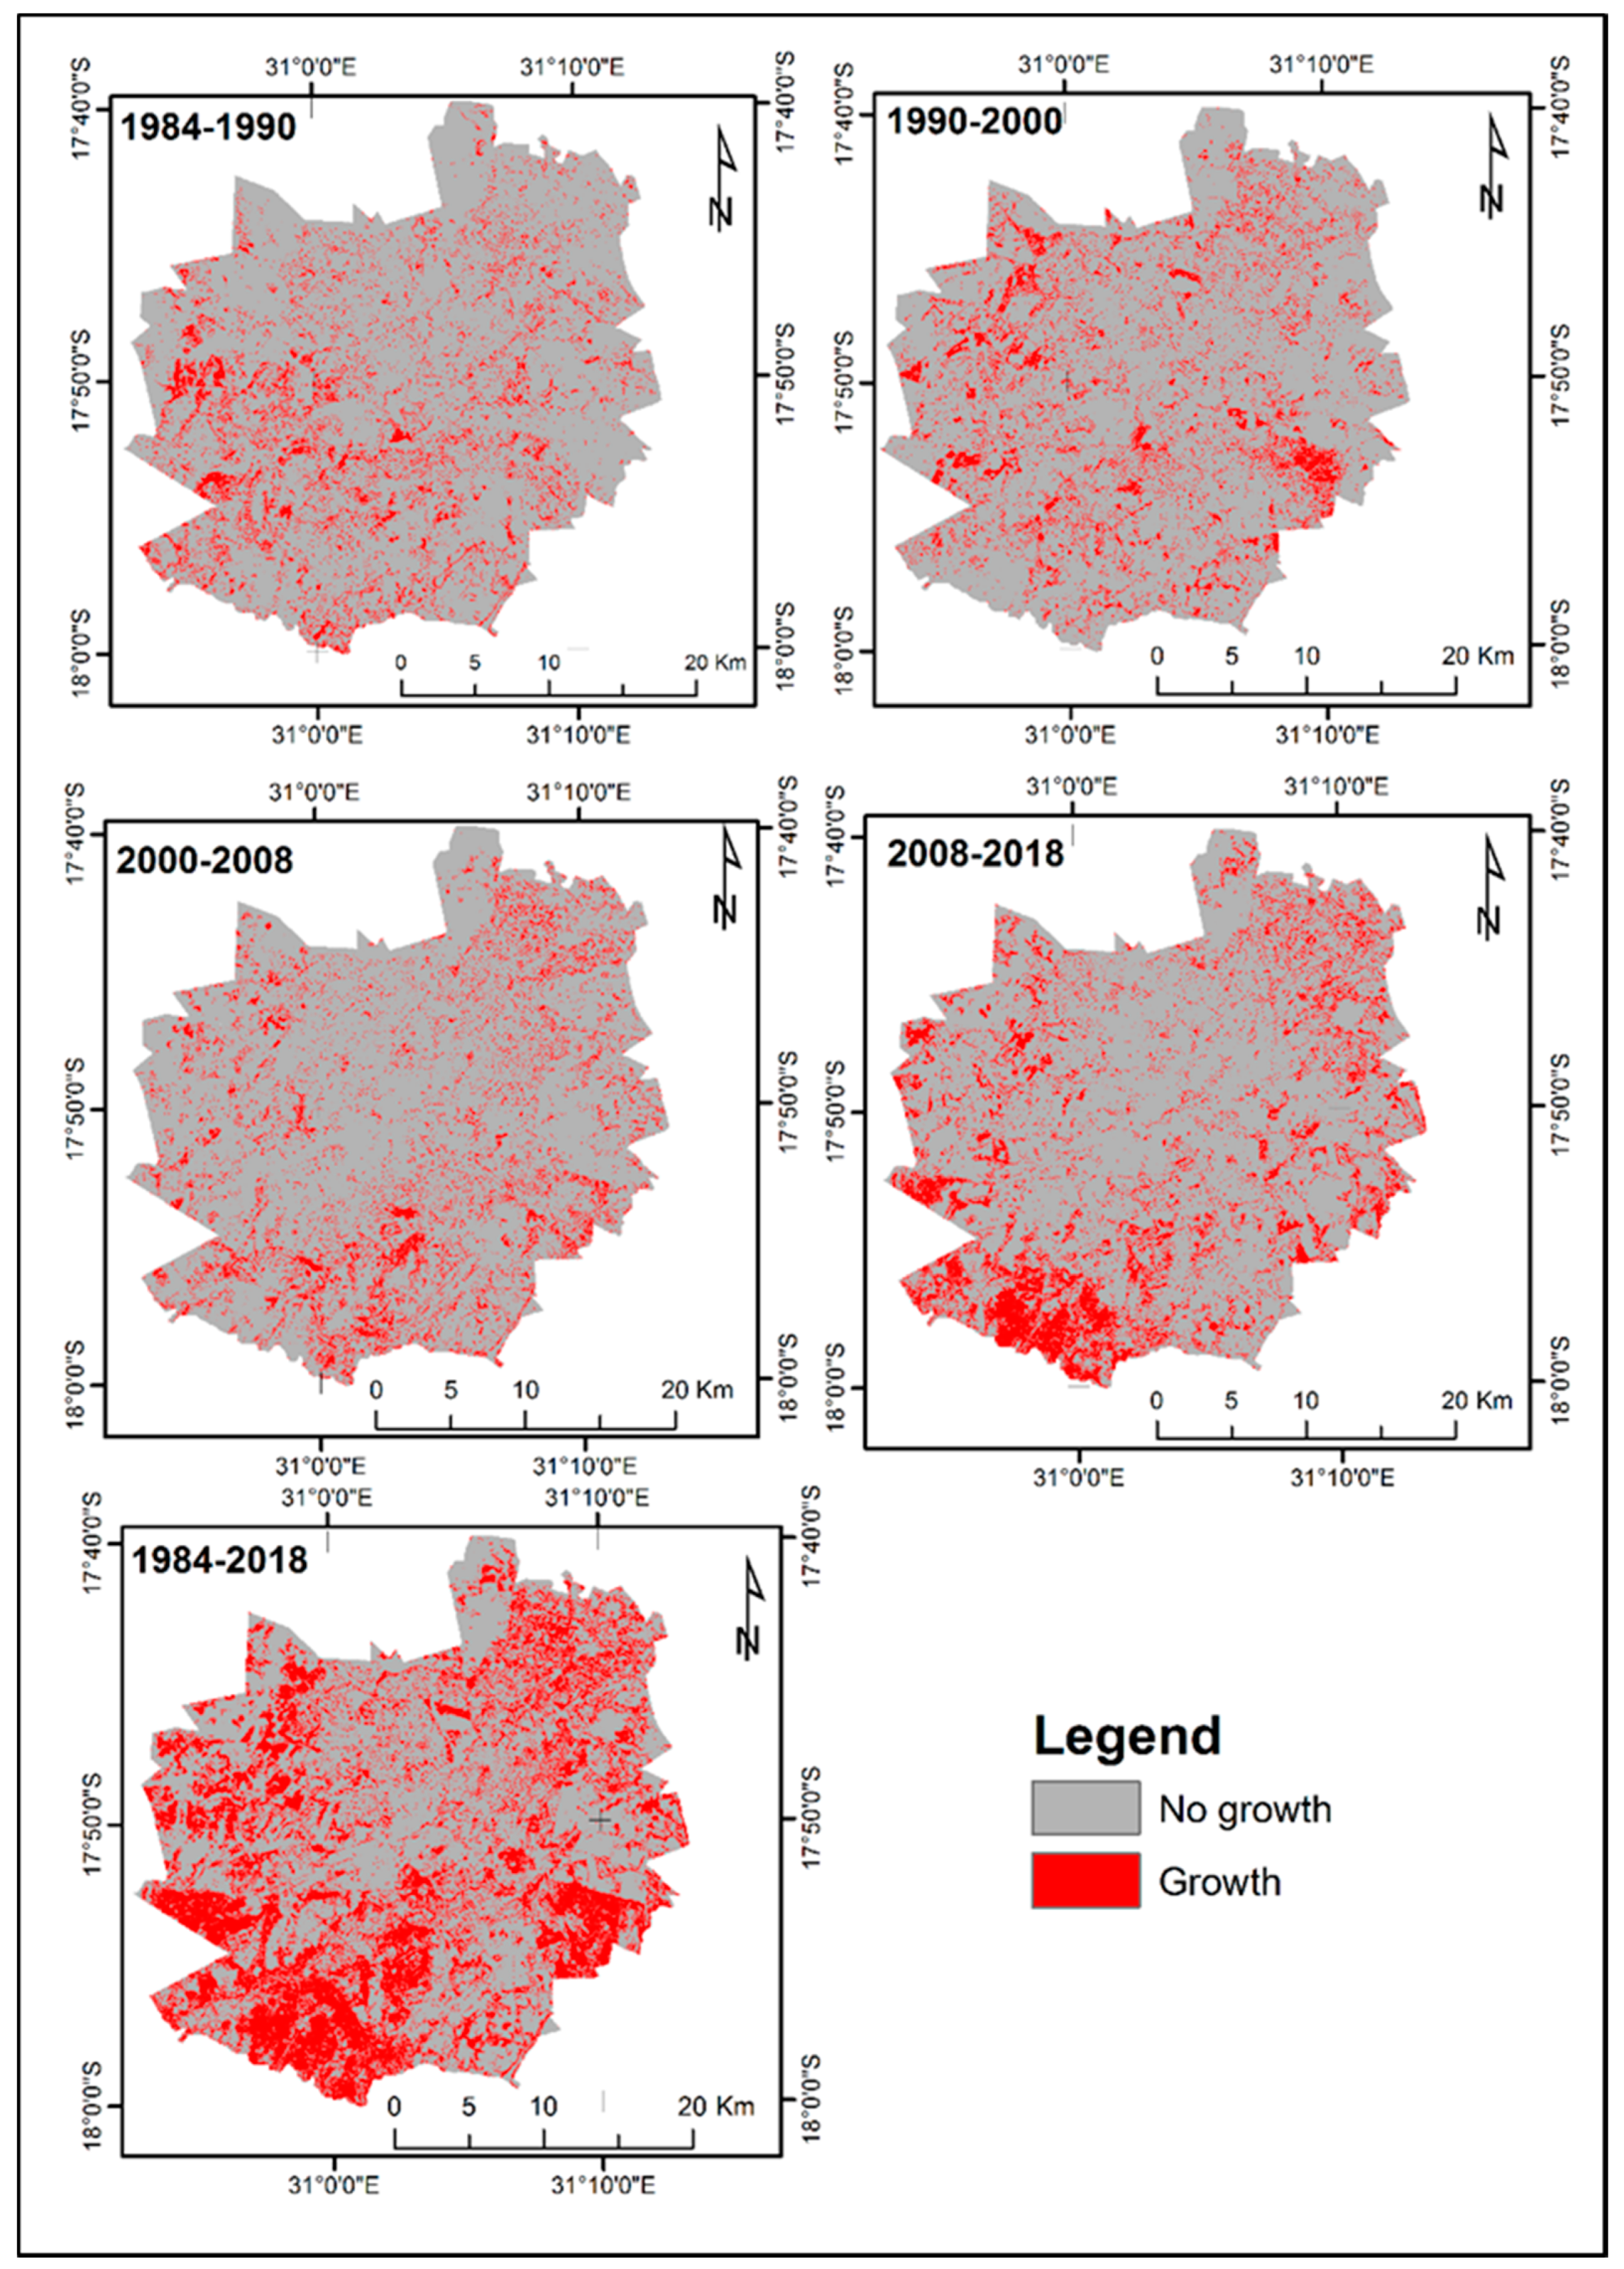
3.1. Area Extent and Change of Land Use and Land Cover
3.2. Land Use and Land Cover Classification Accuracy
3.3. Binomial Logistic Regression
4. Discussion
5. Conclusions
Supplementary Materials
Author Contributions
Funding
Acknowledgments
Conflicts of Interest
Appendix A


| 1984 Landsat 5 TM | Reference Class | |||||||||
| Classified | Class | CBD/Industries | LMD | HD | Irrigated cropland | Rainfed cropland | Vegetation | Water | Total | PA |
| CBD/Industries | 4012 | 182 | 81 | 0 | 3 | 2 | 2 | 4282 | 94.7 | |
| LMD | 92 | 9353 | 164 | 213 | 8 | 495 | 47 | 10,372 | 89.4 | |
| HD | 98 | 105 | 2005 | 0 | 135 | 17 | 0 | 2360 | 82.2 | |
| Irrigated cropland | 0 | 108 | 2 | 2602 | 1 | 22 | 0 | 2735 | 87.6 | |
| Rainfed cropland | 19 | 37 | 165 | 7 | 5996 | 655 | 0 | 6879 | 84.1 | |
| Vegetation | 10 | 665 | 23 | 148 | 987 | 16,765 | 11 | 18,609 | 93.4 | |
| Water | 7 | 9 | 0 | 0 | 0 | 0 | 500 | 516 | 89.3 | |
| Total | 4238 | 10,459 | 2440 | 2970 | 7130 | 17,956 | 560 | 45,753 | ||
| UA | 93.7 | 90.2 | 85.0 | 95.1 | 87.2 | 90.1 | 96.9 | |||
| OA | 90.1 | Kc | 0.87 | |||||||
| 1990 Landsat 5 TM | Reference Class | |||||||||
| Classified | Class | CBD/Industries | LMD | HD | Irrigated cropland | Rainfed cropland | Vegetation | Water | Total | PA |
| CBD/Industries | 1827 | 62 | 61 | 0 | 0 | 0 | 0 | 1950 | 99.2 | |
| LMD | 1 | 2335 | 127 | 137 | 0 | 64 | 10 | 2674 | 81.9 | |
| HD | 10 | 55 | 979 | 4 | 1 | 0 | 0 | 1049 | 77.7 | |
| Irrigated cropland | 0 | 45 | 40 | 1030 | 6 | 0 | 0 | 1121 | 78.4 | |
| Rainfed cropland | 2 | 56 | 45 | 29 | 964 | 102 | 0 | 1198 | 67.4 | |
| Vegetation | 2 | 299 | 8 | 114 | 459 | 2172 | 0 | 3054 | 92.6 | |
| Water | 0 | 0 | 0 | 0 | 0 | 0 | 601 | 601 | 98.4 | |
| Total | 1842 | 2852 | 1260 | 1314 | 1430 | 2338 | 611 | 11,647 | ||
| UA | 93.7 | 87.3 | 93.3 | 91.9 | 80.5 | 71.1 | 100 | |||
| OA | 85.1 | Kc | 0.82 | |||||||
| 2000 Landsat 5 TM | Reference Class | |||||||||
| Classified | Class | CBD/Industries | LMD | HD | Irrigated cropland | Rainfed cropland | Vegetation | Water | Total | PA |
| CBD/Industries | 1946 | 113 | 85 | 1 | 8 | 3 | 0 | 2156 | 96.7 | |
| LMD | 10 | 3225 | 30 | 47 | 8 | 157 | 14 | 3491 | 87.4 | |
| HD | 50 | 34 | 1053 | 35 | 0 | 0 | 0 | 1172 | 83.4 | |
| Irrigated cropland | 0 | 70 | 53 | 596 | 0 | 5 | 0 | 724 | 76.2 | |
| Rainfed cropland | 5 | 24 | 38 | 93 | 602 | 0 | 0 | 762 | 85.6 | |
| Vegetation | 1 | 220 | 3 | 10 | 85 | 1520 | 6 | 1845 | 90.2 | |
| Water | 0 | 3 | 0 | 0 | 1 | 1 | 728 | 732 | 97.3 | |
| Total | 2012 | 3689 | 1262 | 782 | 703 | 1686 | 748 | |||
| UA | 90.3 | 92.4 | 89.9 | 82.3 | 79.0 | 82.4 | 99.5 | |||
| OA | 88.9 | Kc | 0.86 | |||||||
| 2008 Landsat 5 TM | Reference Class | |||||||||
| Classified | Class | CBD/Industries | LMD | HD | Irrigated cropland | Rainfed cropland | Vegetation | Water | Total | PA |
| CBD/Industries | 2217 | 21 | 61 | 0 | 0 | 0 | 0 | 2299 | 96.4 | |
| LMD | 15 | 1629 | 116 | 37 | 0 | 355 | 6 | 2158 | 84.5 | |
| HD | 37 | 76 | 746 | 12 | 15 | 8 | 0 | 894 | 79.8 | |
| Irrigated cropland | 0 | 87 | 2 | 647 | 0 | 4 | 0 | 740 | 93.0 | |
| Rainfed cropland | 6 | 11 | 3 | 0 | 666 | 151 | 0 | 837 | 90.9 | |
| Vegetation | 11 | 105 | 7 | 0 | 52 | 1961 | 1 | 2137 | 79.1 | |
| Water | 1 | 0 | 0 | 0 | 0 | 0 | 606 | 607 | 98.9 | |
| Total | 2287 | 1929 | 935 | 695 | 733 | 2479 | 613 | 9672 | ||
| UA | 96.4 | 75.5 | 83.5 | 87.4 | 79.6 | 91.8 | 99.8 | |||
| OA | 87.6 | Kc | 0.85 | |||||||
| 2018 Landsat 8 OLI | Reference Class | |||||||||
| Classified | Class | CBD/Industries | LMD | HD | Irrigated cropland | Rainfed cropland | Vegetation | Water | Total | PA |
| CBD/Industries | 2492 | 63 | 60 | 0 | 1 | 0 | 0 | 2616 | 96.6 | |
| LMD | 23 | 2721 | 59 | 124 | 64 | 219 | 5 | 3215 | 84.1 | |
| HD | 43 | 86 | 1778 | 10 | 3 | 3 | 0 | 1923 | 92.9 | |
| Irrigated cropland | 1 | 134 | 3 | 806 | 0 | 24 | 0 | 968 | 84.4 | |
| Rainfed cropland | 18 | 7 | 11 | 15 | 1352 | 122 | 0 | 1525 | 86.8 | |
| Vegetation | 4 | 223 | 3 | 0 | 137 | 2942 | 0 | 3309 | 88.9 | |
| Water | 0 | 0 | 0 | 0 | 0 | 0 | 601 | 601 | 99.2 | |
| Total | 2581 | 3234 | 1914 | 955 | 1557 | 3310 | 606 | 14,157 | ||
| UA | 95.3 | 84.6 | 92.5 | 83.3 | 88.7 | 88.9 | 100 | |||
| OA | 89.7 | Kc | 0.87 | |||||||
References
- Samson, K. Squatter settlement and the issue of regulation: A case of Dire Dawa. Ethiop. Local Gov. Dev. J. 2009, 3, 55–66. [Google Scholar]
- Alaci, D.S.A. Regulating Urbanisation in Sub-Saharan Africa Through Cluster Settlements: Lessons for urban mangers in Ethiopia. Theor. Empir. Res. Urban Manag. 2019, 5, 16. [Google Scholar]
- Adebowale, B.I.; Kayode, S.E. Geospatial Assessment of Urban Expansion and Land Surface Temperature in Akure, Nigeria. In Proceedings of the ICUC9—9th International Conference on Urban Climate Jointly with 12th Symposium on the Urban Environment, Toulouse, France, 20–24 July 2015. [Google Scholar]
- Satterthwaite, D. Climate change and urbanization: Effects and implications for urban governance. In Proceedings of the United Nations Expert Group Meeting on Population Distribution, Urbanization, Internal Migration and Development, New York, NY, USA, 21–23 January 2008; pp. 21–23. [Google Scholar]
- Sayemuzzaman, M.; Jha, M.K. Modeling of Future Land Cover Land Use Change in North Carolina Using Markov Chain and Cellular Automata Model. Am. J. Eng. Appl. Sci. 2014, 7, 295–306. [Google Scholar] [CrossRef]
- Owoeye, J.O.; Popoola, O.O. Predicting urban sprawl and land use changes in Akure region using markov chains modeling. J. Geogr. Reg. Plan. 2017, 10, 197–207. [Google Scholar] [CrossRef][Green Version]
- Müller, N.; Ignatieva, M.; Nilon, C.H.; Werner, P.; Zipperer, W.C. Patterns and Trends in Urban Biodiversity and Landscape Design; Springer: Dordrecht, The Netherlands; Heidelberg, Germany; New York, NY, USA; London, UK, 2013; ISBN 978-94-007-7087-4. [Google Scholar]
- United Nations World Urbanization Prospects-Population Division—United Nations. Available online: https://population.un.org/wup/ (accessed on 21 September 2019).
- Mohan, M.; Pathan, S.K.; Narendrareddy, K.; Kandya, A.; Pandey, S. Dynamics of Urbanization and Its Impact on Land-Use/Land-Cover: A Case Study of Megacity Delhi. JEP 2011, 2, 1274–1283. [Google Scholar] [CrossRef]
- Yu, D.; Yanxu, L.; Bojie, F. Urban growth simulation guided by ecological constraints in Beijing city: Methods and implications for spatial planning. J. Environ. Manag. 2019, 243, 402–410. [Google Scholar] [CrossRef]
- UN HABITAT. State of the World Cities 2010/2011: Bridging the Urban Divide; Earthscan: London, UK, 2007. [Google Scholar]
- Lohnert, B. Migration and the Rural-Urban Transition in Sub-Saharan Africa; SLE Discussion Paper; Seminar für ländliche Entwicklung (SLE): Berlin, Germany, 2017; ISBN 978-3-936602-90-6. [Google Scholar]
- African Development Bank Organisation for Economic Co-operation and Development. United Nations Development Programme: Part II Sustainable cities and structural transformation. In African Economic Outlook 2016; Available online: https://www.afdb.org/fileadmin/uploads/afdb/Documents/Publications/AEO_2016_Report_Full_English.pdf (accessed on 5 January 2019).
- Malaviya, S.; Munsi, M.; Oinam, G.; Joshi, P.K. Landscape approach for quantifying land use land cover change (1972–2006) and habitat diversity in a mining area in Central India (Bokaro, Jharkhand). Environ. Monit. Assess. 2010, 170, 215–229. [Google Scholar] [CrossRef]
- Punia, M.; Singh, L. Entropy Approach for Assessment of Urban Growth: A Case Study of Jaipur, India. J. Indian Soc. Remote Sens. 2012, 40, 231–244. [Google Scholar] [CrossRef]
- Yuan, F.; Sawaya, K.E.; Loeffelholz, B.C.; Bauer, M.E. Land cover classification and change analysis of the Twin Cities (Minnesota) Metropolitan Area by multitemporal Landsat remote sensing. Remote Sens. Environ. 2005, 98, 317–328. [Google Scholar] [CrossRef]
- Mundia, C.N.; Aniya, M. Analysis of land use/cover changes and urban expansion of Nairobi city using remote sensing and GIS. Int. J. Remote Sens. 2005, 26, 2831–2849. [Google Scholar] [CrossRef]
- Hove, M.; Tirimboi, A. Assessment of Harare Water Service Delivery. J. Sustain. Dev. Afr. 2011, 13, 61–84. [Google Scholar]
- Wania, A.; Kemper, T.; Tiede, D.; Zeil, P. Mapping recent built-up area changes in the city of Harare with high resolution satellite imagery. Appl. Geogr. 2014, 46, 35–44. [Google Scholar] [CrossRef]
- Abdullah, A.Y.M.; Masrur, A.; Adnan, M.S.G.; Baky, M.A.A.; Hassan, Q.K.; Dewan, A. Spatio-temporal Patterns of Land Use/Land Cover Change in the Heterogeneous Coastal Region of Bangladesh between 1990 and 2017. Remote Sens. 2019, 11, 790. [Google Scholar] [CrossRef]
- As-syakur, A.R.; Adnyana, I.W.S.; Arthana, I.W.; Nuarsa, I.W. Enhanced Built-Up and Bareness Index (EBBI) for Mapping Built-Up and Bare Land in an Urban Area. Remote Sens. 2012, 4, 2957–2970. [Google Scholar] [CrossRef]
- Nooni, I.K.; Duker, A.A.; Van Duren, I.; Addae-Wireko, L.; Osei Jnr, E.M. Support vector machine to map oil palm in a heterogeneous environment. Int. J. Remote Sens. 2014, 35, 4778–4794. [Google Scholar] [CrossRef]
- Chemura, A.; Mutanga, O. Developing detailed age-specific thematic maps for coffee (Coffea arabica L.) in heterogeneous agricultural landscapes using random forests applied on Landsat 8 multispectral sensor. Geocarto Int. 2017, 32, 759–776. [Google Scholar] [CrossRef]
- Sinha, P.; Verma, N.K.; Ayele, E. Urban Built-up Area Extraction and Change Detection of Adama Municipal Area using Time-Series Landsat Images. Int. J. Adv. Remote Sens. GIS 2016, 5, 1886–1895. [Google Scholar] [CrossRef]
- Faridatul, M.I.; Wu, B. Automatic Classification of Major Urban Land Covers Based on Novel Spectral Indices. IJGI 2018, 7, 453. [Google Scholar] [CrossRef]
- Kamusoko, C.; Gamba, J.; Murakami, H. Monitoring Urban Spatial Growth in Harare Metropolitan Province, Zimbabwe. Adv. Remote Sens. 2013, 2, 322–331. [Google Scholar] [CrossRef]
- Hegazy, I.R.; Kaloop, M.R. Monitoring urban growth and land use change detection with GIS and remote sensing techniques in Daqahlia governorate Egypt. Int. J. Sustain. Built Environ. 2015, 4, 117–124. [Google Scholar] [CrossRef]
- Chirisa, I.E.W.; Muhomba, K. Constraints to managing urban and housing land in the context of poverty: A case of Epworth settlement in Zimbabwe. Local Environ. 2013, 18, 950–964. [Google Scholar] [CrossRef]
- Shafizadeh Moghadam, H.; Helbich, M. Spatiotemporal urbanization processes in the megacity of Mumbai, India: A Markov chains-cellular automata urban growth model. Appl. Geogr. 2013, 40, 140–149. [Google Scholar] [CrossRef]
- Mushore, T.D.; Odindi, J.; Dube, T.; Mutanga, O. Prediction of future urban surface temperatures using medium resolution satellite data in Harare metropolitan city, Zimbabwe. Build. Environ. 2017, 122, 397–410. [Google Scholar] [CrossRef]
- Tibaijuka, A.K. Report of the Fact-Finding Mission to Zimbabwe to Assess the Scope and Impact of Operation Murambatsvina; United Nations: New York, NY, USA, 2005. [Google Scholar]
- Potts, D. “We Have A Tiger by the Tail”: Continuities and Discontinuities in Zimbabwean City Planning and Politics. Crit. Afr. Stud. 2011, 4, 15–46. [Google Scholar] [CrossRef][Green Version]
- Nyamapfene, K. Soils of Zimbabwe; Nehanda Publishers: Harare, Zimbabwe, 1991. [Google Scholar]
- Anderson, I.P.; Brinn, P.J.; Moyo, M.; Nyamwanza, B. Physical Resource Inventory of the Communal Lands of Zimbabwe-An Overview (NRI Bulletin 60); Natural Resources Institute: Chatham Maritime, Kent, UK, 1993. [Google Scholar]
- Lister, L.A.; Phil, D. The Erosion Surfaces of Zimbabwe; Zimbabwe Geological Survey Bulletin, No. 90; Geological Survey Department: Harare, Zimbabwe, 1987. [Google Scholar]
- CSO (Central Statistical Office). Census 2002 Population Census: Provincial Profile Harare; CSO (Central Statistical Office): Harare, Zimbabwe, 2004. [Google Scholar]
- ZimStats (Zimbabwe National Statistics Agency) Census 2012: Preliminary Report; Harare, Zimbabwe, 2012; Available online: http://www.zimstat.co.zw/sites/default/files/img/publications/Population/Harare.pdf (accessed on 7 August 2018).
- Patley, M.; Tripathi, R.; Lokesh, P. Urbanization and Change Detection of Land Use Land Cover of the Holy City Ujjain. Int. J. Sci. Eng. Res. 2018, 9. [Google Scholar] [CrossRef]
- Chander, G.; Markham, B.L.; Helder, D.L. Summary of current radiometric calibration coefficients for Landsat MSS, TM, ETM+, and EO-1 ALI sensors. Remote Sens. Environ. 2009, 113, 893–903. [Google Scholar] [CrossRef]
- Castillejo-González, I.L.; Pena-Barragán, J.M.; Jurado-Expósito, M.; Mesas-Carrascosa, F.J.; López-Granados, F. Evaluation of pixel-and object-based approaches for mapping wild oat (Avena sterilis) weed patches in wheat fields using QuickBird imagery for site-specific management. Eur. J. Agron. 2014, 59, 57–66. [Google Scholar] [CrossRef]
- Mwakapuja, F.; Liwa, E.; Kashaigili, J. Usage of Indices for Extraction of Built-up Areas and Vegetation Features from Landsat TM Image: A Case of Dar Es Salaam and Kisarawe Peri-Urban Areas, Tanzania. Int. J. Agric. For. 2013, 3, 273–283. [Google Scholar]
- Vapnik, V.N. The Nature of Statistical Learning Theory; John Wiley & Sons: New York, NY, USA, 1998. [Google Scholar]
- Congalton, R.G. A review of assessing the accuracy of classifications of remotely sensed data. Remote Sens. Environ. 1991, 37, 35–46. [Google Scholar] [CrossRef]
- Xu, H. Modification of normalised difference water index (NDWI) to enhance open water features in remotely sensed imagery. Int. J. Remote Sens. 2006, 27, 3025–3033. [Google Scholar] [CrossRef]
- Huete, A.R. A soil-adjusted vegetation index (SAVI). Remote Sens. Environ. 1988, 25, 295–309. [Google Scholar] [CrossRef]
- Anselm, N.; Brokamp, G.; Schütt, B. Assessment of Land Cover Change in Peri-Urban High Andean Environments South of Bogotá, Colombia. Land 2018, 7, 75. [Google Scholar] [CrossRef]
- Herron, M.C. Postestimation Uncertainty in Limited Dependent Variable Models. Polit. Anal. 1999, 8, 83–98. [Google Scholar] [CrossRef]
- Pontius, R.G.; Schneider, L.C. Land-cover change model validation by an ROC method for the Ipswich watershed, Massachusetts, USA. Agric. Ecosyst. Environ. 2001, 85, 239–248. [Google Scholar] [CrossRef]
- Pontius, R.G., Jr.; Batchu, K. Using the relative operating characteristic to quantify certainty in prediction of location of land cover change in India. Trans. GIS 2003, 7, 467–484. [Google Scholar] [CrossRef]
- Schubert, H.; Caballero Calvo, A.; Rauchecker, M.; Rojas-Zamora, O.; Brokamp, G.; Schütt, B. Assessment of Land Cover Changes in the Hinterland of Barranquilla (Colombia) Using Landsat Imagery and Logistic Regression. Land 2018, 7, 152. [Google Scholar] [CrossRef]
- Zhang, H.; Qi, Z.; Ye, X.; Cai, Y.; Ma, W.; Chen, M. Analysis of land use/land cover change, population shift, and their effects on spatiotemporal patterns of urban heat islands in metropolitan Shanghai, China. Appl. Geogr. 2013, 44, 121–133. [Google Scholar] [CrossRef]
- Herold, M.; Roberts, D.A.; Gardner, M.E.; Dennison, P.E. Spectrometry for urban area remote sensing—Development and analysis of a spectral library from 350 to 2400 nm. Remote Sens. Environ. 2004, 91, 304–319. [Google Scholar] [CrossRef]
- Kucsicsa, G.; Grigorescu, I. Urban Growth in the Bucharest Metropolitan Area: Spatial and Temporal Assessment Using Logistic Regression. J. Urban Plan. Dev. 2018, 144, 5017013. [Google Scholar] [CrossRef]
- Cumming, S.D.; Tevera, D.S.; Zinyama, L.M. Harare: The Growth and Problems of the City; University of Zimbabwe Publications: Harare, Zimbabwe, 1993. [Google Scholar]
- Zinyama, L. The evolution of spatial structure in greater Harare. In Harare: The Growth and Problems of the City; Zinyama, L.M., Tevera, D.S., Cumming, D., Eds.; University of Zimbabwe Publications: Harare, Zimbabwe, 1995. [Google Scholar]
- Araya, Y.H.; Cabral, P. Analysis and Modeling of Urban Land Cover Change in Setúbal and Sesimbra, Portugal. Remote Sens. 2010, 2, 1549–1563. [Google Scholar] [CrossRef]
- Kamete, A.Y. Cold-hearted, negligent and spineless? Planning, planners and the (r) ejection of “filth” in urban Zimbabwe. Int. Plan. Stud. 2007, 12, 153–171. [Google Scholar] [CrossRef]
- Toriro, P. Town Planning in Zimbabwe: History Challenges and the Urban Renewal Operation Murambatsvina and Operation Garikayi; OSSREA: Harare, Zimbabwe, 2007. [Google Scholar]
- Chirisa, I. Building and urban planning in Zimbabwe with special reference to Harare: Putting needs, costs and sustainability in focus. Consilience 2014, 11, 1–26. [Google Scholar]
- Douglas, I. The Urban Environment; Edward Anorld (Publisher) Ltd.: London, UK, 1983. [Google Scholar]
- Turral, H.; Burke, J.; Faurès, J.M. Climate Change, Water and Food Security; Water Reports; FAO: Rome, Italy, 2011. [Google Scholar]
- Government of Zimbabwe (GoZ). Report on Development of Human Settlements in Zimbabwe; Government of Zimbabwe: Harare, Zimbabwe, 1991.


| Sensor | Number of Bands | Path/Row | Date of Acquisition |
|---|---|---|---|
| Landsat 5 TM | 7 | 172/072 | 22 June 1984 |
| Landsat 5 TM | 7 | 172/072 | 23 June 1990 |
| Landsat 5 TM | 7 | 172/072 | 30 August 2000 |
| Landsat 5 TM | 7 | 172/072 | 11 August 2008 |
| Landsat 8 OLI | 11 | 172/072 | 11 August 2018 |
| ID | LULC Class | Description |
|---|---|---|
| 1 | CBD/industries | Industries and central business district defined with a high fraction of impervious surfaces, mainly buildings and a small proportion of vegetation |
| 2 | LMD residential | Leafy and well-established low- and medium-density suburbs surrounded with high vegetation |
| 3 | HD residential | High-density residential areas with low vegetation cover or clustered settlements with areas undergoing developments and bare exposed land |
| 4 | Irrigated cropland | Cultivated land under irrigation schemes |
| 5 | Rain-fed cropland | Cultivated land or land with crop residues after harvesting |
| 6 | Vegetation | All wooded areas, shrubs and bushes, riverine vegetation and grass covered areas |
| 7 | Water | Areas occupied by water, rivers, wetlands, reservoirs and dams |
| LULC Class | 1984 | 1990 | 2000 | 2008 | 2018 | |||||
|---|---|---|---|---|---|---|---|---|---|---|
| km2 | % | km2 | % | km2 | % | km2 | % | km2 | % | |
| CBD/industries | 32.95 | 3.70 | 36.27 | 4.07 | 52.98 | 5.95 | 54.27 | 6.09 | 63.88 | 7.17 |
| LMD residential | 194.72 | 21.85 | 233.02 | 26.15 | 241.53 | 27.11 | 252.48 | 28.33 | 262.74 | 29.48 |
| HD residential | 51.79 | 5.81 | 61.13 | 6.86 | 84.61 | 9.49 | 121.96 | 13.69 | 218.35 | 24.50 |
| Irrigated cropland | 18.13 | 2.04 | 39.30 | 4.41 | 67.77 | 7.61 | 28.55 | 3.20 | 26.68 | 2.99 |
| Rainfed cropland | 141.26 | 15.85 | 115.74 | 12.99 | 79.34 | 8.90 | 85.42 | 9.59 | 93.26 | 10.47 |
| Vegetation | 448.67 | 50.35 | 401.88 | 45.10 | 360.13 | 40.41 | 344.48 | 38.66 | 223.45 | 25.08 |
| Water | 3.60 | 0.40 | 3.78 | 0.42 | 4.76 | 0.53 | 3.96 | 0.44 | 2.76 | 0.31 |
| LULC Class | 1984 | 1990 | 2000 | 2008 | 2018 | |||||
|---|---|---|---|---|---|---|---|---|---|---|
| PA | UA | PA | UA | PA | UA | PA | UA | PA | UA | |
| CBD/industries | 94.7 | 93.7 | 99.2 | 93.7 | 96.7 | 90.3 | 96.4 | 96.4 | 96.6 | 95.3 |
| LMD residential | 89.4 | 90.2 | 81.9 | 87.3 | 87.4 | 92.4 | 84.5 | 75.5 | 84.1 | 84.6 |
| HD residential | 82.2 | 85.0 | 77.7 | 93.3 | 83.4 | 89.9 | 79.8 | 83.5 | 92.9 | 92.5 |
| Irrigated cropland | 87.6 | 95.1 | 78.4 | 91.9 | 76.2 | 82.3 | 93.0 | 87.4 | 84.4 | 83.3 |
| Rain-fed cropland | 84.1 | 87.2 | 67.4 | 80.5 | 85.6 | 79.0 | 90.9 | 79.6 | 86.8 | 88.7 |
| Vegetation | 93.4 | 90.1 | 92.9 | 71.1 | 90.2 | 82.4 | 79.1 | 91.8 | 88.9 | 88.9 |
| Water | 89.3 | 96.9 | 98.4 | 100 | 97.3 | 99.5 | 98.9 | 99.8 | 99.2 | 100 |
| OA | 90.1 | 85.1 | 88.9 | 87.6 | 89.7 | |||||
| KC | 0.87 | 0.82 | 0.86 | 0.85 | 0.87 | |||||
© 2019 by the authors. Licensee MDPI, Basel, Switzerland. This article is an open access article distributed under the terms and conditions of the Creative Commons Attribution (CC BY) license (http://creativecommons.org/licenses/by/4.0/).
Share and Cite
Marondedze, A.K.; Schütt, B. Dynamics of Land Use and Land Cover Changes in Harare, Zimbabwe: A Case Study on the Linkage between Drivers and the Axis of Urban Expansion. Land 2019, 8, 155. https://doi.org/10.3390/land8100155
Marondedze AK, Schütt B. Dynamics of Land Use and Land Cover Changes in Harare, Zimbabwe: A Case Study on the Linkage between Drivers and the Axis of Urban Expansion. Land. 2019; 8(10):155. https://doi.org/10.3390/land8100155
Chicago/Turabian StyleMarondedze, Andrew K., and Brigitta Schütt. 2019. "Dynamics of Land Use and Land Cover Changes in Harare, Zimbabwe: A Case Study on the Linkage between Drivers and the Axis of Urban Expansion" Land 8, no. 10: 155. https://doi.org/10.3390/land8100155
APA StyleMarondedze, A. K., & Schütt, B. (2019). Dynamics of Land Use and Land Cover Changes in Harare, Zimbabwe: A Case Study on the Linkage between Drivers and the Axis of Urban Expansion. Land, 8(10), 155. https://doi.org/10.3390/land8100155