Abstract
Urban expansion has become a widespread trend in developing countries. Road networks are an extremely important factor driving the expansion of urban land and require further study. To investigate the relationship between road networks and urban expansion, we selected Beijing, New York, London, and Chicago as study areas. First, we obtained urban land use vector data through image interpretation using a remote sensing (RS) and geographic information systems (GIS) platform and then used overlay analysis to extract information on urban expansion. A road network density map was generated using the density analysis tool. Finally, we conducted a spatial statistical analysis between road networks and urban expansion and then systematically analyzed their distribution features. In addition, the Urban Expansion-Road Network Density Model was established based on regression analysis. The results indicate that (1) the road network density thresholds of Beijing, New York, London, and Chicago are 18.9 km/km2, 37.8 km/km2, 57.0 km/km2, and 64.7 km/km2, respectively, and urban expansion has an inverted U-curve relationship with road networks when the road network density does not exceed the threshold; (2) the calculated turning points for urban expansion indicate that urban expansion initially accelerates with increasing road network density but then decreases after the turning point is reached; and (3) when the road density exceeds the threshold, urban areas cease to expand. The correlation between urban expansion and road network features provides an important reference for the future development of global cities. Understanding road network density offers some predictive capabilities for urban land expansion, facilitates the avoidance of irregular expansion, and provides new ideas for addressing the inefficient utilization of land.
1. Introduction
Urban expansion is an important stage and inevitable occurrence in urban social and economic development [1,2]. With the rapid development of global urbanization, the compact use of urban land has become even more important. Rational urban planning, the control of urban expansion, and the prevention of disorderly unauthorized construction are beneficial to sustainable urban development. Road networks, which are the “skeleton” of urban social development and the foundation and important driving factor for urban land expansion, are closely linked with urban expansion [3,4]. Road networks, which are integral components of the infrastructure and support urban integration, connect various functional areas. Increasingly well-developed road networks bring the administrative regions of cities into closer contact and accelerate the exchange and aggregation of logistics, energy flows, information flows, capital flows, and other flows. The investment scale, area, space action, and other factors of road networks have made these features significant drivers of urban expansion [5,6,7]. Thus, the rapid expansion of urban land increases the rigid demand for the land in road networks.
Urban expansion is a research focus of land use cover/change, urban development, ecology, and other areas, and many scholars have conducted studies on this topic, including the drivers of urban land expansion, temporal and spatial variations, simulations and predictions, ecological and environmental effects, and other effects [8,9,10]. The main research methods include methods for monitoring spatial expansion that are based on geographic information systems (GIS) and remote sensing (RS) [11,12], logistic regressions [13,14,15], cellular automata (CA) [9,16], and other analysis methods that involve models of system dynamics. Burchfield, et al. [17] studied the extent to which urban development in the U.S. was expanding and what determined the spatial differences in expansion. These authors used remote sensing data to track the evolution of land use and noted that early public transport infrastructure increased expansion. Handy [18] provided an overview of the theory of smart growth and made several specific propositions regarding the relationships between transportation and land use: (1) building more highways contributes to more sprawl, (2) building more highways leads to more driving, (3) investing in light rail transit systems increases densities, and (4) adopting new urbanism design strategies reduces automobile use. Additionally, the use of road networks for the promotion of urban land expansion was emphasized. Tayyebi, et al. [19] proposed an urban growth boundary model (UGBM) that uses artificial neural networks (ANNs), geospatial information systems, and RS to simulate the complex geometry of the urban boundaries of Tehran, Iran. ANNs were used to train on “roads” as the first predictor variables of the urban boundary geometry in Tehran. Alsharif and Pradhan [13] analyzed urban sprawl in the metropolitan city of Tripoli by using a logistic regression model and found that roads were an important driving force in the region. Thus, road networks are an important driving factor of urban expansion [20,21,22]. However, studies investigating the specific relationship between road networks and urban expansion are uncommon.
In contrast, the effect of roads on land use is one of the most active research areas in road ecology and landscape studies [23,24,25]. Important results have been obtained by research on road networks, and scholars have focused on the ecological effects of road networks [26], design and optimization [27], the response of road networks to urbanization [24], the evolution of road networks [28], and other aspects. Research on road networks and urbanization has increased in recent years because the world is experiencing a period of rapid urbanization [29]. Rui and Ban [30] examined the relationship between different street centralities and land-use types in Stockholm and found that the density of each street centrality was highly correlated with one type of land use. To study the evolution and complexity of urban street networks, Mohajeri and Gudmundsson [31] introduced methods for quantifying the geometric characteristics of street networks and analyzed the details of the evolution of the networks of Sheffield (U.K.), Khorramabad (Iran), and Kerman (Iran) over tens to hundreds of years. Their results suggested that the spatial distribution of streets was strongly affected by the surrounding landscapes but in different ways. Lerman, et al. [32] used spatial syntax to model pedestrian movement in urban transportation planning; their study showed that the distribution of pedestrian movement could be explained by the spatial variables that represent the properties of a street network. In brief, road network and urbanization studies have attracted increasing attention. However, the results of most of these studies are lacking in terms of the quantitative relationships between urban road networks and urbanization factors at the holistic urban scale; thus, the effectiveness of roads and their role in urbanization remains unclear.
In summary, few quantitative studies have examined the correlation between urban land expansion and road networks, and the existing results do not effectively guide practical work related to land use. Previous studies of urban expansion mainly found that road networks are one of the driving forces of urban expansion, but related studies from the perspective of road networks are lacking. Furthermore, the driving mechanism of road network density is unclear. Although a turning point and critical value of the urban expansion cycle, which are driven by the road network density, may exist, these concrete values have not been measured. The lack of quantitative research and the abundance of studies that only examined their qualitative relationship have created limitations in terms of land-use planning, decision making, and other processes.
To address these issues, this study aims to reveal the quantitative relationship between road networks and urban land expansion by establishing a quantitative model of the relationship between road networks and urban expansion in Beijing, New York, Chicago, and London. In this paper, the term “urban expansion” refers to urban land space expansion. We assume that the urban population growth, tax structure, policy, and other driving factors of urban expansion maintain relatively steady growth and do not fluctuate considerably during the study period. The objectives of this study are (1) to summarize the spatial distribution characteristics of the expansion of these four cities over nearly 30 years and the classification signatures of the urban road networks in 2014 based on RS and GIS; (2) to analyze the spatial coupling relationship between urban expansion and the road network density using spatial statistics; and (3) to model the quantitative relationship between the road network density and urban expansion using regression analysis methods to compute the eigenvalues of urban expansion. Our study is designed to help urban planners and decision-makers better understand the quantitative relationship between road networks and urban land expansion and make scientifically sound decisions for future urban development, particularly in developing countries.
The remainder of this study is organized as follows. Section 2 describes the study areas and data sources and introduces the methodology and data processing. Section 3 analyzes the results of the spatial and temporal characteristics of urban land expansion, the road network density characteristics of urban expansion, and the fitting analysis of the road network density and urban expansion. Section 4 presents the discussion, and conclusions are provided in Section 5.
2. Data and Methodology
2.1. Study Area
Beijing, New York, London, and Chicago, four international metropolises, are used as the study areas in this article (see Figure 1). These four cities are “world class cities”. Moreover, these study areas are distributed in different locations around the world and have undergone or are undergoing rapid development via urban expansion and road network construction. Over the past three decades, urban expansion in New York, London, and Chicago has remained nearly steady [33], and the lag effects of urban expansion on the road network density are not obvious. Beijing is in a rapid development stage, and the lag effects of urban expansion are currently difficult to quantify [34]. In addition, these four cities exhibit different types of urban patterns, covering coastal, lake, island, and plains cities. The expansion in Beijing, New York, London, and Chicago has been nearly stable, and a comparative study of these cities provides a meaningful reference for development in other regions, particularly in developing cities.
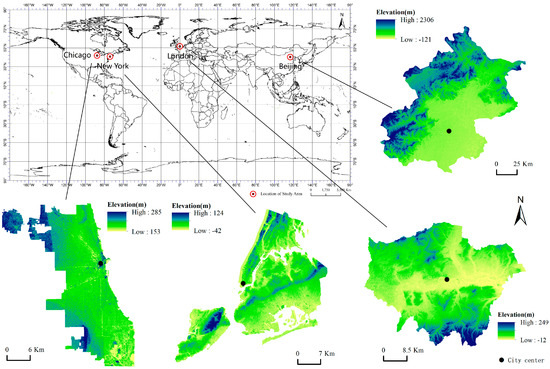
Figure 1.
Location, topography, and city center (location of the municipal government) of the study areas—Beijing, New York, London, and Chicago.
Urban boundaries for comparative studies of cities in different countries are very important [35], and the related definitions include those of the cities, urbanized areas, and metropolitan areas. Identifying the theoretical urban boundaries of these four megacities is challenging. Considering the main purpose of the study (to provide a decision-making reference for the development of cities in developing countries) and access to authoritative and comparable data, the administrative boundaries were selected as the study area’s boundaries. Moreover, this study mainly investigates the expansion of single cities in relation to road networks and does not consider the interactions between metropolitan core areas and suburban cities.
2.2. Data Sources
To study the temporal and spatial relationships between urban expansion and road networks, historical data and spatial data are necessary. After reviewing the literature and querying the existing data, we decided to take advantage of key data, including RS data and the vectors of the spatial distribution of urban roads and urban borders.
RS data that were derived from Landsat satellite images were used for the image interpretation of the spatial distribution of urban land and the extraction of information regarding urban land use changes. The basic requirements of the data selection were a resolution of 30 m × 30 m, cloud cover less than 10%, and suitably high image quality for accurate interpretation. The collected satellite data are shown in Table 1. Vector data associated with urban road networks corresponding to the time of the RS data were derived from the Open Street Map database [36]. Maps of the spatial distribution of the roads were generated for each city by extracting information for highways, main roads, secondary roads, railways, and other road classes.

Table 1.
Details of the Landsat images and other data that were used for this study.
The administrative boundaries were used as urban boundaries in this paper. The vector data that were associated with the city boundaries were downloaded from the official website of the city government departments and other databases, and we converted their coordinate systems and projection coordinates in accordance with the RS data.
2.3. Methodology
2.3.1. Kernel Density Analysis
Urban road network density refers to the ratio of the total length of the centerline of urban roads to the urban land area; the fundamental equation is
where D is the road density in km/km2, is the length of the road centerline in km, and is the urban land area in km2.
The kernel density is a commonly used density analysis method for spatial analysis, which uses points or polyline features to compute the value of a unit area and fit each point or line over a smooth tapered surface. Possible uses include finding the density of houses, crime reports, roads, or utility lines that influence a town or wildlife habitat. In the ArcGIS density analysis tool, the population field can be used to weight some features more heavily than others, depending on their meaning, or to allow one point to represent several observations [37]. We computed the road length in every square kilometer unit by setting default bandwidths, and road network density maps were generated via kernel density analysis. The search radius is the radius within which the density is calculated. The units are based on the linear unit of the projection of the output spatial reference. The default search radius (bandwidth) is the shortest of the width or height of the output extent in the output spatial reference, divided by 30. The search radius of Beijing, New York, London, and Chicago was 5.90, 1.55, 1.50, and 1.14 km, respectively.
2.3.2. Overlay Analysis
Overlay analysis is one of the most commonly used spatial methods in GIS. This method can be used to reveal the characteristics of mutual differences, links, and changes between multiple layers of data. The spatial distribution of urban expansion was obtained with ArcGIS10.2, which was used to overlay and clip urban land use maps in two different periods. After adding the road network density layer to the analysis, we used the urban land expansion layer as a mask and obtained the corresponding point information between the road network density layer and the urban land expansion layer. Moreover, the spatial information from the corresponding locations of urban expansion and the road network provided the relevant data for a regression analysis.
2.3.3. Regression Analysis
Regression analysis is a statistical method for determining the quantitative relationship between two or more interdependent variables. In this paper, we used the curve estimation module in Statistical Product and Service Solutions (SPSS) to perform a regression analysis of the statistical results (i.e., urban space analysis) and optimized the road network-urban land expansion regression model. Generally, the curve estimate module includes a linear function, quadratic term function, compound function, logarithmic function, cubic function, exponential function, and other models. The optimal model is conveniently obtained by comparing and analyzing the results for each model fitted from graphs and tables.
We used a scatter plot that used the road network density as the independent variable and the urban expansion speed as the dependent variable. The relationship between the expansion speed and urban road network density could be presented as an inverted U-shape. This shape is consistent with the characteristics of a non-linear model, specifically, a curve model, such as a quadratic or cubic equation. However, the curvature changes were minimal, and the curve magnitude was not large, gently varied, and generally exhibited a downward trend. This behavior was approximated by using a simple linear regression model. In addition, relevant studies have shown that the relationship between urbanization and per capita income obeys a logarithmic law over certain ranges of time and space [38], and the relationship between urban expansion and road transport network connectivity also satisfies a logarithmic relationship [39]. Therefore, the relationship between urban expansion and road networks may satisfy a logarithmic relationship.
Urban expansion speed refers to the annual average area of the new expansion of urban built-up land in each megacity in the study area and is used to characterize the spatial scales of urban land expansion. This factor is equivalent to the new area of urban expansion (km2) in a specific timeframe divided by the elapsed time (years). We also established a simple linear regression model, simple curve regression model, and logarithmic model for urban expansion as a function of road density to explore the quantitative relationship between urban land expansion areas and the densities of the road networks. The specific models are as follows:
where y is the urban expansion rate, x is the road density, βi (i = 1,2,3) is the regression coefficient, a0 is a constant term, and εt is the regression residuals.
2.4. Data Processing
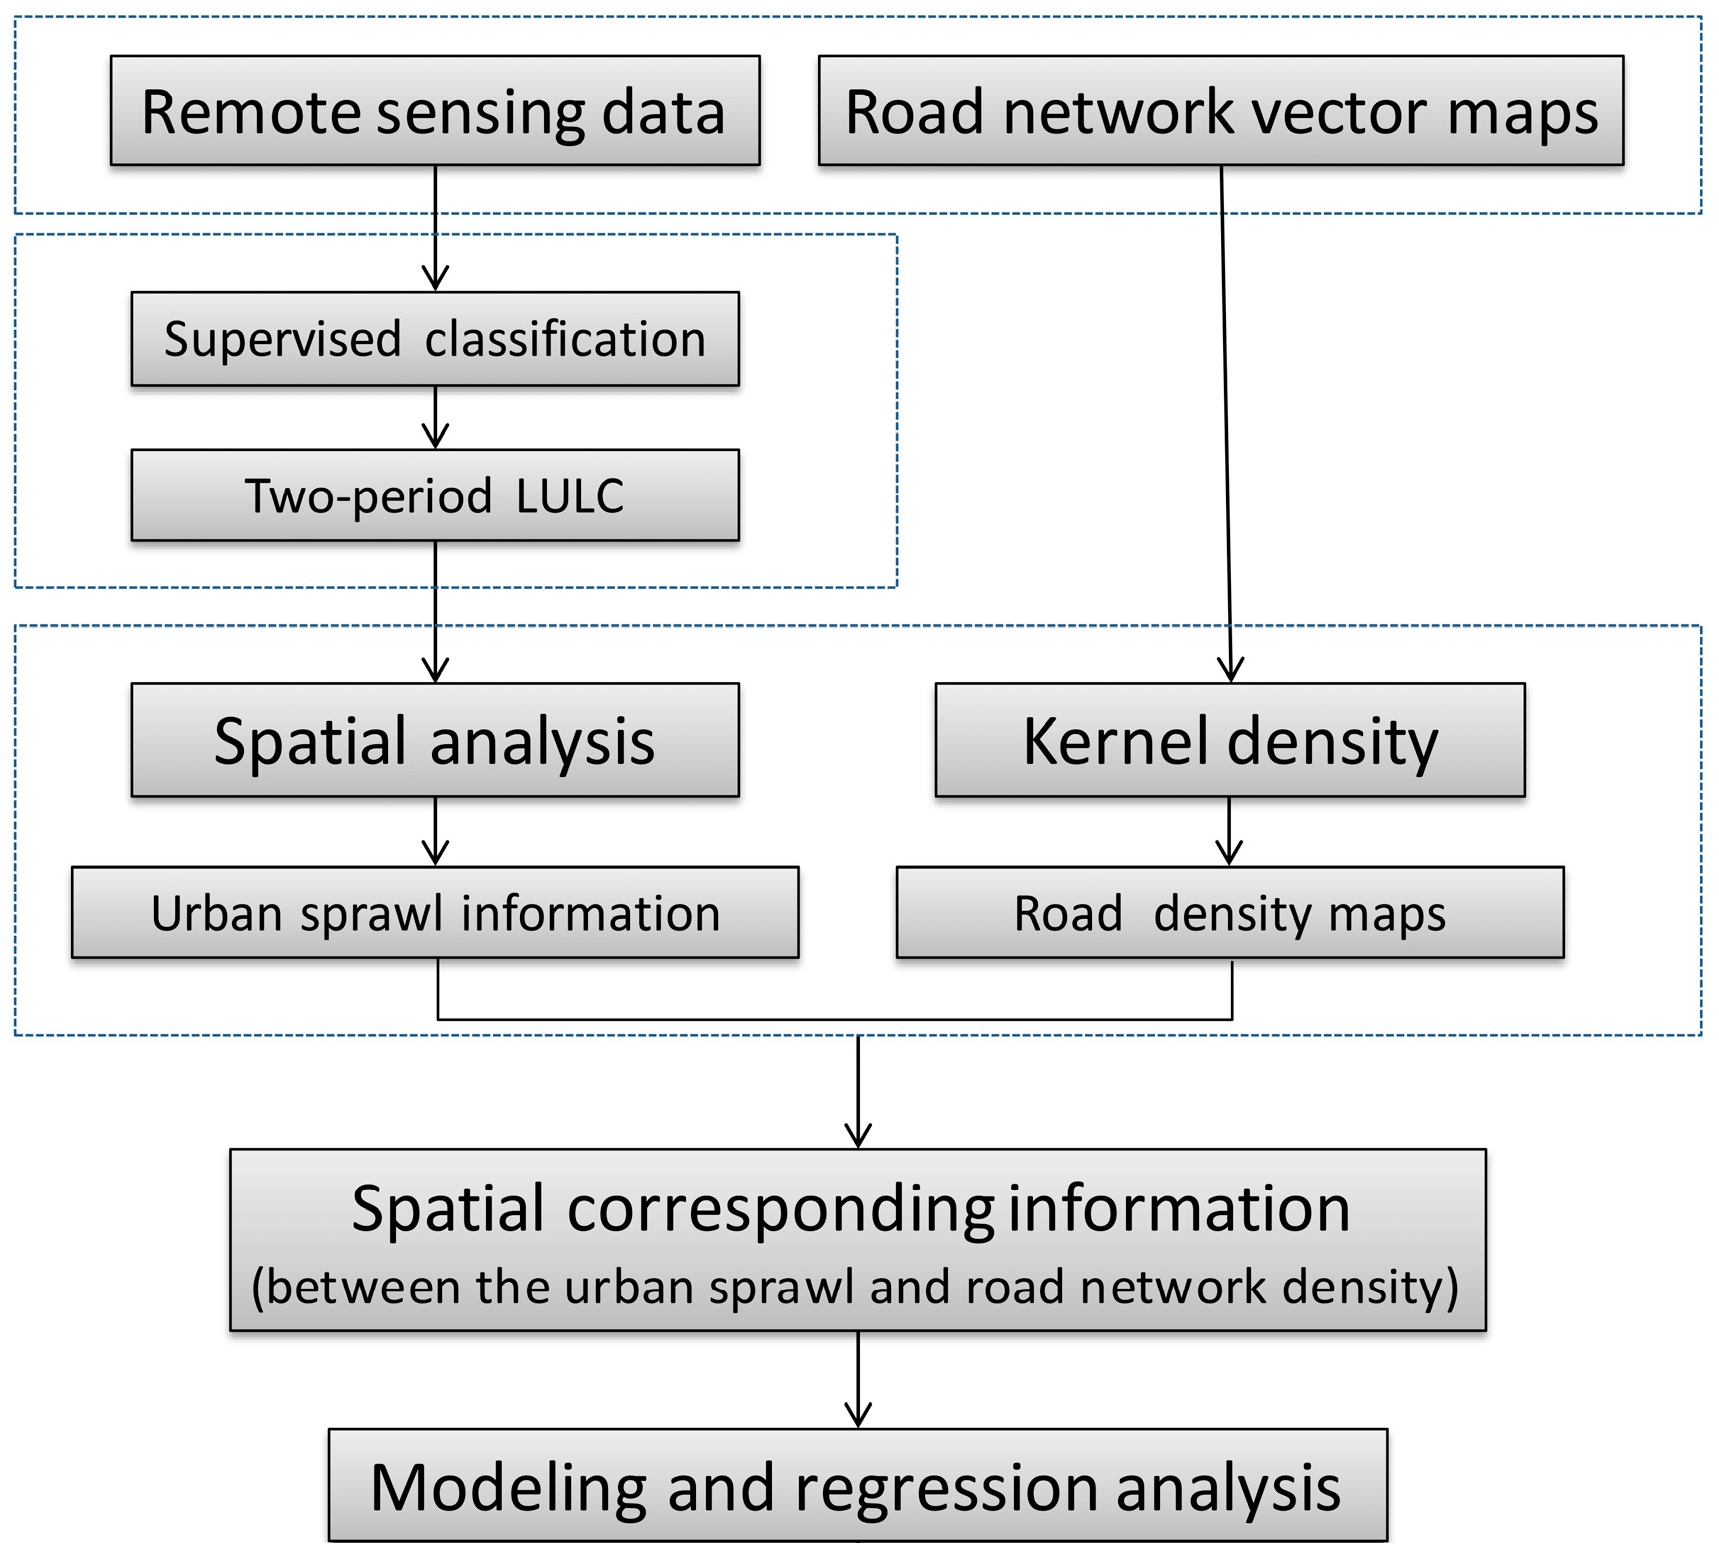
The data processing consisted of three steps: image interpretation with RS, overlay and spatial analysis, and regression analysis. The research process is shown in Figure 2.
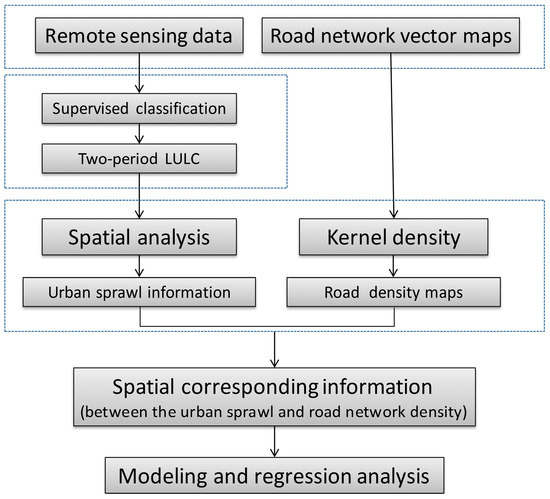
Figure 2.
Research flowchart.
(1) Based on the 1984 (or 1985) and 2014 (or 2013) RS images covering the study areas and according to the classifications of land use type, we used the maximum likelihood algorithm of supervised classification to interpret the Landsat TM images using the Environment for Visualizing Images (ENVI) 5.1. Considering our research purposes, the land classification system was divided into urban land, non-urban land, and water, and we extracted the type of urban land to generate the urban map [40]. According to the Confusion Matrix Using Ground Truth ROIs (region of interest, ROI) in ENVI’s toolset, the calculated kappa coefficients were greater than 0.85, which indicates high accuracy.
(2) Overlay analysis and spatial analysis were used to obtain the expansion area of urban land. We overlaid two period maps of urban land and calculated the differences with ArcGIS 10.2. Then, the spatial distribution of the new increase in urban land over approximately three decades was attained. Using the kernel density feature of the spatial analysis tools, we calculated the density of the urban road networks in 2014 and created density maps. The resolutions of the road density layer and the urban expansion layer were both 30 m × 30 m. Second, the data used in the corresponding relationship were extracted and converted into the ASCII format based on the spatial analysis of the density data and urban expansion area (see Table A1.).
(3) Using spatial statistics for the corresponding point between the road networks and urban land expansion, we quantified the relationship between the road networks and urban expansion and fitted a curve using a regression analysis. First, we converted the data from the ASCII format to the single-column text format, including the road network density value and urban land expansion area. Then, the urban expansion speed under each road density unit (0.1 km/km2) was calculated. Finally, using the statistical analysis tools available in SPSS, their relationship was quantified using a regression analysis.
3. Results
3.1. Spatial and Temporal Characteristics of Urban Land Expansion
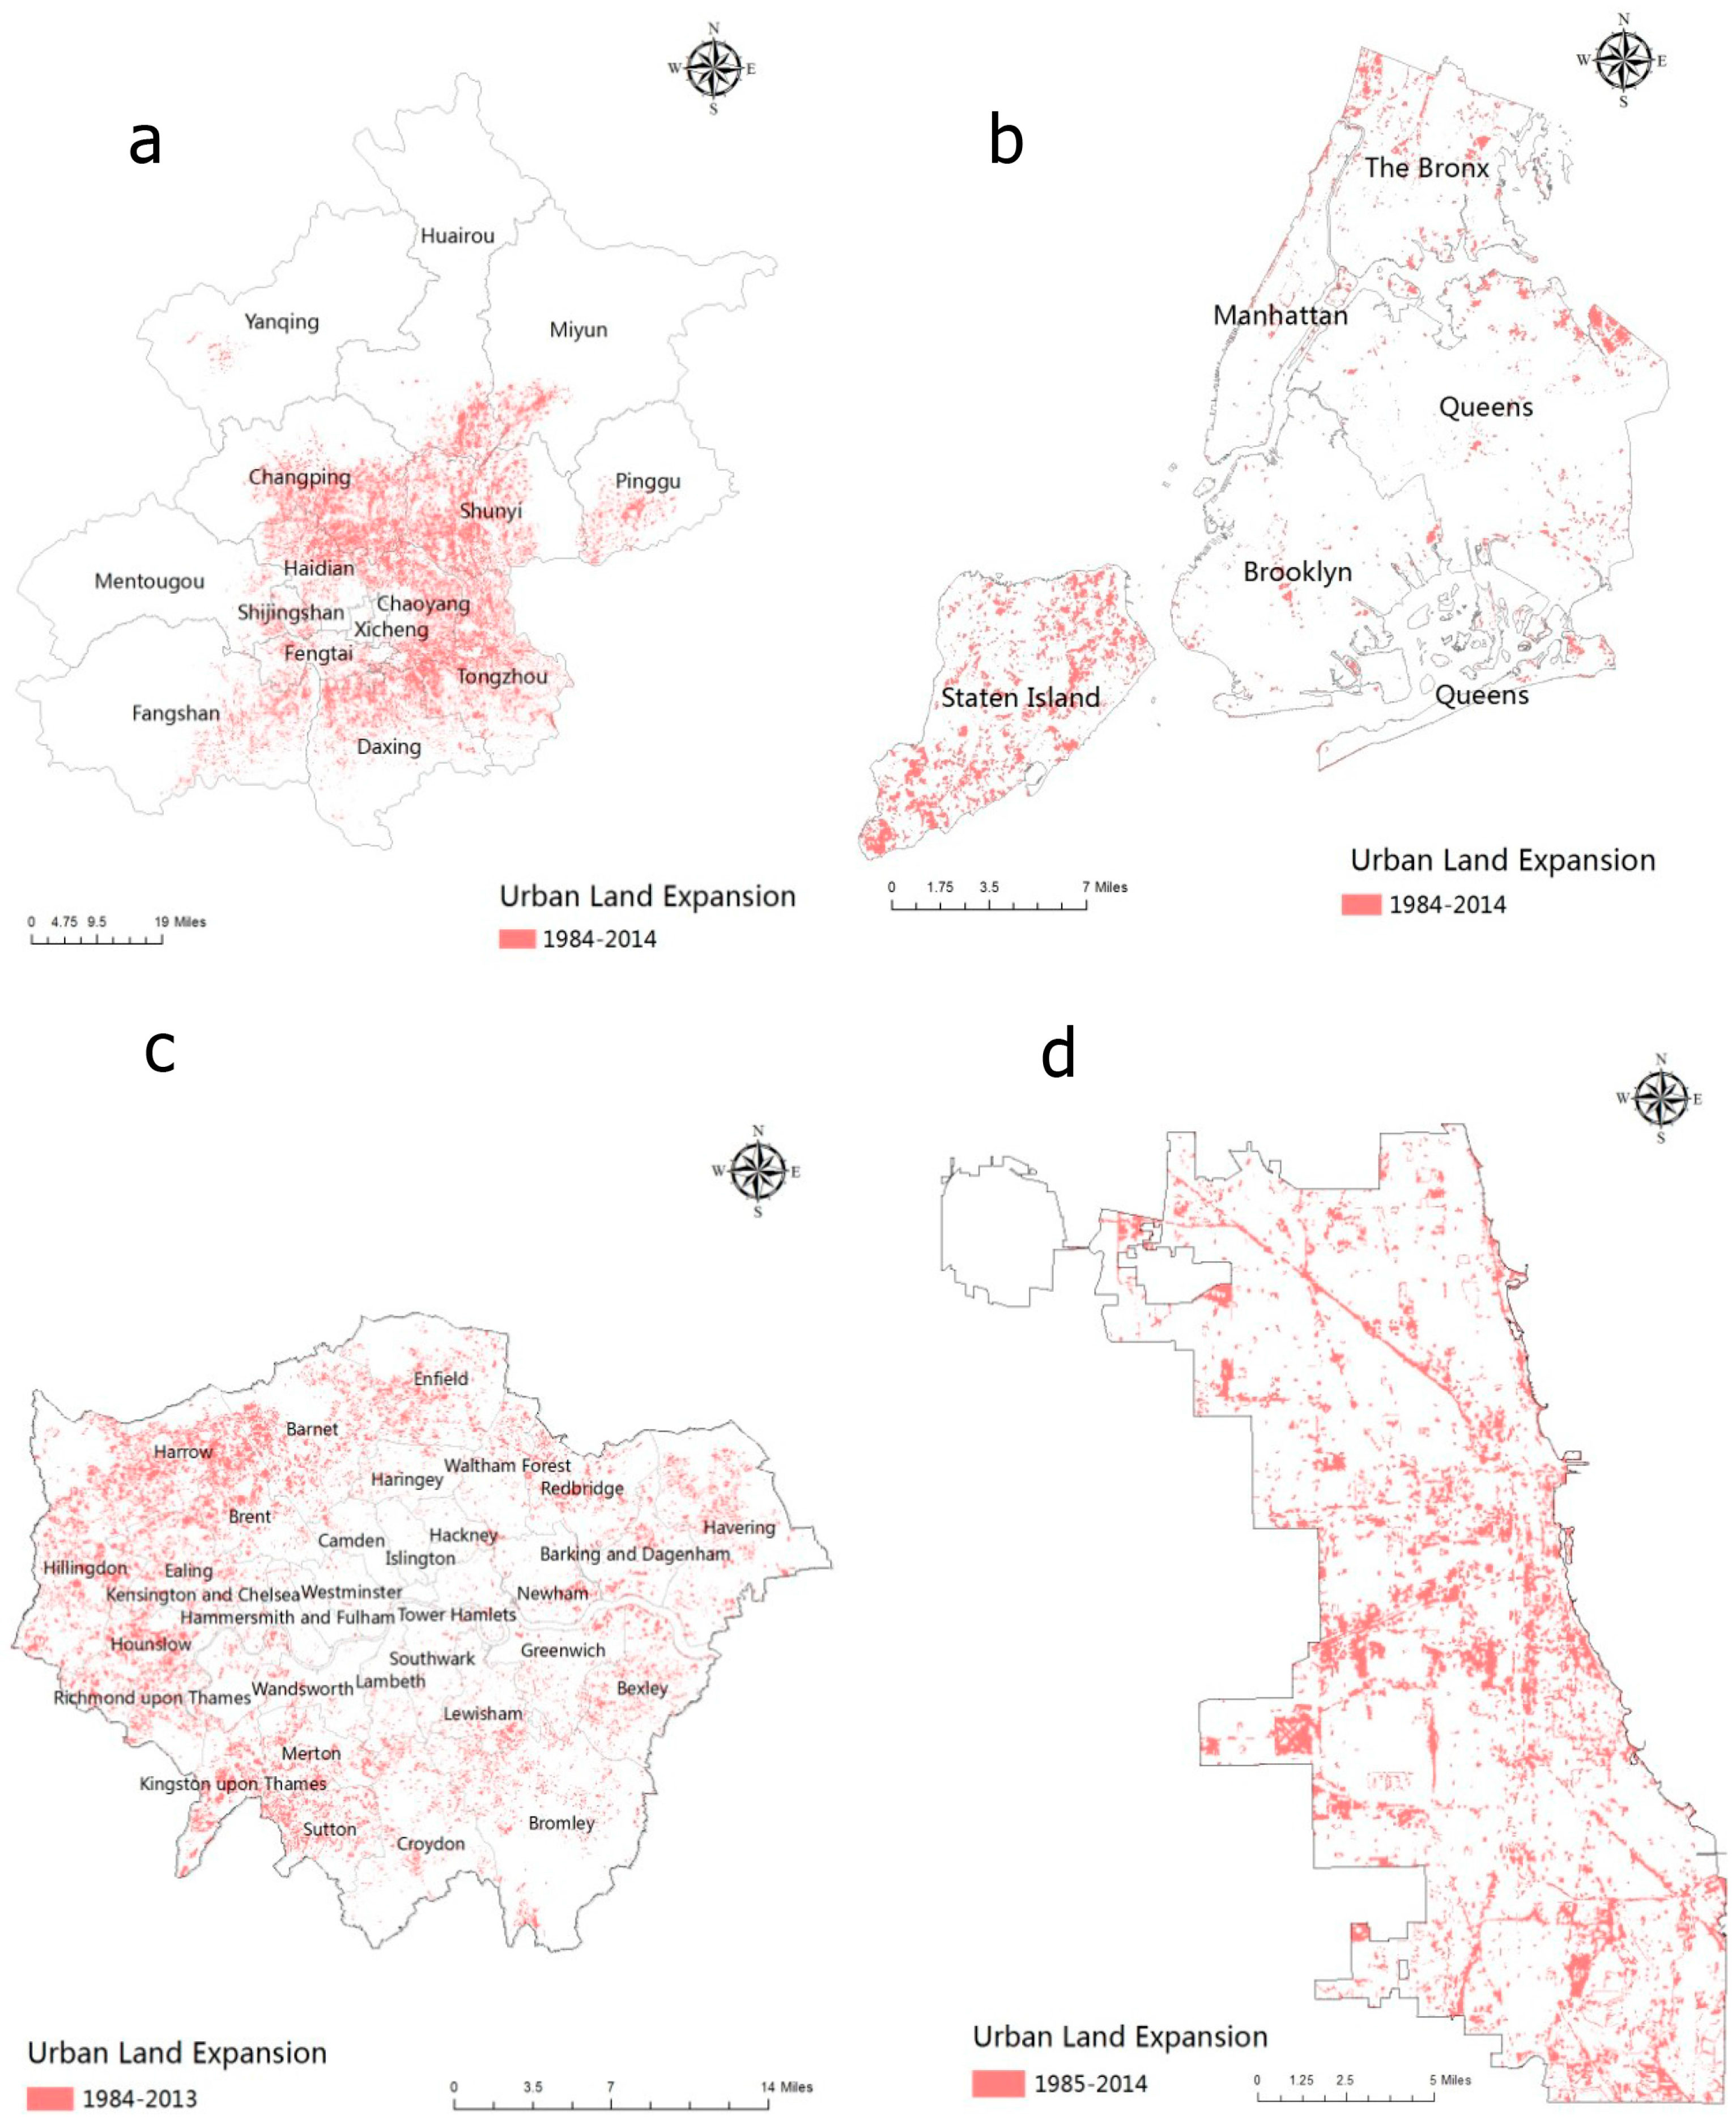
Our data processing results showed that urban land expansion in Beijing since 1984 has been significant, having expanded by 1521.57 km2 by 2014. The development of cities caused these areas to expand rapidly. Urban expansion in Beijing was mainly concentrated in the district outside the third ring, excluding the traditional areas (i.e., Dongcheng District and Xicheng District). In the Changping District, Daxing District, Tongzhou District, Fangshan District, and Mentougou District, expanded urban areas were distributed near the boundaries of the districts and the various districts around the old urban area. Meanwhile, the degree of expansion was relatively low in suburban areas, such as Yanqing County, Miyun County, Huairou District, Pinggu County, and Shunyi District, and the expansion areas were distributed around the old urban areas. Overall, urban expansion in Beijing began from the traditional core of the city, showing a disorderly and large-scale expansion, and the surrounding urban area was affected by the spatial radiation in the center of the city (see Figure 3a).
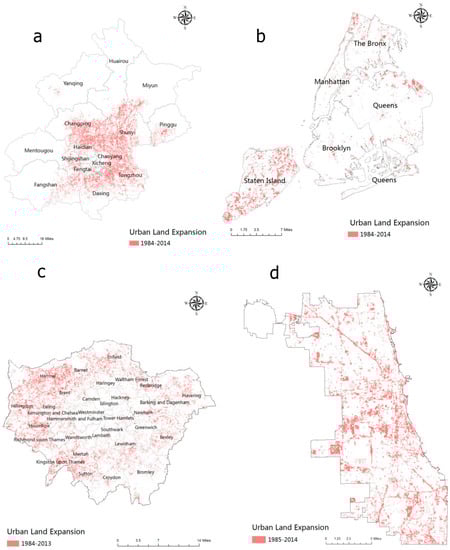
Figure 3.
Change in urban land over the last 30 years in (a) Beijing, (b) New York, (c) London, and (d) Chicago.
The characteristics of urban land expansion in New York are displayed in Figure 3b. Since 1984, urban expansion has been mainly concentrated in Staten Island (Richmond County) and Queens. Because of the sea reclamation project and land reclamation plan and due to considerable urban economic development, expansion has been minimal in the Bronx, Brooklyn, and Manhattan and was mainly distributed in the coastal regions or along rivers. As the most populous and economically developed borough, Manhattan underwent the earliest effective development, but urban expansion has since slowed. Similar to Manhattan, the development of Brooklyn’s economy began at an earlier time and has reached a high level; thus, urban expansion has been slower in the recent period of interest. With respect to the other four districts, Staten Island, which has experienced the largest urban land expansion over the past 30 years, is characterized by a remote location, low population density, more natural landscape, and a low level of land development. The Bronx, which was predominantly based on agriculture, has the largest garden area and more protected lands; thus, urban land has also expanded to a certain extent during this period. In Queens, the scale of urban expansion has developed gradually, mainly occurring close to the border during this period.
The characteristics of urban land expansion in London can be observed in Figure 3c. Since 1984, land expansion has mainly been distributed in the peripheral areas and far from the City of London and Westminster, including Hounslow, Richmond, Kingston, and other boroughs. Meanwhile, the urban land area in Inner London has remained nearly unchanged and stable. Overall, the expansion of urban land over the last three decades has been mainly concentrated in the periphery of the city, i.e., the Outer London area, and much more on the eastern side than on the western side. The City of London was fully developed during the Industrial Revolution and promoted urban construction in the Inner London region, including the City of Westminster, Kensington-Chelsea, and other urban autonomies. The Greater London Plan in 1982 took steps towards establishing a satellite town on the periphery of London and proposed organic decentralization of the metropolitan population while emphasizing balanced development. Hence, further expansion of urban land outside London has been promoted over the last three decades.
The characteristics of urban land expansion in Chicago can be seen in Figure 3d. For nearly three decades, urban expansion can be summarized as relatively dispersive and with low aggregation. More expansion areas were distributed in the central region, and some smaller distributed areas were present in the southern and northern regions. Most expansion occurred along the main urban roads. Convenient shipping and traffic greatly stimulated the initial development of industry and commerce in the core area. The land use structure was further improved with economic restructuring in the 1980s. During the second half of the 20th century, because of the urban recession and the outsourcing of industrial enterprises, suburban areas gradually became the major growth areas due to the availability of employment. Hence, urban construction increased in suburban areas, and the expansion of this region has been prominent for nearly three decades.
3.2. Spatial Distribution Characteristics of the Road Network Density
We used Jenks natural breaks to grade the road network density of Beijing in ArcGIS 10.2. The results in Figure 4a illustrate that the most intensive regional road network was distributed inside the Third Ring Road. The second highest density level (6.8–12.2 km/km2) was located between the Third Ring Road and the Fifth Ring Road. The road network densities of the six traditional districts were relatively high, especially those in Dongcheng District and Xicheng District. In Daxing District, Tongzhou District, Shunyi District, eastern Changping District, and eastern Fangshan District, the road network density was mainly distributed in the third grade (3.3–6.7 km/km2). In Huairou District, Miyun County, and Mentougou County, the road networks were sparse. Except for the urban area, most regions were distributed in the fifth grade (0.1–1.1 km/km2). Overall, the distribution of the road network density in Beijing was higher to the southeast and lower to the northwest, generally decreasing from traditional areas to the areas surrounding the old towns.
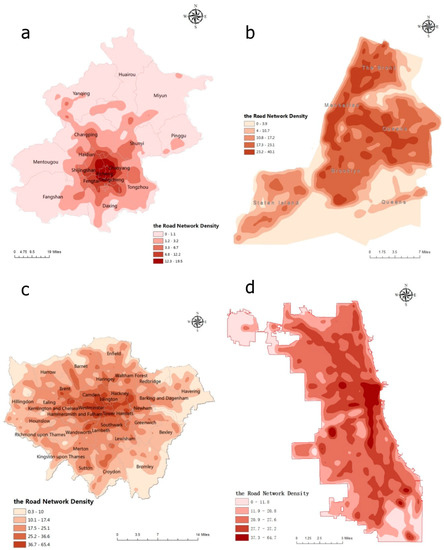
Figure 4.
Distribution of the road network density in (a) Beijing, (b) New York, (c) London, and (d) Chicago in 2014.
According to the statistical characteristics of the road network density with urban land change from 1984 to 2014 in Beijing, urban areas have expanded by 1521.57 km2 by 2014 compared to those in 1984 (see Table 2). The area of significant urban expansion was located at a road density level from 2 to 3, and the total expansion area at this level comprised 77.2%. Additionally, no urban expansion occurred when the road density exceeded 18.9 km/km2.
Table 2.
Road network density characteristics of urban expansion in Beijing.
Using the Jenks natural breaks method, we graded the road network density in New York (see Figure 4b). The results showed that the regions in New York with the densest roads were clustered together in the south-central region of Manhattan, the southern area of the Bronx, central Queens, and the southern coast of Brooklyn. The areas at the second level (17.3–23.1 km/km2) of road density were distributed across Manhattan and the central area, most of the area to the south of central Bronx, and the western and eastern coastal areas of Queens and Brooklyn. Manhattan, the Bronx, Queens, and Brooklyn had a higher road density, with the highest in Manhattan. New York’s road network density was characterized by a high road density that was concentrated in Manhattan, the Bronx, and Queens, and a relatively low road density in Richmond. The general trend was that the farther an area was from the water, the higher the road density became.
According to the change in urban land use of New York’s road network density characteristics in 1984–2014 (see Table 3), the urban expansion area was 57.63 km2 in 2014 compared to that in 1984. The significant expansion of the urban area was characterized by a road density level from 2 to 4, and these levels comprised 91.4% of the total expansion of the New York area. When the road density exceeded 37.8 km/km2, the area of new land was zero.
Table 3.
Road network density characteristics of urban expansion in New York.
As shown in Figure 4c, in London the densest road network areas were concentrated in the City of London, the City of Westminster, the area adjacent to the border between the two cities, Islington, Camden, Tower Hamlet, Lambeth, and Southwark, among other areas (i.e., around the region of the two cities). The region with the second density level (25.2–36.6 km/km2) was mainly distributed in Kensington-Chelsea, Hammersmith-Fulham, central Condon, north Islington, southern Hackney, Tower Hamlet, western Newham, and the northern areas of Luesihan, Southwark, Lambeth, and Wandsworth. Overall, the road network density in London was characterized by a high road density region that was concentrated in the City of London, the City of Westminster, and the area around the two cities, with small areas scattered in the regional center of the various administrative areas. The density tended to exhibit an annular distribution: the farther a location was from the City of London, the lower the road density became. This finding is closely related to urban planning. The planning structure of Greater London is a concentric closed system with a single center. Its transportation organization adopted a perpendicular radial pattern with concentric circles of roads in the transportation network.
To summarize the characteristics of the road network density in London with the urban land use change in 1984–2013 (see Table 4), the results showed that the urban expansion area in 2013 was 90.46 km2 with respect to 1984. The expanded area was associated with road density grades of 2–4, and expansion at these levels comprised 86.8% of the total area. When the road density exceeded 57.0 km/km2, the expanded urban area was zero.
Table 4.
Road network density characteristics of urban expansion in London.
In Chicago, the statistical results showed that the densest regions of road networks were concentrated in the central region of the city adjacent to Lake Michigan, presenting a southward strip development (see Figure 4d). The areas at the second level of road density in Chicago (27.7–37.2 km/km2) were mainly located in the middle of the city near Lake Michigan, generally developing zonally along the highways to the north and south. The sparsest road density areas were mainly distributed along the southern and northeastern edges away from the city center. Overall, the high-density road network areas were distributed around the city center and zonally spread to the north and south. Additionally, the closer to Lake Michigan a location was, the higher the road density became.
According to the statistical characteristics of the road network density with urban land use change in Chicago from 1985–2014 (see Table 5), the urban expansion area in 2014 was 90.46 km2, greater than that in 1985. A significant urban expansion area occurred for road density levels of 2–4, and expansion at these levels comprised 84.8% of the total expansion area of Chicago. When the road density exceeded 64.7 km/km2, the urban expansion area was zero.
Table 5.
Road network density characteristics of urban expansion in Chicago.
3.3. Fitting Analysis of the Road Network Density and Urban Expansion
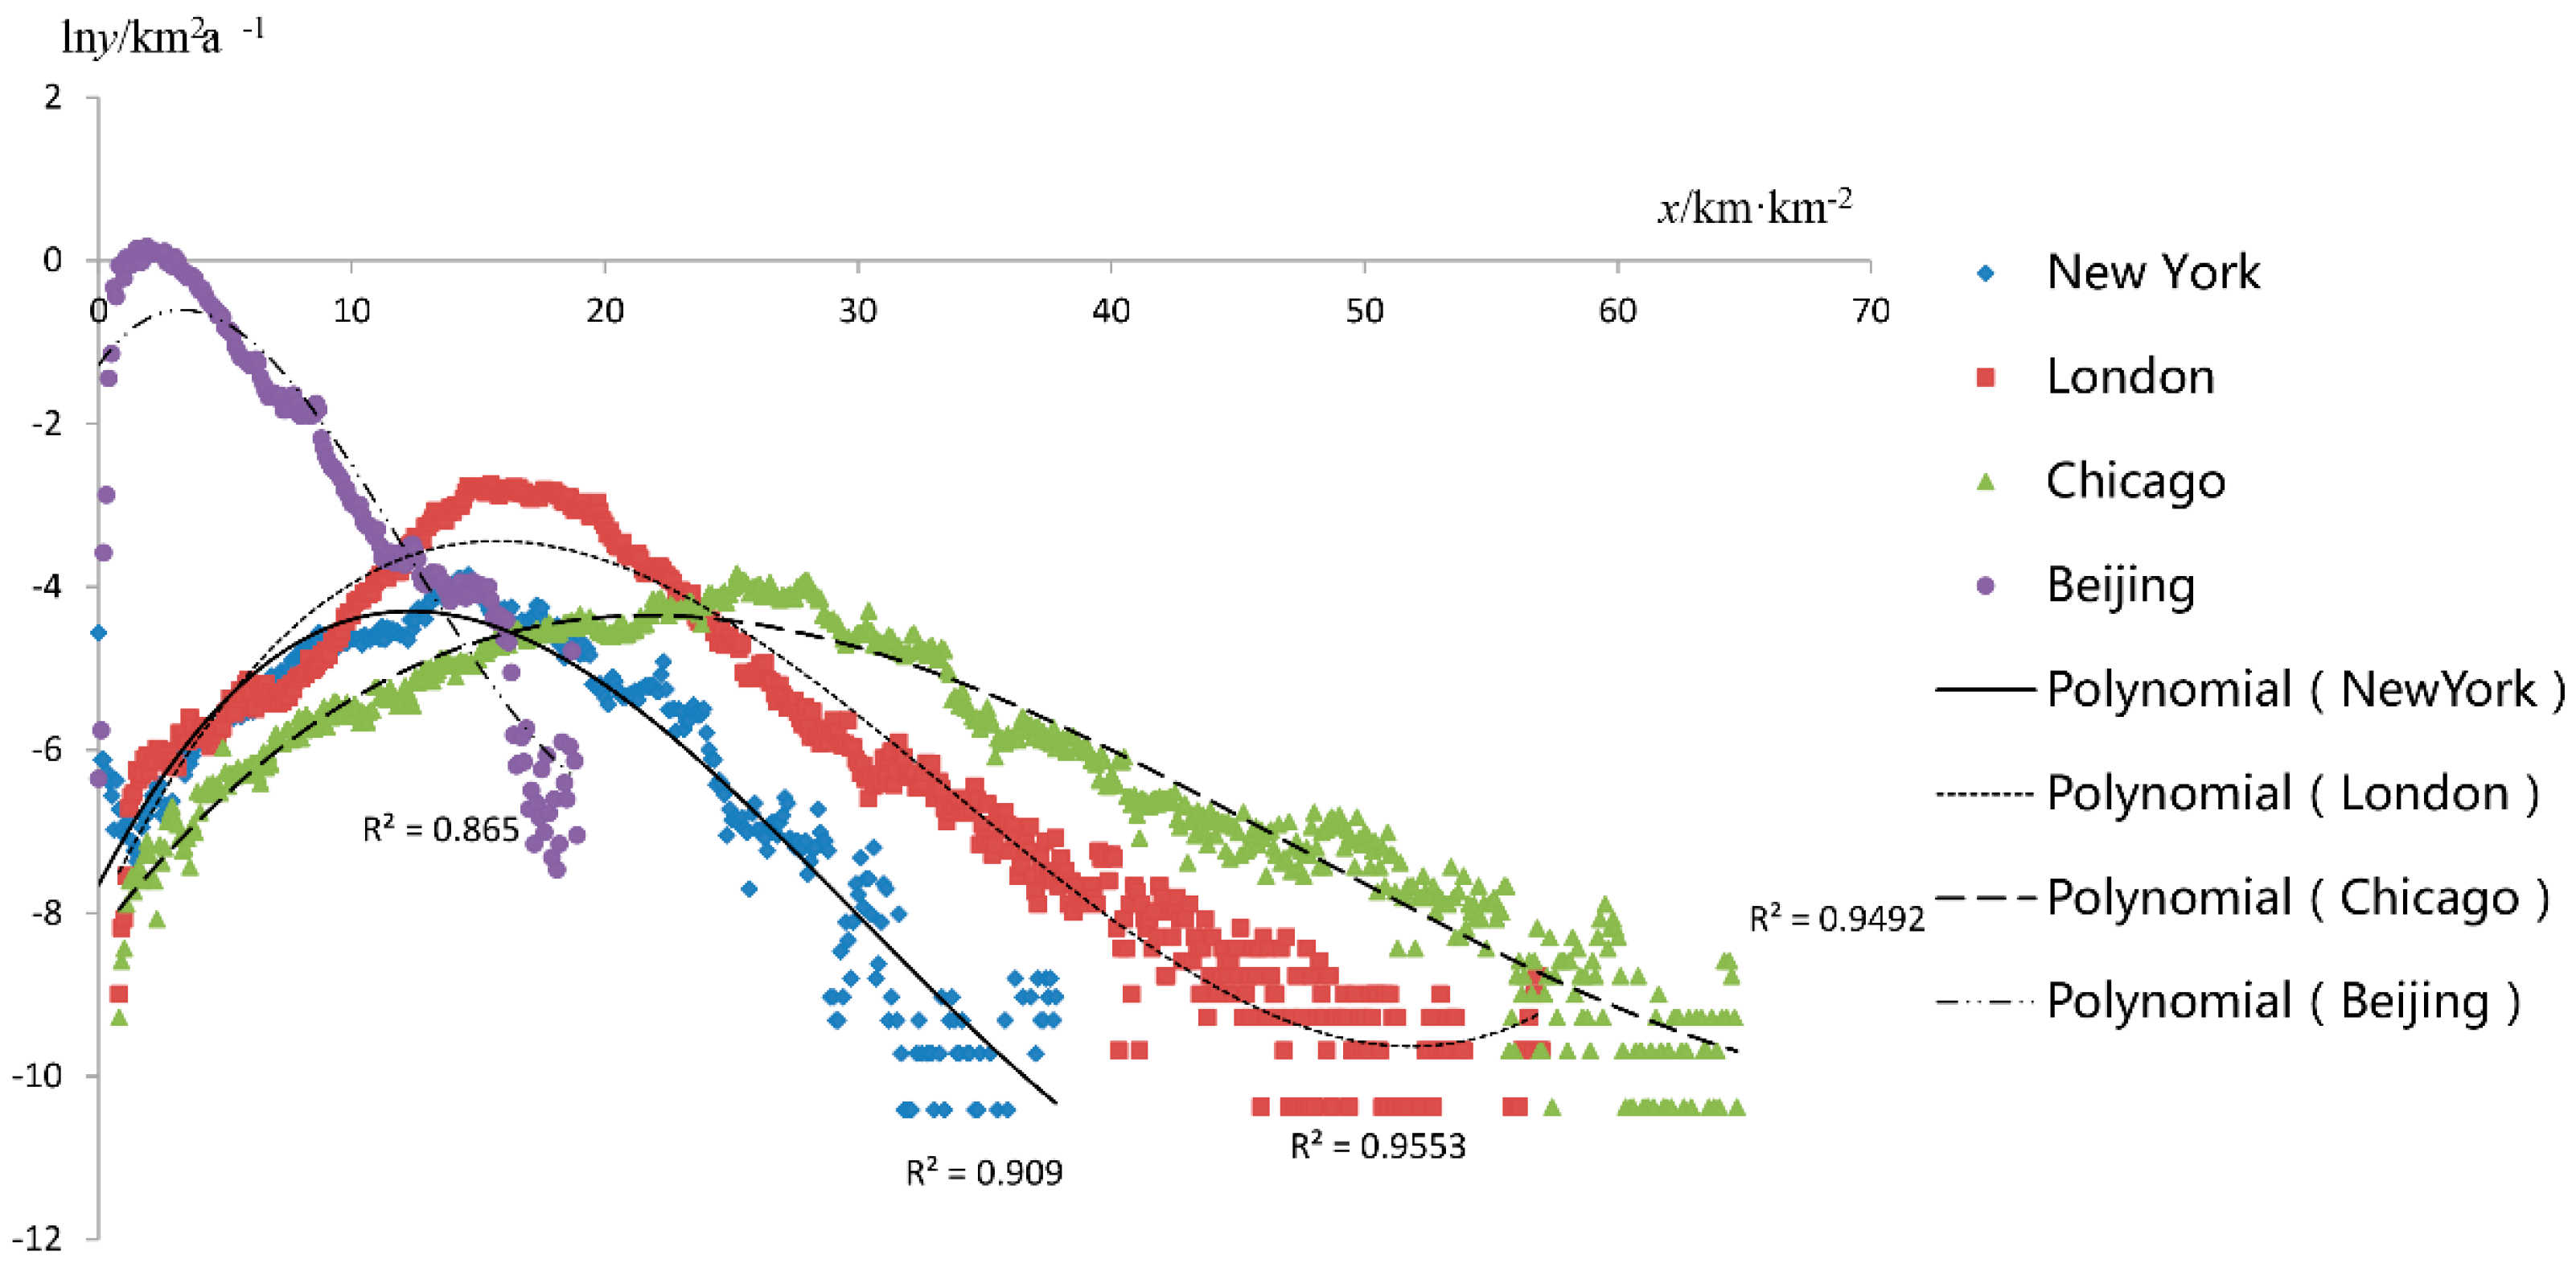
This study took the relevant data from New York as the experimental data and made an initial assessment of the goodness of fit for the above models (Equations (2)–(7)). The model parameters were correlated with the least-squares method in the SPSS platform. The results are shown in Table 6. When using model 6 (Equation (7)), the highest coefficient of determination (R2) was 0.91, and the F-statistic was higher, reaching 1178.24 (the corresponding p-value approached 0.00). The results showed that the logarithmic relationship model produced the best fit for the relationship between the rate of urban expansion and road network density. Therefore, this paper fit the curves of the relationships between the road networks and urban land in Beijing, New York, London, and Chicago by using the SPSS platform. When using model 6 (Equation (7)) for curve fitting, the results showed that all the R2 values were greater than 0.90, indicating high fitting precision. The curve fitting results are shown in Figure 5. The R2 of the New York regression was 0.91, corresponding to the best fitting result of the above models. In addition, the regression parameters and t-statistics showed that the fitting precision was high. The estimated coefficients were significant (the p-values were all less than 0.01; see Table 6). The fitting equation was as follows:
Table 6.
Regression analysis results of the urban expansion and road network model in New York.
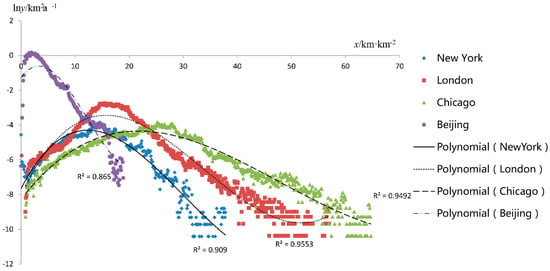
Figure 5.
Fitting curves of the urban expansion and road network density.
This paper quantified the relationship between the road networks and urban land use in London by using model 6 for curve fitting, and the R2 reached a high value of 0.96. The fitting equation was as follows:
The R2 of the simulation for the relationship between the road network density and urban land in Chicago reached 0.95 when using model 6 for curve fitting. The simulation’s precision was high, and the fitting equation was as follows:
The R2 for the relationship between Beijing’s road networks and urban land use when using model 6 for curve fitting was 0.87, indicating a good fit. The fitting equation was as follows:
The results of estimated coefficients for the four cities are shown in Table 7. To further explore the extent of the transformation of the mutual promotion of road network density and urban expansion, this paper modeled the urban expansion-road network and turning point formula based on the regression analysis. The turning point is the position at which the degree of the effect of road network density on promoting urban expansion changes. First, the turning point in New York was calculated by using Formula (12):
Table 7.
Estimated coefficients for the Urban Expansion-Road Network Density Model.
The calculated turning point X0 was 11.84 km/km2. In conjunction with the curve fitting results (see Figure 5), the trend of urban expansion in New York and the road network density could be summarized as follows: when the road density in New York was less than 37.8 km/km2, the relationship between the rate of expansion and the road network density exhibited an inverted U-shape, where 11.84 km/km2 was the turning point at which the rate of urban expansion increased with road network density. No expansion occurred when the road density exceeded 37.8 km/km2.
The turning points X0 for London and Chicago were calculated in a similar manner as 16.86 km/km2 and 21.40 km/km2, respectively. Additionally, the road densities in London and Chicago were less than 57.0 km/km2 and 64.7 km/km2, respectively. In these cities, the relationships between the expansion velocity and urban road network density exhibited an inverted U-shape. The turning points at which the trends in development changed for London and Chicago were 16.86 km/km2 and 21.40 km/km2, respectively. If the road density exceeded 57.0 km/km2 or 64.7 km/km2, the urban land in London and Chicago would no longer expand. In addition, the turning point for rapid urban expansion in Beijing was 3.3 km/km2, and the expansion threshold was 18.9 km/km2.
4. Discussion
4.1. Spatial Coupling Relationship between Urban Expansion and Road Network Density
Over the last three decades, the trends in urban land expansion have been similar in three of the studied cities. The area of urban land expansion has gradually decreased from the center outward, while the distribution of the road network density has gradually decreased outward from the city center. A close association existed between urban land expansion and the spatial density of the road network. Some differences existed in the spatial distribution of urban expansion because of the different locations. For example, New York City, which is a port city, exhibited higher road densities farther from the sea, and urban land expansion has been distributed in coastal areas for nearly three decades. The distribution of the road network density in Beijing was higher to the southeast and lower to the northwest, tending to decrease from traditional areas to the areas surrounding the older towns. Urban expansion in Beijing has occurred from the traditional core of the city over the past three decades, and the surrounding areas were affected to various extents by spatial radiation from the center of the city.
In spatial planning or land use planning, developed countries in Europe and the Americas require a higher level of urban land facility construction. In these countries, infrastructure often pioneers urban land expansion [41,42]. Local governments and related departments encourage and guide the urban construction land shafts developed along both sides of the road to take advantage of existing infrastructure facilities, which is legally mandated in some areas. However, the fundamental demand for transport has always been a primary consideration for increasing commuters [43]. The attraction of urban transit promotes new construction in developed areas, especially in China’s largest cities. For example, the subway in Beijing City affects the housing and rental prices in the suburbs. Therefore, the construction of a road network is the driving factor of urban land expansion, and urban land expansion is the outstanding response to this network.
Through our analysis, the road network density distribution reflects the basic trends of urban land expansion. The expanded area was centrally associated with road density grades of 2–4 or 2–3. Differences in the response patterns existed during different stages of urban development or in different areas.
(1) In high-density road network areas and urban construction areas beyond the expansion threshold, i.e., urban centers with almost no available land, the high cost of construction, overloaded transportation systems, and air and noise pollution [44] that result from poor housing and industrial and ecological factors [45] encouraged more businesses and residents to move to the suburbs for convenient transportation, lower costs, and a better environment.
(2) Areas with low-density urban roads, i.e., areas under the inflection point where urban construction and development are at low levels, which are often urban fringe areas or adjacent areas, should be managed for spatial planning with a focus on urban development. To protect ecological land, we should focus on ensuring compact construction, preventing sprawl and illegal construction, and promoting compact urban development [46]. Because these regions are different from older regions and are approaching the saturation point, the vast development potential makes planning an important function, especially considering the need for the strict rational use of open space.
(3) In areas past the turning point and regions in which expansion is slowing, e.g., urban intermediate zones, we should focus on monitoring plan implementation. The transition zone or the middle of an urban area is a concentrated area of neighborhoods, and we can improve land-use efficiency and reduce urban land pressure by rationally increasing plot ratios, better developing three-dimensional space, and expanding floor space, among other approaches.
4.2. Turning Points of Urban Land Expansion
A fitting study was performed to analyze the relationships between these urban road networks and urban land expansion. When the road network density was less than the threshold value, the rate of urban sprawl and the density of the road network exhibited an inverted U-shaped relationship. The turning point is when the trend changes so that the rate of urban expansion increases with increasing road network density. When the road network density does not exceed the turning point, the rate of urban land expansion exhibits a gradual upward trend; however, after exceeding the turning point, the rate of urban land expansion decreases.
Relative to the already stabilized urban expansion in cities such as New York, London, and Chicago, the turning point in Beijing was relatively low. New York, London, and Chicago, which were chosen as mature samples of global cities, placed more emphasis on the improvement of city quality, while Beijing is in a stage of rapid urban development. Its diverse needs promote the continual expansion of the urban area. Furthermore, several significant differences exist between Beijing and the other three cities in terms of urban spatial planning and the architectural styles of the neighborhoods [47,48]. For example, a large number of gated communities were constructed in Beijing’s central area. Additionally, the main roads are generally wide and branching roads are relatively thin. Beijing’s road network density is expected to further increase because the concept of “narrow the roads, densify the road networks, open the blocks” has been supported for urban development in China.
The turning point for the exploration stage when using the Beijing road network of 1988 to model the road network and urban expansion from 1984–2014 was calculated as approximately 2.3 km/km2. The Beijing map of 1988, which covered the current main urban area, was downloaded from the University of Texas Libraries at the University of Texas at Austin. When using the same spatial scale, the turning point was 6.25 km/km2 as calculated by the model for the road network of 2014. Thus, the turning point of Beijing’s urban expansion has been greatly improved after more than 20 years of development.
With respect to the results in New York, London, and Chicago, the fitting accuracy in Beijing was lower because of a larger proportion of low-density areas, which mostly consist of urban fringe areas and are irregular in terms of land use, reducing the overall simulation accuracy.
The turning point is the most important feature of an urban land expansion-road network density model with relative stability. In addition, the road network density threshold is an important indication of the urban development level, particularly in developing countries. According to the turning point, a city’s development can be divided into different stages in terms of temporal and spatial development to develop relevant spatial planning based on local conditions, which could help prevent poor investment and construction in terms of urban infrastructure and improve the rationality of urban spatial planning. Thus, related studies can provide important references regarding the utility of urban expansion. To avoid the rapid expansion of urban land, rational traffic planning is an effective means of achieving the mutual promotion and coordinated development of urban land use and road networks.
4.3. Limitations and Future Perspectives
This study focused on the antecedence of road networks for driving urban expansion. The turning points and the threshold values were calculated through research on the spatial quantitative relationship between urban expansion and the road network density. A large number of theoretical and empirical projects confirmed that road networks and urban expansion are closely linked. Road networks have an inducement effect on urban expansion, that is, the distribution and speed of urban expansion. The quantitative indicators for road networks are rich and mature, which is convenient for our research. Moreover, the quantitative relationship between road networks and urban expansion can facilitate the rational utilization of urban land. The existing literature on urban expansion and road networks lacks quantitative analysis of the relationship between these factors. The results of this paper enrich the research results of urban expansion theories and methods.
However, a few limitations must be addressed in future studies. For example, this paper considered the urban spatial expansion of a single city. The presence of single or multiple urban centers can change urban land use in a range of single cities. Additionally, some suburban cities are located outside these megacities, and sprawl is likely to continue. On the other hand, this study only used one period of urban road network data. In further research, we will study the effect of the evolution of road networks on urban expansion and compare the multiple-scale quantitative relationship between road networks and urban expansion, such as single cities and metropolitan areas, to examine additional indicators of urban expansion trends by using the urban land expansion-road network density model.
5. Conclusions
In this paper, we used Beijing, New York, London, and Chicago as the study areas and comprehensively utilized the RS and GIS platforms to analyze the general characteristics of urban expansion over the past three decades based on image interpretation, information extraction, and spatial overlay analysis on urban land use. Furthermore, based on the road network data, the distribution characteristics of the urban road network density were summarized using the kernel density analysis tool. Finally, a road network-urban expansion model was constructed using regression analysis to determine the quantitative relationship between the road networks and urban expansion. In addition, the turning point for urban expansion was determined and further investigated.
The turning points of urban land expansion in Beijing, New York, London, and Chicago were 3.3 km/km2, 11.84 km/km2, 16.86 km/km2, and 21.40 km/km2, respectively, and the road network density threshold values were 18.9 km/km2, 37.8 km/km2, 57.0 km/km2, and 64.7 km/km2, respectively. When the road network density was less than the threshold value, the rate of urban sprawl and the density of the road network exhibited an inverted U-shaped relationship.
Road networks are an important foundation for urban development, and these features affect urban expansion. On the one hand, urban development requires efficient road networks for support. On the other hand, improving road networks plays a key role in affecting urban land use and guiding changes to the urban landscape. This paper demonstrated that the road network-urban expansion model plays an important role in predicting and controlling the direction and scale of urban expansion by studying the associated relationship. Urban expansion varies based on the degree of road-network development in different locations, and the observed distributions are conducive to scientific planning and rational land use in these cities and to improving land use efficiency. In summary, the quantitative relationship between road networks and urban expansion exhibited an inverted U-shaped pattern. The turning point of urban expansion is worth investigating in other cities that are experiencing rapid development to promote sustainable development and achieve smart growth in the future.
Acknowledgments
This work was supported by the Ministry of Land and Resources of the PRC (201511010). We thank the OSM community for providing the road network data. We also appreciate the helpful comments and suggestions from the anonymous reviewers.
Author Contributions
Conceived and designed the experiments: G.L.Z., X.Q.Z., Z.Y.Y., and L.L.Z. Performed the experiments: G.L.Z. and X.Q.Z. Analyzed the data: G.L.Z., X.Q.Z., and Z.Y.Y. Wrote the paper: G.L.Z., X.Q.Z., and Z.Y.Y.
Conflicts of Interest
The authors declare no conflicts of interest. The founding sponsors had no role in the design of this study; the collection, analysis, or interpretation of the data; the writing of the manuscript, or the decision to publish the results.
Appendix A
Table A1.
Road network density and urban expansion speed in Beijing.
Table A1.
Road network density and urban expansion speed in Beijing.
| x | lny | x | lny | x | lny | x | lny | x | lny |
|---|---|---|---|---|---|---|---|---|---|
| 0 | −6.354 | 3.8 | −0.226 | 7.7 | −1.651 | 11.9 | −3.586 | 15.8 | −4.351 |
| 0.1 | −5.760 | 3.9 | −0.315 | 7.8 | −1.754 | 12 | −3.664 | 15.9 | −4.369 |
| 0.2 | −3.585 | 4 | −0.374 | 7.9 | −1.887 | 12.1 | −3.736 | 16 | −4.637 |
| 0.3 | −2.875 | 4.1 | −0.351 | 8 | −1.911 | 12.2 | −3.547 | 16.1 | −4.415 |
| 0.4 | −1.451 | 4.2 | −0.431 | 8.1 | −1.836 | 12.3 | −3.500 | 16.2 | −4.681 |
| 0.5 | −1.146 | 4.3 | −0.496 | 8.2 | −1.863 | 12.4 | −3.480 | 16.3 | −5.053 |
| 0.6 | −0.333 | 4.4 | −0.535 | 8.3 | −1.903 | 12.5 | −3.556 | 16.4 | −5.819 |
| 0.7 | −0.448 | 4.5 | −0.561 | 8.4 | −1.904 | 12.6 | −3.666 | 16.5 | −6.195 |
| 0.8 | −0.065 | 4.6 | −0.603 | 8.5 | −1.894 | 12.7 | −3.865 | 16.6 | −6.166 |
| 0.9 | −0.061 | 4.7 | −0.679 | 8.6 | −1.754 | 12.8 | −3.956 | 16.7 | −5.850 |
| 1 | −0.221 | 4.8 | −0.662 | 8.7 | −1.832 | 12.9 | −3.981 | 16.8 | −6.152 |
| 1.1 | 0.034 | 4.9 | −0.704 | 8.8 | −2.185 | 13 | −3.939 | 16.9 | −5.741 |
| 1.2 | −0.008 | 5 | −0.830 | 8.9 | −2.303 | 13.1 | −3.921 | 17 | −6.725 |
| 1.3 | −0.054 | 5.1 | −0.857 | 9 | −2.417 | 13.2 | −3.825 | 17.1 | −6.502 |
| 1.4 | 0.059 | 5.2 | −0.868 | 9.1 | −2.484 | 13.3 | −3.842 | 17.2 | −7.156 |
| 1.5 | 0.139 | 5.3 | −0.920 | 9.2 | −2.551 | 13.4 | −3.836 | 17.3 | −6.653 |
| 1.6 | 0.042 | 5.4 | −1.059 | 9.3 | −2.546 | 13.5 | −3.947 | 17.4 | −6.831 |
| 1.7 | −0.021 | 5.5 | −1.112 | 9.4 | −2.611 | 13.6 | −3.945 | 17.5 | −6.240 |
| 1.8 | 0.093 | 5.6 | −1.192 | 9.5 | −2.648 | 13.7 | −4.029 | 17.6 | −7.013 |
| 1.9 | 0.171 | 5.7 | −1.204 | 9.6 | −2.686 | 13.8 | −4.095 | 17.7 | −6.071 |
| 2 | 0.114 | 5.8 | −1.236 | 9.7 | −2.813 | 13.9 | −4.180 | 17.8 | −6.777 |
| 2.1 | 0.075 | 5.9 | −1.265 | 9.8 | −2.801 | 14 | −4.056 | 17.9 | −7.323 |
| 2.2 | 0.113 | 6 | −1.292 | 9.9 | −2.908 | 14.1 | −4.006 | 18 | −6.608 |
| 2.3 | 0.093 | 6.1 | −1.284 | 10 | −2.987 | 14.2 | −3.986 | 18.1 | −7.470 |
| 2.4 | 0.086 | 6.2 | −1.214 | 10.1 | −3.008 | 14.3 | −3.944 | 18.2 | −7.156 |
| 2.5 | 0.081 | 6.3 | −1.259 | 10.2 | −3.024 | 14.4 | −4.058 | 18.3 | −5.903 |
| 2.6 | 0.105 | 6.4 | −1.430 | 10.3 | −2.995 | 14.5 | −4.138 | 18.4 | −6.407 |
| 2.7 | −0.028 | 6.5 | −1.518 | 10.4 | −3.117 | 14.6 | −4.085 | 18.5 | −6.608 |
| 2.8 | −0.005 | 6.6 | −1.604 | 10.5 | −3.223 | 14.7 | −3.950 | 18.6 | −5.960 |
| 2.9 | −0.068 | 6.7 | −1.676 | 10.6 | −3.258 | 14.8 | −3.939 | 18.7 | −4.790 |
| 3 | 0.044 | 6.8 | −1.652 | 10.7 | −3.253 | 14.9 | −3.972 | 18.8 | −6.138 |
| 3.1 | 0.001 | 6.9 | −1.627 | 10.8 | −3.314 | 15 | −4.106 | 18.9 | −7.047 |
| 3.2 | −0.095 | 7 | −1.691 | 10.9 | −3.390 | 15.1 | −3.986 | ||
| 3.3 | −0.150 | 7.1 | −1.669 | 11 | −3.300 | 15.2 | −4.034 | ||
| 3.4 | −0.139 | 7.2 | −1.652 | 11.1 | −3.495 | 15.3 | −4.076 | ||
| 3.5 | −0.213 | 7.3 | −1.838 | 11.2 | −3.650 | 15.4 | −4.004 | ||
| 3.6 | −0.179 | 7.4 | −1.835 | 11.3 | −3.680 | 15.5 | −4.168 | ||
| 3.7 | −0.195 | 7.5 | −1.769 | 11.6 | −3.695 | 15.6 | −4.381 | ||
| 7.6 | −1.697 | 11.8 | −3.690 | 15.7 | −4.428 |
Note: x stands for the road network density and y is the urban expansion speed.
References
- Foley, J.A.; Defries, R.; Asner, G.P.; Barford, C.; Bonan, G.; Carpenter, S.R.; Chapin, F.S.; Coe, M.T.; Daily, G.C.; Gibbs, H.K. Global consequences of land use. Science 2005, 309, 570–574. [Google Scholar] [CrossRef] [PubMed]
- Seto, K.C.; Güneralp, B.; Hutyra, L.R. Global forecasts of urban expansion to 2030 and direct impacts on biodiversity and carbon pools. Proc. Natl. Acad. Sci. USA 2012, 109, 16083–16088. [Google Scholar] [CrossRef] [PubMed]
- Angel, S.; Parent, J.; Civco, D.L.; Blei, A.; Potere, D. The dimensions of global urban expansion: Estimates and projections for all countries, 2000–2050. Prog. Plan. 2011, 75, 53–107. [Google Scholar] [CrossRef]
- Zhang, Q.; Wang, J.; Peng, X.; Gong, P.; Shi, P. Urban built-up land change detection with road density and spectral information from multi-temporal Landsat TM data. Int. J. Remote Sens. 2002, 23, 3057–3078. [Google Scholar] [CrossRef]
- Baum-Snow, N. Did highways cause suburbanization? Q. J. Econ. 2007, 122, 775–805. [Google Scholar] [CrossRef]
- Iacono, M.; Levinson, D.M. Causality in the link between road network growth and regional development. In Proceedings of the Transportation Research Board 93rd Annual Meeting, Washington, WA, USA, 12–16 January 2014. [Google Scholar]
- Zhao, G.; Zheng, X.; Yuan, Z.; Zhang, L. Spatial and temporal characteristics and correlation analysis of road networks and urban sprawl. Trans. Chin. Soc. Agric. Eng. 2015, 31, 220–229. [Google Scholar]
- Brueckner, J.K.; Fansler, D.A. The economics of urban sprawl—Theory and evidence on the spatial sizes of cities. Rev. Econ. Stat. 1983, 65, 479–482. [Google Scholar] [CrossRef]
- Torrens, P.M. Simulating sprawl. Ann. Assoc. Am. Geogr. 2006, 96, 248–275. [Google Scholar] [CrossRef]
- Camagni, R.; Gibelli, M.C.; Rigamonti, P. Urban mobility and urban form: The social and environmental costs of different patterns of urban expansion. Ecol. Econ. 2002, 40, 199–216. [Google Scholar] [CrossRef]
- Hathout, S. The use of GIS for monitoring and predicting urban growth in East and West St Paul, Winnipeg, Manitoba. Can. J. Environ. Manag. 2002, 66, 229–238. [Google Scholar] [CrossRef]
- Stein, A.; Bastiaanssen, W.G.M.; de Bruin, S.; Cracknell, A.P.; Curran, P.J.; Fabbri, A.G.; Gorte, B.G.H.; Van Groenigen, J.W.; van der Meer, F.D.; Saldana, A. Integrating spatial statistics and remote sensing. Int. J. Remote Sens. 1998, 19, 1793–1814. [Google Scholar] [CrossRef]
- Alsharif, A.A.A.; Pradhan, B. Urban sprawl analysis of Tripoli metropolitan city (Libya) using remote sensing data and multivariate logistic regression model. J. Indian Soc. Remote 2014, 42, 149–163. [Google Scholar] [CrossRef]
- Triantakonstantis, D.; Prastacos, P.; Tsoukala, A. Analyzing urban sprawl in Rethymno. Greece J. Indian Soc. Remote 2014, 42, 601–610. [Google Scholar] [CrossRef]
- Weng, Q. A remote sensing? GIS evaluation of urban expansion and its impact on surface temperature in the Zhejiang Delta. China Int. J. Remote Sens. 2001, 22, 1999–2014. [Google Scholar]
- Yang, Q.S.; Li, X.; Shi, X. Cellular automata for simulating land use changes based on support vector machines. Comput. Geosci. 2008, 34, 592–602. [Google Scholar] [CrossRef]
- Burchfield, M.; Overman, H.G.; Puga, D.; Turner, M.A. Causes of sprawl: A portrait from space. Q. J. Econ. 2006, 121, 587–633. [Google Scholar] [CrossRef]
- Handy, S. Smart growth and the transportation-land use connection: What does the research tell us? Int. Reg. Sci. Rev. 2005, 28, 146–167. [Google Scholar] [CrossRef]
- Tayyebi, A.; Pijanowski, B.C.; Tayyebi, A.H. An urban growth boundary model using neural networks, GIS and radial parameterization: An application to Tehran. Iran Landsc. Urban Plan. 2011, 100, 35–44. [Google Scholar] [CrossRef]
- Nechyba, T.J.; Walsh, R.P. Urban sprawl. J. Econ. Perspect. 2004, 18, 177–200. [Google Scholar] [CrossRef]
- Yang, X.; Zheng, X.Q.; Chen, R. A land use change model: Integrating landscape pattern indexes and Markova-CA. Ecol. Model. 2014, 283, 1–7. [Google Scholar] [CrossRef]
- Barrington-Leigh, C.; Millard-Ball, A. A century of sprawl in the United States. Proc. Natl. Acad. Sci. USA 2015, 112, 8244–8249. [Google Scholar] [CrossRef] [PubMed]
- Forman, R.T.T. Road ecology: A solution for the giant embracing us. Landsc. Ecol. 1998, 13, III–V. [Google Scholar] [CrossRef]
- Hawbaker, T.J.; Radeloff, V.C.; Hammer, R.B.; Clayton, M.K. Road density and landscape pattern in relation to housing density, and ownership, land cover, and soils. Landsc. Ecol. 2005, 20, 609–625. [Google Scholar] [CrossRef]
- Lavee, D. Land use for transport projects: Estimating land value. Land Use Policy 2015, 42, 594–601. [Google Scholar] [CrossRef]
- Eker, M.; Coban, H.O. Impact of road network on the structure of a multifunctional forest landscape unit in southern turkey. J. Environ. Biol. 2010, 31, 157–168. [Google Scholar] [PubMed]
- Miller, H.J.; Shaw, S.-L. Geographic Information Systems for Transportation: Principles and Applications; Oxford University Press: Oxford, UK, 2001. [Google Scholar]
- Levinson, D.; Xie, F.; Ocel, N.M. Forecasting and evaluating network growth. Netw. Spat. Econ. 2012, 12, 239–262. [Google Scholar] [CrossRef]
- Ye, P.Y.; Chen, X.H.; Cui, X. Impact on density of public transportation network by urban road network layout. J. Tongji Univ. Nat. Sci. 2012, 40, 51–56. [Google Scholar]
- Rui, Y.; Ban, Y. Exploring the relationship between street centrality and land use in Stockholm. Int. J. Geogr. Inf. Sci. 2014, 28, 1425–1438. [Google Scholar] [CrossRef]
- Mohajeri, N.; Gudmundsson, A. The evolution and complexity of urban street networks. Geogr. Anal. 2014, 46, 345–367. [Google Scholar] [CrossRef]
- Lerman, Y.; Rofe, Y.; Omer, I. Using space syntax to model pedestrian movement in urban transportation planning. Geogr. Anal. 2014, 46, 392–410. [Google Scholar] [CrossRef]
- Loo, B.P.Y.; Chen, C.; Chan, E.T.H. Rail-based transit-oriented development: Lessons from New York City and Hong Kong. Landsc. Urban Plan. 2010, 97, 202–212. [Google Scholar] [CrossRef]
- Zhao, P.J. Sustainable urban expansion and transportation in a growing megacity: Consequences of urban sprawl for mobility on the urban fringe of Beijing. Habitat Int. 2010, 34, 236–243. [Google Scholar] [CrossRef]
- Greene, R.P.; Pick, J.B. Exploring the Urban Community: A GIS Approach, 2nd ed.; Pearson Prentice Hall: Upper Saddle River, NJ, USA, 2012; p. 399. [Google Scholar]
- OpenStreetMap Contributors. Available online: http://www.openstreetmap.org/#map=10/39.8845/116.5437 (accessed on 28 June 2015).
- Silverman, B.W. Density Estimation for Statistics and Data Analysis; CRC Press: Boca Raton, FL, USA, 1986; Volume 26. [Google Scholar]
- Yixing, Z. On the relationship between urbanization and gross national product. Chin. Sociol. Anthropol. 1988, 21, 3–16. [Google Scholar] [CrossRef]
- Taylor, P.J. Quantitative Methods in Geography: An Introduction to Spatial Analysis; Houghton Mifflin: Boston, MA, USA, 1977. [Google Scholar]
- Yeh, A.G.O.; Li, X. Measurement and monitoring of urban sprawl in a rapidly growing region using entropy. Photogramm. Eng. Remote Sens. 2001, 67, 83–90. [Google Scholar]
- Elinbaum, P.; Galland, D. Analysing contemporary metropolitan spatial plans in Europe through their institutional context, instrumental content and planning process. Eur. Plan. Stud. 2016, 24, 181–206. [Google Scholar] [CrossRef]
- Van der Valk, A. The Dutch planning experience. Landsc. Urban Plan. 2002, 58, 201–210. [Google Scholar] [CrossRef]
- Scheiner, J. Housing mobility and travel behaviour: A process-oriented approach to spatial mobility—Evidence from a new research field in Germany. J. Transp. Geogr. 2006, 14, 287–298. [Google Scholar] [CrossRef]
- Weber, N.; Haase, D.; Franck, U. Traffic-induced noise levels in residential urban structures using landscape metrics as indicators. Ecol. Indic. 2014, 45, 611–621. [Google Scholar] [CrossRef]
- Hagler, G.S.W.; Tang, W.; Freeman, M.J.; Heist, D.K.; Perry, S.G.; Vette, A.F. Model evaluation of roadside barrier impact on near-road air pollution. Atmos. Environ. 2011, 45, 2522–2530. [Google Scholar] [CrossRef]
- Borrego, C.; Martins, H.; Tchepel, O.; Salmim, L.; Monteiro, A.; Miranda, A.T. How urban structure can affect city sustainability from an air quality perspective. Environ. Model. Softw. 2006, 21, 461–467. [Google Scholar] [CrossRef]
- Ahmed, Q.I.; Lu, H.P.; Ye, S. Urban transportation and equity: A case study of Beijing and Karachi. Transp. Res. A-Pol 2008, 42, 125–139. [Google Scholar] [CrossRef]
- Kuang, W.H.; Chi, W.F.; Lu, D.S.; Dou, Y.Y. A comparative analysis of megacity expansions in China and the U.S.: Patterns, rates and driving forces. Landsc. Urban Plan. 2014, 132, 121–135. [Google Scholar] [CrossRef]


© 2017 by the authors. Licensee MDPI, Basel, Switzerland. This article is an open access article distributed under the terms and conditions of the Creative Commons Attribution (CC BY) license (http://creativecommons.org/licenses/by/4.0/).