Abstract
Urban green spaces provide important recreational, social and psychological benefits to stressed city residents. This paper aims to understand the importance of parks for visitors. We focus on Delhi, the world’s second most populous city, drawing on 123 interviews with park visitors in four prominent city parks. Almost all respondents expressed the need for more green spaces. Visitors valued parks primarily for environmental and psychological/health benefits. They had limited awareness of biodiversity, with one out of three visitors unable to identify tree species and one out of four visitors unable to identify animal species frequenting the park. Most of the daily visitors lived within 0.5 km of these parks, but a small fraction of visitors traveled over 10 km to visit these major parks, despite having smaller neighbourhood parks in their vicinity. This study demonstrates the importance of large, well-maintained, publicly accessible parks in a crowded city. The results can help to better plan and design urban green spaces, responding to the needs and preferences of urban communities. This research contributes to the severely limited information on people’s perceptions of and requirements from urban nature in cities of the Global South.
1. Introduction
With the increasing number of people living in urban areas, there are large-scale impacts on the sustainability of urban systems, impacting their biophysical and ecological components and eventually reducing human capacity for wellbeing. Increased urbanization and the consequent loss of green cover has been linked to reduced ground water recharge [1], degradation of water bodies [2], decreased biodiversity due to habitat loss and fragmentation [3,4,5,6], pollution [7], modification of rainfall [8,9,10] and urban warming [11,12,13,14].
Urban green spaces can increase resilience and reduce vulnerabilities to urbanization. Vegetation in urban areas contributes positively towards ecological heath in an urban system. Green spaces in urban areas provide ecosystem services [15] and recreational venues for diverse users [16,17]. Family recreation promotes the overall quality of family life and helps its members to develop life-long skills and values [18,19]. People staying close to nature are able to form stronger connections to nature, deriving both physical and psychological health benefits [20,21,22,23,24]. Urban green spaces facilitate social interaction and promote social cohesion, fostering a sense of place and belonging [25,26,27].
Various socio-demographic and environmental drivers of outdoor recreation have been identified by Bell et al. [28]. Proximity to recreational areas and parks is normally related to higher physical activity and healthier communities [29], and people derive health benefits [19]. The amount, quality and distance to urban recreation areas and green space affect the uses of green space by citizens to satisfy their daily recreational needs [30,31]. Proximity to urban green spaces thus tends to increase housing prices [32,33,34]. Some residents are also willing to pay for the use of urban green spaces for the derived benefits [35,36].
Thus, there are a growing number of studies on the environmental implications of urbanization and the benefits of urban nature. The greatest challenge lies in managing urban green spaces well, through the successful framing and implementation of environmental policies for sustainable urban nature. This would also help with the augmentation of public trust in the decision making process. Planning and management of urban nature is effective when it considers the diversity of knowledge of the public and stakeholders and the understanding and consideration of the user opinions, preferences, and attitudes towards conservation [37]. Peoples’ perception and preferences for urban nature tend to vary from time to time and tend to be site specific. Hence, case studies are vital to bring out the local differences [38].
Most of the research on the use and importance of urban green spaces has been conducted in North America, Europe, and Australia [39,40,41,42,43,44]. There are also a growing number of studies from South East Asia [45,46,47,48,49,50,51]. A knowledge gap exists in terms of perception, provision and access to green space in Asia and specifically in India. This study attempts to fill this gap by understanding the relationship between park visitors and green spaces in the megapolis of Delhi. The objectives of the study are to (i) analyze the main uses of urban parks by different population groups; (ii) evaluate differences in the perception of different population groups of the quality of nature; and (iii) analyze distance to the green space and the relationship between distance to the green space and frequency of its use.
2. Materials and Methods
2.1. Study Area
The study sites are located in the heart of the National Capital Territory of Delhi (NCTD). Delhi is a rapidly expanding city with a high-density built-up area in the city centre and urban sprawl towards its periphery [52]. Delhi has a number of parks and gardens, spread over about 8000 hectares in various locations all over Delhi [53]. Administratively, the NCTD is divided into nine districts and 27 administrative sub-divisions or tehsils. The NCTD is administered by three local bodies; (i) the New Delhi Municipal Council (NDMC); (ii) the Delhi Cantonment Board (DCB); and (iii) the Municipal Corporation Delhi (MCD). New Delhi district has a population of 179,112 [54]. The British architect Edwin Lutyens designed the capital city of New Delhi, popularly known as Lutyens’ Delhi, following a geometrical plan with large open green spaces and wide roads oriented along the main directions of the compass [55]. The NDMC administrative area corresponds to the New Delhi district. New Delhi district is the central and greenest part of the National Capital Territory of Delhi, which is now ‘an oasis of nature in the midst of a vast urban desert’ [56]. The large number of avenue trees, large parks, ‘colony parks’, green roundabouts, and bungalow gardens in Lutyens’ Delhi shape the ecological and cultural character of this region, which ‘nestles under a canopy of green’ [56]. Parks and green spaces in New Delhi are maintained by different authorities, including the New Delhi Municipal Council (NDMC), Central Public Works Department (CPWD), Delhi Development Authority (DDA), and the Archaeological Survey of India (ASI). New Delhi is the most popular recreational area in Delhi [57]. Due to its historical and archaeological importance and it being the capital of India, New Delhi attracts people from diverse cultures and backgrounds from all over Delhi as well as India and abroad [57]. New Delhi thus represents an ideal locale for studying peoples’ perceptions of urban green space in a crowded expanding city.
Within the New Delhi district, four large parks (Figure 1) managed by four different authorities were selected for study. The parks are (a) Buddha Jayanti Smarak Park (BJSP); (b) Lodhi Garden (LG); (c) Bhuli Bhatiyari Park (BBP), and (d) Safdarjung’s Tomb (ST).
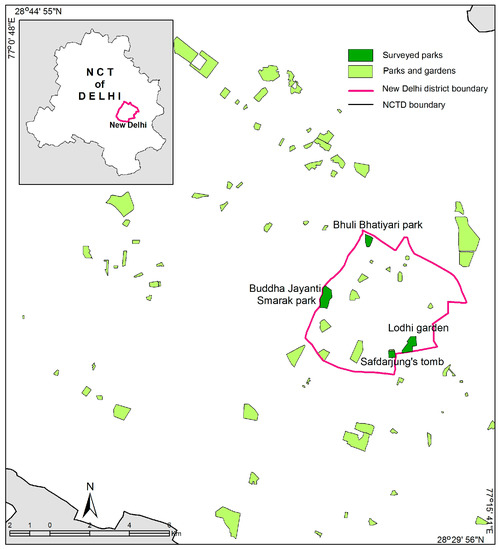
Figure 1.
Study area.
Buddha Jayanti Smarak Park (Figure 2a) covers an area of 100 acres and is situated in the western part of the New Delhi district. The park forms a part of the well-known Delhi ridge forests, containing a mix of dry thorny native scrub with planted vegetation on a rocky, undulating, partially flat plain with high native biodiversity [58]. BJSP was established to commemorate the 2500th anniversary of the enlightenment of Gautama Buddha in the year 1957. It is free for public entry and remains open from 5:30 a.m. to 7:00 p.m every day. It is managed by the Central Public Works Department of Government of India (CPWD).
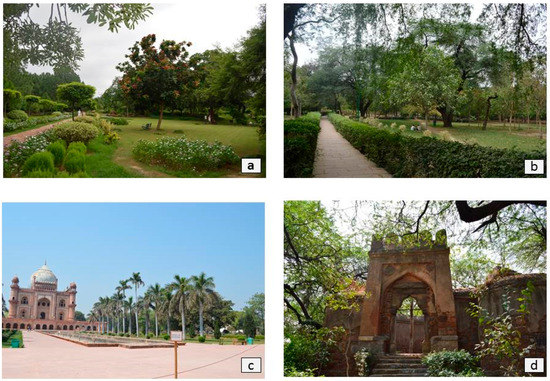
Figure 2.
Four parks: (a) Buddha Jayanti Smarak park; (b) Lodhi garden; (c) Safdarjung’s tomb; and (d) Bhuli Bhatiyari park.
The Lodhi Garden (Figure 2b), having an area of 90 acres, is located in the southern part of the New Delhi district. This garden contains monuments established by the Sayyids and Lodhis between 15th and 16th century [59]. The park was developed during the British Period and was inaugurated by Lady Willingdon in the year 1936. The park was initially named Lady Willingdon Park. J. A. Stein and Garrett Eckbo redesigned the park in 1968 [59]. It is free for all visitors from 6:00 a.m. to 7:00 p.m. The monument is protected by the Archeological Survey of India (ASI) and the garden is maintained by the New Delhi Municipal Council (NDMC).
Safdarjung’s Tomb (Figure 2c) has an enclosed garden around the tomb of Mirza Muqim Abul Mansur Khan, who was popularly known as Safadarjung. The monument and the garden premises are maintained by the ASI. The 32 acre garden is a Persian style or Charbagh Garden laid out in the form of four squares with wide foot paths and water tanks, which have been further subdivided into smaller squares. This is a historical funerary garden remodeled into a public park and the ASI took up the horticultural improvement of the tomb in 1918–19 [60]. There is a nominal entry fee for the garden and it remains open all days of the week from 7:00 a.m. to 5:00 p.m.
Bhuli Bhatiyari park (Figure 2d) is located in the northern part of the district and also forms a part of the ridge. Emperor Firuz Shah (1351–88) of the Tughlaq dynasty had built a hunting lodge named Bhuli-Bhatiyari-ka-Mahal (palace). In 1989, this place was developed as an ideal tourist location by the Delhi Tourism Development Corporation [61]. The remnants of the palace are protected by the ASI, and the park of 60 acres is maintained by the Delhi Development Authority (DDA). Entry is free, and the park remains open all days from sunrise to sunset.
2.2. Methodology
Except for Safdarjung’s tomb, entry to the other three parks in the study area is free for visitors, hence the park administration does not maintain entry records of park visitors. Due to the non-availability of visitor records and to maintain parity in the sampling methodology amongst the parks, it was not possible to apply a simple random sampling technique to draw a true probability sample for the study [62]. Before beginning interviews, we conducted on-site observations of visitors to the park and activities taking place within the boundaries of the park. Due to security concerns, which are considerable in isolated locations in Delhi, we conducted interviews in frequently visited areas and not in the interior parts of the park, where visitors were fewer. We had an overall target of approximately 250 interviews across four parks and therefore decided to conduct interviews [63] with all visitors until the desired number of 60 per park was reached. Although the target of 60 interviews is admittedly not derived from a statistical estimate of sample size, we found that the responses did not vary appreciably after this point, which gave us confidence that the responses we received were representative of the majority of the visitors to the park. The interviews were conducted face to face, on weekends, weekday evenings, and other times when visitors were in large numbers, thereby sampling across the representation available of gender, education, and professional background. The survey was conducted on site by the lead author, both in English and Hindi. One hundred and twenty-three interviews were carried out in Buddha Jayanti Smarak park (n = 26), Lodhi garden (n = 28), Safdarjung’s tomb (n = 32), and Bhuli Bhatiyari park (n = 37). Other researchers have used a similar or lesser number of interviews to study visitor perceptions and have drawn inferences from them. D’Souza and Nagendra [64] conducted 63 interviews of lake visitors, while Tucker et al. [63] and Krenichyn [65] interviewed 82 and 41 park visitors, respectively. The sample size of 123 had a maximum standard error of 0.045. The acceptable margin of error is 5%; thus a sample size that achieves standard errors lower than 0.05 is acceptable [66]. A total of nine visitors did not respond to the survey (Buddha Jayanti Smarak park = 2; Lodhi garden = 2; Safdarjung’s tomb = 4, and Bhuli Bhatiyari park = 1). Amongst the non-respondents, three were female and six were male; the estimated age of four respondents was below 25, while two of them were above 60 years of age.
Visitors were approached for participation and informed that the purpose of the survey was to access the environmental awareness of the visitors and the distance to the park. It took five to seven minutes for the visitors to answer the questionnaire and ensure that it reflected their immediate experience. The surveys were conducted both on weekdays and weekends, in the mornings between 8:30 a.m. and 10 a.m. to collect views of morning walkers and in the evenings from 5 p.m. to 6 p.m. for other respondents. Five visits each were made to Buddha Jayanti Smarak park and Lodhi garden, followed by seven visits each to Safdarjung‘s tomb and Bhuli Bhatiyari park to conduct interviews.
The response formats were either open, in ranking scale, or closed (dichotomous, multiple choices, likert scale). Nineteen questions gauged the visitor‘s views on the quality of the park, uses of green space, environmental awareness, and distance to the green space (Table 1). Demographic and other information about the respondents were also collected, which included their name, age, gender, educational status, means of livelihood and information about companions. While it was a discretionary response, ‘name’ helped in developing a familiarity, rapport, and a humane connection with the respondent. The authors prepared a questionnaire containing a set of questions assessing park visitors’ environmental awareness, main uses of green space, perception of the quality of the parks and distance to the parks, based in part on similar studies elsewhere [67,68,69,70]. The questionnaire was initially tested with a small group of park visitors before administering it to visitors to the four parks. This helped in further refining the questionnaire so that it ensured that the participants understood the questions uniformly and they were easily able to provide data for fulfilling the aim of the study. The visitor responses were further categorized for the ease of analysis. The distances of the closest park near the respondents’ residences have been categorized into four classes (<0.5 km; 0.5–1 km; 2–5 km; and >5 km). The distances travelled by the respondents to visit the parks have been categorized into five (<0.5; 0.5–1 km; 1–4 km; 5–10 km; and >10 km) classes. The frequency of park visits has been grouped into six (everyday; several times a week; weekly; monthly; half yearly; yearly; and first time) classes. Thereafter, qualitative data analysis and interpretation of people’s perception was carried out, which was then associated with the potential predictors or group dependent variables (gender, age, education, occupation, and companion). ANOVA and t tests [71] were used to examine the relationships between the variables.

Table 1.
Green spaces and quality of urban life.
3. Results
3.1. Social Characteristics of the Visitors
As per the 2011 census, the density of population of the New Delhi district is 4057 persons/km2. About 54% of the population is male and 46% is female [54]. Most respondents (N = 123) in the survey were male (57%; n = 70). The greatest (58%; n = 71) number of respondents were between 25 to 55 years old, followed by the age group above 55 years (25%; n = 31). About 77% (n = 95) have received university-level education. The majority was employed (44%; n = 54), and 22 % (n = 27) were self-employed in business. Homemakers, retired people, and unemployed people constitute the ‘at home’ category and account for 24% (n = 30) (Table 2). A majority (54%) of the respondents visit the park with family, followed by those visiting alone.
Table 2.
Overall socio-demographic characteristics.
3.2. Environmental Awareness of the Users
A positive attitude of the respondents at all parks towards green spaces was found. The visitors were asked whether they had ‘plants at home’. About 57% of the visitors had plants at home. More than 95% respondents felt that there is ‘need for more green spaces/parks’. Environmental awareness and perception is also reflected in the level of participation in conserving nature. More than 63% of the respondents ‘took part in protecting nature’. In comparison to the older age groups, fewer young adults (18%) took part in nature conservation measures (p = 0.043) (Table 3). The participants did it either by planting and nurturing trees at home or in the parks (43%), as a part of school/college curriculum (11%), making people aware of the usefulness of the green spaces (11%), asking people not to harm trees (13%), by being a member of some green groups or by making monetary contributions towards the protection and maintenance of the garden/parks (10%), or by not littering and segregating wastes, recycling, and refraining from using polyethylene carry bags (12%). Even though the visitors were not asked why they don’t take part in the conservation of nature, 16% of the visitors spontaneously cited ‘lack of time’ as a reason. Amongst all age groups, a significant proportion (p = 0.004) of the younger (<25 years) visitors took part in nature conservation as a part of a school curriculum. The overall visitors on average could recognize 1.79 plant species and 1.80 animal species in the parks. Knowledge of plants and animal species was analysed with relation to socio-demographic factors, namely gender, age, education, occupation, and companion (Table 3). More than 30% of the visitors to the parks could not identify any plant species, while 21% of the visitors could not name any animal species in the park (Figure 3). It was also seen that 27% and 17% visitors could name at least two plant and animal species respectively. No significant variation was found between the socio-demographic variables in terms of (a) total number of identified species; (b) plant species; and (c) animal species. Even though insignificant, the average number of species identified by graduates and undergraduates is 3.5, but postgraduates tend to identify a higher number (4.3) of species in the parks. Visitors taking part in activities related to the protection of nature tend to identify more species in the park (p < 0.005).
Table 3.
Differences in environmental awareness among different socio-demographic groups.
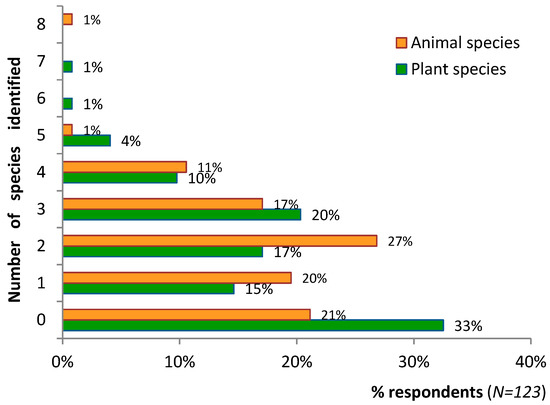
Figure 3.
Number of plant and animal species identified by the visitors.
The neem tree (Azadirachta indica) and sacred peepal tree (Ficus religiosa) were the most frequently named plants, and peacocks (Pavocristatus) and dogs (Canis lupus familiaris) were the frequently identified animal species (Table 4).
Table 4.
Most frequently identified plant and animal species in the parks by the visitors.
3.3. Main Uses of Green Space as Ascertained by Different Population Groups.
The analysis of peoples’ perception of uses of green spaces reflects their demands and needs/expectations from green spaces. The respondents were asked about the uses of green space. The visitors’ responses were varied. They are categorized into five groups to give us a better understanding of how people value the urban green spaces. The first group, ‘social and recreational benefits’ comprises of benefits like ‘recreation’, ‘aesthetics’, ‘social bonding’, and ‘meeting friends’. ‘Mental peace’, ‘spiritual benefit’, ‘connect to nature’, ‘relaxation’, ‘good for eyes’, ‘longevity’, and ‘health benefits’ constitute the second category of ‘psychological and health benefits’. ‘Protection of the environment’, ‘oxygen generation’,’ pollution control’, ‘reduction of global warming’, ‘fresh air and breeze’, ‘shade’, and ‘cooling’ have been grouped together to form the third category, ‘environmental benefits’. The fourth group includes ‘biodiversity benefits’. The fifth category, ‘other benefits’ comprises of ‘economic benefits’, ‘furniture’, ‘fruits’, and ‘environmental education’.
About 87% respondents said that passive use for ‘environmental benefits’ constitutes the main use of urban green spaces, followed by ‘psychological and health benefits’ (68%), and about 45% and 13% state that green spaces are important for ‘social and recreational’ purposes and ‘biodiversity benefits’, respectively (Figure 4).
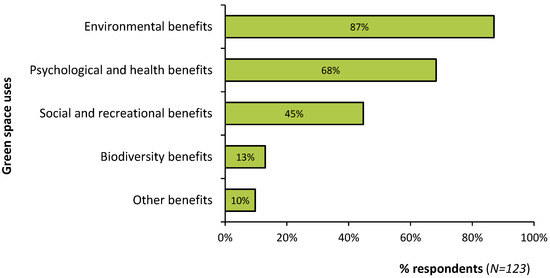
Figure 4.
Uses of green space.
There was considerable variation in the perception of green space use between visitors from different age groups (Table 5). Older visitors (>55 years) valued green spaces more for ‘environmental benefits’ (p < 0.05) than younger visitors. Younger (<25 years) visitors (33%) were less aware of the ‘psychological and health benefits’ (p = 0.0005) than other age groups. However, younger (<25 years) visitors were more aware of the ‘other benefits’of green space use than the two older age groups. Perception of uses of green space also varied significantly amongst different education groups (p = 0.01), occupation groups (p = 0.003), and companion groups (p = 0.01). Postgraduates (92%) appreciated the ‘psychological and health benefits’ of urban green space more than graduates and undergraduates. Students (25%) and visitors with friends (42%) did not appreciate the ‘psychological and health benefits’ of urban nature as much as other groups.
Table 5.
Uses of green space by various socio-demographic groups.
3.4. Quality of Nature
The respondents were asked the question ‘What is your assessment of the quality of this park?’. About 49% male and 38% female respondents found the quality of the park to be good (Figure 5). The perception of quality of nature varied significantly in terms of gender and occupational groups (Table 6). Only the females (100%) considered the parks to be ‘bad’ (p < 0.0001). However very few (3%) students considered the parks to be ‘very good’ (p = 0.004). The perception of quality of nature also varied according to the frequency of visits. A significant proportion (65%) of first time visitors considered the parks to be good (p = 0.02). The respondents were then asked ‘How do you think this park can be improved so that more people come here?’. About 33% of respondents wanted biodiversity improvements in the park, including an increase in the number of trees and flowering plants and more birds. A majority (66%) of the respondents would like infrastructural improvements, ranging from better security and accessibility to the provision of separate play areas for children and increased advertisement of the park. Twenty-six percent of the visitors who consider the park to be very good do not suggest any further improvements (p < 0.001). Visitors’ expectations for park improvement did not vary across different socio-demographic groups (Table 6).
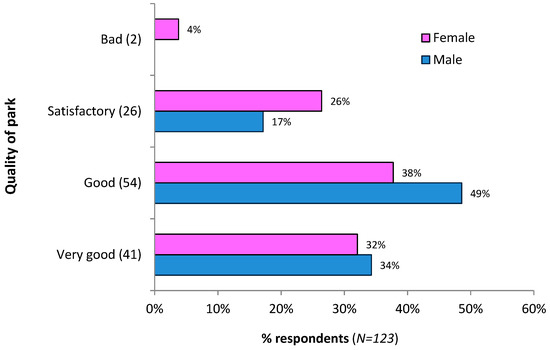
Figure 5.
Quality of park according to the visitors.
Table 6.
Quality of nature and expected improvements by different socio-demographic groups.
3.5. Distance to Green Space and Frequency of Use
For about 36% of the respondents, the surveyed parks were closest to their place of residence. The number of total visitors to the surveyed park tends to increase with the distance of place of residence from the parks. Only 7% of the visitors to the surveyed parks come from a distance of <0.5 km, while the majority of the visitors travelled more than one km from their place of residence to visit the surveyed parks. Especially, 33% of the visitors travelled more than 10 km to from their place of residence to visit the parks (Figure 6). There was not much variation in the distance travelled by the respondents to visit the parks from their place of residence in terms of gender, education, and companion (Table 7). However there was significant variation amongst different age and occupation groups. About 13% of older visitors traveled more than 10 km from their place of residence to visit the park (p = 0.008), whereas 58% of younger adults (25–55 years) visited parks located at a distance beyond 10 km from their place of residence. In comparison to student visitors (8%), a greater proportion of business and self-employed (37%) people traveled 5 to 10 km from their place of residence to visit parks (p = 0.034).
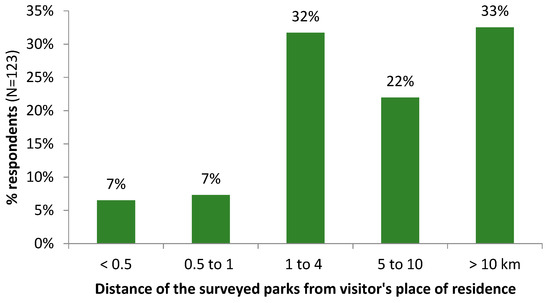
Figure 6.
Distance of the surveyed parks from visitor’s place of residence.
Table 7.
Distance travelled by different socio-demographic groups to visit surveyed parks.
About 24% of the respondents visited these parks daily, while 28% were first time visitors. The majority (63%) of the daily users resided within 0.5 km of the surveyed parks, and only 10% lived beyond a distance of 10 km from the parks. There was significant variation in the frequency of green space use in terms of gender, education and companion (Table 8). A greater proportion of male respondents (71%) visited the parks several times a week than the females (p = 0.03). In comparison to the older age groups, a very small proportion (7%) of younger visitors visited the parks everyday (p = 0.012). Fifty-two percent of the visitors preferred to visit the park alone every day (p = 0.001). About 76% of the ‘first time’ visitors preferred to visit the park with family (p = 0.004), a greater proportion of these being graduates (47%) (p = 0.037).
Table 8.
Frequency of visits to the surveyed parks by different socio-demographic groups.
Only 16% of the respondents had a neighbourhood park within 0.5 km of their residence, while more than 44% respondents had parks located at a distance greater than 2 km from their residence (Figure 7).
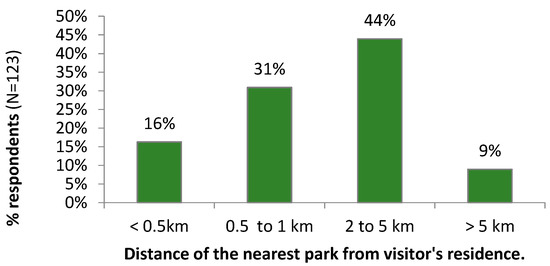
Figure 7.
Distance of neighbourhood parks from the respondent’s place of residence.
Even though only 16% of respondents had other smaller parks in their closest vicinity (<0.5 km), 50% of respondents were daily visitors to the surveyed parks (Figure 8). Thus we find that even though the nearest park was within easy reach (<0.5 km) to most visitors, their preference was for visiting the surveyed parks, possibly because these represent large, well-maintained, and attractive green spaces.
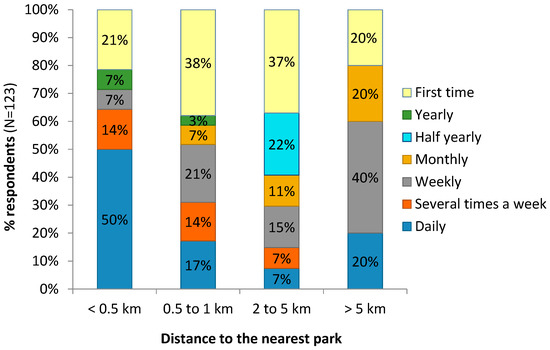
Figure 8.
Relation between the frequency of visits and distance to the nearest park.
Visitors to the parks have been categorized into seven categories based on their frequency of visit to the park (Figure 9). The proportion of the daily visitors to the surveyed parks tends to decrease as the distance to the park increases. A majority (63%) of the respondents staying within 0.5 km of the park visited the park daily (p < 0.01), while this proportion decreases to 10%, for those who covered more than 10 km daily. There was also significant variation in the frequency of visits and distance to the surveyed parks. The large proportion (50%) of first time visitors (p < 0.001) traveled longer distances (>10 km) to visit the park than the rest of the visitors. The visitors tend to travel 5 to 10 km on holidays (p < 0.05) to visit surveyed parks. This was again probably because the surveyed parks are larger than the neighbourhood parks and more attractive.
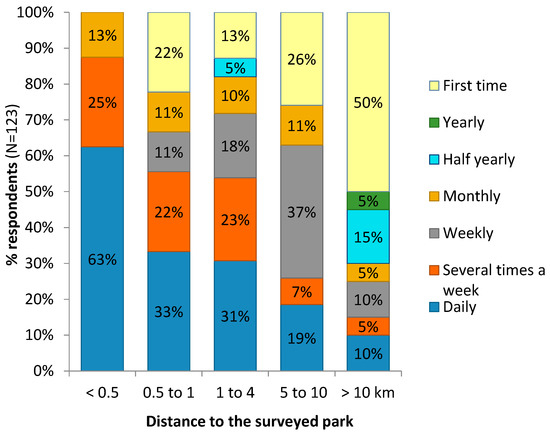
Figure 9.
Relation between the frequency of visits and distance to the surveyed park.
4. Discussion
4.1. Visitor Characteristics
It is very important to understand the socio-demographic characteristics of visitors to the park because personal characteristics, companion, work and living situations tend to determine recreation activity response [72]. The population of the New Delhi district is thinly spread in comparison to the National Capital Territory of Delhi. All four surveyed parks are known to be visited by people from a range of socio-economic backgrounds, Lodhi garden having higher visitation by the bureaucrats, politicians, wealthier and more influential visitors. Amongst the visitors, it is seen that a lesser proportion of women visitors visit the park than men, which is probably because women perceive more constraints to outdoor recreation participation like personal safety concerns, inadequate facilities and preoccupation with office and household work [73] than men do. A majority of the respondents had attained university level education, which is in contrary with the study by Jim and Chen [36] in Guangzhou, China. Most of the visitors were employed, are from the age group of 25 years to 55 years, and probably visit the park to relax and escape the stressful and polluted Delhi city life. A female, aged 65 said that ‘park ke swach bwatabaran mein humko bahut shanti milti hai aur Dilli ke dhul aur pradushan se mukti milti hai’, i.e. ‘my mind gets lot of peace in the clean environment of the park and it also gives respite from the dust and pollution of Delhi’. A lesser proportion of visitors were from the age group of >55 years. It has been observed in a study of 20 countries, including India [74], that physical activity declines with age. The visitors were mostly accompanied by family members as parks are attractive places to do recreational activities with families and contribute to enhanced social interaction [75]. Single people are reasonably well represented in the study, conforming to the study by Jim and Chen [36].
4.2. Environmental Awareness of the Users
Environmental awareness is a dynamic process aimed at augmenting our knowledge and understanding of the environment [76]. The emotional involvement of individuals tends to shape environmental awareness and attitudes [77]. The association of attitudes and behavior has led to interest in environmental attitudes as predictors of environmentally based actions and participation decisions [78]. A pro-environmental attitude is a powerful predictor of ecological behavior [79]. Pro-environmental attitudes tend to be related to resilient faith on honest intentions for species protection [78]. It was observed that many of the visitors took part in protection of nature, but a lesser proportion of young adults took part in conservation of nature. On the contrary, a study in Cleveland, Ohio has shown that older age groups preferred recreation rather than conservation [80]. It has been observed that young people have a lesser attraction to and interest in nature due to their growing up in highly urbanized areas and in over protected environments [81]. Most of the respondents who took park in nature conservation indicate that they were motivated to do so because of environmental education components in their school educational curriculum. In India, environmental education was introduced as a compulsory school subject in 2003. Following this, various programs are held in the schools to impart environmental education to students; for example, trees are planted and nurtured in the school and within the premises of houses [82]. Hence we find that a significant number of young adults attribute their participation in nature conservation to the school curriculum. A study by Kudryavtsev et al. [83] in the Bronx, New York shows that environmental education enhances environmental stewardship in urban communities. Lack of time is the main hindrance for not taking part in the conservation of nature in cities, as corroborated in studies by Mowen and Confer [84]. A study by Qiu et al. [85] shows that ecological knowledge tends to have a positive influence on a preference for biodiversity. The respondents were able to identify more animals than plant species in the parks, as also observed in Singapore [69], where the interviewees’ knowledge of plants was less than their knowledge of animal species. A study by Rupprecht et al. [47] in Brisbane and Sapporo reveals that the respondents didn’t consider themselves very conversant about local nature when it comes to knowledge of wild plants, wild animals, and birds. The people taking part in the protection of nature tend to identify more species, as observed in Singapore [69], with members of nature societies tending to identify a greater number of species. The poor knowledge of the plants and animals of most visitors can be attributed to their limited encounters with nature and learning opportunities in the urban concrete built environment, which has eventually led to detachment from and insensitiveness to their natural surroundings [36]. The neem tree and the peacock are more widely recognized by the visitors than the other plant and animal species in the parks. It is probably because the neem tree is deeply interwoven with the fabric of Indian culture [86] and widely used for its natural therapeutic properties in India [87], whereas the peacock, with its distinctive plumage and being the national bird of India, is easily recognized by the visitors to the parks.
4.3. Main Uses of Green Spaces as Ascertained by Different Population Groups
Studies carried out by Swamy and Devy [88] in Bengaluru show that large urban heritage parks are much valued for their environmental benefits like ‘regulation of noise and temperature’ and ‘fresh air and breeze’. A similar pattern of responses can also be observed in our study. ‘Recreation’, ‘aesthetics’ and ‘socializing’ together appear more valued by the respondents in Bengaluru, while in Delhi it is observed that a much greater proportion of visitors appreciate green space for ‘Psychological and health benefits’. This can be related to the severe levels of air pollution in Delhi, which has been described as one of the world’s most polluted cities [89].
The uses of green spaces are not perceived similarly by all individuals in a population. The older visitors and visitors with higher education tend to appreciate the ‘psychological and health benefits’ of urban green space more than the rest of the population in Delhi. Perceptions tend to vary with socio-economic and demographic factors, as shown by several different studies [68,90]. In Guangzhou, China, women are more reluctant to participate in outdoor recreation than men [91]. In Delhi, given the overall insecurity of women’s safety in public places, women do not access green spaces as much as men. Women tend to value green spaces for passive recreational activities such as socializing [92]. It is evident that social interaction contributes to better social cohesion [93]. Parks also serve as refuges for visitors wanting to escape the stress of the city [20,94].
Priego et al.’s [67] study of three countries reveals that people with different social and cultural backgrounds use and perceive the urban landscape in different ways. Age, gender, education level, income, retirement status, residential neighbourhood and length of stay tend to influence peoples’ perception [16,91,95,96,97]. Varied responses to nature have also been noted between communities varying in race or class [90,98]. However, Qureshi et al. [97] in study in Karachi found no impact of age group or gender on the behavioural pattern of respondents.
4.4. Quality of Nature
The majority of the visitors are happy with the quality of the park, but only females consider the parks to be ‘bad’. Thus there is prevalence of negative emotions amongst the female park visitors in Delhi. The ‘bad’ assessment of the parks may be the outcome of perceived social dangers by the female visitors [99]. The first time visitors rated the parks to be ‘good’. It is seen that the different degrees of visitors’ familiarity with the parks also leads to differences in their evaluative appraisal [100]. There is a clear preference for safety, cleanliness and maintenance in the parks, as found in other studies like one in Los Angeles [101]. Concerns about safety have been voiced by urban residents in Los Angeles [101] and Hong Kong [96]. Increased maintenance tends to increase the preference and sense of safety [102]. Visitors prefer promotion and advertisement for parks in order to enhance their use by the public. A study by Scott and Jackson [103] in Cleveland, Ohio confirmed that improved promotion encourages park use.
4.5. Distance to Green Space and Frequency of Use
Smaller distance to green spaces in urban areas is important because it contributes to improved human health and wellbeing [104] and is also a key planning and management issue [105]. The surveyed parks are located in the New Delhi district, and visitors come from both the New Delhi district and places far from the New Delhi district. Only 19% of the total visitors have access to green spaces within a distance of 500 m. This confirms that the accessibility in terms of the distance to green space is very low in Delhi in comparison to other countries, where the distance to green spaces is relatively lower [68,106]. We find that the proportion of visitors increases with distance. It is likely to be as a result of the attractiveness of large parks. This confirms studies in Perth [40] and Bengaluru [88] that found that the access to large attractive green spaces is associated with higher level of walking, and distance alone is not a deterrent. This study finds that younger visitors travel longer distances than older visitors, and male visitors tend to visit the parks several times a week. Women face greater constraints to outdoor recreation participation than men [107]. With age and reduced mobility, older people are reluctant to travel longer distances. This is in congruence with the study by Lo and Jim [96], in which less mobile retired people were not willing to travel longer distances to visit large parks. At the same time, students are not very enthusiastic about traveling longer distances to visit the parks. Studies have shown that the lively social environments of the parks tend to attract students, and their park use is strongly guided by their friends’ park use [108]. The number of daily visitors tends to decrease with the increase in distance to the park, which has been corroborated by studies in Denmark [68] and Belgium [72]. Mowen and Confer [84] stated that shorter distances are critical for establishing a stronger user base. At the same time, a large proportion of first time and weekly visitors travel longer distances to visit the surveyed parks because they are larger and more attractive than their neighbourhood parks [109]. A study by Swamy [88] also established the fact that large attractive parks tend to attract visitors from far and wide. New Delhi park visitors who visit the parks every day do so without family and friends. Similarly in Guangzhou [110], single visitors visit parks regularly, yet a large number of ‘first time’ visitors visit the parks with their family. The surveyed parks are attractive tourist destinations, and people are motivated to travel to attractive tourist places as a family as it gives them the opportunity to be together [111].
5. Conclusions
This survey of park visitors in the megalopolis of Delhi aims to understand perceptions of and expectations from nature in urban communities living in a crowded Indian city. This study adds to information that can help in the better design of parks in response to peoples’ expectations in Delhi. It also contributes to the rather limited information on peoples’ perceptions and needs from urban green spaces in cities in the Global South, in contrast to the relatively greater information available from cities in Europe and North America [16,67,68], and adds to a small but steadily growing database of studies from Asia [88,91,97]. Some findings, such as the increased attractiveness of large parks with more visitors, specifically women and families, due to considerations of safety, may be specific to cities such as Delhi, with its relatively high rate of crime and insecurity for women. Other findings, such as the tendency of daily visitors to visit alone but for one-time visitors to visit with family, are trends that can be seen across other parks. Further research in parks across Delhi and other cities in India is required to understand the Delhi-specific and India-specific characteristics of the case study and, consequently, the implications for planning policies in other urban contexts.
In the stressful and polluted city life of Delhi, visitors value urban green spaces most for the ‘environmental benefits’. Older adults and postgraduate educated visitors especially tend to appreciate the ‘psychological and health. We also find that the accessibility in terms of distance to green space is very low in Delhi compared to other cities. Large parks tend to attract more visitors from further distances, despite their having small neighbourhood parks in the vicinity of their homes. The visitors want better quality parks with proper maintenance and better infrastructural facilities like separate play areas for children and better security. There are various barriers to park use like lack of time, transport problem, poverty, lack of companion, and safety. Safety represents a constraint on the use of parks, particularly for women and families and especially in places like Delhi, where the interior areas of these large parks are often ‘safe havens’ for criminals after sunset [112]. An increased focus on security will help residents to access the parks in greater numbers without compromising their personal safety. Such measures will be likely to increase the uses of green space by a diverse mix of gender and age groups. This will ensure socially favourable urban parks for the wellbeing of the urban community. Public perceptions of green spaces in Delhi throw up an interesting mix of requirements, with an increased focus on the aesthetic and the environmental benefits in preference to biodiversity. This study has policy implications for planners and urban designers, as well as for environmental organizations. The pro-environmental attitude of the respondents is expressed by the presence of ‘plants at home’, taking part in ‘conservation of nature’, and their awareness for ‘need for more parks/green spaces’. Due to India’s age-old tradition and culture of using neem for various purposes, this tree is easily identified by park visitors, but still there is a gap in the public understanding of biodiversity in Delhi’s parks, with the result that one out of three visitors cannot name a single plant species, while one out of four visitors were unable to name a single common animal or insect that they had observed in the park. Further research is required to understand and take into account the opinion of visitors, capture the views of diverse age, gender, and ethnic-cultural groups in the planning and designing of urban parks and green spaces. It will be interesting to look at the differences of perception of the visitors residing in the New Delhi district and visitors to the New Delhi district. Further analysis combining survey data on socio-economic information with socio-economic data from the census, based on visitors’ places of residence, is necessary to find out whether our results hold up for a larger sample of the population and in more recent years. This will ensure effective plans and designs capable of satisfying the needs of the urban community. The methodological approach of the study has exportability, and the empirical information obtained in study has comparability to other Indian cities and cities of the Global South. Given the rapid urbanization currently underway in India, concomitant with the disappearance of trees, wetlands, and green spaces, access to parks provides an increasingly rare opportunity for exposure to nature for many Indian urbanites. This study aims to contribute to an increased focus on the importance of green spaces in the urban context in India, where the current focus on smart cities [113] threatens to obscure the importance of low-technology options for improving urban resilience and wellbeing through a renewed focus on urban green spaces.
Acknowledgments
We thank the Royal Norwegian Embassy (RNE: IND-3025 1210050) and the Tata Social Welfare Trust (TSWT:TSWT/IG/SP/BM/sm/CM/24/MNRL/2011-12) for doctoral research support to Somajita Paul, and we thank Azim Premji University for research support to Harini Nagendra.
Author Contributions
Harini Nagendra and Somajita Paul jointly conceived the study and wrote the paper; Somajita Paul surveyed and analyzed the data; and Harini Nagendra supervised the study.
Conflicts of Interest
The authors declare no conflict of interest. The founding sponsors had no role in the design of the study; in the collection, analyses, or interpretation of data; in the writing of the manuscript; or in the decision to publish the results.
References
- Rose, S.; Peters, N.E. Effects of urbanization on streamflow in the Atlanta area (Georgia, USA): A comparative hydrological approach. Hydrol. Process. 2001, 15, 1441–1457. [Google Scholar] [CrossRef]
- Booth, D.B.; Jackson, C.R. Urbanization of aquatic systems: Degradation thresholds, storm water detection, and the limits of mitigation. JAWRA J. Am. Water Resour. Assoc. 1997, 33, 1077–1090. [Google Scholar] [CrossRef]
- Khera, N.; Mehta, V.; Sabata, B. Interrelationship of birds and habitat features in urban greenspaces in Delhi, India. Urban For. Urban Green. 2009, 8, 187–196. [Google Scholar] [CrossRef]
- Riley, S.P.; Sauvajot, R.M.; Fuller, T.K.; York, E.C.; Kamradt, D.A.; Bromley, C.; Wayne, R.K. Effects of urbanization and habitat fragmentation on bobcats and coyotes in southern California. Conserv. Biol. 2003, 17, 566–576. [Google Scholar] [CrossRef]
- McKinney, M.L. Urbanization, biodiversity, and conservation: The impacts of urbanization on native species are poorly studied, but educating a highly urbanized human population about these impacts can greatly improve species conservation in all ecosystems. Bioscience 2002, 52, 883–890. [Google Scholar] [CrossRef]
- Wang, L.; Lyons, J.; Kanehl, P.; Bannerman, R. Impacts of urbanization on stream habitat and fish across multiple spatial scales. Environ. Manag. 2001, 28, 255–266. [Google Scholar] [CrossRef]
- Vailshery, L.S.; Jaganmohan, M.; Nagendra, H. Effect of street trees on microclimate and air pollution in a tropical city. Urban For. Urban Green. 2013, 12, 408–415. [Google Scholar] [CrossRef]
- Shepherd, J.M.; Pierce, H.; Negri, A.J. Rainfall modification by major urban areas: Observations from spaceborne rain radar on the TRMM satellite. J. Appl. Meteorol. 2002, 41, 689–701. [Google Scholar] [CrossRef]
- Huff, F.; Changnon, S.A., Jr. Climatological assessment of urban effects on precipitation at St. Louis. J. Appl. Meteorol. 1972, 11, 823–842. [Google Scholar] [CrossRef]
- Kaufmann, R.K.; Seto, K.C.; Schneider, A.; Liu, Z.; Zhou, L.; Wang, W. Climate response to rapid urban growth: Evidence of a human-induced precipitation deficit. J. Clim. 2007, 20, 2299–2306. [Google Scholar] [CrossRef]
- Li, J.; Song, C.; Cao, L.; Zhu, F.; Meng, X.; Wu, J. Impacts of landscape structure on surface urban heat islands: A case study of Shanghai, China. Remote Sens. Environ. 2011, 115, 3249–3263. [Google Scholar] [CrossRef]
- Grimmond, S. Urbanization and global environmental change: Local effects of urban warming. Geogr. J. 2007, 173, 83–88. [Google Scholar] [CrossRef]
- Baker, L.A.; Brazel, A.J.; Selover, N.; Martin, C.; McIntyre, N.; Steiner, F.R.; Nelson, A.; Musacchio, L. Urbanization and warming of Phoenix (Arizona, USA): Impacts, feedbacks and mitigation. Urban Ecosyst. 2002, 6, 183–203. [Google Scholar] [CrossRef]
- Saitoh, T.; Shimada, T.; Hoshi, H. Modeling and simulation of the Tokyo urban heat island. Atmos. Environ. 1996, 30, 3431–3442. [Google Scholar] [CrossRef]
- Bolund, P.; Hunhammar, S. Ecosystem services in urban areas. Ecol. Econ. 1999, 29, 293–301. [Google Scholar] [CrossRef]
- Chiesura, A. The role of urban parks for the sustainable city. Landsc. Urban Plan. 2004, 68, 129–138. [Google Scholar] [CrossRef]
- Gobster, P.H. Perception and use of a metropolitan greenway system for recreation. Landsc. Urban Plan. 1995, 33, 401–413. [Google Scholar] [CrossRef]
- Mactavish, J.B.; Schleien, S.J. Playing together growing together: Parent’s perspectives on the benefits of family recreation in families that include children with a developmental disability. Ther. Recreat. J. 1998, 32, 207. [Google Scholar]
- Pretty, J.; Peacock, J.; Hine, R.; Sellens, M.; South, N.; Griffin, M. Green exercise in the UK countryside: Effects on health and psychological well-being, and implications for policy and planning. J. Environ. Plan. Man. 2007, 50, 211–231. [Google Scholar] [CrossRef]
- De Vries, S.; Verheij, R.A.; Groenewegen, P.P.; Spreeuwenberg, P. Natural environments—healthy environments? An exploratory analysis of the relationship between greenspace and health. Environ. Plan. A 2003, 35, 1717–1731. [Google Scholar] [CrossRef]
- Lee, A.C.; Maheswaran, R. The health benefits of urban green spaces: A review of the evidence. J. Public Health 2011, 33, 212–222. [Google Scholar] [CrossRef] [PubMed]
- Nielsen, T.S.; Hansen, K.B. Do green areas affect health? Results from a Danish survey on the use of green areas and health indicators. Health Place 2007, 13, 839–850. [Google Scholar] [CrossRef] [PubMed]
- Fuller, R.A.; Irvine, K.N.; Devine-Wright, P.; Warren, P.H.; Gaston, K.J. Psychological benefits of greenspace increase with biodiversity. Biol. Lett. 2007, 3, 390–394. [Google Scholar] [CrossRef] [PubMed]
- Van den Berg, A.E.; Maas, J.; Verheij, R.A.; Groenewegen, P.P. Green space as a buffer between stressful life events and health. Soc. Sci. Med. 2010, 70, 1203–1210. [Google Scholar] [CrossRef] [PubMed]
- Cattell, V.; Dines, N.; Gesler, W.; Curtis, S. Mingling, observing, and lingering: Everyday public spaces and their implications for well-being and social relations. Health Place 2008, 14, 544–561. [Google Scholar] [CrossRef] [PubMed]
- Maas, J.; Van Dillen, S.M.; Verheij, R.A.; Groenewegen, P.P. Social contacts as a possible mechanism behind the relation between green space and health. Health Place 2009, 15, 586–595. [Google Scholar] [CrossRef] [PubMed]
- Peters, K.; Elands, B.; Buijs, A. Social interactions in urban parks: Stimulating social cohesion? Urban For. Urban Green. 2010, 9, 93–100. [Google Scholar] [CrossRef]
- Bell, S.; Tyrväinen, L.; Sievänen, T.; Pröbstl, U.; Simpson, M. Outdoor recreation and nature tourism: A European perspective. Living Rev. Landsc. Res. 2007, 1, 1–46. [Google Scholar] [CrossRef]
- Kaczynski, A.T.; Henderson, K.A. Environmental correlates of physical activity: A review of evidence about parks and recreation. Leis. Sci. 2007, 29, 315–354. [Google Scholar] [CrossRef]
- Tyrväinen, L.; Väänänen, H. The economic value of urban forest amenities: An application of the contingent valuation method. Landsc. Urban Plan. 1998, 43, 105–118. [Google Scholar] [CrossRef]
- Van Herzele, A.; Wiedemann, T. A monitoring tool for the provision of accessible and attractive urban green spaces. Landsc. Urban Plan. 2003, 63, 109–126. [Google Scholar] [CrossRef]
- Tajima, K. New estimates of the demand for urban green space: Implications for valuing the environmental benefits of Boston’s big dig project. J. Urban Aff. 2003, 25, 641–655. [Google Scholar] [CrossRef]
- Conway, D.; Li, C.Q.; Wolch, J.; Kahle, C.; Jerrett, M. A spatial autocorrelation approach for examining the effects of urban greenspace on residential property values. J. Real Estate Financ. Econom. 2010, 41, 150–169. [Google Scholar] [CrossRef]
- Morancho, A.B. A hedonic valuation of urban green areas. Landsc. Urban Plan. 2003, 66, 35–41. [Google Scholar] [CrossRef]
- Tyrväinen, L. Economic valuation of urban forest benefits in Finland. J. Environ. Manag. 2001, 62, 75–92. [Google Scholar] [CrossRef] [PubMed]
- Jim, C.; Chen, W.Y. Perception and attitude of residents toward urban green spaces in Guangzhou (China). Environ. Manag. 2006, 38, 338–349. [Google Scholar] [CrossRef] [PubMed]
- Martín-López, B.; Montes, C.; Benayas, J. The non-economic motives behind the willingness to pay for biodiversity conservation. Biol. Conserv. 2007, 139, 67–82. [Google Scholar] [CrossRef]
- Lamarque, P.; Tappeiner, U.; Turner, C.; Steinbacher, M.; Bardgett, R.D.; Szukics, U.; Schermer, M.; Lavorel, S. Stakeholder perceptions of grassland ecosystem services in relation to knowledge on soil fertility and biodiversity. Reg. Environ. Chang. 2011, 11, 791–804. [Google Scholar] [CrossRef]
- Matsuoka, R.H.; Kaplan, R. People needs in the urban Landscape Urban Plann: Analysis of landscape and urban planning contributions. Landsc. Urban Plan. 2008, 84, 7–19. [Google Scholar] [CrossRef]
- Giles-Corti, B.; Broomhall, M.H.; Knuiman, M.; Collins, C.; Douglas, K.; Ng, K.; Lange, A.; Donovan, R.J. Increasing walking: How important is distance to, attractiveness, and size of public open space? Am. J. Prev. Med. 2005, 28, 169–176. [Google Scholar] [CrossRef] [PubMed]
- Nutsford, D.; Pearson, A.L.; Kingham, S. An ecological study investigating the association between access to urban green space and mental health. Public Health 2013, 127, 1005–1011. [Google Scholar] [CrossRef] [PubMed]
- Boone, C.G.; Buckley, G.L.; Grove, J.M.; Sister, C. Parks and People: An Environmental Justice Inquiry in Baltimore, Maryland. Assoc. Am. Geogr. 2009, 99, 767–787. [Google Scholar] [CrossRef]
- Lin, B.; Fuller, R.A.; Bush, R.; Gaston, K.J.; Shanahan, D.F. Opportunity or Orientation? Who Uses Urban Parks and Why. PLoS ONE 2014, 9, e87422. [Google Scholar] [CrossRef] [PubMed]
- Larson, L.R.; Jennings, V.; Cloutier, S.A. Public Parks and Wellbeing in Urban Areas of the United States. PLoS ONE 2016, 11, e0153211. [Google Scholar] [CrossRef] [PubMed]
- Thaiutsa, B.; Puangchit, L.; Kjelgren, R.; Arunpraparut, W. Urban green space, street tree and heritage large tree assessment in Bangkok, Thailand. Urban For. Urban Green. 2008, 7, 219–229. [Google Scholar] [CrossRef]
- Yuen, B.; Hien, W.N. Resident perceptions and expectations of rooftop gardens in Singapore. Landsc. Urban Plan. 2005, 73, 263–276. [Google Scholar] [CrossRef]
- Rupprecht, C.D.; Byrne, J.A.; Ueda, H.; Lo, A.Y. ‘It’s real, not fake like a park’: Residents’ perception and use of informal urban green-space in Brisbane, Australia and Sapporo, Japan. Landsc. Urban Plan. 2015, 143, 205–218. [Google Scholar] [CrossRef]
- Chang, H.-S.; Chen, T.-L. Decision making on allocating urban green spaces based upon spatially-varying relationships between urban green spaces and urban compaction degree. Sustainability 2015, 7, 13399–13415. [Google Scholar] [CrossRef]
- Yang, J.; Li, C.; Li, Y.; Xi, J.; Ge, Q.; Li, X. Urban green space, uneven development and accessibility: A case of Dalian’s Xigang District. Chin. Geogr. Sci. 2015, 25, 644–656. [Google Scholar] [CrossRef]
- Tan, P.Y.; Ismail, M.R.B. The effects of urban forms on photosynthetically active radiation and urban greenery in a compact city. Urban Ecosyst. 2015, 18, 937–961. [Google Scholar] [CrossRef]
- Lin, B.; Meyers, J.; Barnett, G. Understanding the potential loss and inequities of green space distribution with urban densification. Urban For. Urban Green. 2015, 14, 952–958. [Google Scholar] [CrossRef]
- Paul, S.; Nagendra, H. Vegetation change and fragmentation in the mega city of Delhi: Mapping 25 years of change. Appl. Geogr. 2015, 58, 153–166. [Google Scholar] [CrossRef]
- Government of NCT of Delhi. Available online: http://www.delhi.gov.in/wps/wcm/connect/doit_dpg/DoIT_DPG/Home (accessed on 20 November 2014).
- Chandramouli, C.; General, R. Census of India 2011. In Provisional Population Totals; Government of India: New Delhi, India, 2011. [Google Scholar]
- Dupont, V. Conflicting stakes and governance in the peripheries of large Indian metropolises–an introduction. Cities 2007, 24, 89–94. [Google Scholar] [CrossRef]
- Buch, M. Lutyens’ New Delhi—yesterday, today and tomorrow. India Int. Cent. Q. 2003, 30, 29–40. [Google Scholar]
- Prasad, G.; Kumar, D.; Nain, G. New Delhi as a Tourism Region. Glob. J. Res. Anal. 2015, 4, 8. [Google Scholar]
- Mohan, M. Climate change: Evaluation of ecological restoration of Delhi ridge using remote sensing and GIS technologies. Int. Arch. Photogramm. Remote Sens. 2000, 33, 886–894. [Google Scholar]
- Lodi, B. Lodi dynasty. Available online: https://www.revolvy.com/main/index.php?s=Lodi%20Dynasty&item_type=topic (accessed on 5 March 2017).
- Sharma, J.P. The British treatment of historic gardens in the Indian subcontinent: The transformation of Delhi’s nawab Safdarjung’s tomb complex from a funerary garden into a public park. Gard. Hist. 2007, 35, 210–228. [Google Scholar]
- Feilden, B.M. Bhuli Bhatiyari ka Mahal, Delhi. Archit. Plus Des. 1992, 9, 63. [Google Scholar]
- Rosenthal, R.; Rosnow, R.L. Essentials of Behavioral Research: Methods and Data Analysis; McGraw-Hill: New York, NY, USA, 1991. [Google Scholar]
- Tucker, P.; Gilliland, J.; Irwin, J.D. Splashpads, swings, and shade: Parents’ preferences for neighbourhood parks. Can. J. Public Health. 2007, 98, 198–202. [Google Scholar] [PubMed]
- D’Souza, R.; Nagendra, H. Changes in public commons as a consequence of urbanization: The Agara lake in Bangalore, India. Environ. Manag. 2011, 47, 840. [Google Scholar] [CrossRef] [PubMed]
- Krenichyn, K. ‘The only place to go and be in the city’: Women talk about exercise, being outdoors, and the meanings of a large urban park. Health Place 2006, 12, 631–643. [Google Scholar] [CrossRef] [PubMed]
- Nordh, H.; Alalouch, C.; Hartig, T. Assessing restorative components of small urban parks using conjoint methodology. Urban For. Urban Green. 2011, 10, 95–103. [Google Scholar] [CrossRef]
- Priego, C.; Breuste, J.; Rojas, J. Perception and value of nature in urban landscapes: A comparative analysis of cities in Germany, Chile and Spain. Landsc. Online 2008, 7, 22. [Google Scholar] [CrossRef]
- Schipperijn, J.; Ekholm, O.; Stigsdotter, U.K.; Toftager, M.; Bentsen, P.; Kamper-Jørgensen, F.; Randrup, T.B. Factors influencing the use of green space: Results from a Danish national representative survey. Landsc. Urban Plan. 2010, 95, 130–137. [Google Scholar] [CrossRef]
- Briffett, C.; Sodhi, N.; Yuen, B.; Kong, L. Green corridors and the quality of urban life in Singapore. Proceedings the 4th International Urban Wildlife Symposium, Arizona, AR, USA, 1–5 May 2004; pp. 56–63. [Google Scholar]
- Randler, C.; Höllwarth, A.; Schaal, S. Urban park visitors and their knowledge of animal species. Anthrozoos 2007, 20, 65–74. [Google Scholar] [CrossRef]
- Cressie, N. Statistics for Spatial Data; John Wiley Sons: New York, NY, USA, 2015. [Google Scholar]
- Roovers, P.; Hermy, M.; Gulinck, H. Visitor profile, perceptions and expectations in forests from a gradient of increasing urbanisation in central Belgium. Landsc. Urban Plan. 2002, 59, 129–145. [Google Scholar] [CrossRef]
- Huda, S.S.M.S.; Akhtar, A. Leisure behaviour of working women of Dhaka, Bangladesh. Int. J. Urban Labour Leis. 2005, 7, 1–30. [Google Scholar]
- Bauman, A.; Bull, F.; Chey, T.; Craig, C.L.; Ainsworth, B.E.; Sallis, J.F.; Pratt, M. The international prevalence study on physical activity: Results from 20 countries. Int. J. Behav. Nutr. Phys. Act. 2009, 6, 21. [Google Scholar] [CrossRef] [PubMed]
- Ujang, N.; Moulay, A.; Zakariya, K. Sense of well-being indicators: Attachment to public parks in Putrajaya, Malaysia. Procedia-Soc. Behav. Sci. 2015, 202, 487–494. [Google Scholar] [CrossRef]
- Rego, A.B.; Muthoka, M.G. Education for environmental awareness. Soc. Relig. Concerns East Afr. A Wajibu Anthol. 2005, 10, 197. [Google Scholar]
- Kollmuss, A.; Agyeman, J. Mind the gap: Why do people act environmentally and what are the barriers to pro-environmental behavior? Environ. Educ. Res. 2002, 8, 239–260. [Google Scholar] [CrossRef]
- Kotchen, M.J.; Reiling, S.D. Environmental attitudes, motivations, and contingent valuation of nonuse values: A case study involving endangered species. Ecol. Econ. 2000, 32, 93–107. [Google Scholar] [CrossRef]
- Kaiser, F.G.; Ranney, M.; Hartig, T.; Bowler, P.A. Ecological behavior, environmental attitude, and feelings of responsibility for the environment. Eur. Psychol. 1999, 4, 59. [Google Scholar] [CrossRef]
- Payne, L.L.; Mowen, A.J.; Orsega-Smith, E. An examination of park preferences and behaviors among urban residents: The role of residential location, race, and age. Leis. Sci. 2002, 24, 181–198. [Google Scholar] [CrossRef]
- Kong, L.; Yuen, B.; Sodhi, N.S.; Briffett, C. The construction and experience of nature: Perspectives of urban youths. Tijdschr. Econ. Soc. Geogr. 1999, 90, 3–16. [Google Scholar] [CrossRef]
- Sonowal, C.J. Environmental education in schools: The Indian scenario. J. Hum. Ecol. 2009, 28, 15–36. [Google Scholar]
- Kudryavtsev, A.; Krasny, M.E.; Stedman, R.C. The impact of environmental education on sense of place among urban youth. Ecosphere 2012, 3, 1–15. [Google Scholar] [CrossRef]
- Mowen, A.J.; Confer, J.J. The relationship between perceptions, distance, and socio-demographic characteristics upon public use of an urban park “in-fill”. J. Park Recreat. Adm. 2003, 21, 58–74. [Google Scholar]
- Qiu, L.; Lindberg, S.; Nielsen, A.B. Is biodiversity attractive?—On-site perception of recreational and biodiversity values in urban green space. Landsc. Urban Plan. 2013, 119, 136–146. [Google Scholar] [CrossRef]
- Marden, E. The neem tree patent: International conflict over the commodification of life. Boston Coll. Int. Comp. Law Rev. 1999, 22, 279. [Google Scholar]
- Verma, V.C.; Gond, S.K.; Kumar, A.; Kharwar, R.N.; Strobel, G. The endophytic mycoflora of bark, leaf, and stem tissues of Azadirachta indica A. Juss (Neem) from Varanasi (India). Microb. Ecol. 2007, 54, 119–125. [Google Scholar] [CrossRef] [PubMed]
- Swamy, S.; Devy, S. Forests, heritage green spaces, and neighbourhood parks: Citizen’s attitude and perception towards ecosystem services in Bengaluru. J. Resour. Energy Dev. 2010, 7, 117–122. [Google Scholar]
- Guttikunda, S.K.; Calori, G. A gis based emissions inventory at 1 km × 1 km spatial resolution for air pollution analysis in Delhi, India. Atmos. Environ. 2013, 67, 101–111. [Google Scholar] [CrossRef]
- Crow, T.; Brown, T.; De Young, R. The riverside and Berwyn experience: Contrasts in landscape structure, perceptions of the urban landscape, and their effects on people. Lands. Urban Plan. 2006, 75, 282–299. [Google Scholar] [CrossRef]
- Jim, C.; Shan, X. Socioeconomic effect on perception of urban green spaces in Guangzhou, China. Cities 2013, 31, 123–131. [Google Scholar] [CrossRef]
- Björk, J.; Albin, M.; Grahn, P.; Jacobsson, H.; Ardö, J.; Wadbro, J.; Östergren, P.-O.; Skärbäck, E. Recreational values of the natural environment in relation to neighbourhood satisfaction, physical activity, obesity and wellbeing. J. Epidemiol. Community Health 2008, 62, e2. [Google Scholar] [CrossRef] [PubMed]
- Maloutas, T. Editorial: Urban segregation and the European context. Greek Rev. Soc. Res. 2004, 113, 3–24. [Google Scholar] [CrossRef]
- Bishop, I.; Ye, W.-S.; Karadaglis, C. Experiential approaches to perception response in virtual worlds. Landsc. Urban Plan. 2001, 54, 117–125. [Google Scholar] [CrossRef]
- Tyrväinen, L.; Mäkinen, K. Tools for Mapping Social Values and Meaning of Urban Woodlands and Other Open Space; COST Action C11 Green Structures and Urban Planning–Final report; COST: Brussels, Belgium, 2004. [Google Scholar]
- Lo, A.Y.; Jim, C.Y. Citizen attitude and expectation towards greenspace provision in compact urban milieu. Land Use Policy 2012, 29, 577–586. [Google Scholar] [CrossRef]
- Qureshi, S.; Breuste, J.H.; Jim, C. Differential community and the perception of urban green spaces and their contents in the megacity of Karachi, Pakistan. Urban Ecosyst. 2013, 16, 853–870. [Google Scholar] [CrossRef]
- Pincetl, S.; Gearin, E. The reinvention of public green space. Urban Geogr. 2005, 26, 365–384. [Google Scholar] [CrossRef]
- Sreetheran, M.; Van Den Bosch, C.C.K. A socio-ecological exploration of fear of crime in urban green spaces–A systematic review. Urban For. Urban Green. 2014, 13, 1–18. [Google Scholar] [CrossRef]
- Wong, K.K.; Domroes, M. The visual quality of urban park scenes of Kowloon Park, Hong Kong: Likeability, affective appraisal, and cross-cultural perspectives. Environ. Plan. B Plan Des. 2005, 32, 617–632. [Google Scholar] [CrossRef]
- Gearin, E.; Kahle, C. Teen and adult perceptions of urban green space Los Angeles. Child. Youth Environ. 2006, 16, 25–48. [Google Scholar]
- Kuo, F.E.; Bacaicoa, M.; Sullivan, W.C. Transforming inner-city landscapes trees, sense of safety, and preference. Environ. Behav. 1998, 30, 28–59. [Google Scholar] [CrossRef]
- Scott, D.; Jackson, E.L. Factors that limit and strategies that might encourage people’s use of public parks. J. Park Recreat. Adm. 1996, 14, 1–17. [Google Scholar]
- Sotoudehnia, F.; Comber, A. Poverty and Environmental Justice: A GIS Analysis of Urban Greenspace Accessibility for Different Economic Groups. In Proceedings of the 13th AGILE Int Conf on Geographic Information Science, Guimaraes, Portugal, 11–14 May 2010; pp. 10–14. [Google Scholar]
- Allison, M.T. Culture, Conflict, and Communication in the Wildland-Urban Interface; Access and boundary maintenance: Serving culturally diverse populations; Eastview Press: Boulder, CO, USA, 1992; pp. 99–108. [Google Scholar]
- Barbosa, O.; Tratalos, J.A.; Armsworth, P.R.; Davies, R.G.; Fuller, R.A.; Johnson, P.; Gaston, K.J. Who benefits from access to green space? A case study from Sheffield, UK. Landsc. Urban Plan. 2007, 83, 187–195. [Google Scholar] [CrossRef]
- Johnson, C.Y.; Bowker, J.M.; Cordell, H.K. Outdoor recreation constraints: An examination of race, gender, and rural dwelling. South. Rural Sociol. 2001, 7, 111–133. [Google Scholar]
- Ries, A.V.; Voorhees, C.C.; Roche, K.M.; Gittelsohn, J.; Yan, A.F.; Astone, N.M. A quantitative examination of park characteristics related to park use and physical activity among urban youth. J. Adolesc. Health 2009, 45, S64–S70. [Google Scholar] [CrossRef] [PubMed]
- Chaudhry, P.; Bagra, K.; Singh, B. Urban greenery status of some Indian cities: A short communication. Int. J. Environ. Sci. Dev. 2011, 2, 98. [Google Scholar] [CrossRef]
- Jim, C.Y.; Chen, W.Y. Recreation–amenity use and contingent valuation of urban greenspaces in Guangzhou, China. Landsc. Urban Plan. 2006, 75, 81–96. [Google Scholar] [CrossRef]
- Yoon, Y.; Uysal, M. An examination of the effects of motivation and satisfaction on destination loyalty: A structural model. Tour. Manag. 2005, 26, 45–56. [Google Scholar] [CrossRef]
- Pankhuri, Y. Times of India. Available online: http://timesofindia.indiatimes.com/city/delhi/parks-safe-haven-for-criminals-at-night/articleshow/57239080.cms (accessed on 4 April 2017).
- Government of India. Ministry of Urban Development. Available online: http://moud.gov.in/cms/schemes-or-programmes.php (accessed on 1 February 2017).
© 2017 by the authors. Licensee MDPI, Basel, Switzerland. This article is an open access article distributed under the terms and conditions of the Creative Commons Attribution (CC BY) license (http://creativecommons.org/licenses/by/4.0/).