Greenhouse Gas Implications of Peri-Urban Land Use Change in a Developed City under Four Future Climate Scenarios
Abstract
:1. Introduction
2. Materials and Methods
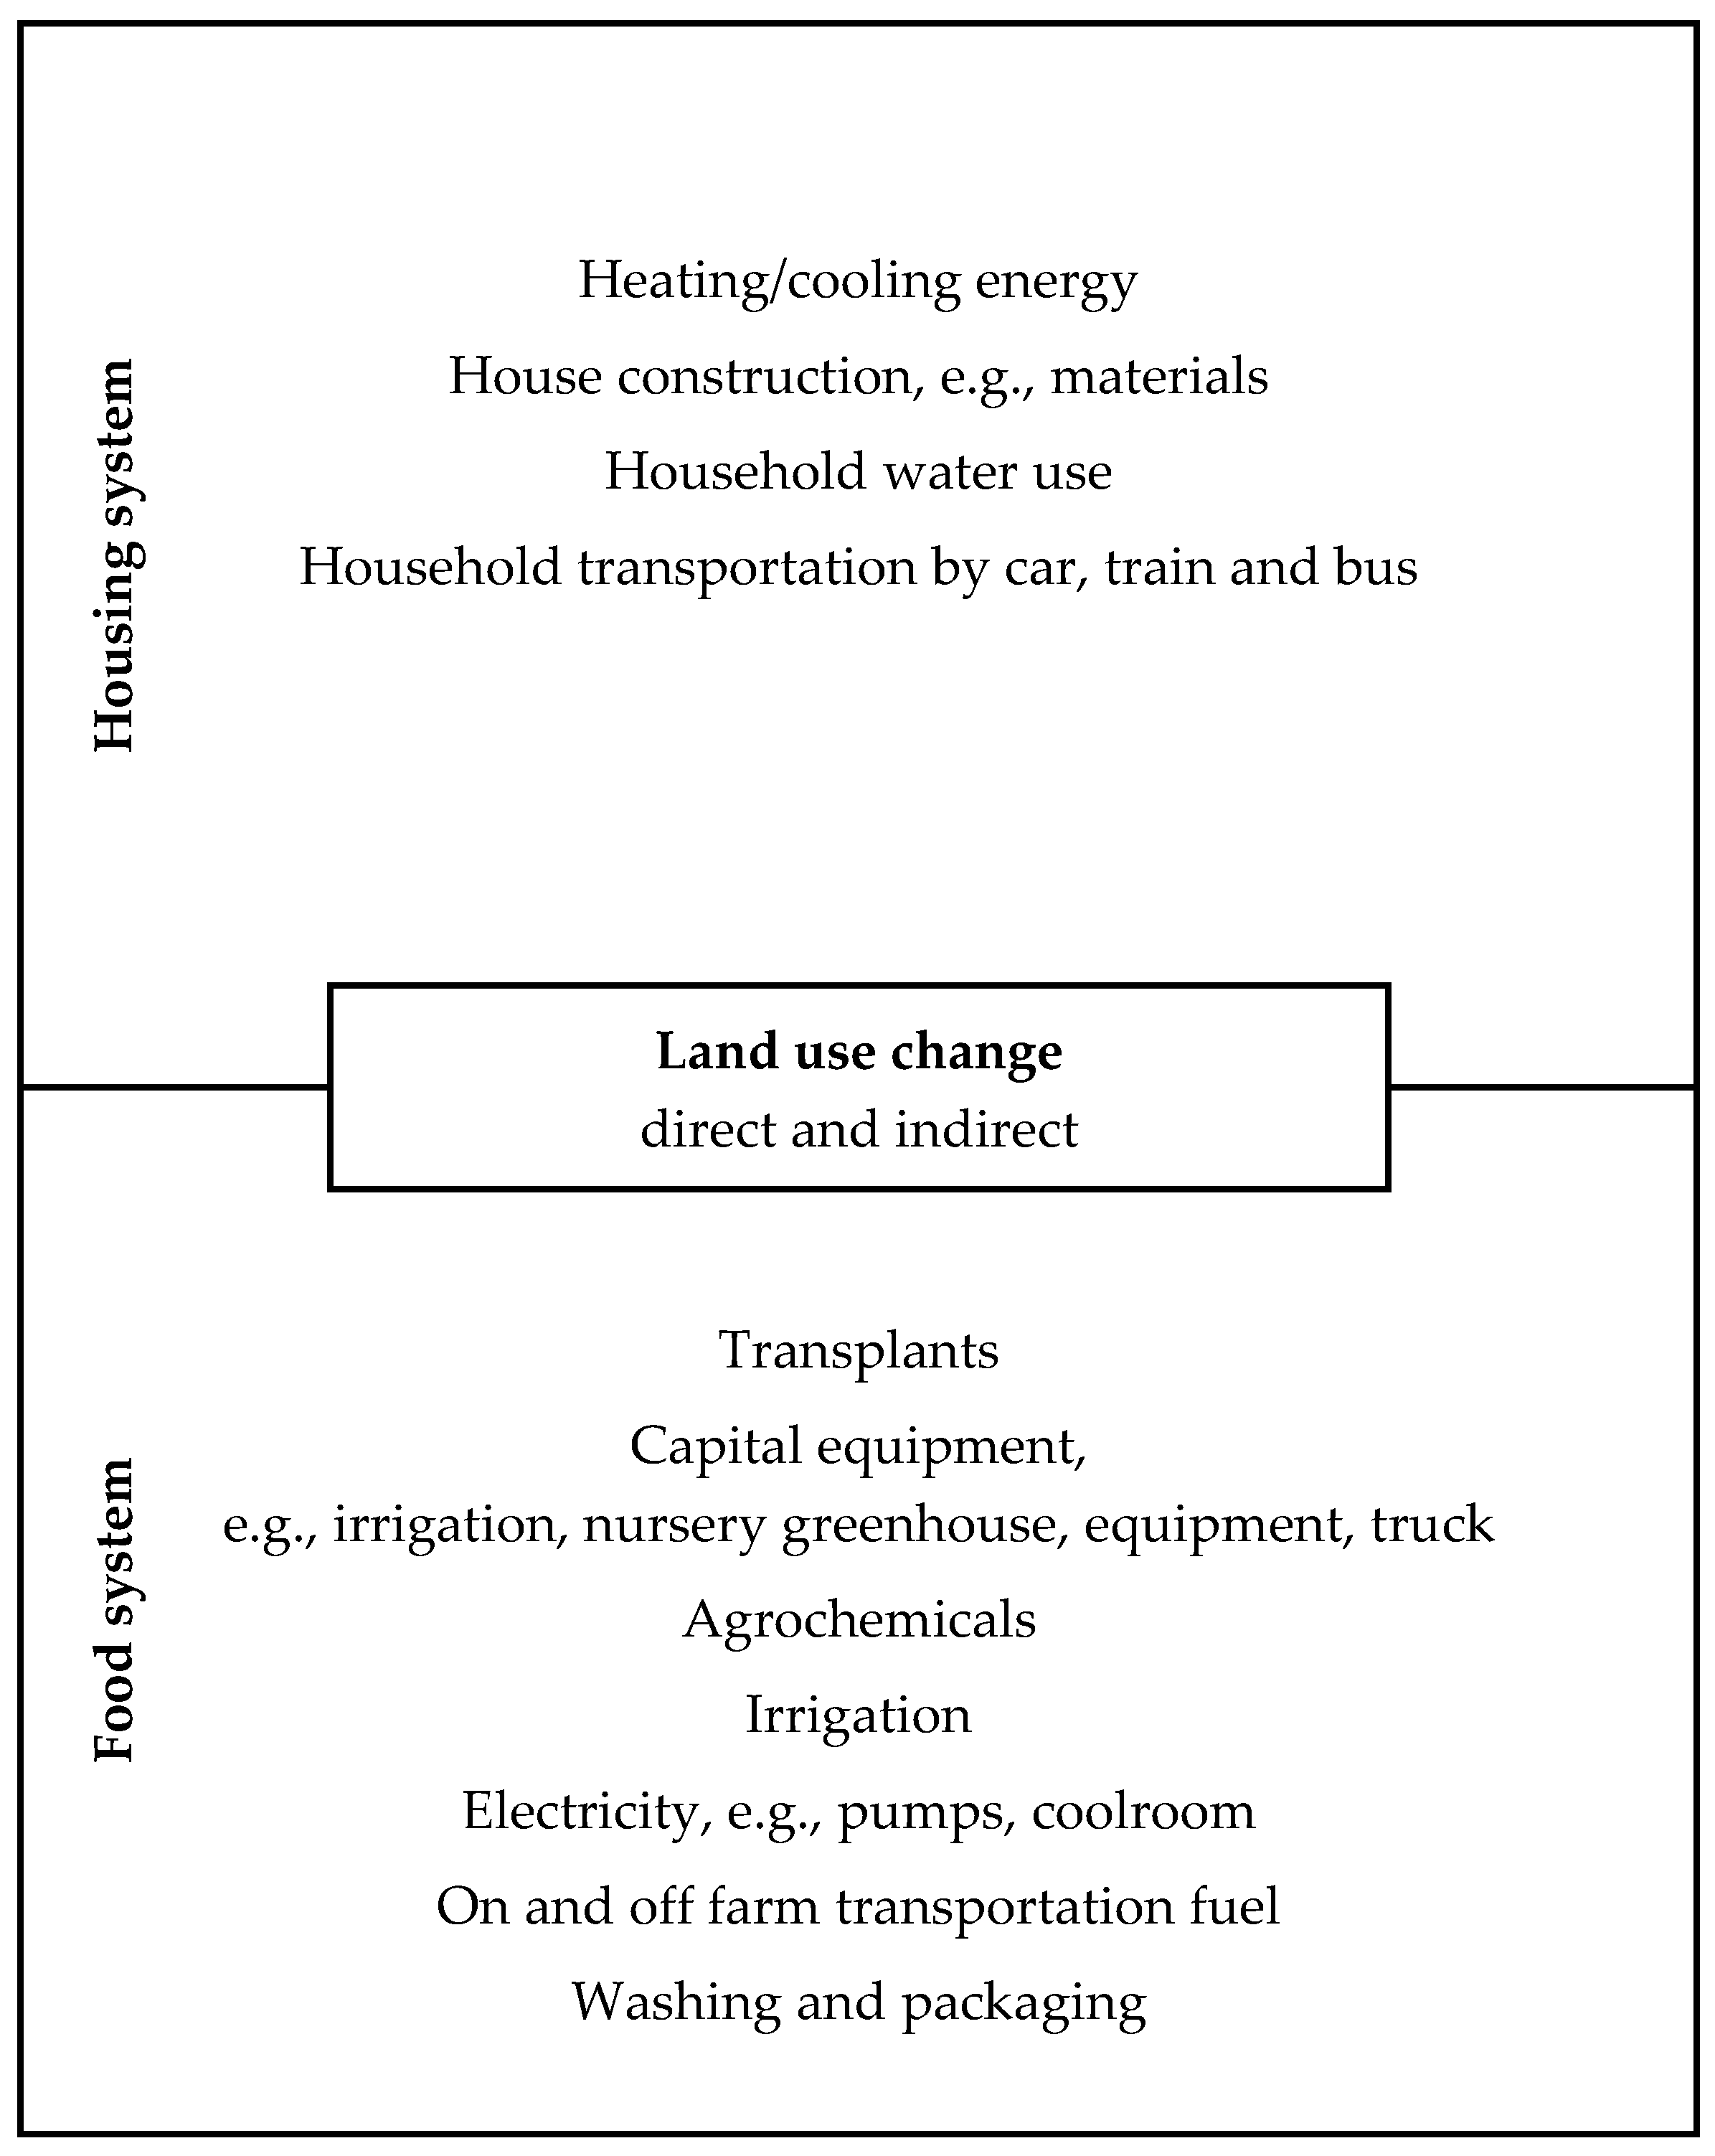
2.1. Scope
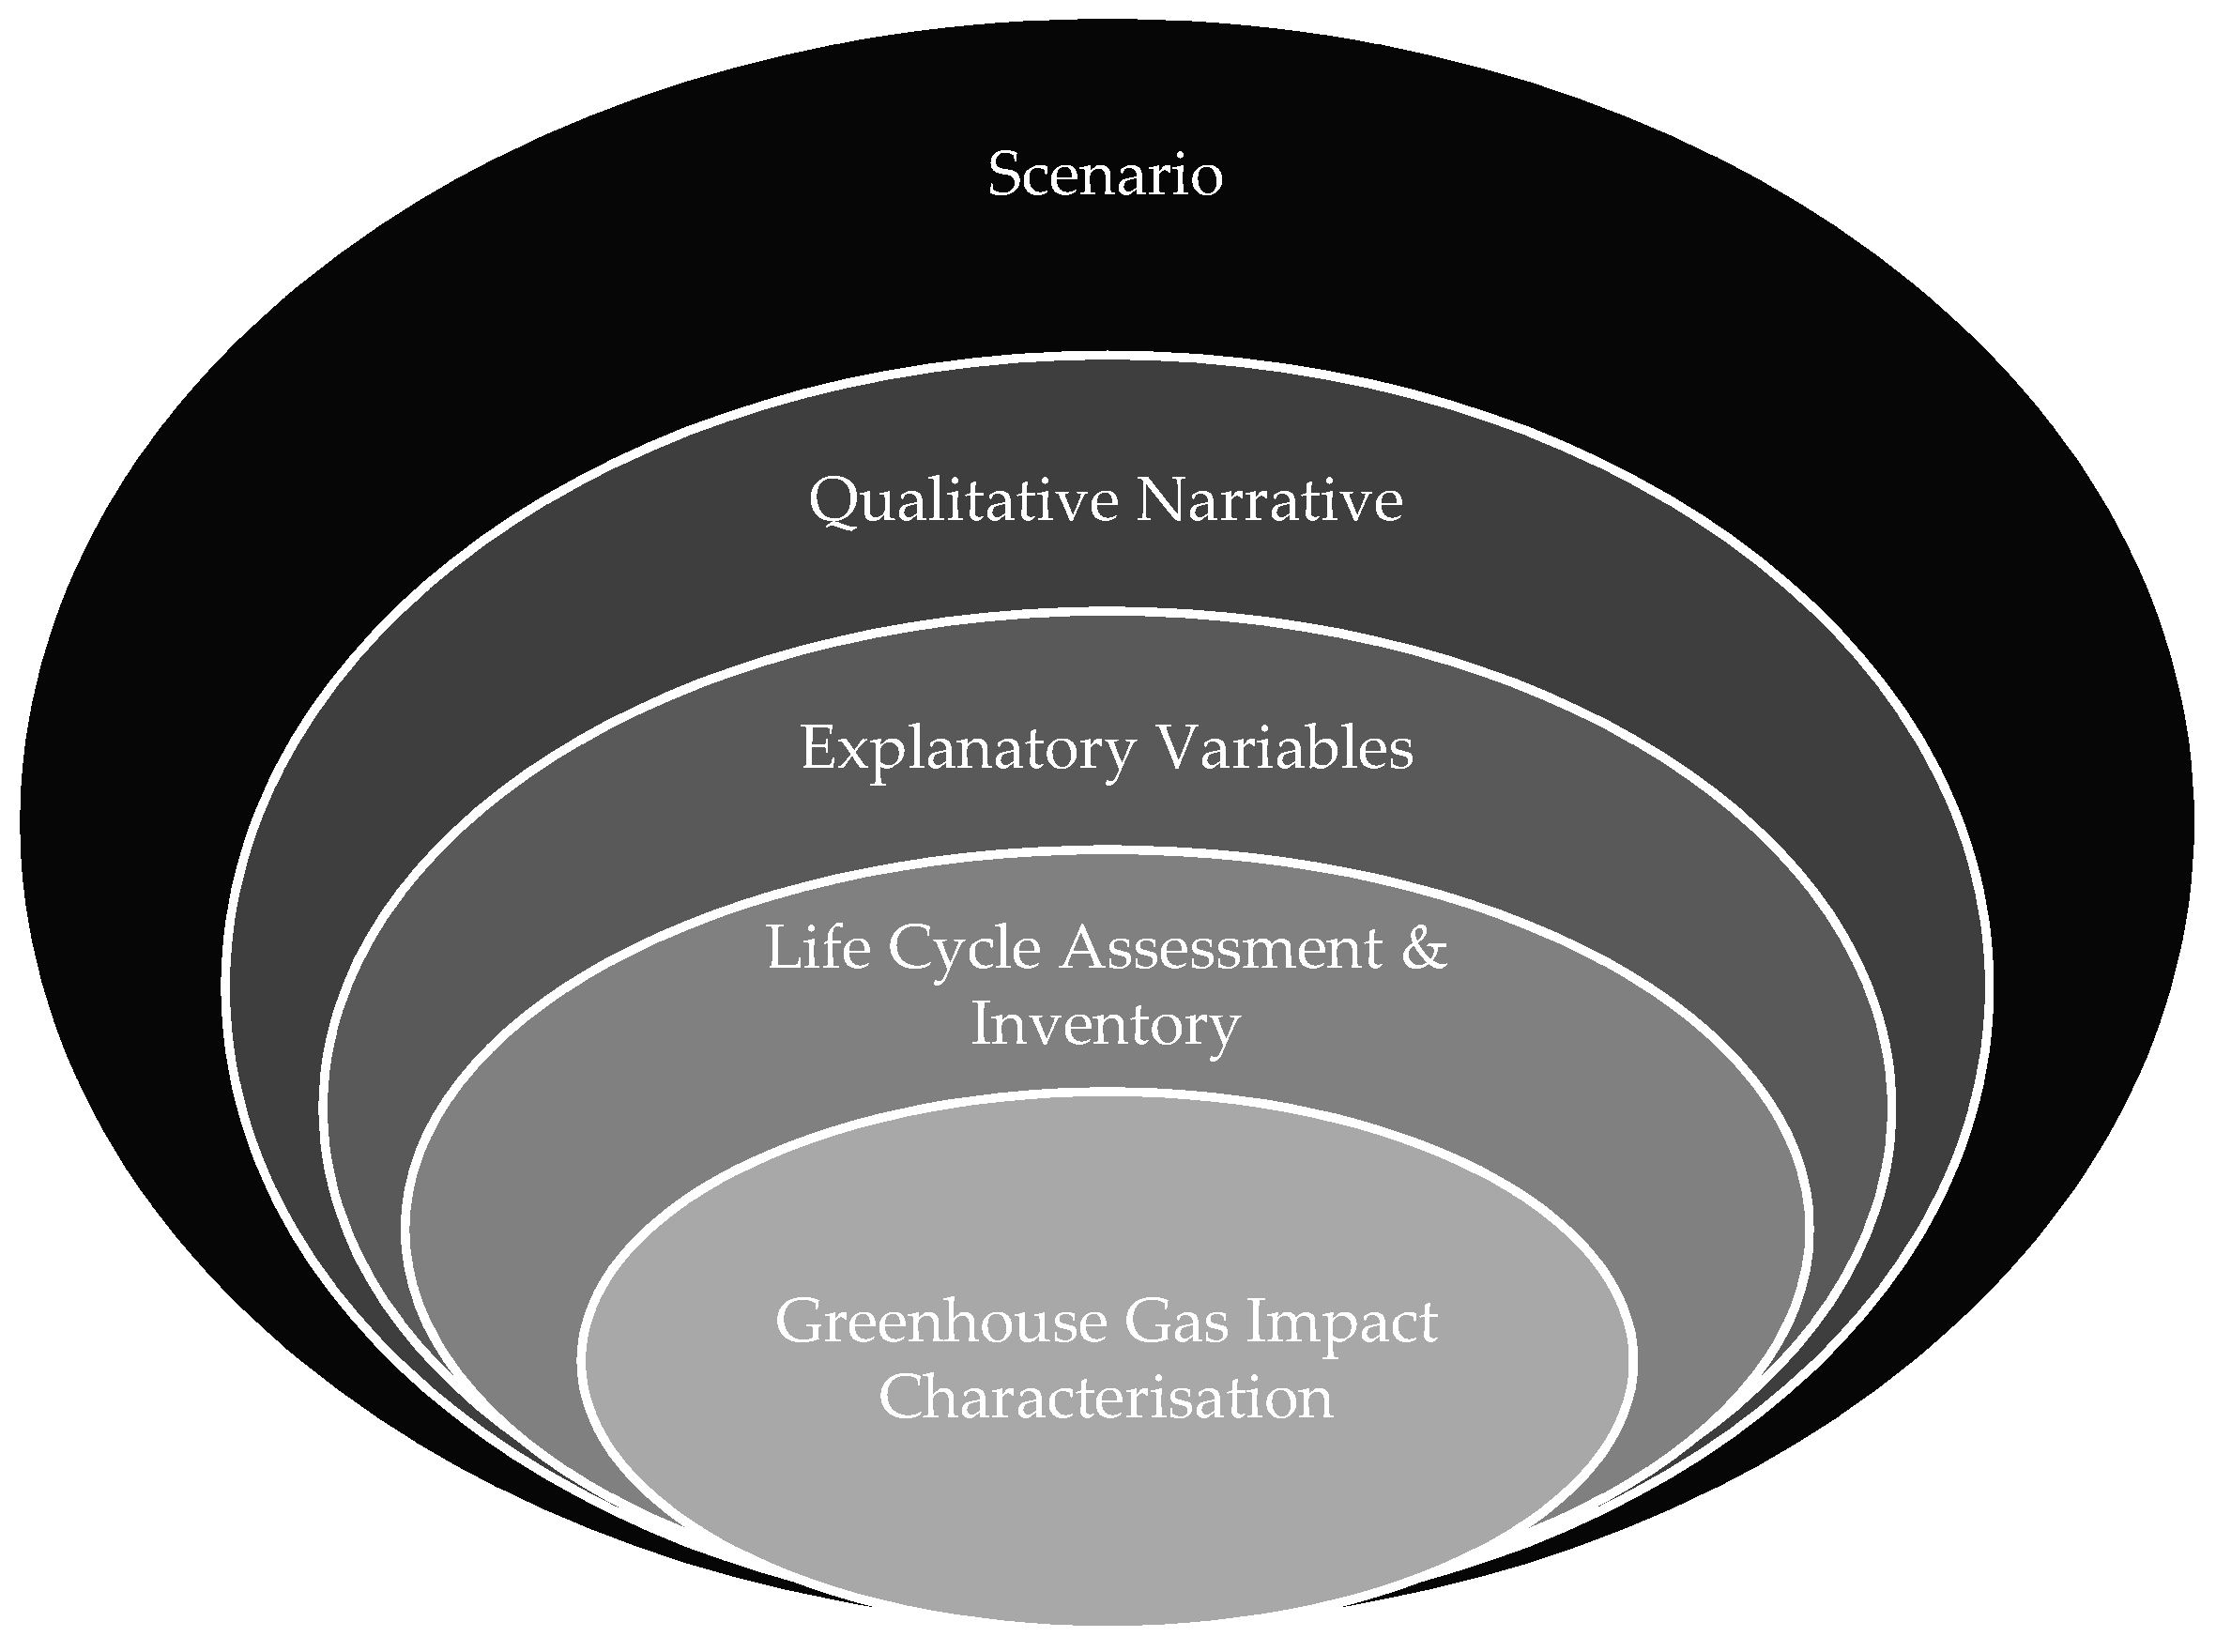
2.2. Methodological Approach
2.3. PU Development Narratives
2.4. Explanatory Variables
2.5. Life Cycle Assessment and Inventory
2.6. Environmental Impact Characterisation
2.7. Sensitivity
2.7.1. Tmax
2.7.2. Indirect Land-Use Change
3. Results
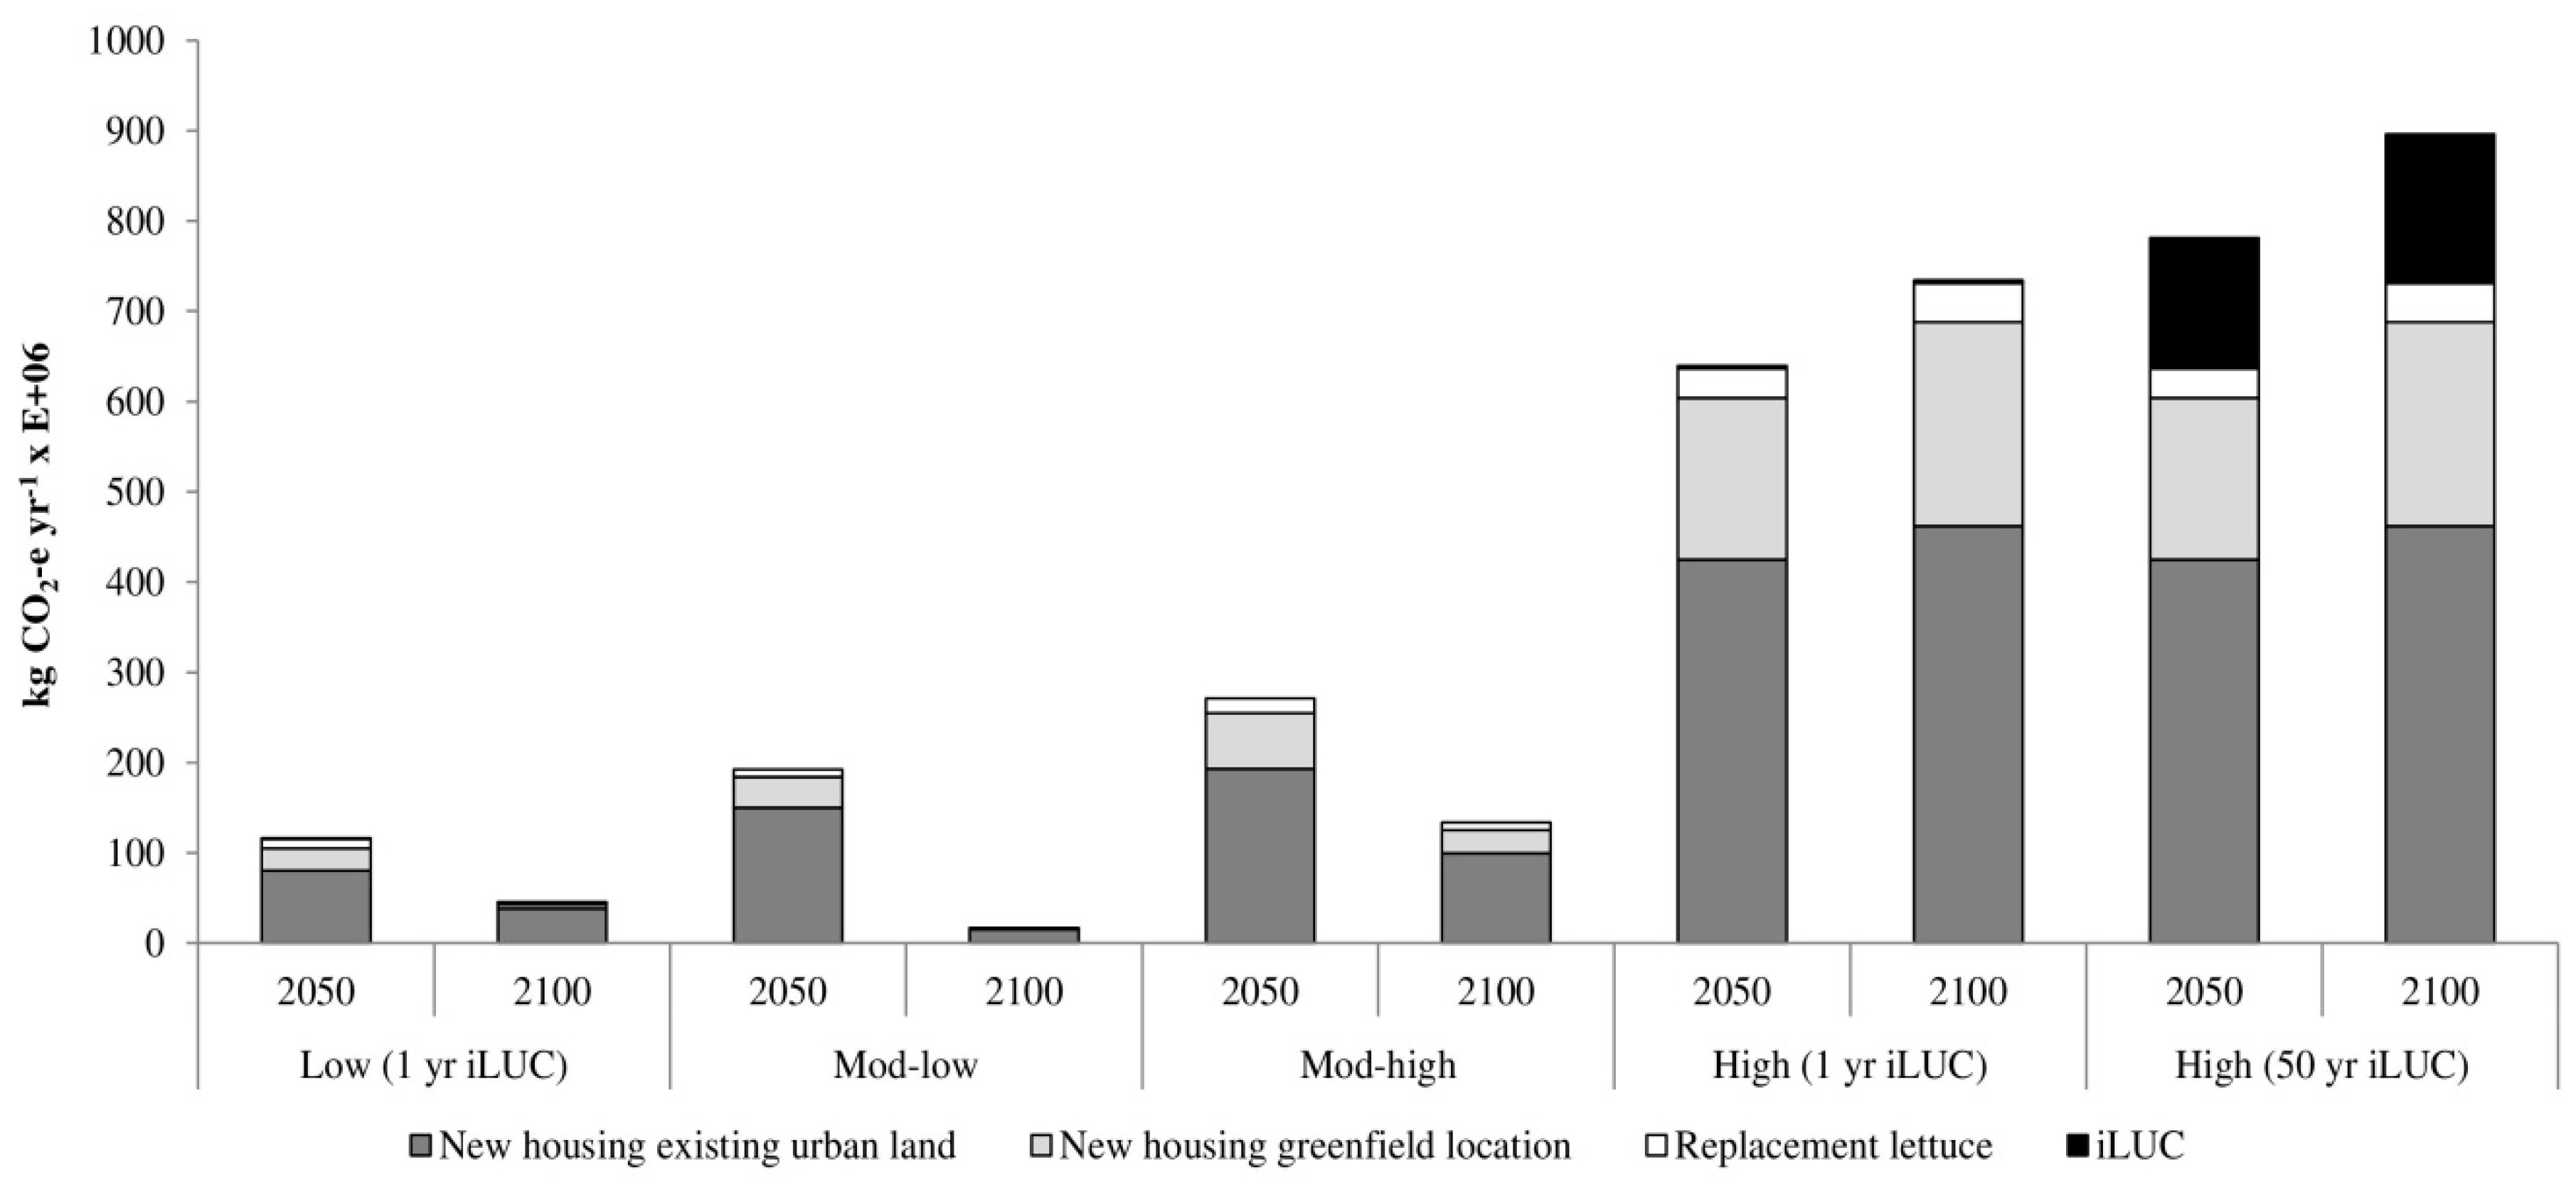
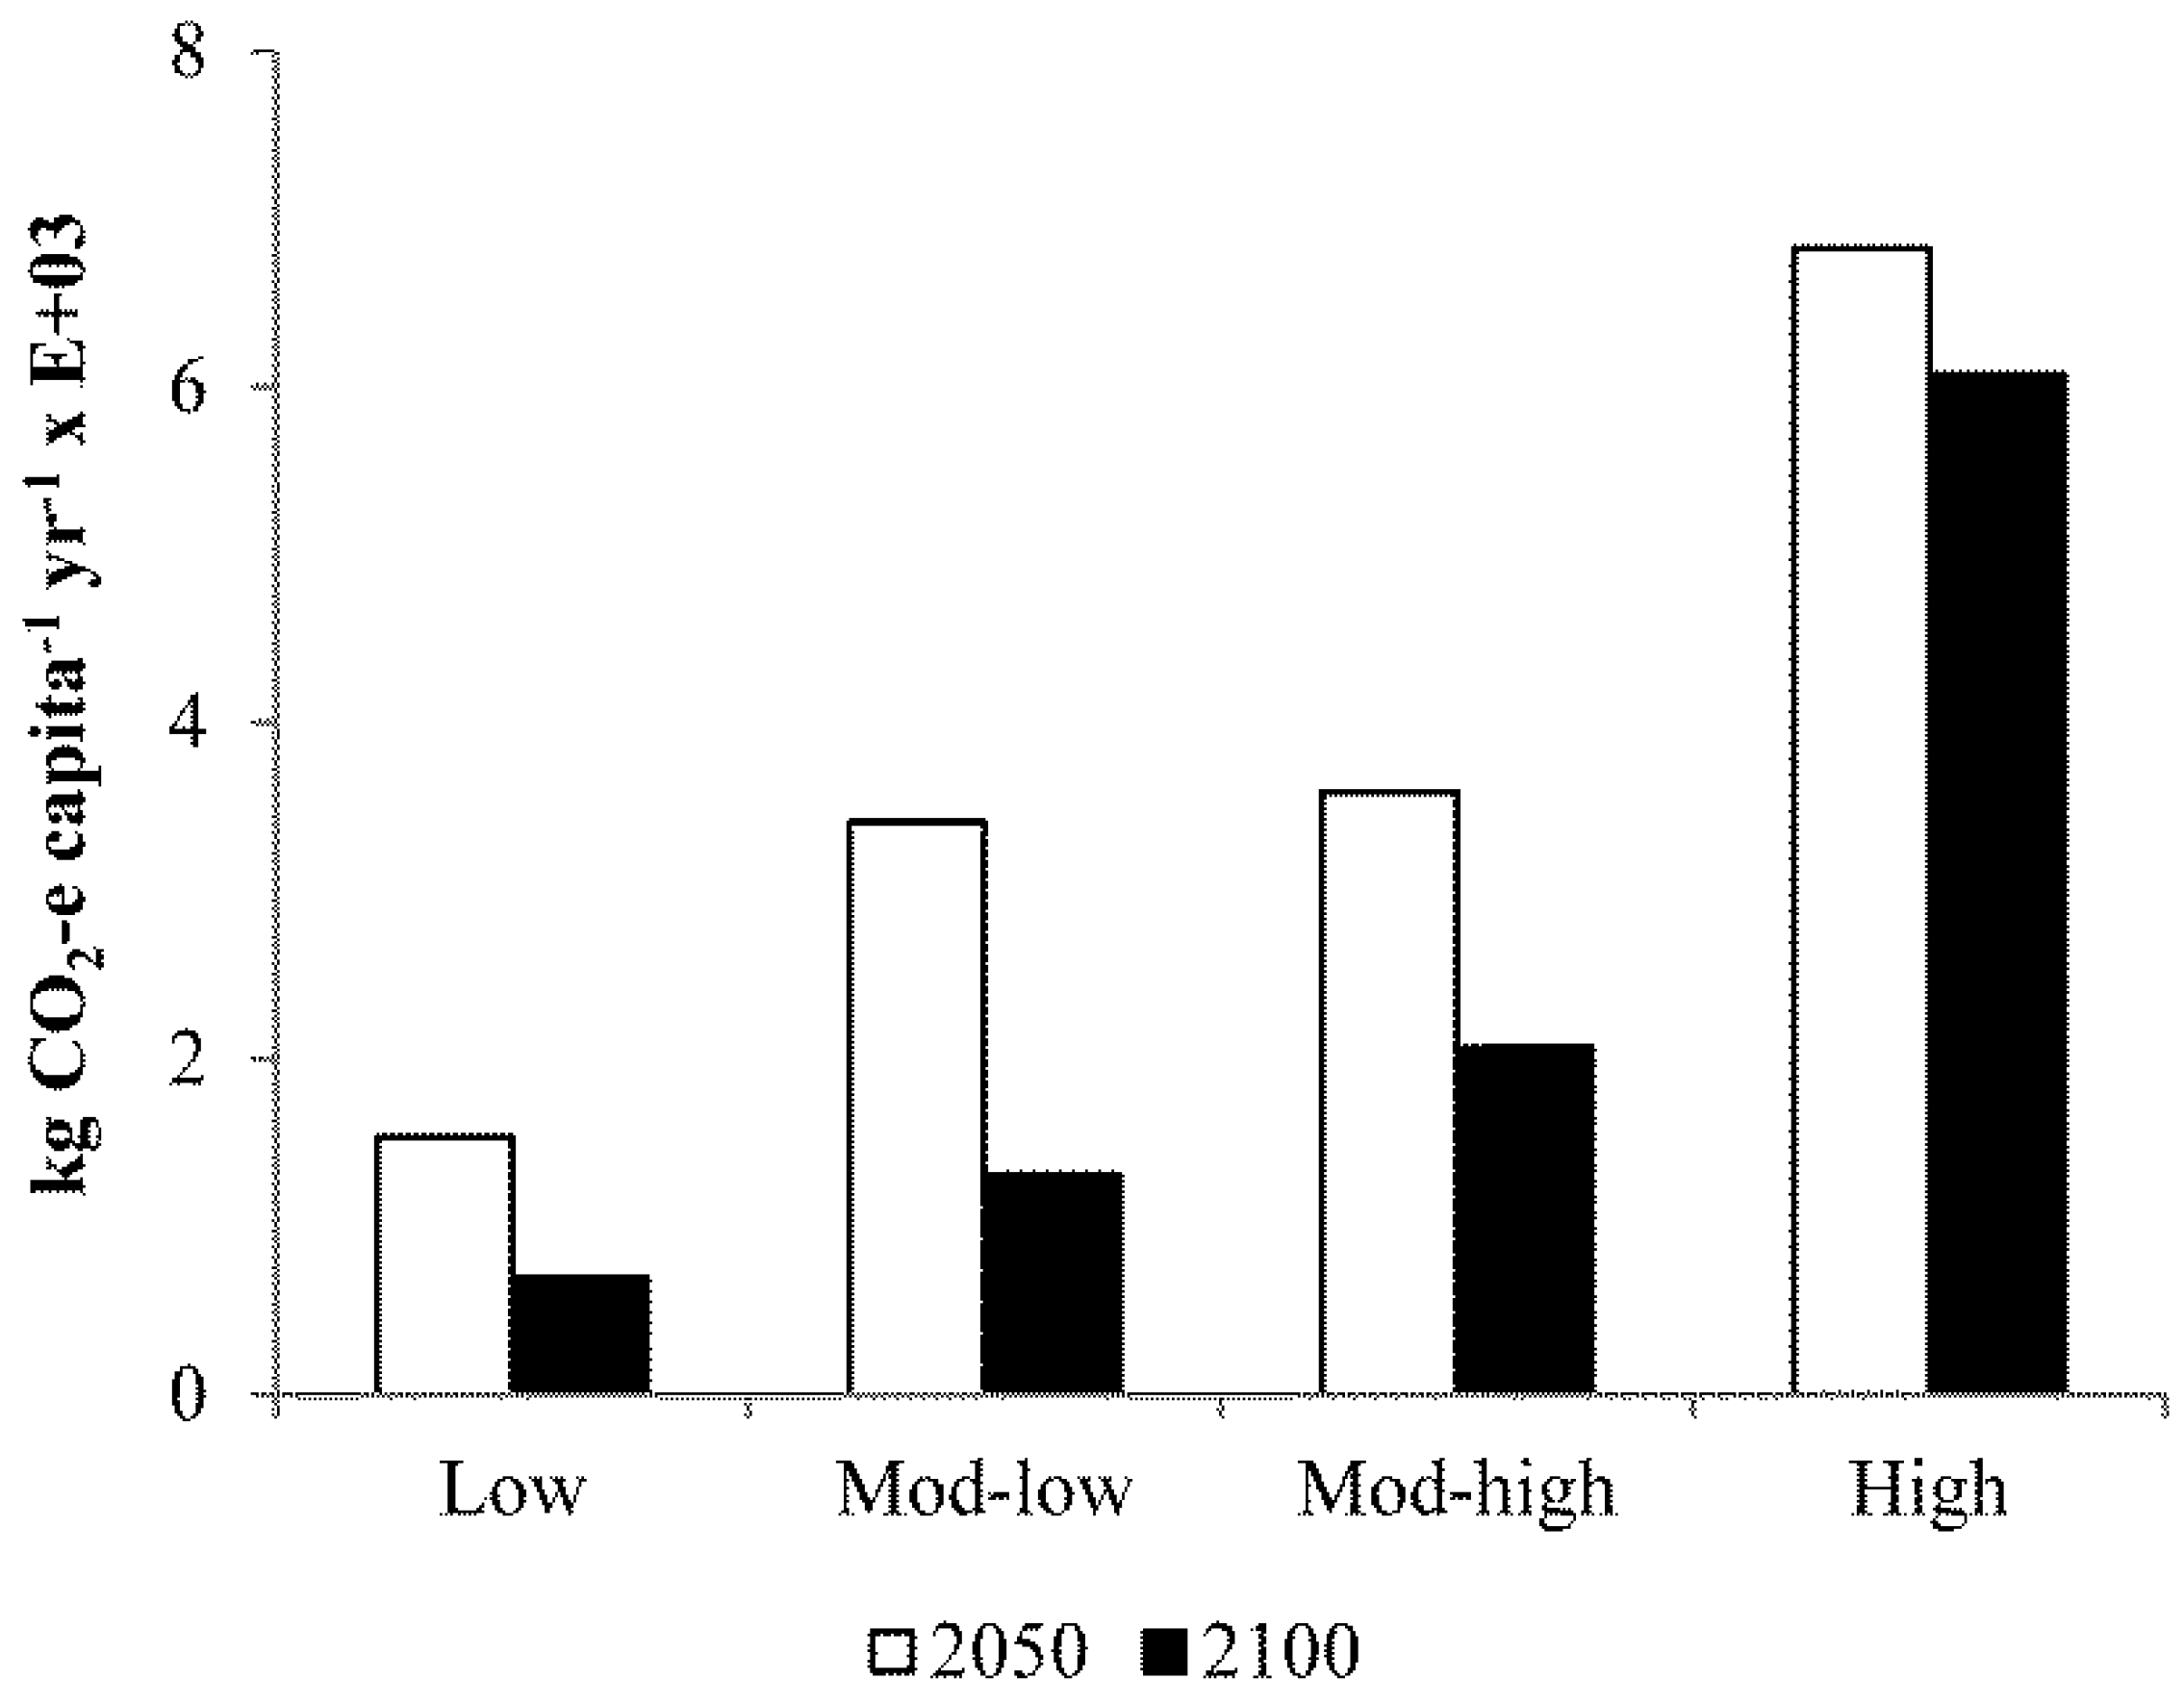
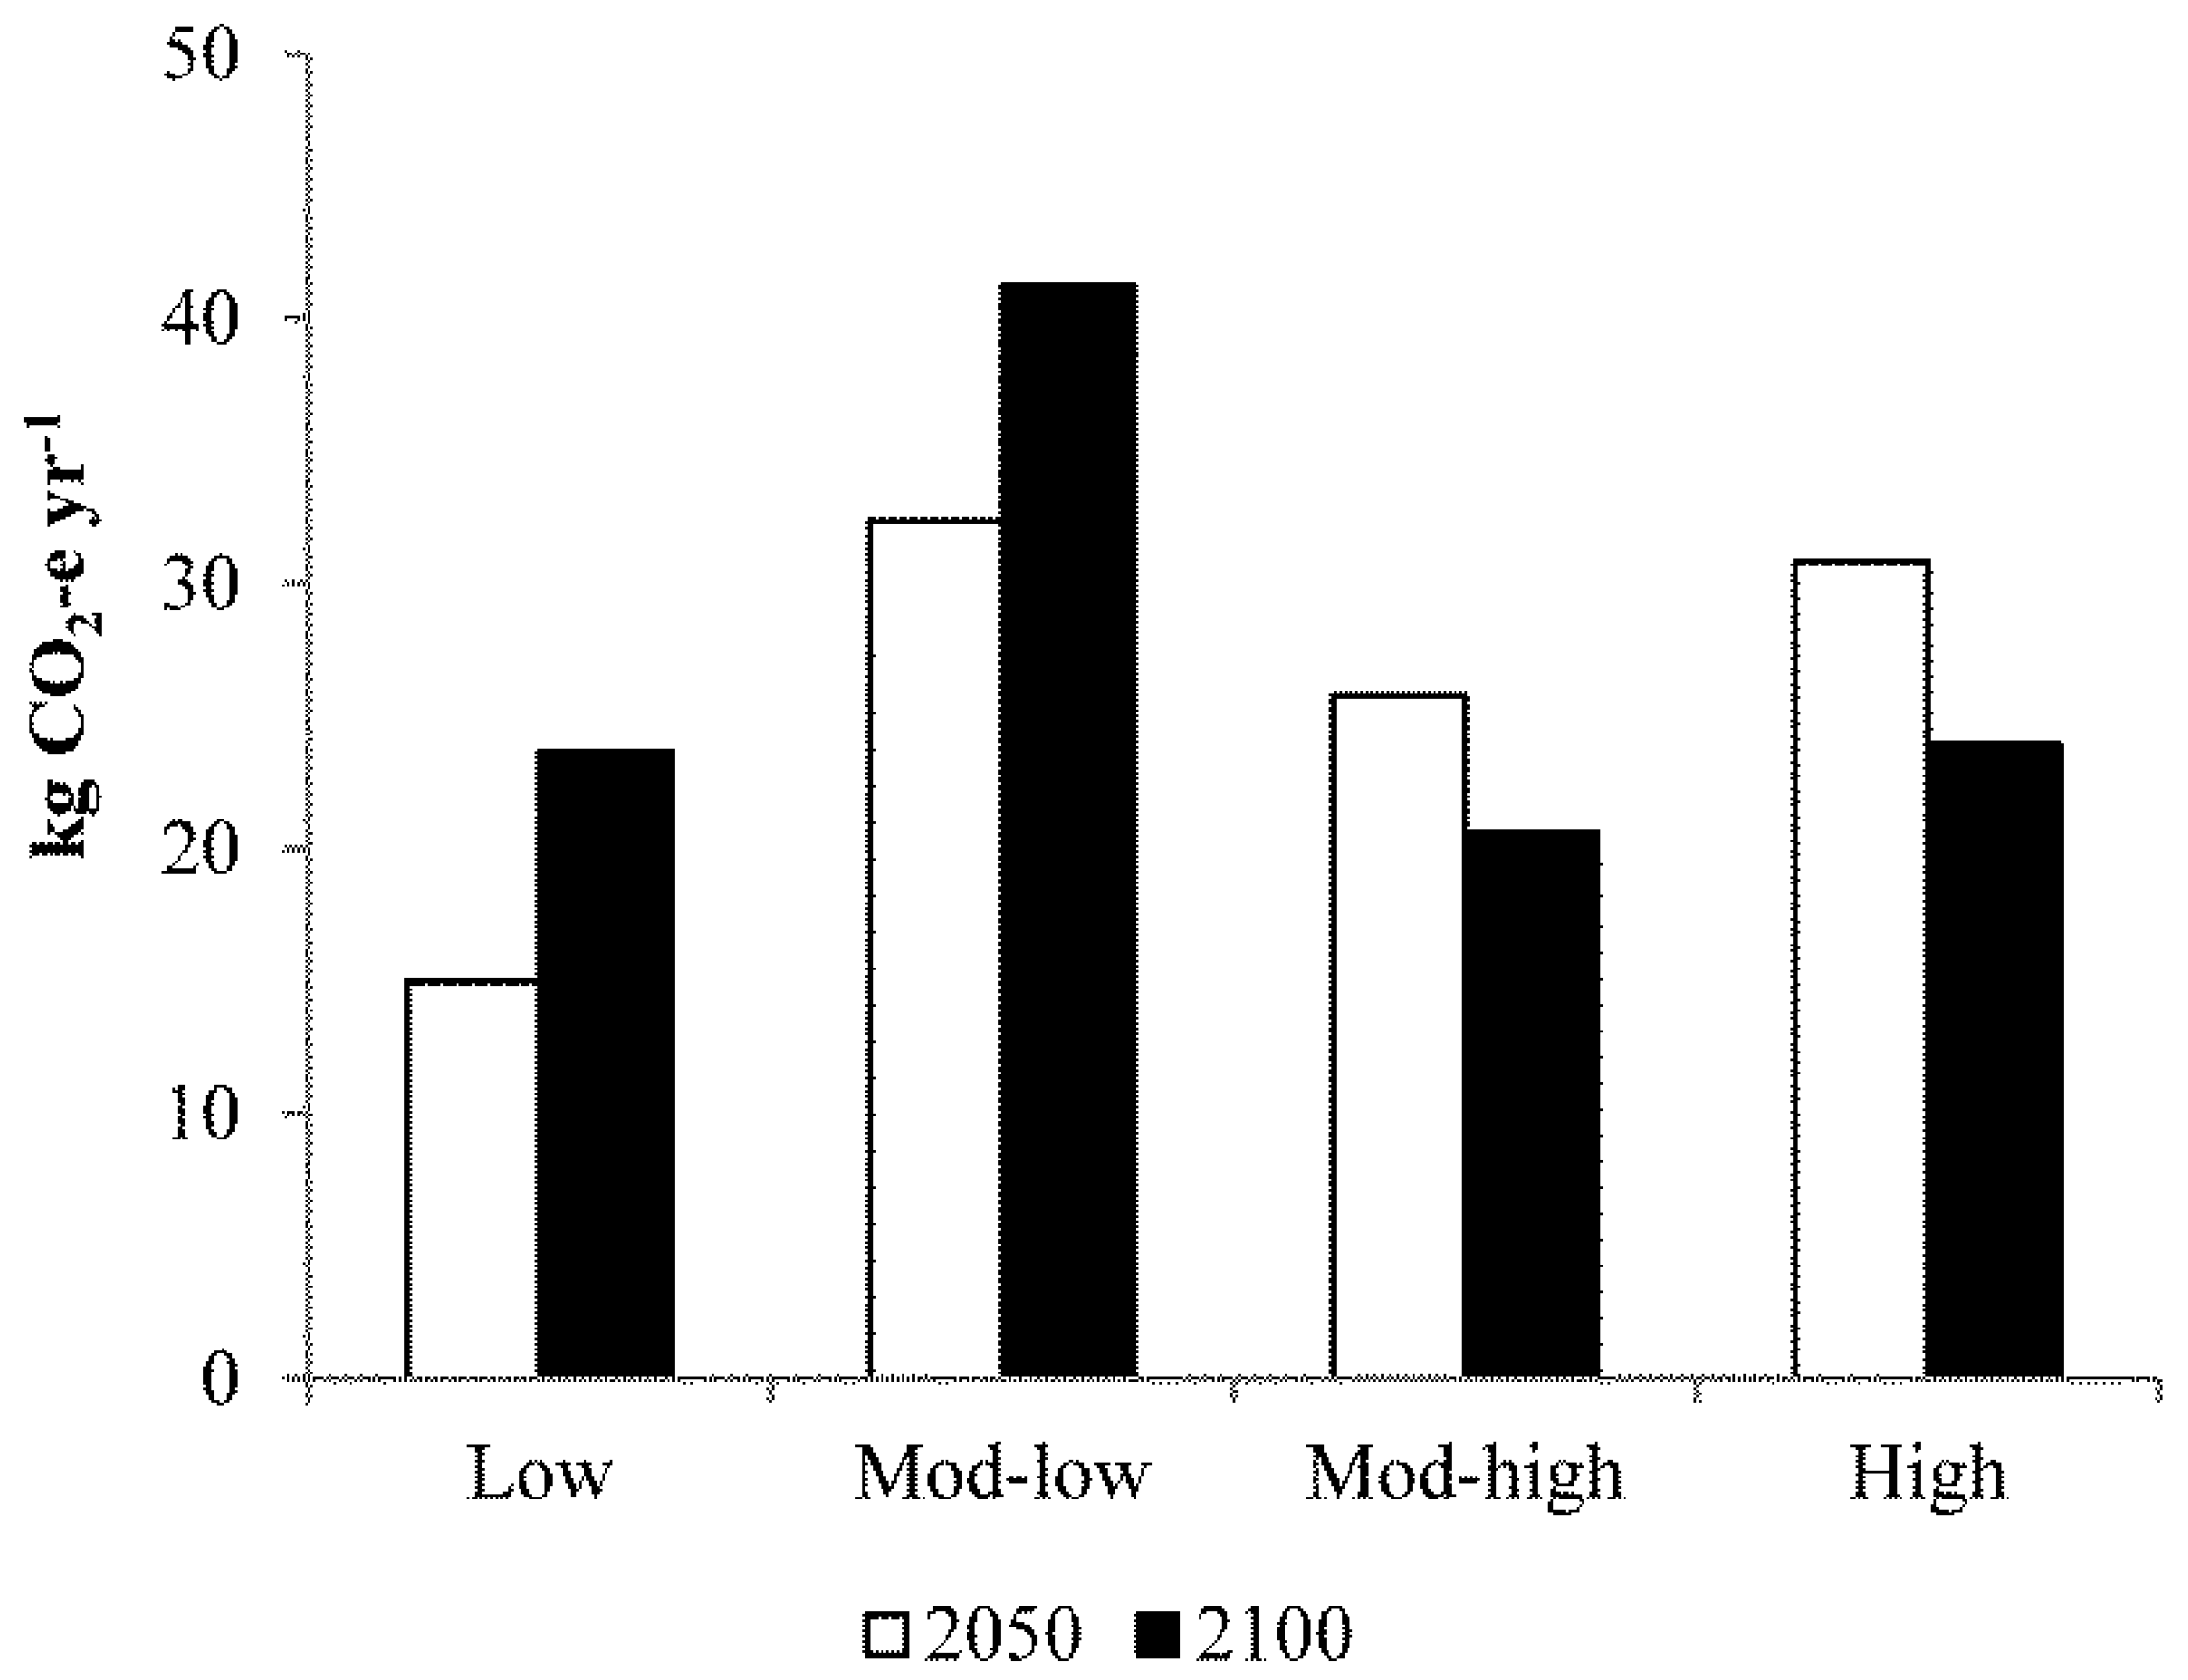
3.1. GHG Emissions
3.2. Sensitivity Testing
3.2.1. Tmax Effects
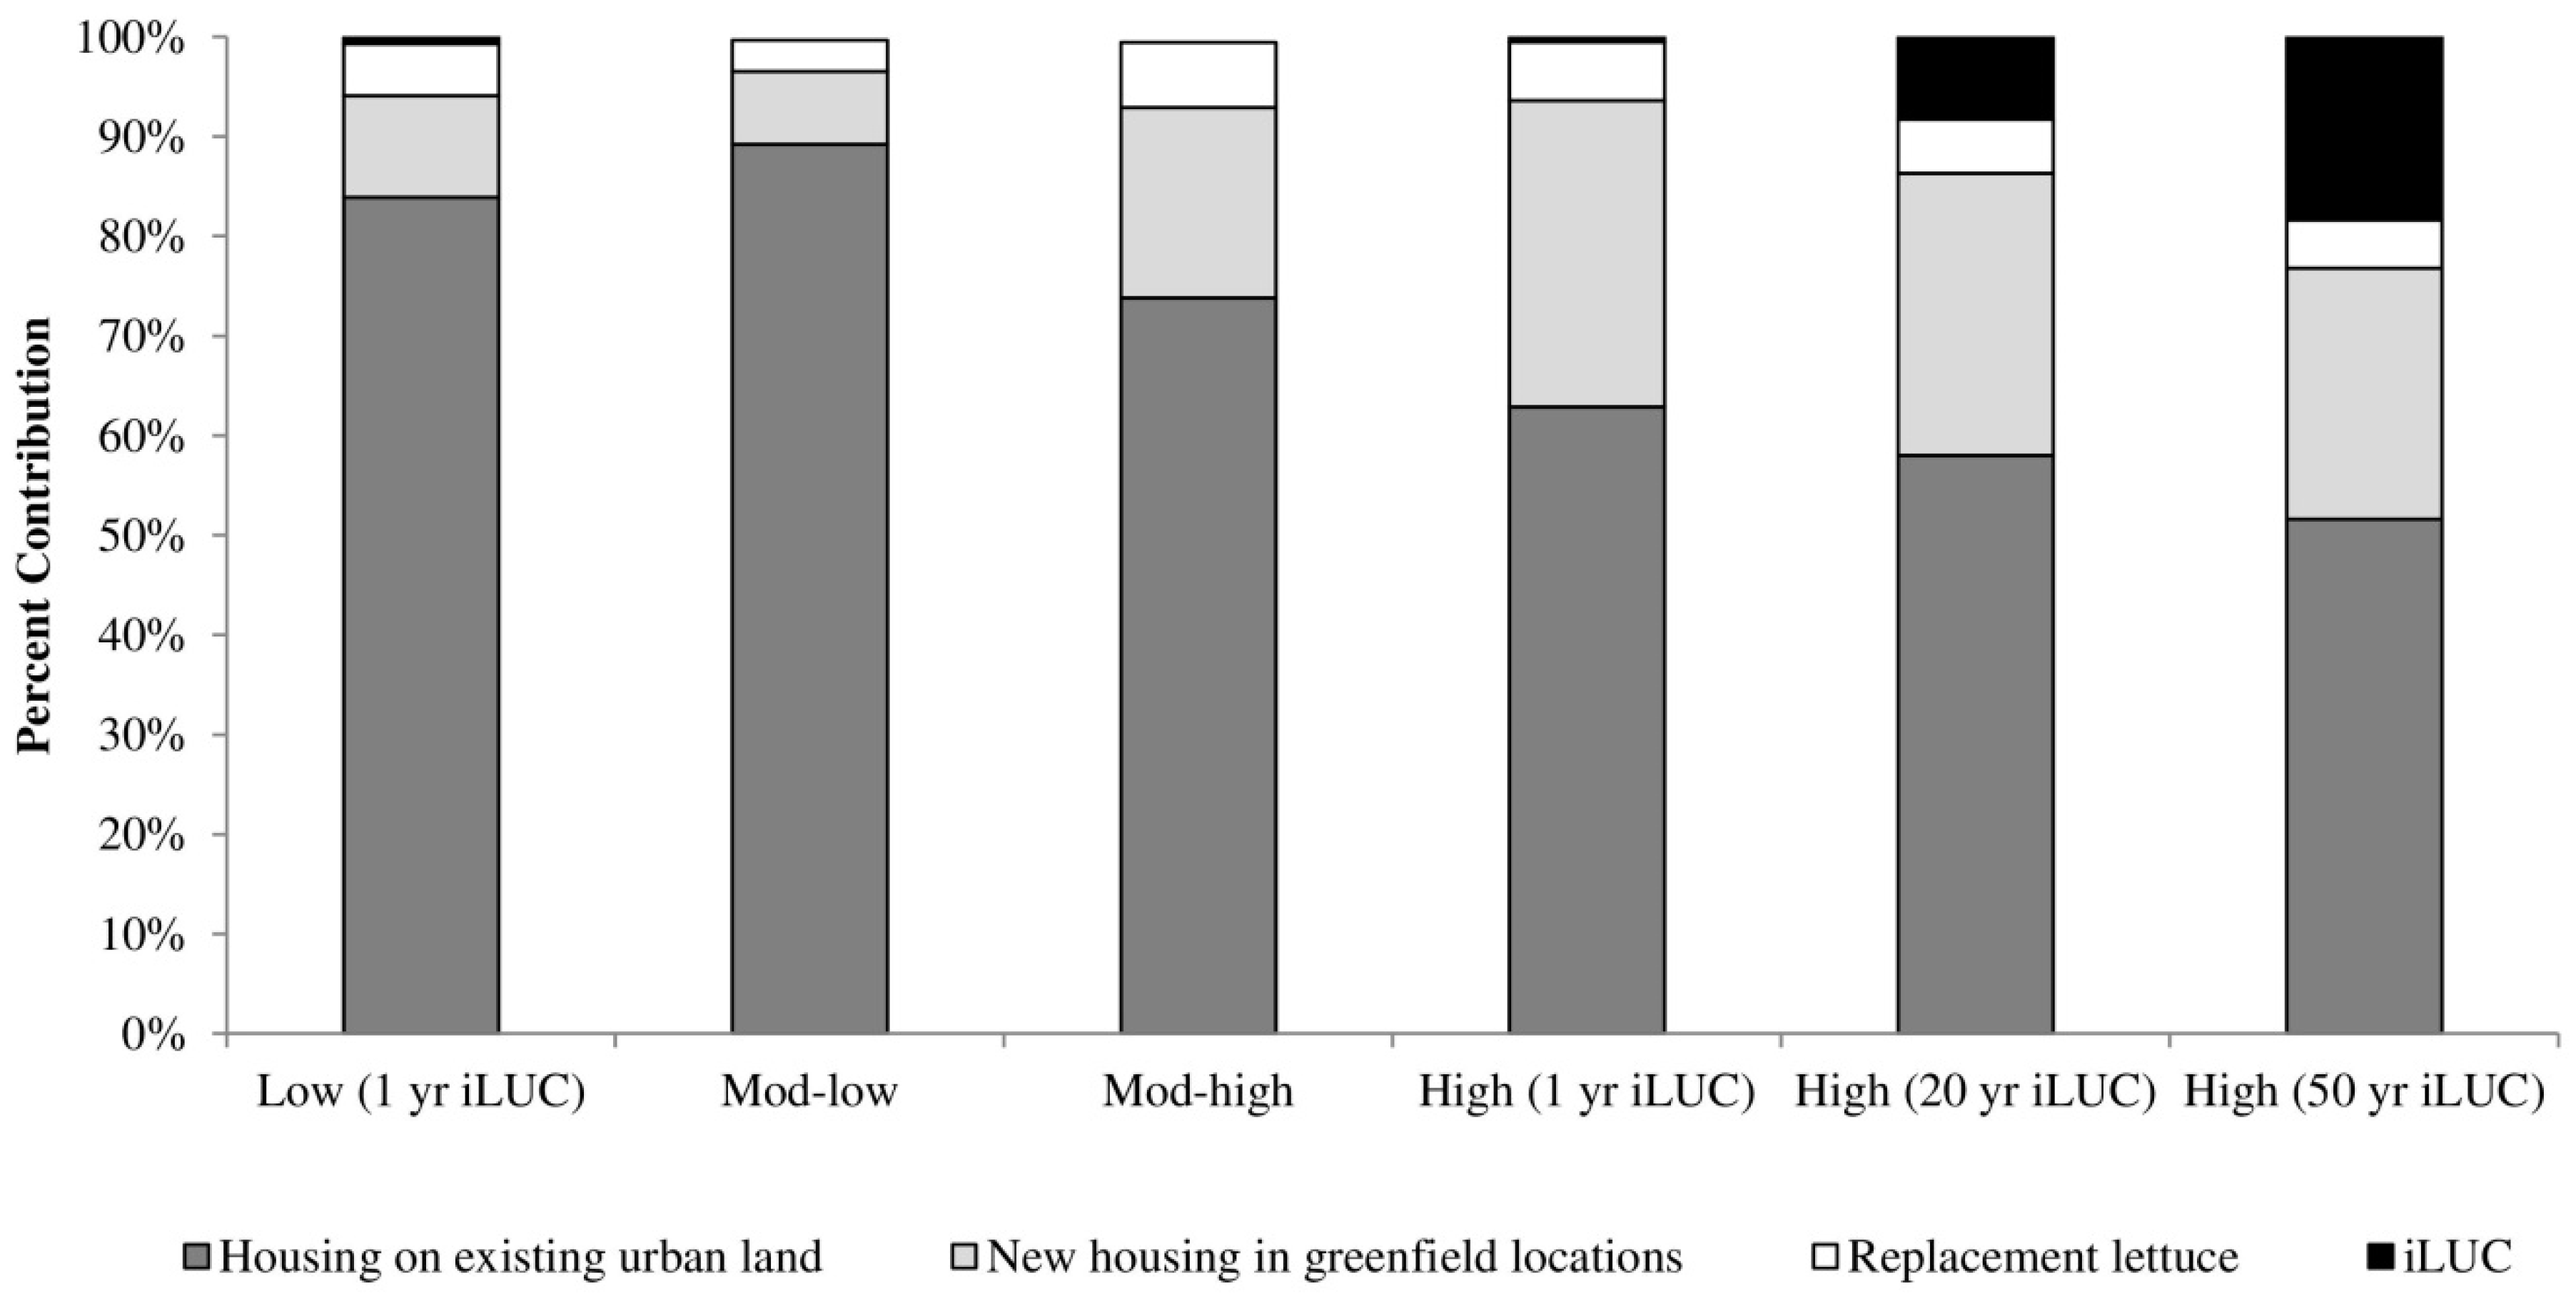
3.2.2. Indirect LUC
4. Discussion
5. Limitations
5.1. Lettuce
5.2. Transport
5.3. Energy
6. Conclusions
Acknowledgments
Author Contributions
Conflicts of Interest
Abbreviations
| AEEI | Autonomous energy efficiency improvement |
| BF | Biofuel |
| CCS | Carbon capture and storage |
| CMIP5 | Coupled Model Intercomparison Project Phase 5 |
| CO2 | Carbon dioxide |
| CTL | Coal to liquid |
| dLUC | Direct land use change |
| E | Electric |
| FCV | Fuel cell vehicle |
| GF | Greenfield |
| GHG | greenhouse gas |
| GTL | Gas to liquid |
| H2 | Hydrogen |
| HE | Hybrid electric |
| ICE | Internal combustion engine |
| IF | Infill |
| iLUC | Indirect land use change |
| IPCC | Intergovernmental Panel on Climate Change |
| LCA | Life cycle assessment |
| LCI | Life cycle inventory |
| LUC | Land use change |
| LULUCF | Land use, land use change and forestry |
| MDPI | Multidisciplinary Digital Publishing Institute |
| N2O | Dinitrogen monoxide |
| NG | Natural gas |
| PU | Peri-urban |
| RCP | Relative Concentration Pathway |
| SOC | Soil organic carbon |
| TFP | Total Factor Productivity |
| USA | United States of America |
References
- Seto, K.; Dhakal, S.; Bigio, A.; Blanco, H.; Delgado, G.; Dewar, D.; Huang, L.; Inaba, A.; Kansal, A.; Lwasa, S.; et al. Human settlements, infrastructure, and spatial planning. In Climate Change 2014: Mitigation of Climate Change. Contribution of Working Group III to the Fifth Assessment Report of the Intergovernmental Panel on Climate Change; Edenhofer, O., Pichs-Madruga, R., Sokona, Y., Farahani, E., Kadner, S., Seyboth, K., Adler, A., Baum, I., Brunner, S., Eickemeier, P., et al., Eds.; Cambridge University Press: Cambridge, UK, 2014; pp. 923–1000. [Google Scholar]
- United Nations Human Settlements Programme. Cities and Climate Change: Global Report on Human Settlements 2011; Earthscan Ltd.: London, UK, 2011. [Google Scholar]
- Barredo, J.I.; Gómez, M. Towards a set of IPCC SRES urban land use scenarios: Modelling urban land use in the Madrid region. In Modelling Environmental Dynamics; Paegelow, M., Olmedo, M., Eds.; Springer: Berlin/Heidelberg, Germany, 2008; pp. 363–385. [Google Scholar]
- Bierwagen, B.G.; Theobald, D.M.; Pyke, C.R.; Choate, A.; Groth, P.; Thomas, J.V.; Morefield, P. National housing and impervious surface scenarios for integrated climate impact assessments. Proc. Natl. Acad. Sci. USA 2010, 107, 20887–20892. [Google Scholar] [CrossRef] [PubMed]
- Reginster, I.; Rounsevell, M. Scenarios of future urban land use in Europe. Environ. Plan. B 2006, 33, 619–636. [Google Scholar] [CrossRef]
- Solecki, W.D.; Oliveri, C. Downscaling climate change scenarios in an urban land use change model. J. Environ. Manag. 2004, 72, 105–115. [Google Scholar] [CrossRef] [PubMed]
- Viguié, V.; Hallegatte, S.; Rozenberg, J. Downscaling long term socio-economic scenarios at city scale: A case study on Paris. Technol. Forecast. Soc. 2014, 87, 305–324. [Google Scholar] [CrossRef]
- Wheeler, S.M.; Tomuta, M.; Haden, V.R.; Jackson, L.E. The impacts of alternative patterns of urbanization on greenhouse gas emissions in an agricultural county. J. Urban. 2013, 6, 213–235. [Google Scholar] [CrossRef]
- Haight, D.; Ten Eyck, L.; Arjomand, S. Cultivate New York: An Agenda to Protect Farmland for Growing Food and the Economy; American Farmland Trust: New York, NY, USA, 2016; Available online: https://www.farmland.org/publications (accessed on 19 November 2016).
- Australian Bureau of Statistics. 7503.0 - Value of Agricultural Commodities Produced, Australia, 2012-13, ’Table 2: Value of Agricultural Commodities Produced, State and NRM Region–New South Wales–2012–13’, data cube: Excel spreadsheet, cat. no. 75030DO002_201213; Australian Bureau of Statistics (ABS): Canberra, ACT, Australia, 2014.
- Thompson, E.; Harper, A.M.; Kraus, S. Think Globally—Eat Locally: San Francisco Foodshed Assessment; American Farmland Trust: Washington, DC, USA, 2008. [Google Scholar]
- Shaffer, S.; Thompson, E. A New Comparison of Greenhouse Gas Emissions from California Agricultural and Urban Land Uses; American Farmland Trust: Davis, CA, USA, 2015. [Google Scholar]
- Van Vuuren, D.; Edmonds, J.; Kainuma, M.; Riahi, K.; Thomson, A.; Hibbard, K.; Hurtt, G.; Kram, T.; Krey, V.; Lamarque, J.-F.; et al. The representative concentration pathways: An overview. Clim. Chang. 2011, 109, 5–31. [Google Scholar] [CrossRef]
- IPCC Data Distribution Centre. Scenario Process for AR5 Representative Concentration Pathways (RCPs). Available online: http://sedac.ciesin.columbia.edu/ddc/ar5_scenario_process/RCPs.html (accessed on 4 June 2016).
- Rothwell, A.; Ridoutt, B.; Page, G.; Bellotti, W. Feeding and housing the urban population: Environmental impacts at the peri-urban interface under different land-use scenarios. Land Use Policy 2015, 48, 377–388. [Google Scholar] [CrossRef]
- Nakicenovic, N.; Alcamo, J.; Davis, G.; de Vries, B.; Fenhann, J.; Gaffin, S.; Gregory, K.; Grübler, A.; Jung, T.; Kram, T.; et al. Special Report on Emissions Scenarios: A Special Report of Working Group III of the Intergovernmental Panel on Climate Change; Cambridge University Press: Cambridge, UK, 2000. [Google Scholar]
- Head, B.W. Evidence, uncertainty, and wicked problems in climate change decision making in Australia. Environ. Plan. C 2014, 32, 663–679. [Google Scholar] [CrossRef]
- Wright, G.; Cairns, G. Scenario Thinking: Practical Approaches to the Future; Palgrave Macmillan: Basingstoke, UK, 2011. [Google Scholar]
- Rothwell, A.; Ridoutt, B.; Page, G.; Bellotti, W. Direct and indirect land-use change as prospective climate change indicators for peri-urban development transitions. J. Environ. Plan. Manag. 2015, 59, 643–665. [Google Scholar] [CrossRef]
- Masui, T.; Matsumoto, K.; Hijioka, Y.; Kinoshita, T.; Nozawa, T.; Ishiwatari, S.; Kato, E.; Shukla, P.R.; Yamagata, Y.; Kainuma, M. An emission pathway for stabilization at 6 Wm−2 radiative forcing. Clim. Chang. 2011, 109, 59–76. [Google Scholar] [CrossRef]
- Riahi, K.; Rao, S.; Krey, V.; Cho, C.; Chirkov, V.; Fischer, G.; Kindermann, G.; Nakicenovic, N.; Rafaj, P. RCP 8.5—A scenario of comparatively high greenhouse gas emissions. Clim. Chang. 2011, 109, 33–57. [Google Scholar] [CrossRef]
- Thomson, A.; Calvin, K.; Smith, S.; Kyle, G.P.; Volke, A.; Patel, P.; Delgado-Arias, S.; Bond-Lamberty, B.; Wise, M.; Clarke, L.; et al. RCP4.5: A pathway for stabilization of radiative forcing by 2100. Clim. Chang. 2011, 109, 77–94. [Google Scholar] [CrossRef]
- Van Vuuren, D.; Stehfest, E.; den Elzen, M.J.; Kram, T.; van Vliet, J.; Deetman, S.; Isaac, M.; Klein Goldewijk, K.; Hof, A.; Mendoza Beltran, A.; et al. RCP2.6: Exploring the possibility to keep global mean temperature increase below 2 °C. Clim. Chang. 2011, 109, 95–116. [Google Scholar] [CrossRef]
- Malcolm, P.; Fahd, R. Ground Truthing of Sydney Vegetable Industry in 2008; Department of Primary Industries: Orange, NSW, Australia, 2009.
- Department of Environment. Representative Concentration Pathways (RCPs); Department of Environment: Canberra, ACT, Australia, 2013.
- Van Vuuren, D.P.; Smith, S.J.; Riahi, K. Downscaling socioeconomic and emissions scenarios for global environmental change research: A review. Wiley Interdiscip. Rev. Clim. Chang. 2010, 1, 393–404. [Google Scholar] [CrossRef]
- Meinshausen, M.; Smith, S.J.; Calvin, K.; Daniel, J.S.; Kainuma, M.L.T.; Lamarque, J.F.; Matsumoto, K.; Montzka, S.A.; Raper, S.C.B.; Riahi, K.; et al. The RCP greenhouse gas concentrations and their extensions from 1765 to 2300. Clim. Chang. 2011, 109, 213–241. [Google Scholar] [CrossRef]
- Schweizer, V.; O’Neill, B. Systematic construction of global socioeconomic pathways using internally consistent element combinations. Clim. Chang. 2014, 122, 431–445. [Google Scholar] [CrossRef]
- van Vuuren, D.; Carter, T. Climate and socio-economic scenarios for climate change research and assessment: Reconciling the new with the old. Clim. Chang. 2014, 122, 415–429. [Google Scholar] [CrossRef]
- O’Neill, B.; Kriegler, E.; Riahi, K.; Ebi, K.; Hallegatte, S.; Carter, T.; Mathur, R.; van Vuuren, D. A new scenario framework for climate change research: The concept of shared socioeconomic pathways. Clim. Chang. 2014, 122, 387–400. [Google Scholar] [CrossRef]
- IPCC. Summary for Policymakers. In Climate Change 2014: Mitigation of Climate Change. Contribution of Working Group III to the Fifth Assessment Report of the Intergovernmental Panel on Climate Change; Edenhofer, O., Pichs-Madruga, R., Sokona, Y., Farahani, E., Kadner, S., Seyboth, K., Adler, A., Baum, I., Brunner, S., Eickemeier, P., et al., Eds.; Cambridge University Press: Cambridge, UK, 2014. [Google Scholar]
- Australian Bureau of Statistics. 3222.0 - Population Projections, Australia, 2012 (Base) to 2101. Projection Results — States and Territories. Table 3 Projected Population, Components of Change and Summary Statistics, Greater Sydney. Released 26 November 2013; Australian Bureau of Statistics: Canberra, ACT, Australia, 2013.
- Clarke, J.; Whetton, P.; Hennessy, K. Providing application-specific climate projections datasets: CSIRO’s Climate Futures Framework. In Proceedings of 19th International Congress on Modelling and Simulation, Perth, WA, Australia, 12–16 December 2011; Available online: http://mssanz.org.au/modsim2011 (accessed on 4 June 2016).
- Bureau of Meteorology. Climate Data Online; Bureau of Meteorology: Melbourne, VIC, Australia, 2014. Available online: http://www.bom.gov.au/climate/data/ (accessed on 15 December 2014).
- Dlugokencky, E.; Tans, P. ESRL Global Monitoring Division—Global Greenhouse Gas Reference Network. Trends in Atmospheric Carbon Dioxide, Global - Globally Averaged Marine Surface Annual Mean Data; National Oceanic and Atmospheric Administration (NOAA)/Earth System Research Laboratory (ESRL): Boulder, CO, USA, 2014. Available online: www.esrl.noaa.gov/gmd/ccgg/trends/ (accessed on 4 June 2016).
- Nakicenovic, N.; Alcamo, J.; Davis, G.; de Vries, B.; Fenhann, J.; Gaffin, S.; Gregory, K.; Grübler, A.; Jung, T.; Kram, T.; et al. Appendix VII: Data tables in excel-format. In Special Report on Emissions Scenarios: A Special Report of Working Group III of the Intergovernmental Panel on Climate Change; Cambridge University Press: Cambridge, UK, 2000. [Google Scholar]
- Department of Planning. Metropolitan Plan for Sydney 2036; NSW Department of Planning: Sydney, NSW, Australia, 2010.
- Urban Development Institute of Australia. The 2015 UDIA State of the Land Report; Urban Development Institute of Australia (UDIA): Canberra, ACT, Australia, 2015. [Google Scholar]
- Australian Energy Regulator. Energy Made Easy: Understand and Compare Your Electricity Usage. Available online: https://www.energymadeeasy.gov.au/benchmark (accessed on 15 December 2014).
- Wang, X.; Chen, D.; Ren, Z. Assessment of climate change impact on residential building heating and cooling energy requirement in Australia. Build. Environ. 2010, 45, 1663–1682. [Google Scholar] [CrossRef]
- Lobell, D.B.; Gourdji, S.M. The influence of climate change on global crop productivity. Plant Physiol. 2012, 160, 1686–1697. [Google Scholar] [CrossRef] [PubMed]
- Attavanich, W.; McCarl, B.A. The Effect of Climate Change, CO2 Fertilization, and Crop Production Technology on Crop Yields and Its Economic Implications on Market Outcomes and Welfare Distribution. In Proceedings of the 2011 Annual Meeting, Agricultural and Applied Economics Association, Pittsburgh, PA, USA, 24–26 July 2011. No. 103324.
- Rothwell, A.; Ridoutt, B.; Page, G.; Bellotti, W. Environmental performance of local food: Trade-offs and food security implications for a developed city. J. Clean. Prod. 2016, 114, 420–430. [Google Scholar] [CrossRef]
- Sarhadian, R. Small Grocery Store Integrated Energy Efficiency Improvements; Refrigeration and Thermal Test Centre Project PY 2002, RTTC Project R02ET01, ET Project ET02.05 Final Report; Refrigeration and Thermal Test Center: Irwindale, CA, USA, 2004. [Google Scholar]
- Schmidt, J.; Weidema, B.; Brandão, M. A framework for modelling indirect land use changes in life cycle assessment. J. Clean. Prod. 2015, 99, 230–238. [Google Scholar] [CrossRef]
- PRé Consultants, Putting the Metrics behind Sustainability. Available online: http://www.pre-sustainability.com/simapro (accessed on 4 June 2016).
- Goedkoop, M.; Heijings, R.; Huibregts, M.; De Schryver, A.; Struijs, J.; Van Zelm, R. ReCiPe 2008: A Life Cycle Impact Assessment Method Which Comprises Harmonised Category Indicators at the Midpoint and the Endpoint LevelReport 1: Characterisation, 1st ed.; RIVM, CML, PRé Consultants and Radboud Universiteit Nijmegen: Bilthoven, The Netherlands, 2009; Available online: http://www.lcia-recipe.net (accessed on 4 June 2016).
- Deuter, P.; White, N.; Putland, D. Critical Temperature Thresholds Case Study: Lettuce; 2012. Available online: http://www.managingclimate.gov.au/publications/lettuce-critical-temperature-thresholds-now-available-for-download/ (accessed on 25 June 2012).
- World Bank Group. Data: CO2 Emissions (Metric Tons per Capita); The World Bank Group, sourced from Carbon Dioxide Information Analysis Center, Environmental Sciences Division, Oak Ridge National Laboratory: Oak Ridge, TN, USA, 2015.
- Treasury and DICCSRTE. Chapter 3 Australian Projections. In Climate Change Mitigation Scenarios; The Treasury and the Department of Industry, Innovation, Climate Change, Science, Research and Tertiary Education (DIICCSRTE): Canberra, ACT, Australia, 2013; pp. 37–87. [Google Scholar]
- Department of the Environment. Australia’s Abatement Task Fact Sheet; Department of the Environment: Canberra, ACT, Australia, 2015. Available online: http://www.environment.gov.au/climate-change/emissions-projections (accessed on 4 June 2016).
- Ruming, K. Urban consolidation: Strategic planning and community opposition in Sydney, Australia: Unpacking policy knowledge and public perceptions. Land Use Policy 2014, 39, 254–265. [Google Scholar] [CrossRef]
- Zanon, B.; Verones, S. Climate change, urban energy and planning practices: Italian experiences of innovation in land management tools. Land Use Policy 2013, 32, 343–355. [Google Scholar] [CrossRef]
- Kissinger, M.; Sussman, C.; Moore, J.; Rees, W.E. Accounting for the Ecological Footprint of Materials in Consumer Goods at the Urban Scale. Sustainability 2013, 5, 1960–1973. [Google Scholar] [CrossRef]
- Keating, M.; Smith, C. Critical Issues Facing Australia to 2025: Summary of a Scenario Development Forum; Academy of the Social Sciences in Australia: Canberra, ACT, Australia, 2011. [Google Scholar]
- Centre for International Economics. Energy-Efficiency: Building Code Star-Ratings. What’s Optimal, What’s Not; Centre for International Economics: Canberra, ACT, Australia, 2010. [Google Scholar]
| Scenario Name Characteristic | Narrative Description for Characteristic |
|---|---|
| High Emissions (business as usual) | |
| GHG Emissions | High emissions, leading to approximately 1230ppm CO2-e at 2100 [27]. Rising emissions are linked to the fossil-intensive energy sector as well as increasing population and associated food production requirements [13,21]. The high emissions scenario is reflective of a business as usual approach to climate change [21]. |
| Population | High growth [13,21,28,29]. |
| Energy | Primary energy consumption rises threefold compared to year 2000. Coal and other fossil sources dominate the primary energy mix. Post 2050, conventional oil experiences a dramatic decline. Coal (and gas) sources of petroleum would potentially be required [21]. Introduction of nuclear energy and renewable energies is characterised by slow adoption. |
| Technology | Technological innovation is slow with limited international technology trading [21,29]. Little adoption of electric vehicles due to low market penetration of renewable energy sources. |
| Economy | Slow income growth and slow convergence of international economic equity drive low efficiency gains and high energy demands [21]. |
| Environmental | Global forest area continues to decrease. Areas of cropland and grassland continue to increase [13,21]. |
| Urban growth | Diffuse suburbanisation and higher land-use change: road infrastructure and automobile dependence permit continued growth in suburban and peri-urban (PU) areas. Few planning restrictions. |
| Agricultural change | Lower agricultural productivity [28]. Increased food requirements for the growing population are met through transformation of land from other agricultural land or from native ecosystems. Minimal restrictions on land use change (LUC). |
| Moderately-high emissions | |
| GHG Emissions | Moderate emissions, leading to approximately 728ppm CO2-e at 2100 [27]. |
| Population | Moderate growth [13,20,28,29]. |
| Energy | Primary energy consumption rises to approximately double that of year 2000 [13]. Oil consumption remains relatively constant compared to 2000 levels. Coal increases but a shift favouring natural gas use with some use of carbon capture and storage (CCS) technology occurs, with approximately 70 percent market penetration of CCS technology to thermal power plants by 2100 [20]. Gas sources of petroleum would potentially be required. Renewables and nuclear constitute approximately 30 percent of the primary energy use by 2100 [13,20]. |
| Technology | Technological innovation is diverse, but moderate in adoption pace [23]. Increasing use of CCS at power plants means a greater adoption of hybrid, then fully electric vehicles compared to the high emissions scenario. |
| Economy | Economic development is moderate [20,29]. Less global convergence than within the moderately-low emissions narrative. |
| Environment | Areas of cropland continue to increase, but grassland decreases. Forested area experiences a marginal increase [13,20]. |
| Urban growth | Diffuse growth in outer urban areas occurs, but with somewhat more concentration around existing town centres compared to the high scenario. Although road transportation is still of high influence, a shift to public transport occurs with a slightly higher level of infilling around existing hubs. |
| Agriculture | Historical trends of agricultural productivity decline [22]. A more moderate rate of innovation and technological change occurs compared to the moderately low emissions narrative, excluding CO2 fertilisation effects. |
| Moderately low emissions | |
| GHG Emissions | Moderately low emissions, leading to approximately 581ppm CO2 at 2100 [27]. |
| Population | Low growth [13,22,28,29]. |
| Energy | Primary energy consumption is approximately two to three times that of year 2000 [13,22]. Oil consumption remains relatively constant compared to 2000 levels. Coal and natural gas use increase with wide use of CCS technology. Renewables, biofuels and nuclear constitute approximately one half of the primary energy use by 2100, with nuclear dominant [22]. |
| Technology | Moderate to rapid innovation and deployment occur [29,30]. Technological innovation assists improvements in energy efficiencies and adoption of renewable energy sources. Electric vehicles dominate by the end of the century, replacing hybrids as the preferred norm across total stock. |
| Economy | GDP growth continues at a moderate pace [22], with somewhat more global convergence than the moderately-high narrative. |
| Environmental | Global forest areas increase. Crop and grasslands reduce as policies aim to improve natural vegetation as part of climate mitigation and dietary changes occur [13,22]. |
| Urban growth | Compact growth is favoured. Infill development as a proportion of total housing stock is increased, with development in urban and exurban centres around transport and speciality hubs encouraged. Planning policies aim to improve public infrastructure. |
| Agriculture | Relatively high agricultural productivity is attained [28]. With a high level of technological innovation, a higher total factor productivity (TFP) is achieved compared to either the high or moderately high scenarios. |
| Low emissions | |
| GHG Emissions | Very low emissions, leading to approximately 427ppm CO2-e in 2100 [27]. |
| Population | Moderate growth [13,23,29]. |
| Energy | Primary energy consumption rises to approximately double that of year 2000. Oil consumption declines relative to use in 2000 by late century, but coal and natural gas increase. Approximately half the primary energy mix is renewables and nuclear with biofuels dominating the renewables mix [13]. Reductions in GHG emissions in this RCP are driven primarily by mainstream implementation of CCS technologies for fossil and bioenergy sources, improvements in energy efficiency and adoption of renewable and nuclear energy [23]. |
| Technology | Climate policy leads to rapid improvements in energy technologies and efficiencies, with fast global deployment. Hydrogen fuel cell vehicles become competitive due to increasing oil prices [23]. |
| Economy | Moderate to high income growth [13,23] and partial convergence (the highest level of all narratives) of international economic equity occurs. |
| Environment | Global forest area declines. Areas of cropland continue to increase up to 2050 then stabilise, grassland remains relatively constant [13,23]. |
| Urban growth | Radical transformation in urban development policies, including higher levels of compact development, underpin urban climate mitigation actions. New housing and industry developments are required to provide infrastructure services such as building efficiency improvements. Improvements to public transportation infrastructure are made. |
| Agriculture | Global cropland increases modestly to 2050 followed by stabilisation. Rapid technological advancement in the energy sector is not reflected in the agricultural sector with a more moderate pace of technological improvement [23]. |
| Explanatory Variable | Description |
|---|---|
| Population | The population of the Sydney basin followed the high, medium or low population growth trajectories (Series A, B or C respectively) extrapolated to 2100 [32]. |
| Temperature | Temperature data (mean monthly maximum, Tmax) was produced for each of the scenarios by the CSIRO Climate Projections Outreach Service using a maximum consensus approach for the regions under study. The maximum consensus approach uses the full suite of climate models to project temperature, identifying the climate future supported by the largest number of models, typically resulting in a climate future of intermediate impact, as opposed to a best or worst case situation, for each RCP. Following identification of the maximum consensus climate future for each RCP, climate models were statistically ranked in order to select the most representative models from which temperature was calculated [33]. Temperature increase results were applied to 1986–2005 baseline average monthly mean maximum temperature for each location [34]. |
| CO2 | CO2-equivalent concentration data per narrative was downloaded from the CMIP5 RCP database, as derived from [27]. CO2 equivalence data aggregated from all anthropogenic forcings were used. Baseline annual global mean CO2-equivalent concentration data was taken from Mauna Loa Observatory [35]. |
| Primary energy mix | Developed from supporting RCP literature [20,21,22,23] and IPCC Special Report on Emissions Scenarios OECD 90 data [36].Where CCS was used, a negative credit for CO2-e emissions was given based on the proportion of electricity generated from fossil sources (coal/gas) and biomass (assumed from ethanol production), subject to CCS at the respective timepoint, assuming 90 percent efficiency of CCS. |
| Housing system | |
| Proportion Infill to Greenfield housing | The proportion of infill to greenfield housing development was based on objectives in the Sydney Metropolitan Plan [37]. Ratio changes from 70:30 infill:greenfield, in favour of infill as narratives tend to lower emissions. |
| Size of greenfield land parcel | Average land parcel size for a house in a greenfield development reduced to 400 m2 in 2050 and 350 m2 in 2100. Reductions reflect current trends [38]. |
| Persons per household | Average household size in a greenfield location (3 persons) and infill location (2 persons) were based on Australian Bureau of Statistics data for representative areas [15]. |
| House construction | Amortised over 50 years. |
| Direct land-use change | Amortised over 20 years. Direct LUC refers to services installation, soil organic carbon changes due to impervious surface installation (e.g., concrete house slabs) and earth and civil works such as roads [15]. |
| Household operational energy | Baseline household operational energy (heating/cooling requirements) for both housing in greenfield and infill locations was determined in [15] using data from the Australian Energy Regulator [39]. A baseline of 7764 kWh and 5307 kWh respectively was used. Increase in heating/cooling energy use with climate change related temperature rise for a 5 star house was estimated from [40]. A value for autonomous energy efficiency improvement (AEEI) of between 0.25 and 0.75 percent was applied dependent upon the rate of technological change within each narrative. |
| Household transportation, transportation technology and fuel efficiency | Household transportation data representative of both outer suburban greenfield housing development and inner suburban infill medium storey apartments was adapted from [15] to establish a baseline of transport mode differentiated between private car, public bus and train use. Household transportation was on the basis of person kilometres (km) travelled by car, train or bus. Total household person kms remained static for each housing type at the two time horizons. Allocation of travel kms differed between narratives depending upon modal shift, vehicle and fuel type. Modal shifts from private car use to public transportation were dependent upon the level and type of urbanisation and technology change occurring. For car travel, person kms were allocated according to the vehicle type defined in Table 3. For vehicles taking liquid fuels, the ratio of liquid fuel was a factor of efficiency gain and fuel types per time point. |
| Food system | |
| Production location | Displacement of lettuce production from PU Sydney due to urbanisation assumes food is replaced by production from regional locations (e.g., Victoria) in an inelastic market. Sensitivity of lettuce to monthly mean maximum temperatures above 28 °C may cause further displacement of production to more southerly climate-capable regions (e.g., Tasmania). |
| Lettuce yield change | Yield change was calculated as a function of CO2 concentration and temperature rise [41] for each time point, combined with a factor for technological change. Yield changes were assumed to be an increase in head weight per lettuce, meaning that the number of crop cycles per year was assumed static. Technology change was captured in a modified TFP measure. TFP in Australian horticulture is approximately 1 percent. TFP measures implicitly include historical increases in CO2. Decoupling technical change from CO2 effects suggests a lower rate of change due to production technology than the stated 1 percent average would be appropriate [42]. TFP applied in this study ranged between 0.5 and 0.8 percent depending on narrative. |
| Lettuce transplants | The number of transplants per ha was considered static. Any change in inputs for transplant production was a function of yield change. |
| Plants per hectare | An average planting density of 50,000 plants per ha was assumed. Planting rates per ha remained static over the time period considered. |
| N:P:K fertiliser | Function of yield change. |
| Farm machinery use | Function of yield change. |
| Farm capital production (e.g., machinery, irrigation, sheds) | Static, amortised over relevant lifetimes depending upon equipment, for example 15 years tractor, 5 years hoe. |
| Pesticide/herbicide/insecticide | Function of yield change. |
| Water use | Function of yield change. |
| Electricity on-farm (e.g., pumps) | Function of yield change, using energy mix and AEEI relevant to narrative. |
| On-farm emissions (e.g., N2O from fertiliser, VOC from pesticides) | Function of yield change. |
| Crop cycles per annum | Static at 4.5 crop cycles per annum |
| Post-harvest washing | Function of yield change. |
| Packaging crates – polypropylene | Assumes all farms use polypropylene crates as opposed to single use cardboard cartons. Prior research has indicated that plastic crates may be preferable where cardboard products are not recycled at end-of-life [43]. No change to quantity of crates required at 12 head per crate. |
| Coolroom | No change to capital infrastructure inventory. Refrigeration energy is accounted for as a change in electricity mix and AEEI. Refrigeration power demand was measured in [44] as a function of outdoor temperature, finding an increase of approximately 1.7 percent per degree celcius. Increase in energy due to rising temperatures was tested for the Sydney PU farm, finding only a minor impact on GHG emissions (less than 0.25 percent). Consequently, accounting for changes in coolroom energy as a function of change in Tmax was not performed for the scenarios. |
| Transportation to market | No modal shift from road to other forms of transport was modelled for the food supply chain. Distance to the central Sydney fruit and vegetable market was based on road distance by truck and, where necessary, sea freight between Tasmania and mainland Australia. |
| Indirect land-use change | Indirect LUC because of further upstream crop displacements was evaluated under sensitivity testing, using the model of [45]. |
| Variable | Scenario | |||||||
|---|---|---|---|---|---|---|---|---|
| High Emissions | Moderately-High Emissions | Moderately-Low Emissions | Low Emissions | |||||
| 2050 | 2100 | 2050 | 2100 | 2050 | 2100 | 2050 | 2100 | |
| Population, million (currently 4.7) | 7.9 | 13.2 | 7.7 | 11.2 | 7.4 | 9.1 | 7.7 | 11.2 |
| Housing ratio, infill (IF) :greenfield (GF) | 70:30 | 70:30 | 80:20 | 85:15 | 85:15 | 95:5 | 85:15 | 95:5 |
| Primary energy mix, coal:gas:nuclear:biomass:renewable | 65:20:0: 5: 10 CCS 5% | 55:15:5: 7: 18 CCS 30% | 45:35:5: 5: 10 CCS 10% | 30:40:8: 7: 15 CCS 70% | 45:22:10: 13:10 CCS 15% | 30:20:20: 15:15 CCS 80% | 25:45:10: 10:10 CCS 67% | 15:35:15: 15:20 CCS 90% |
| Transportation | ||||||||
| Household modal shift car:train:bus | 83:12:5 GF 73:15:12 IF | 80:15:5 GF 70:18:12 IF | 77:218:5 GF 64:21:15 IF | 70:25:5 GF 53:30:17 IF | 70:25:5 GF 55:28:17 IF | 60:35:5 GF 40:40:20 IF | 65:30:5 GF 45:35:20 IF | 50:45:5 GF 20:60:20 IF |
| Fossil fuel efficiency gain across stock, % | 20 | 30 | 25 | 40 | 35 | 50 | 45 | 60 |
| Alternative liquid fuels for car transport, % (for ICE 1 s and hybrids) 2 | BF 5 NG 15 CTL/GTL 50 | BF 7 NG 15 CTL/GTL 75 | BF 5 NG 15 GTL 50 | BF 12 NG 20 GTL 60 | BF 10 NG 20 | BF 15 NG 30 | BF 15 NG 40 CTL 10 | BF 30 NG 20 CTL 30 |
| Vehicle type, ICE replaced with 3, % | HE 60 E 2 H2 FCV 0 | HE 85 E 10 H2 FCV 0 | HE 60 E 10 H2 FCV 0 | HE 65 E 30 H2 FCV 0 | HE 60 E 20 H2 FCV 0 | HE 15 E 80 H2 FCV 0 | HE 40 E 40 H2 FCV 10 | HE 10 E 50 H2 FCV 40 |
| Household operational energy and electricity use | ||||||||
| Autonomous energy efficiency improvement (AEEI) | 0.25 | 0.25 | 0.40 | 0.40 | 0.60 | 0.60 | 0.75 | 0.75 |
| Food system | ||||||||
| CO2-e concentration, ppm | 628 | 1230 | 505 | 728 | 526 | 581 | 455 | 427 |
| Modified total factor productivity (TFP), % pa | 0.5 | 0.5 | 0.6 | 0.6 | 0.7 | 0.7 | 0.8 | 0.8 |
| Average annual temperature, Tmax, changes, °C | 1.8 | 3.7 | 1.3 | 2.5 | 1.4 | 2.0 | 1.0 | 0.9 |
| 2050 | 2100 | |||
|---|---|---|---|---|
| Scenario | New Housing (ha) | Quantity Lettuce Displaced (t) | New Housing (ha) | Quantity Lettuce Displaced (t) |
| Low | 224 | 4661 | 56.3 | 1924 |
| Moderately-low | 167 | 3579 | 11.3 | 408 |
| Moderately-high | 298 | 6341 | 169 | 6545 |
| High | 551 | 12,431 | 626 | 30,690 |
© 2016 by the authors; licensee MDPI, Basel, Switzerland. This article is an open access article distributed under the terms and conditions of the Creative Commons Attribution (CC-BY) license (http://creativecommons.org/licenses/by/4.0/).
Share and Cite
Rothwell, A.; Ridoutt, B.; Bellotti, W. Greenhouse Gas Implications of Peri-Urban Land Use Change in a Developed City under Four Future Climate Scenarios. Land 2016, 5, 46. https://doi.org/10.3390/land5040046
Rothwell A, Ridoutt B, Bellotti W. Greenhouse Gas Implications of Peri-Urban Land Use Change in a Developed City under Four Future Climate Scenarios. Land. 2016; 5(4):46. https://doi.org/10.3390/land5040046
Chicago/Turabian StyleRothwell, Alison, Brad Ridoutt, and William Bellotti. 2016. "Greenhouse Gas Implications of Peri-Urban Land Use Change in a Developed City under Four Future Climate Scenarios" Land 5, no. 4: 46. https://doi.org/10.3390/land5040046
APA StyleRothwell, A., Ridoutt, B., & Bellotti, W. (2016). Greenhouse Gas Implications of Peri-Urban Land Use Change in a Developed City under Four Future Climate Scenarios. Land, 5(4), 46. https://doi.org/10.3390/land5040046


