Article

Using Remote Sensing and Random Forest to Assess the Conservation Status of Critical Cerrado Habitats in Mato Grosso do Sul, Brazil

by
Jason Reynolds
1,
Kathryn Wesson
1,*,
Arnaud L. J. Desbiez
2,
Jose M. Ochoa-Quintero
3,4 and
Peter Leimgruber
1
1
Smithsonian Conservation Biology Institute, 1500 Remount Road, Front Royal, VA 22630, USA
2
Giant Armadillo Conservation Program, Royal Zoological Society of Scotland, Edinburgh Zoo, Scotland EH126TS, UK
3
Programa de Pós-Graduação em Ecologia e Conservação, Universidade Federal do Mato Grosso do Sul, Campo Grande 79070900, Brazil
4
Corporación para Investigaciones Biológicas, No. 78 B 141, Carrera 72 A, Medellín, Colombia
*
Author to whom correspondence should be addressed.
Submission received: 3 March 2016 / Revised: 10 May 2016 / Accepted: 11 May 2016 / Published: 19 May 2016

Abstract

:
Brazil’s Cerrado is a highly diverse ecosystem and it provides critical habitat for many species. Cerrado habitats have suffered significant degradation and decline over the past decades due to expansion of cash crops and livestock farming across South America. Approximately 1,800,000 km2 of the Cerrado remain in Brazil, but detailed maps and conservation assessments of the Cerrado are lacking. We developed a land cover classification for the Cerrado, focusing on the state of Mato Grosso do Sul, which may also be used to map critical habitat for endangered species. We used a Random Forest algorithm to perform a supervised classification on a set of Landsat 8 images. To determine habitat fragmentation for the Cerrado, we used Fragstats. A habitat connectivity analysis was performed using Linkage Mapper. Our final classification had an overall accuracy of 88%. Our classification produced higher accuracies (72%) in predicting Cerrado than existing government maps. We found that remaining Cerrado habitats were severely fragmented. Four potential corridors were identified in the southwest of Mato Grosso do Sul, where large Cerrado patches are located. Only two large patches remain in Mato Grosso do Sul: one within the Kadiwéu Indian Reserve, and one near the southeastern edge of the Pantanal-dominated landscape. These results are alarming for rare species requiring larger tracts of habitat such as the giant armadillo (Priodontes maximus).

1. Introduction

Brazil’s Cerrado is a global biodiversity hotspot and represents the country’s second-largest major habitat after Amazonia [1]. Despite its high biodiversity value, the Cerrado is among the least protected habitats globally [1]. As a consequence, Brazil’s Cerrado has been declining due to conversion into cash crop plantations and intensification of agro-pastoral land use [2].
The current estimate for the total area of the Brazilian Cerrado is 1,800,000 km2 [3]. However, little is known about the Cerrado’s conservation status and few systematic assessments of the remaining Cerrado exist. Those that are available either focus only on small areas, or else use aerial imagery [4] or lower-resolution satellite imagery than Landsat, such as MODIS [5].
Maps and cover estimates for open, savanna-type forest ecosystems tend to vary widely because of (a) the difficulty of separating these ecosystems from other cover types [4,6]; (b) differences in mapping thresholds applied to canopy cover, ground cover, and tree height [3,6,7]; and (c) problems with developing unique spectral response patterns which result in low mapping accuracies. Using single-class classifiers in conjunction with machine learning tools, such as Random Forest [8], may improve our ability to accurately map the Cerrado and similar habitats [9]. Random Forest is a technique that has become an efficient and popular model for remote sensing applications such as land cover use and image classification [9,10,11,12], and produces more accurate results compared to other techniques [13,14]. These classifications have proven to reach higher accuracy rates on previously unseen data [8], as well as perform equally to other ensemble methods on remote sensing data [15]. This approach is low-cost, also requiring fewer user-defined parameters than other methods, and is therefore easier to operate [9].
Our study demonstrates such an approach for the Cerrado in the Brazilian state of Mato Grosso do Sul, and provides important habitat baseline data for endangered species in this region, including the maned wolf (Chrysocyon brachyurus), Pampas deer (Ozotoceros bezoarticus), giant anteater (Myrmecophaga tridactyla), and giant armadillo (Priodontes maximus). Our goal is to produce an accurate map of the Cerrado and other forest types for the Mato Grosso do Sul state of Brazil, using the most current satellite imagery and classification methods available. This map will help to assess the status of the Brazilian Cerrado for particular use in the study and conservation of giant armadillos, and for subsequent comparison evaluations to determine the rate of change in land covers of this region.

2. Materials and Methods
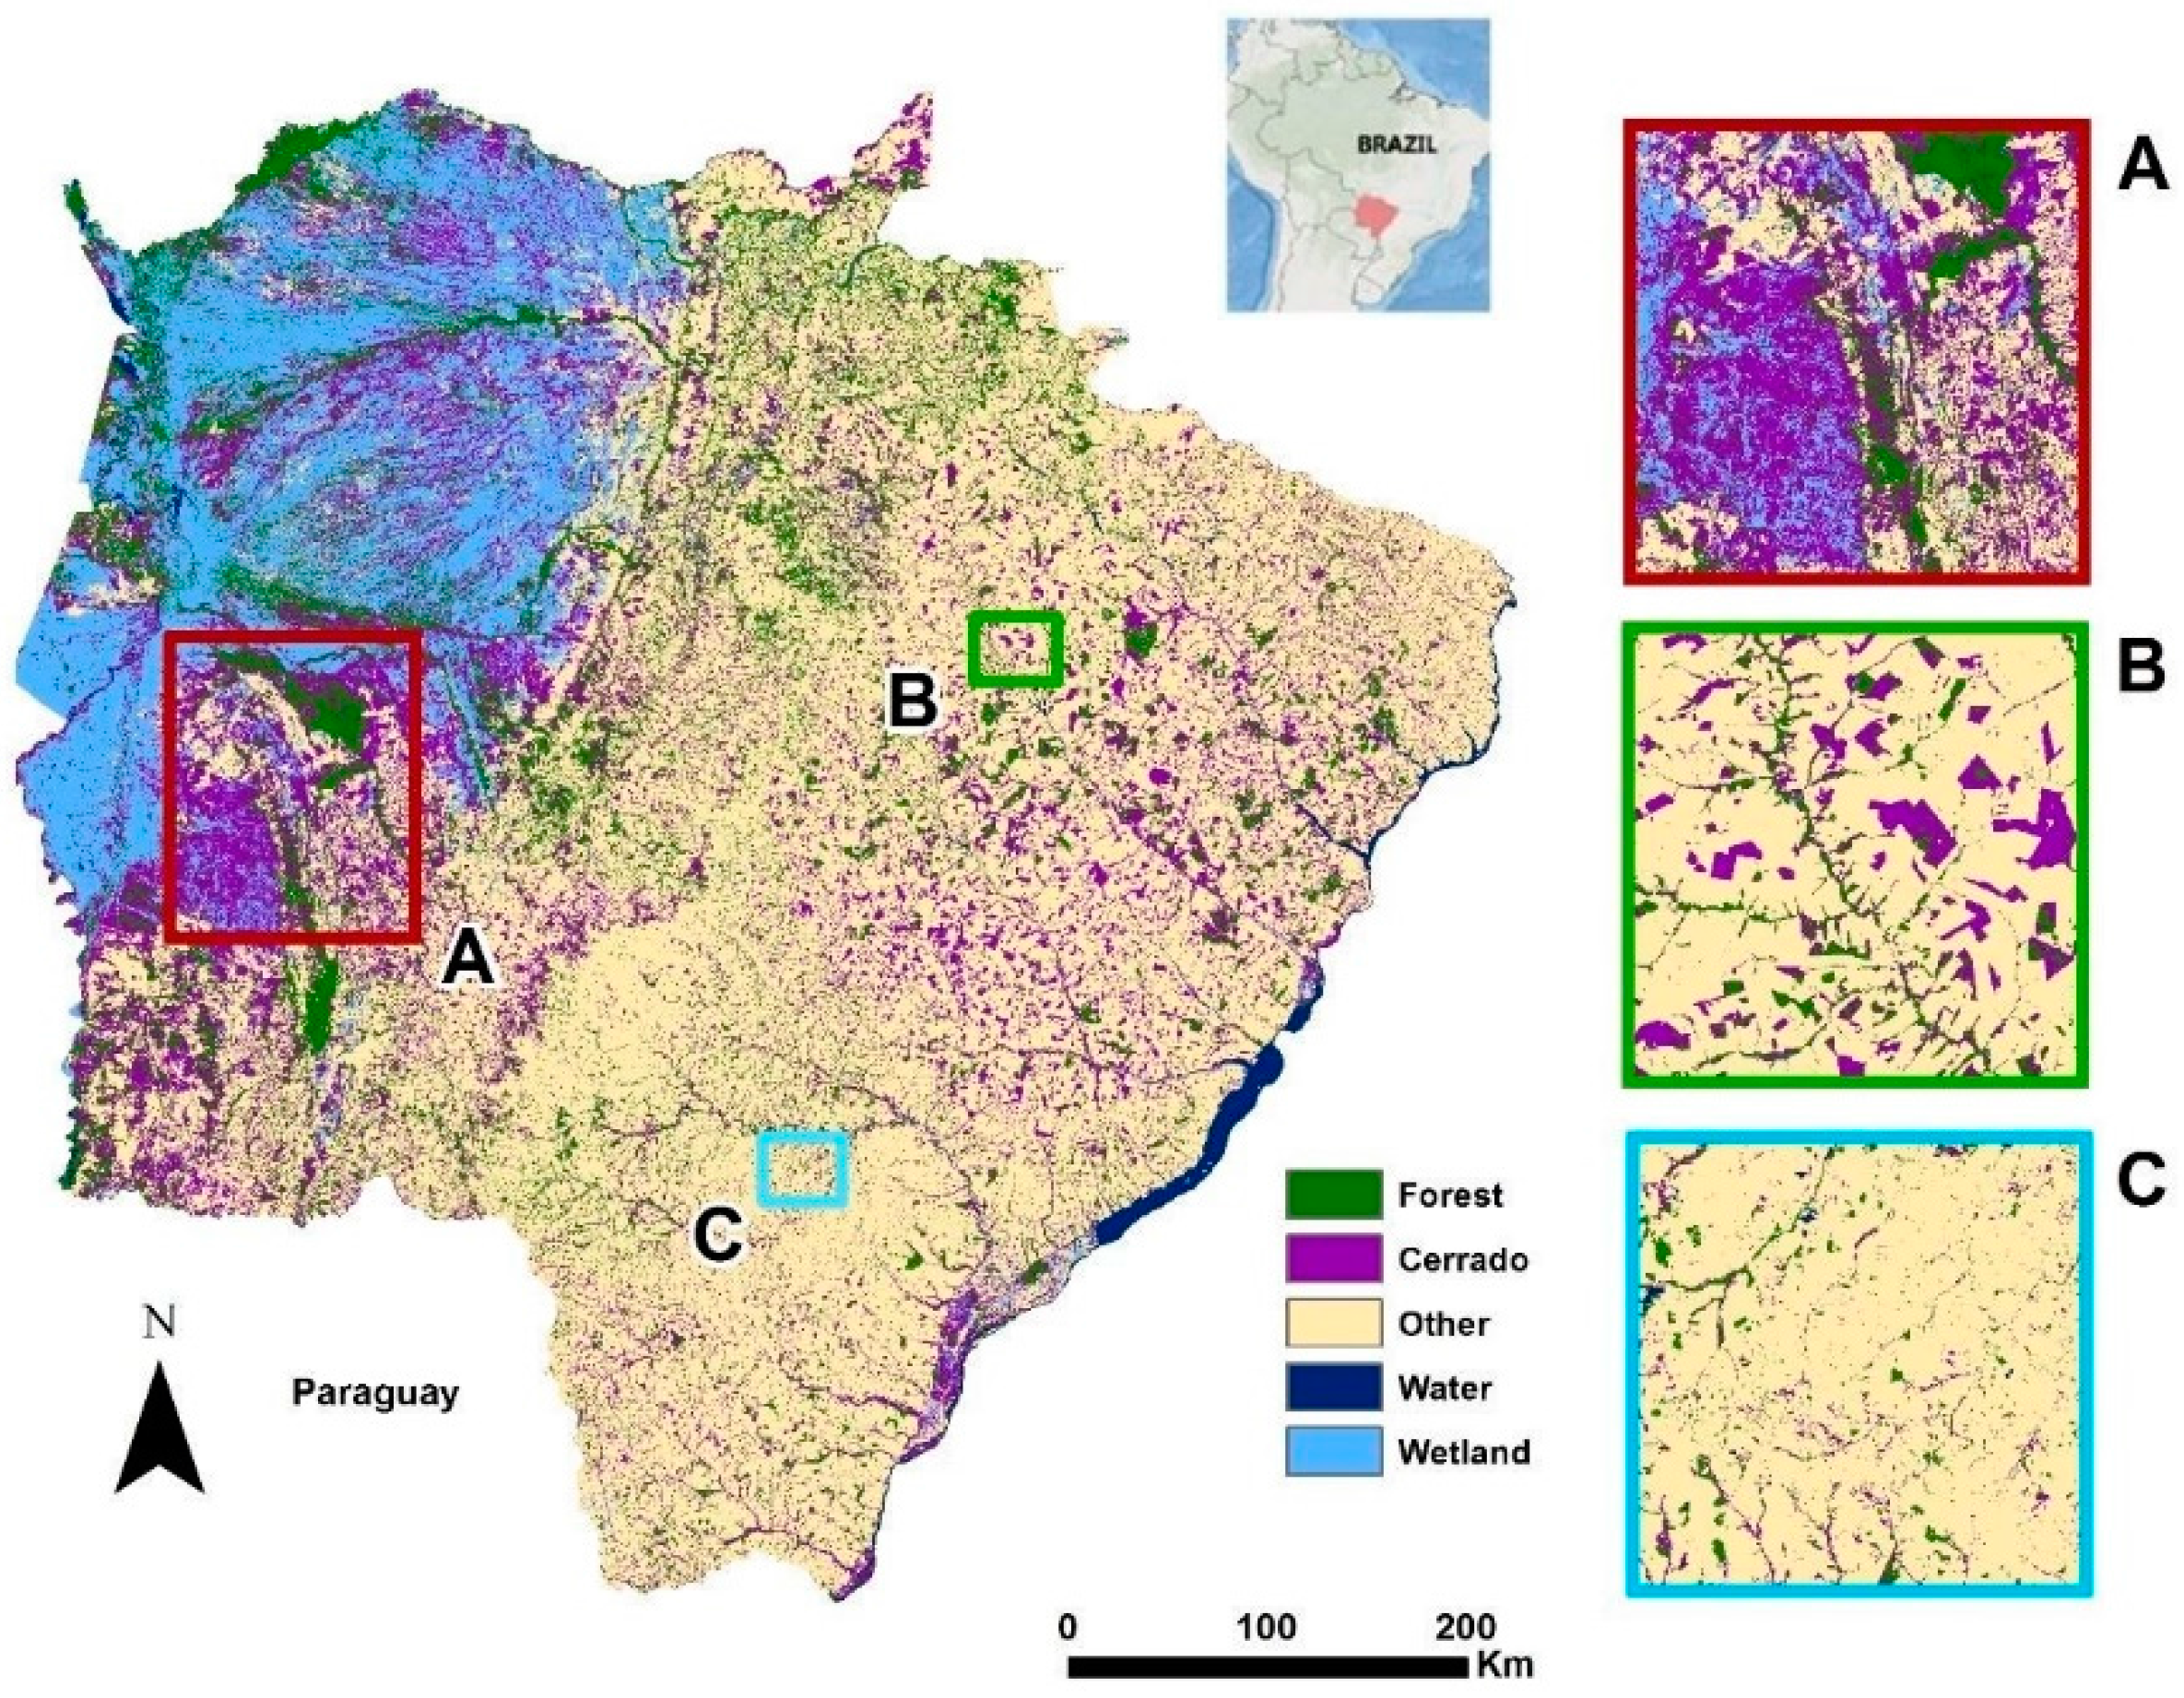
2.1. Study Area

Brazil’s Mato Grosso do Sul state has a tropical climate with high seasonal variation in precipitation that is typically between 800 and 2000 mm during the rainy season [16]. The dominant land use/land cover is agriculture and rangeland for livestock farming [16]. There are three major habitats in the state, including Pantanal wetlands in the northwest; dry, tropical Cerrado savanna in the center; and Atlantic Forests in the east and southeast [17].

2.2. Mapping Definitions and Thresholds for the Cerrado

The Cerrado represents a complex vegetation mosaic with varying canopy and ground cover. The differentiation of soil compositions and drainage patterns generate the wide array of Cerrado appearances [16], and therefore sometimes make it difficult to separate the Cerrado from other habitats, particularly man-made open areas such as agricultural fields and pastures [3,18].
The Cerrado habitats may range from dense grasslands with sparse shrubs and small trees to nearly closed forests supporting trees that are 12–15 m tall [19]. For the purposes of our classification, we incorporated the diverse mosaic of Cerrado vegetation types as a single class (Cerrado). We defined the Cerrado habitat as consisting of trees and large shrub groups about 2–8 m tall with a canopy cover ranging from 10%–60%, and interspersed by a well-developed ground layer with tall grasses [16].

2.3. Remote Sensing Analysis

We used 23 tiles of Landsat 8 images (for date, path and row see Table A1) acquired via the USGS EarthExplorer database (http://earthexplorer.usgs.gov/) to map the Cerrado. Other land use/land cover categories in our classification include forest, other (urban areas and agriculture), water, and wetland. We used dry-season images (May–September; predominantly August) from 2014 to ensure minimal cloud cover of less than 10%. Where clouds were unavoidable, we filled cloud gaps using alternate Landsat 8 data collected during a different dry season month in 2014.
We identified and delineated 100–500 randomly chosen training polygons for each land cover class using high-resolution imagery from Google Earth and ESRI ArcMap Basemaps. We used these training polygons to extract spectral statistics for use in a Random Forest classification [8].
The efficiency and accuracy of Random Forest (RF) algorithms have been widely reported throughout different disciplines, including ecology. RF algorithms apply a bootstrap aggregated sampling technique (“bagging”) to build many individual decision trees, from which a final class assignment is determined [8]. Observations in the original training data that do not occur in the bootstrap sample are named out-of-bag (OOB) observations. A random subset of predictor variables split apart the training data into homogenous subsets [20]. The node-splitting variable that allows for the greatest variance is selected. This allows the overall model to increase its generalization capacity before and after the split [21]. The OOB sample data evaluates the performance by computing the accuracy and error rates averaged over all of the predictions [8] and estimates the importance of each variable in the classification. The difference between the error rate of the original OOB data and the modified OOB data, divided by standard error, determines the importance of the variable [22].
The advantages of RF include that the technique is: (i) able to handle a large number of training samples; (ii) able to measure each input variable into importance levels; (iii) more efficient compared to other machine learning classifiers; (iv) free of normal distribution assumptions; and (v) robust to outliers and noise [23]. These advantages provide a strong argument that RF is the best option for classification purposes.
To remove noise from our classification, we used a 7 × 7 cell majority filter for all classes, except Cerrado and forest. Both Cerrado and forest categories in our study area occurred predominantly along streams and had very linear landscape characteristics. To retain this detail we did not smooth the forest class, and only used a 3 × 3 majority filter for the Cerrado. After smoothing, we mosaicked all image tiles by visually determining the best overlap order.
Finally, we used a nearest-neighbor approach to replace pixels of no data and conducted an accuracy assessment to evaluate if our map was a clear representation of Cerrado and other land covers.

2.4. Accuracy Assessment

To determine classification accuracy for our final map, we inspected Google Earth to visually assess each land cover type for a total of 600 stratified random control points, which gave us 150 for each category. We then compared these control points to our map categories in a confusion matrix [24,25].

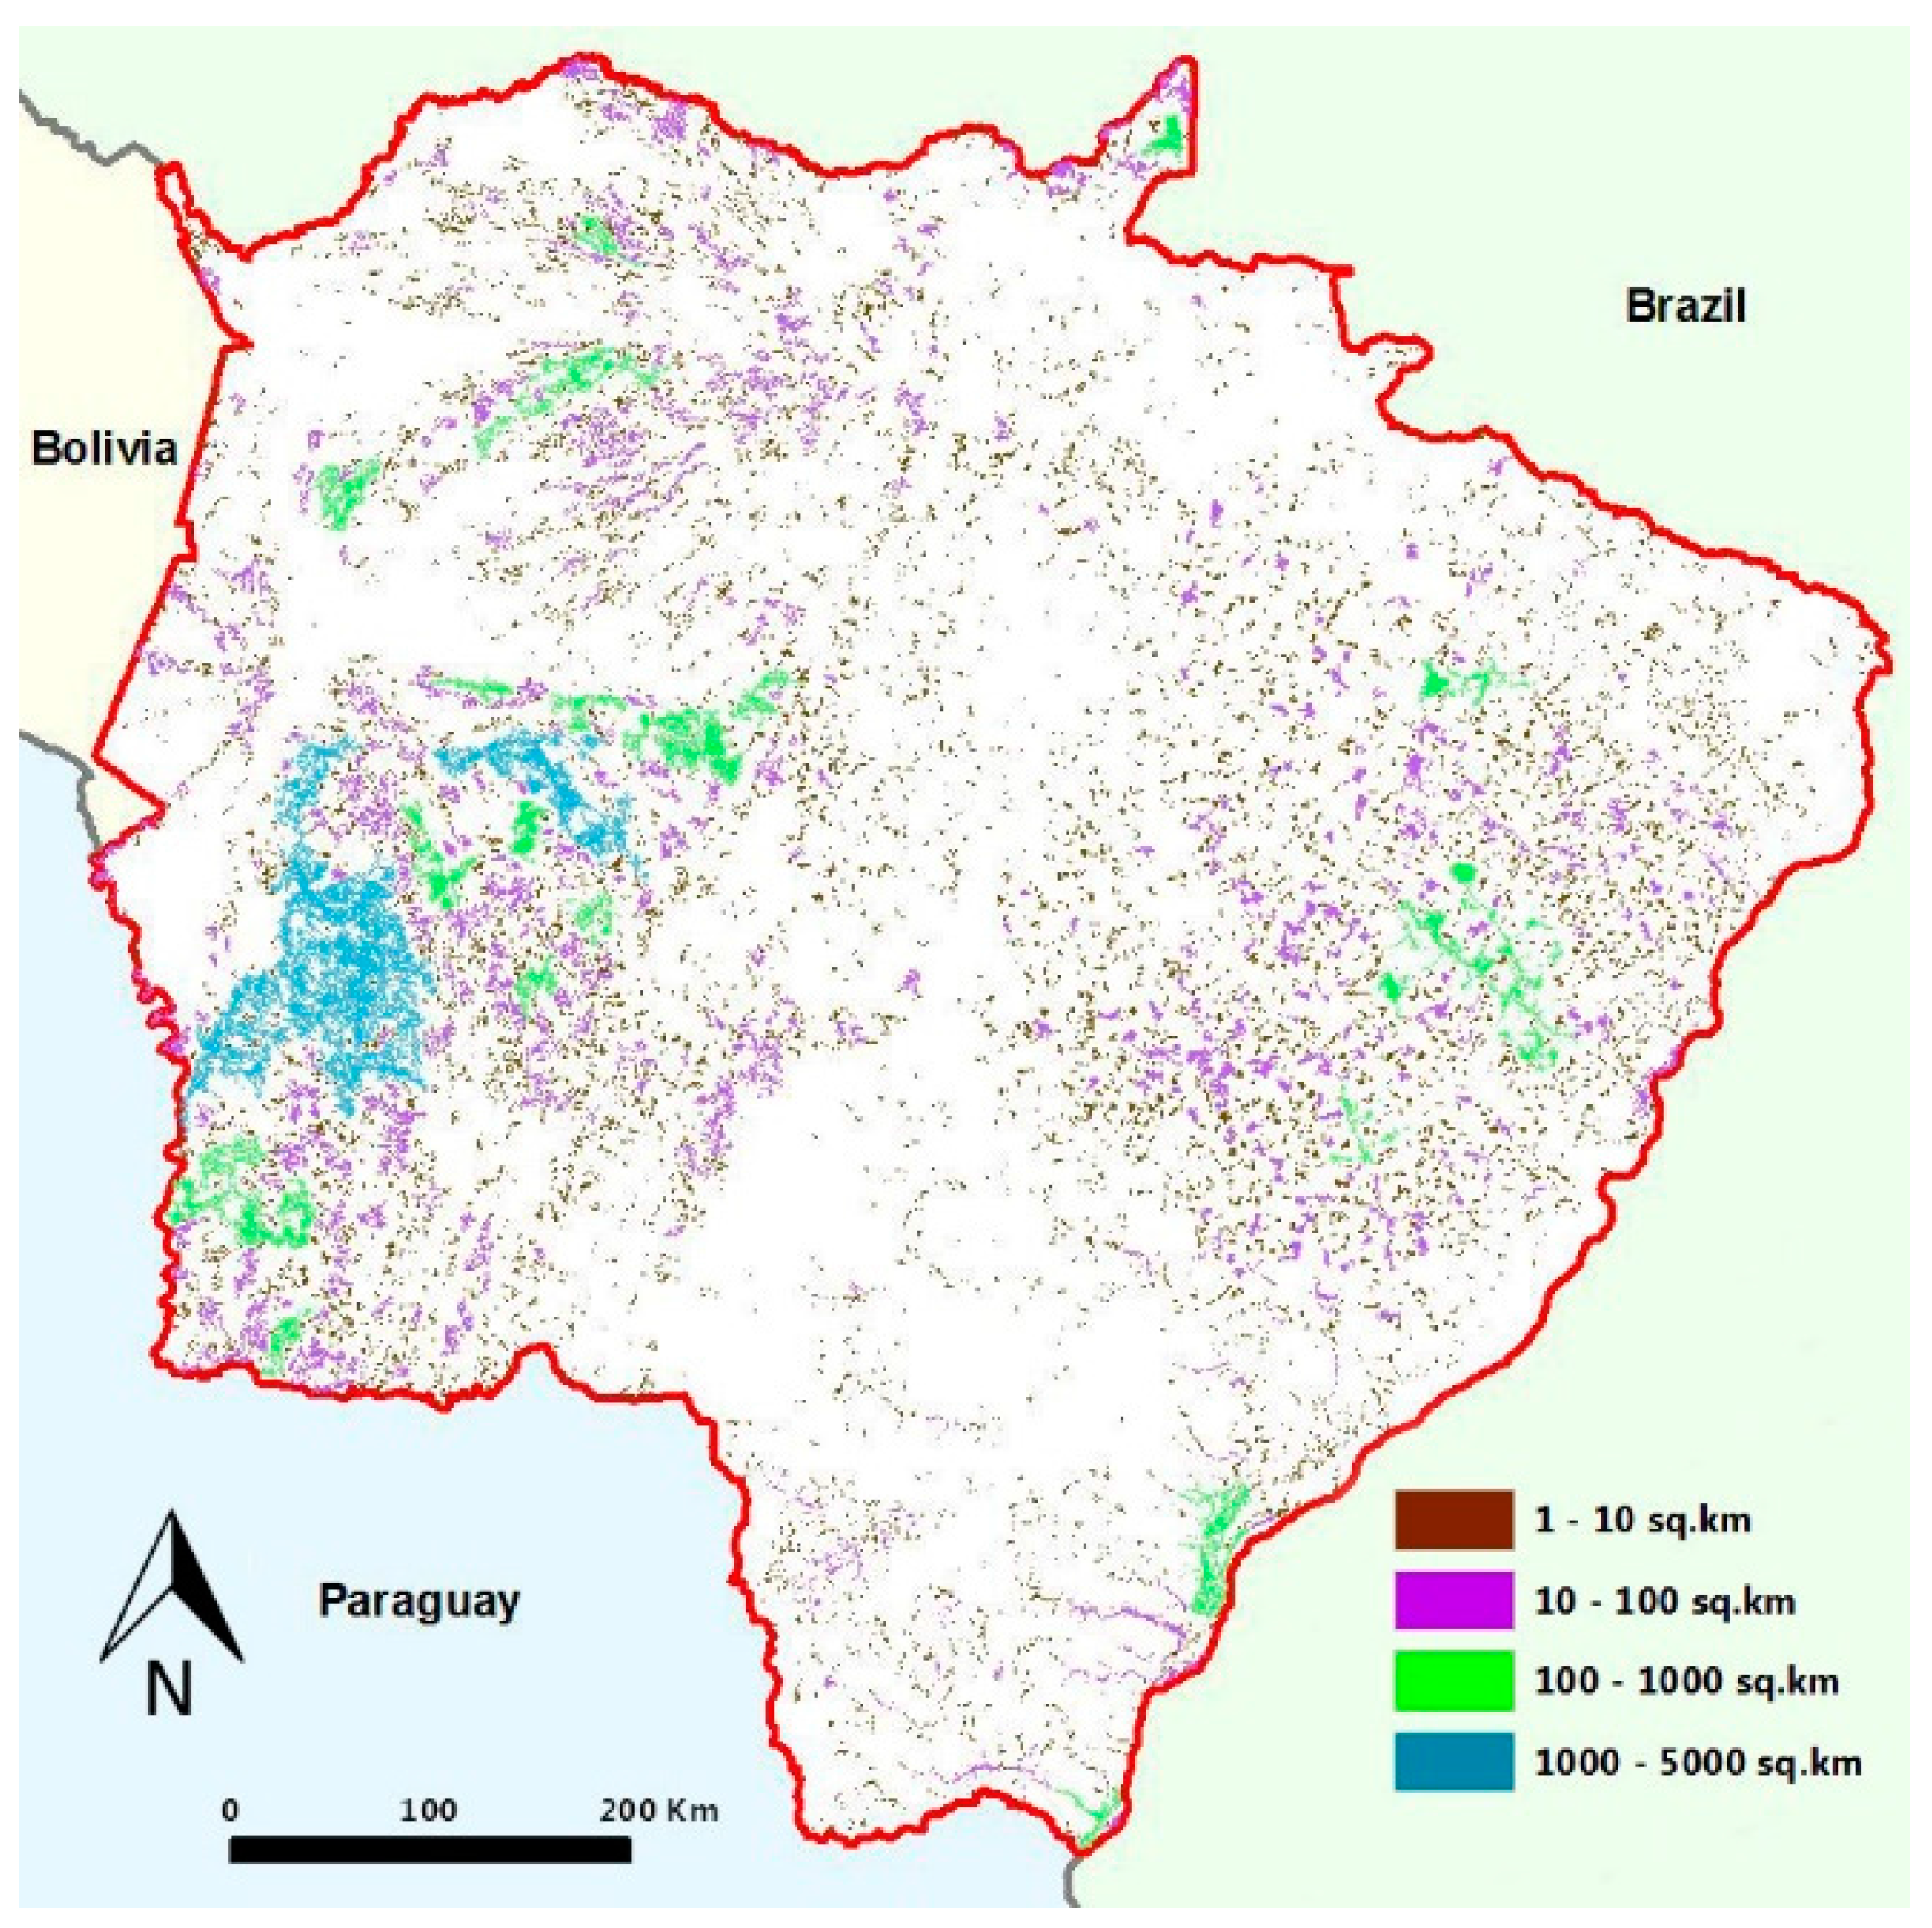
2.5. Measuring Fragmentation

Using Fragstats 4 [26], we quantified landscape metrics of the Cerrado classification using the class indices group. We calculated the mean patch area of the Cerrado land cover type. The eight-cell neighbor rule was used in Fragstats 4 to calculate the mean patch area and mean Euclidean nearest neighbor. The large file size of our original dataset proved too immense to calculate landscape metrics in Fragstats 4. Consequently, we resampled the cell size of the Cerrado raster file to 60 × 60 m resolution in order to calculate the patch area, and to 120 × 120 m resolution in order to calculate the mean Euclidean nearest neighbor.

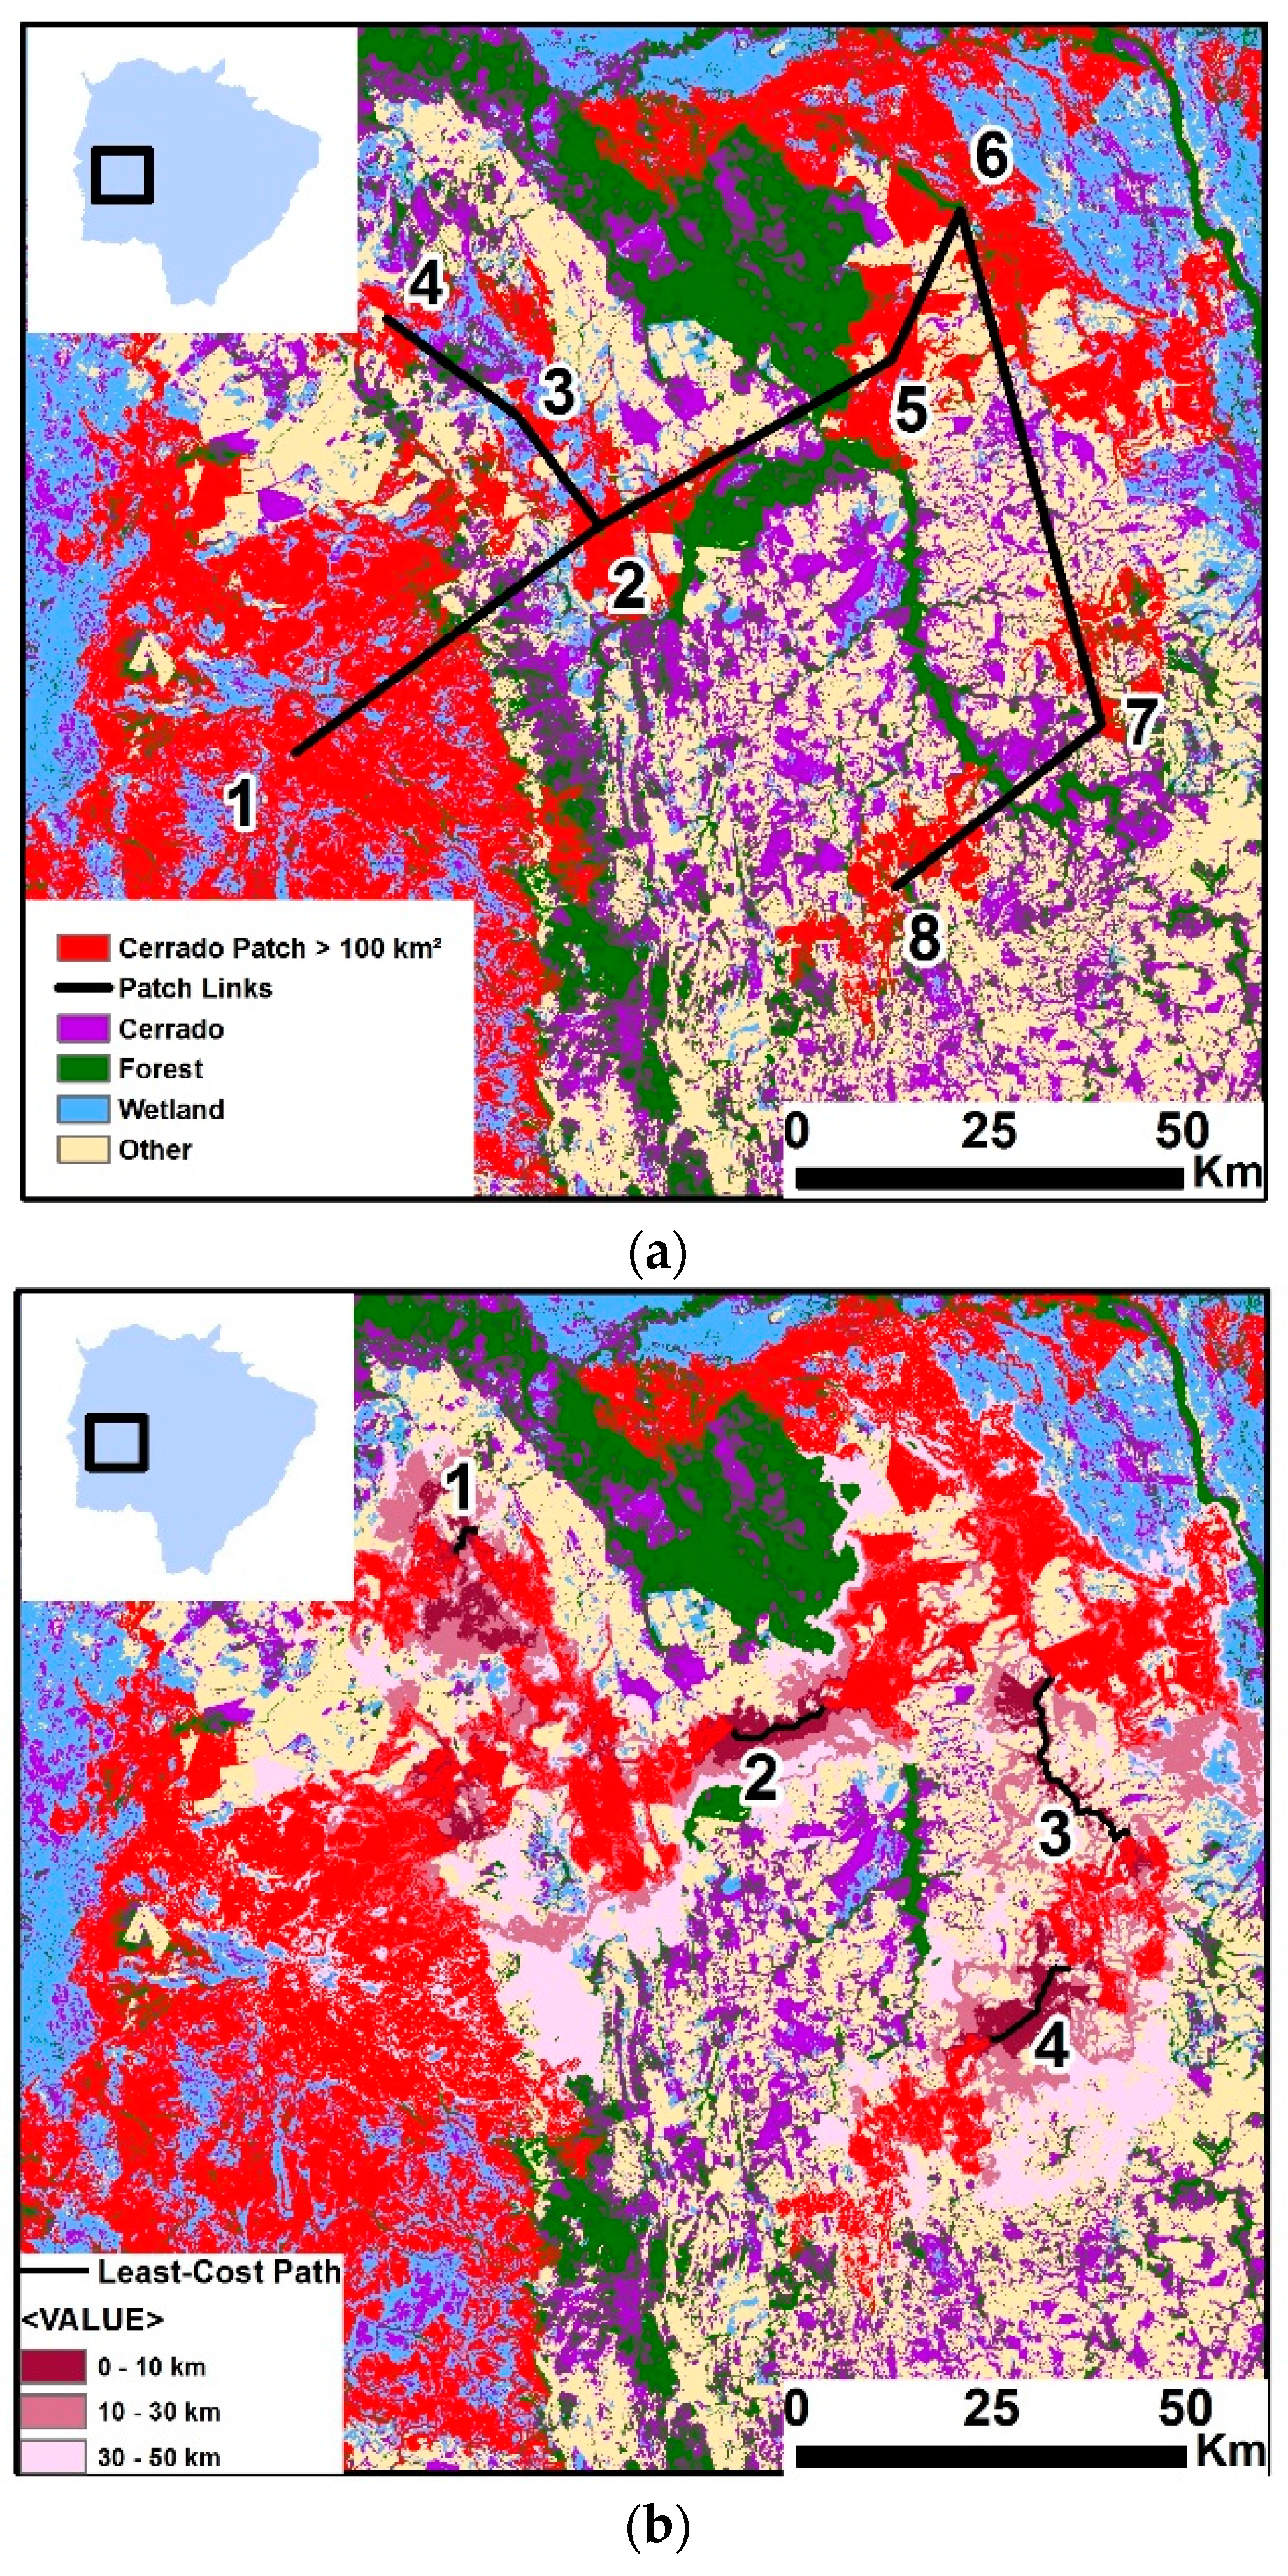
2.6. Habitat Connectivity

Using the Linkage Mapper tool [27], we analyzed habitat connectivity for the southwest portion of the study area. This region was selected because of the high number of large Cerrado patches present. Core Cerrado habitat areas and resistance raster datasets are inputs used by Linkage Mapper to identify potential corridors between specific habitats. The core Cerrado habitats included nine patches greater than 100 km2. The resistance raster labeled habitats in the focus region on a scale from 1–100. Lower resistance values represent habitat types with least resistance to animal movement [27]. We scored Cerrado habitats as 1, forest and wetland as 10, water as 30, and other as 100.

3. Results

There currently are 58,459 km2 of the Cerrado remaining in the entire state of Mato Grosso do Sul (Figure 1), which is 16% of the total area of the state. These remaining areas are fragmented and persist predominantly in small patches, with an average patch size of 9.05 ha ± 0.70 southeast and a mean Euclidean nearest neighbor distance of 0.33 km2 ± 0.22 southeast (Table 1, Figure 2). Strictly protected and indigenous lands have far greater Cerrado patch sizes. Strictly protected areas have an average patch size of 23.83 ha ± 0.95 southeast, while indigenous lands have an average patch size of 75.11 ha ± 4.32 southeast (Table 1).
The central and southern areas of the state have few Cerrado patches remaining (Figure 1b). Eastern Mato Grosso do Sul is dominated by fragmented patches of the Cerrado near strips of gallery forest (Figure 1c). Two large patches of the Cerrado habitat remain in the southwest, totaling 5080 km2 and composing approximately 8.7% of the Cerrado habitat within the state (Figure 1a). The largest patch (4059 km2) falls almost exclusively within the Kadiwéu Indian Reserve (Terra Indígena Kadiwéu), a 5380 km2 reserve in the Porto Murtinho municipality [28].
Comparatively, the Cerrado is under-protected, with only 911 km2 (1.6%) found inside existing strictly protected areas of Mato Grosso do Sul, and 6728 km2 (11.6%) of the Cerrado found within protected areas of sustainable use (Table 2).
Our analysis of habitat connectivity reveals potential areas that can effectively connect large (>100 km2) Cerrado patches and contribute to the conservation of endangered species found within these habitats. We identified four potential corridors (Figure 3) that traverse low-resistance habitat types including Cerrado, forest, and wetland classes (Table 3, Figure 3b). Table 3 lists these areas in order of 1–4 with Figure 3b displaying their locations in the study area. Least-cost paths ranged from 15.70 km to 36 km. The cost-weighted to Euclidean distance ratio ranged from 1.95–6.93. In this matter, a lower ratio corresponds to a lower resistance to animal movement along the particular corridor.
Agriculture/urbanized areas (Other) are the prevalent land cover features in our study area, covering approximately 195,548 km2 of land. Wetlands are the next-greatest land cover, spanning over 51,819 km2. Forests cover roughly 48,674 km2, and water is the least prominent land cover class at only 3961 km2. Forests and the Cerrado are frequently found along river systems and in wetlands towards the northwest of the region (Figure 1b).
Our overall mapping accuracy is high with 88% and a Kappa Coefficient of 0.67. User’s and producer’s accuracies for the Cerrado are slightly reduced (Table 4).

4. Discussion

Little of the Cerrado is left in Mato Grosso do Sul, and what is left resides in patch sizes of less than 10 km2 and is severely under-protected. The two largest remaining Cerrado patches are outside of the state’s protected area system (Figure 1a). However, the Kadiwéu Indian Reserve, representing the largest contiguous Indian land in Central-Southern Brazil [29], harbors the largest remaining Cerrado area. The low population density of the Kadiwéu indigenous people, totaling 2000 inhabitants living within the reserve, and more conservative land use practices in these areas are perhaps the main reason for the persistence of the Cerrado in this area. Therefore, conservation of this area may be critical in the future. Conservation International (CI) is one organization that has recognized the importance of the indigenous reserve and has made efforts in implementing a land management plan in cooperation with FUNAI (National Indian Foundation of Brazil) and ACIRK (Kadiwéu Reserve Indigenous Communities Association) [30].
Protected areas are crucial to preserving biodiversity [31,32,33,34]. The Cerrado holds about 30% of Brazil’s biodiversity, yet only 6.5% of Cerrado habitats are currently protected [35]. This percentage further declines to 3% when considering IUCN Protected Areas Category Ia locations [35], which are areas designated for biodiversity conservation and have strict regulations that limit human visitation and impact [36]. This amounts to about 54,000 km2 of total Cerrado habitat in Brazil that is currently protected.
The Brazilian government utilizes two categories of protected areas: strictly protected areas, and protected areas of sustainable use [37]. Strictly protected areas are designated by the National Protected Areas System of Brazil (SNUC) with the principal objective of conserving biodiversity [37]. These areas include IUCN categories Ia, II, and III. Protected areas of sustainable use allow for different types and levels of human use, with biodiversity conservation as a secondary objective [37]. Strictly protected areas have a total area of 3306 km2 within Mato Grosso do Sul. This equates to 1.56% of the remaining Cerrado habitat in the state (Table 2). Little regard for the protection of the Cerrado habitat and other natural habitats is a growing concern for the future of conservation in the state of Mato Grosso do Sul. Table 2 details the total area and percentage of various land cover types within protected areas and indigenous lands.
Although no detailed data on Cerrado conservation rates over the past decades is available for the state of Mato Grosso do Sul, our results clearly support previous statements about the rapid and dramatic decline of the Cerrado habitats over the past 30 years [38]. These declines are partly explained by a lack in effective state regulations for Cerrado conservation [38]. Under the current Forest Code, all private properties must retain at least 20% of their native vegetation for sustainable use, but this law is not well enforced [39]. The uncontrolled transition from the Cerrado to agriculture and urbanization is encouraged by the government, because it is an economically useful way to develop the interior of Brazil [16]. In particular, soybeans are the primary farming industry [40] and act as a catalyst for the farming of other economically beneficial products within the country [41].
The average patch size of the Cerrado in Mato Grosso do Sul is much less than calculations that other studies have found elsewhere in Brazil. For example, we found an average Cerrado patch size of 9.05 ha in Mato Grosso do Sul, compared to 21.06 ha in western Bahia [3] and 22.69 ha in eastern Mato Grosso [3]. This considerable difference in patch sizes provides strong evidence of the increased fragmentation of Cerrado habitats throughout Mato Grosso do Sul.
The crucial role giant armadillos have in Cerrado habitats [42] and their requirement for large, unfragmented areas [43] supports the need to identify and protect remaining large patches of Cerrado habitats. Research conducted by the Giant Armadillo Conservation project in the adjacent Pantanal region demonstrates that giant armadillos are “ecosystem engineers” and play a key role in the ecosystem, since they dig deep burrows that provide shelter and resources for over 25 other species such as the endangered maned wolf (Chrysocyon brachyurus) and the jaguar (Panthera orca) [42]. Unpublished data from the project shows that in the Pantanal, they prefer vegetated areas, and it is expected that their survival in the Cerrado will depend on contiguous stretches of native habitat [44]. Telemetry results from the Pantanal do show that they can cross expanses of over two kilometers of open pasture; however, the high fragmentation of the Cerrado and small patch size is a major threat to their survival [44]. Another study found only one instance of a giant armadillo (n = 225) living outside the strictly protected study area (Emas National Park) that was not connected by habitat corridors [43]. Identifying locations of large patches of Cerrado habitats will help researchers better predict potential locations of elusive species such as the giant armadillo that require large, unfragmented habitats [43,44].
By creating an updated map depicting the fragmentation of the Brazilian Cerrado, we can identify potential corridors to restore the Cerrado habitat and benefit indigenous communities in Mato Grosso do Sul. Indigenous lands are becoming increasingly isolated which has lead to negative environmental impacts within indigenous reserves [45]. Indigenous tribes throughout Brazil rely heavily upon environmental services for sustenance and well-being [45,46]. Identifying potential corridors for Cerrado restoration and conservation will increase connectivity between large patches of Cerrado habitats in Mato Grosso do Sul, where indigenous reserves such as the Kadiweu Indian Reserve are located. Reducing patch isolation [47] with corridors will improve the environmental services within native habitats, thereby improving the livelihoods of indigenous peoples dependent on them [45,46].
Cerrado conservation and restoration within the four potential corridors identified in Figure 3b can increase the benefits of preserving the last remaining unbroken Cerrado habitats found in Mato Grosso do Sul. If it were updated to specifically include these areas, the Forest Code could facilitate the preservation and restoration of native vegetation within the identified corridor locations, because its policy currently focuses on native vegetation conservation within private lands.
The high overall accuracy (Table 3) of our classification map supports the growing evidence that RF is a reliable classifier for heterogeneous landscapes. The land cover types other than the Cerrado were most accurate with a combined accuracy of 91% (Table 3). Our map’s ability to discriminate Cerrado habitats from other land cover demonstrates the effectiveness of RF to map land cover of highly fragmented landscapes. The accuracy of our classification in separating the Cerrado from other land cover was high, despite the difficulty in mapping the heterogeneous vegetation structure and canopy found within Cerrado habitats. These difficulties resulted in lower user’s and producer’s accuracies for the Cerrado than for other land cover. Correctly classifying tropical, dry forest types is a major issue in remote sensing [6]. Global- and regional-scale land cover classification of varying classes within tropical, dry forests have resulted in overall accuracies ranging from 71%–79% [6]. For instance, deciduous woody plants found in Cerrado habitats are completely bare by the end of the dry season [48], creating spectral similarities between the Cerrado and non-native pastures [3]. Dense cloud cover during the wet season also inhibits the delineation of land cover in the region [49]. Our study incorporated satellite imagery solely from the end of the dry season (August), which may also have contributed to lower user’s and producer’s accuracies for the Cerrado.
Our classifications performed favorably compared to the GeoMS land cover classification scheme [50], currently used by the Brazilian government for land use planning and conservation purposes. An accuracy assessment of the GeoMS classification resulted in 68% user’s accuracy, which is lower than the 72% user’s accuracy that we observed in our own study. The GeoMS classification was based on data from 2007, seven years earlier than the data incorporated in this study, which may also have contributed to its lower accuracy.
Improved future Cerrado mapping may perhaps be accomplished using phenologically varied imagery from the wet season versus the dry season, or by incorporating NDVI phenology models. A similar classification conducted by Wohlfart et al. [51] in Southeast Asia, which also utilized random forest algorithms, found that using these seasonal resources increased the overall accuracy of the understudied dry, deciduous forest region.

5. Conclusions

High levels of endemism and biodiversity make the Cerrado one of the world’s biodiversity hotspots, yet it is generally undervalued for conservation efforts [1,16]. Mapping Cerrado habitats is a difficult task [4], so improvement in classification techniques is crucial towards generating awareness of the pressing conservation issues regarding them.
The methodology used in this study shows an improvement over previous techniques used in prior studies to correctly classify Cerrado habitats within the Brazilian state of Mato Grosso do Sul. The land classification map found in this study will be of great use for researchers focusing on species within Cerrado habitats, such as giant armadillos. Our updated land classification map will provide a current assessment of the Cerrado decline and inform researchers where important biodiversity areas are located, and help them focus their search for giant armadillos and habitat conservation priorities.
A prominent challenge for the future of Cerrado conservation is maintaining connectivity between fragmented patches of native habitat and the sustainability of large patches of remaining native habitat within indigenous reserves [52]. Identifying potential areas of corridors will increase the health of ecosystems and benefit the economic viability and overall well-being of nearby indigenous reserves [45]. The failure of the efforts from international conservation groups in 2003 [30] implies that the indigenous people are wary of collaboration with foreign organizations. Securing trust and maintaining positive relations needs to be a priority for conservation groups in order to preserve the remaining areas where the Cerrado habitat continues to thrive.
The current potential distribution of giant armadillos in the remaining Cerrado habitat in Mato Grosso do Sul is being mapped through site visits. However, results from this study are alarming and highlight that maintaining connectivity within the fragmented habitat will be key to ensuring the persistence of viable populations of giant armadillos.

Acknowledgments

We thank Ned Horning from the American Museum of Natural History for his Random Forest script (https://bitbucket.org/rsbiodiv/randomforestclassification), and Melissa Songer, Jared Stabach, and Jamie Wadey for support during the research and writing of the manuscript. Additionally, we thank the donors of the Giant Armadillo Conservation Project listed at www.giantarmadillo.org.br. Friends of the National Zoo (FONZ) and the Smithsonian Conservation Biology Institute (SCBI) provided funding for the study.

Author Contributions

All authors contributed to the conception of the study; J.R., K.W., and P.L. designed the methodology and wrote the manuscript; J.R. and K.W. assembled the input data, carried out the methodology, and conducted the analysis; A.D. and J.O.-Q. supplied data and shared expert knowledge of the study area; A.D., J.O.-Q., and P.L. edited and reviewed the manuscript. J.O.-Q., holds a grant from the Programa Nacional de Pós Doutorado PNPD-CAPES #PNPD 1378381.

Conflicts of Interest

The authors declare no conflict of interest. The funding sponsors had no role in the design of the study; in the collection, analyses, or interpretation of data; in the writing of the manuscript, and in the decision to publish the results.

Abbreviations

The following abbreviations are used in this manuscript:
MDPI
Multidisciplinary Digital Publishing Institute
K
Kappa Coefficient
RF
Random Forest
NDVI
Normalized Difference Vegetation Index
MODIS
Moderate Resolution Imaging Spectroradiometer
OOB
Out-of-bag
ESRI
Environmental Systems Research Institute
CI
Conservation International
FUNAI
National Indian Foundation
ACIRK
Kadiwéu Reserve Indigenous Communities Association
IUCN
International Union for Conservation of Nature
SNUC
National System of Protected Areas

Appendix A

Table A1. Landsat 8 imagery index.
DatePathRow
08 August 2014222074
30 July 2014223073
30 July 2014223074
30 July 2014223075
30 July 2014223076
06 August 2014224073
06 August 2014224074
06 August 2014224075
06 August 2014224076
06 August 2014224077
28 July 2014225072
29 August 2014225073
16 October 2014 *225073
29 August 2014225074
21 Sepember 2014 *225074
29 August 2014225075
29 August 2014225076
04 August 2014226072
04 August 2014226073
21 Sepember 2014226074
20 August 2014226075
11 August 2014227072
11 August 2014227073
11 August 2014227074
11 August 2014227075
* Indicates Landsat 8 imagery used to patch cloud gaps.

References

  1. Klink, C.A.; Machado, R.B. Conservation of the Brazilian Cerrado. Conserv. Biol. 2005, 19, 707–713. [Google Scholar] [CrossRef]
  2. Müller, H.; Rufin, P.; Griffiths, P.; Siqueira, A.J.B.; Hostert, P. Mining dense Landsat time series for separating cropland and pasture in a heterogeneous Brazilian savanna landscape. Remote Sens. Environ. 2015, 156, 490–499. [Google Scholar] [CrossRef]
  3. Brannstrom, C.; Jepson, W.; Filippi, A.M.; Redo, D.; Xu, Z.; Ganesh, S. Land change in the Brazilian Savanna (Cerrado), 1986–2002: Comparative analysis and implications for land-use policy. Land Use Policy 2008, 25, 579–595. [Google Scholar] [CrossRef]
  4. De Castro, E.C. Aerial photo land cover classification of cerrado physiognomies: Detailed or accurate maps. In Proceedings of the 12th Simpósio Brasileiro de Sensoriamento Remoto, Goiânia, Brazil, 16–21 April 2005; INPE: São Paulo, Brazil, 2005; pp. 1175–1181. [Google Scholar]
  5. Beuchle, R.; Grecchi, R.C.; Shimabukuro, Y.E.; Seliger, R.; Eva, H.D.; Sano, E.; Achard, F. Land cover changes in the Brazilian Cerrado and Caatinga biomes from 1990 to 2010 based on a systematic remote sampling approach. Appl. Geogr. 2015, 58, 116–127. [Google Scholar] [CrossRef]
  6. Leimgruber, P.; Delion, M.; Songer, M. The uncertainty in mapping seasonally dry tropical forests in Asia. In The Ecology and Conservation of Seasonally Dry Forests in Asia; McShea, W.J., Davies, S.J., Bhumpakphan, N., Eds.; Smithsonian Institution Scholarly Press: Washington, DC, USA, 2011; Volume 1, pp. 59–74. [Google Scholar]
  7. Jung, M.; Henkel, K.; Herold, M.; Churkina, G. Exploiting synergies of global land cover products for carbon cycle monitoring. Remote Sens. Environ. 2006, 101, 534–553. [Google Scholar] [CrossRef]
  8. Breiman, L. Random forests. Mach. Learn. 2001, 45, 5–32. [Google Scholar] [CrossRef]
  9. Pal, M. Random Forest classifier for remote sensing classification. Int. J. Remote Sens. 2005, 26, 217–222. [Google Scholar] [CrossRef]
  10. Chan, J.C.-W.; Paelinckx, D. Evaluation of Random Forest and Adaboost tree-based ensemble classification and spectral band selection for ecotope mapping using airborne hyperspectral imagery. Remote Sens. Environ. 2008, 112, 2999–3011. [Google Scholar] [CrossRef]
  11. Horning, N. Random forests: An algorithm for image classification and generation of continuous fields data sets. In Proceedings of the International Conference on Geoinformatics for Spatial Infrastructure Development in Earth and Allied Sciences, Hanoi, Vietnam, 9–11 December 2010.
  12. Prasad, A.M.; Iverson, L.R.; Liaw, A. Newer classification and regression tree techniques: Bagging and random forests for ecological prediction. Ecosystems 2006, 9, 181–199. [Google Scholar] [CrossRef]
  13. Chakraborty, A.; Joshi, P.K. Comparing different classification approaches for mapping forest types in the complex Himalayan landscape. In Proceedings of the ISPRS TC 8th International Symposium on Operational Remote Sensing Applications: Opportunities, Progress and Challenges, Hyderabad, India, 9–12 December 2014.
  14. Li, C.; Wang, J.; Wang, L.; Hu, L.; Gong, P. Comparison of classification algorithms and training sample sizes in urban land classification with Landsat Thematic Mapper Imagery. Remote Sens. 2014, 6, 964–983. [Google Scholar] [CrossRef]
  15. Gislason, P.O.; Benediktsson, J.A.; Sveinsson, J.R. Random forests for land cover classification. Pattern Recognit. Lett. 2006, 27, 294–300. [Google Scholar] [CrossRef]
  16. Ratter, J.A.; Ribeiro, J.F.; Bridgewater, S. The Brazilian Cerrado vegetation and threats to its biodiversity. Ann. Bot. 1997, 80, 223–230. [Google Scholar] [CrossRef]
  17. Olson, D.M.; Dinerstein, E.; Wikramanayake, E.D.; Burgess, N.D.; Powell, G.V.N.; Underwood, E.C.; D’Amico, J.A.; Itoua, I.; Strand, H.E.; Morrison, J.C.; et al. Terrestrial ecoregions of the world: A new map of life on earth. BioScience 2001, 51, 933–938. [Google Scholar] [CrossRef]
  18. Nepstad, D.C.; Klink, C.; Uhl, C.; Viera, I.; LeFebvre, P.; Pedlowski, M.; Matricardi, E.; Negreiros, G.; Brown, I.; Amaral, E.; et al. Land-use in Amazonia and the Cerrado of Brazil. Ciênc. Cult. 1997, 49, 73–86. [Google Scholar]
  19. Eiten, G. The Cerrado vegetation of Brazil. Bot. Rev. 1972, 38, 201–341. [Google Scholar] [CrossRef]
  20. Mellor, A.; Haywood, A.; Stone, C.; Jones, S. The performance of random forests in an operational setting for large area sclerophyll forest classification. Remote Sens. 2013, 5, 2838–2856. [Google Scholar] [CrossRef]
  21. Walton, J.T. Subpixel urban land cover estimation: Comparing cubist, random forests, and support vector regression. Photogramm. Eng. Remote Sens. 2008, 74, 1213–1222. [Google Scholar] [CrossRef]
  22. Cutler, D.R.; Edwards, T.C., Jr.; Beard, K.H.; Cutler, A.; Hess, K.T.; Gibson, J.; Lawler, J.J. Random forests for classification in ecology. Ecology 2007, 88, 2783–2792. [Google Scholar] [CrossRef] [PubMed]
  23. Rodriguez-Galiano, V.F.; Ghimire, B.; Rogan, J.; Chica-Olmo, M.; Rigol-Sanchez, J.P. An assessment of the effectiveness of a random forest classifier for land-cover classification. ISPRS J. Photogramm. Remote Sens. 2012, 67, 93–104. [Google Scholar] [CrossRef]
  24. Horning, N.; Leutner, N.B.; Wegmann, M. Land cover and image classification approaches. In Remote Sensing and GIS for Ecologists; Wegmann, M., Leutner, B., Dech, S., Eds.; Pelagic Publishing: Exeter, UK, 2016; pp. 166–196. [Google Scholar]
  25. Lillesand, T.; Kiefer, R.W.; Chipman, J. Remote Sensing and Image Interpretation, 7th ed.; John Wiley & Sons, Inc.: Hoboken, NJ, USA, 2015. [Google Scholar]
  26. McGarigal, K.; Cushman, S.A.; Ene, E. FRAGSTATS v4: Spatial Pattern Analysis Program for Categorical Maps. Computer Software Program Produced by the Authors at the University of Massachusetts, Amhurst. Available online: http://www.umass.edu/landeco/research/fragstats/fragstats.html (accessed on 20 May 2016).
  27. McRae, B.H.; Kavanagh, D.M. Linkage Mapper Connectivity Analysis Software. Computer Software Program Produced by the Nature Conservancy in Seattle, WA, USA. Available online: http://www.circuitscape.org/linkagemapper (accessed on 16 April 2016).
  28. FUNAI—National Indian Foundation (Brazil). Available online: http://www.survivalinternational.org/about/funai (accessed on 4 May 2016).
  29. Da Silva, G.J. Os índios Kadiwéu na História: Problematizando fontes. In Proceedings of the XXIV Simpósio Nacional de História, São Leopoldo, Brazil, 26 June 2007; pp. 15–20.
  30. Conservation International. Semi-Annual Report 2002: Brazilian Biodiversity Corridor Implementation Program. Available online: http://pdf.usaid.gov/pdf_docs/PDACD214.pdf (accessed on 12 October 2015).
  31. Brooks, T.M.; Mittermeier, R.A.; da Fonseca, G.A.B.; Gerlach, J.; Hoffmann, M.; Lamoreux, J.F.; Mittermeier, C.G.; Pilgrim, J.D.; Rodrigues, A.S.L. Global biodiversity conservation priorities. Science 2006, 313, 58–61. [Google Scholar] [CrossRef] [PubMed]
  32. Butchart, S.H.M.; Walpole, M.; Collen, B.; van Strien, A.; Scharlemann, J.P.W.; Almond, R.E.A.; Baillie, J.E.M.; Bomhard, B.; Brown, C.; Bruno, J.; et al. Global biodiversity: Indicators of recent declines. Science 2010, 328, 1164–1168. [Google Scholar] [CrossRef] [PubMed]
  33. Geldmann, J.; Barnes, M.; Coad, L.; Craigie, I.D.; Hockings, M.; Burgess, N.D. Effectiveness of terrestrial protected areas in reducing habitat loss and population declines. Biol. Conserv. 2013, 161, 230–238. [Google Scholar] [CrossRef]
  34. Rodrigues, A.S.L.; Akçakaya, H.R.; Andelman, S.J.; Bakarr, M.I.; Boitani, L.; Brooks, T.M.; Chanson, J.S.; Fishpool, L.D.C.; da Fonseca, G.A.B.; Gaston, K.J.; et al. Global gap analysis: Priority regions for expanding the global protected-area network. Bioscience 2004, 54, 1092–1100. [Google Scholar] [CrossRef]
  35. Françoso, R.D.; Brandão, R.; Nogueira, C.C.; Salmona, Y.B.; Machado, R.B.; Colli, G.R. Habitat loss and the effectiveness of protected areas in the Cerrado Biodiversity Hotspot. Nat. Conserv. 2015, 13, 35–40. [Google Scholar] [CrossRef]
  36. IUCN Protected Areas Category Ia. Available online: https://www.iucn.org/about/work/programmes/gpap_home/gpap_quality/gpap_pacategories/gpap_cat1a/ (accessed on 12 October 2015).
  37. Rylands, A.B.; Brandon, K. Brazilian protected areas. Conserv. Biol. 2005, 19, 612–618. [Google Scholar] [CrossRef]
  38. Cavalcanti, R.B.; Joly, C.A. Biodiversity and conservation priorities in the Cerrado region. In The Cerrados of Brazil: Ecology and Natural History of a Neotropical Savanna; Oliveira, P.S., Marquis, R.J., Eds.; Columbia University Press: New York, NY, USA, 2002; Volume 1, pp. 351–367. [Google Scholar]
  39. Overbeck, G.E.; Vélez-Martin, E.; Scarano, F.R.; Lewinsohn, T.M.; Fonseca, C.R.; Meyer, S.T.; Müller, S.C.; Ceotto, P.; Dadalt, L.; Durigan, G.; et al. Conservation in Brazil needs to include non-forest ecosystems. Divers. Distrib. 2015, 21, 1455–1460. [Google Scholar] [CrossRef]
  40. Silva, J.F.; Fariñas, M.R.; Felfili, J.M.; Klink, C.A. Spatial heterogeneity, land use and conservation in the Cerrado region of Brazil. J. Biogeogr. 2006, 33, 536–548. [Google Scholar] [CrossRef]
  41. Fearnside, P.M. Soybean cultivation as a threat to the environment in Brazil. Environ. Conserv. 2000, 28, 23–38. [Google Scholar] [CrossRef]
  42. Desbiez, A.L.J.; Kluyber, D. The role of Giant Armadillos (Priodontes maximus) as physical ecosystem engineers. Biotropica 2013, 45, 537–540. [Google Scholar] [CrossRef]
  43. Silveira, L.; de Almeida Jácomo, A.T.; Furtado, M.M.; Torres, N.M.; Sollmann, R.; Vynne, C. Ecology of the Giant Armadillo (Priodontes maximus) in the grasslands of Central Brazil. Edentata 2009, 8–10, 25–34. [Google Scholar] [CrossRef]
  44. Desbiez, A.L.J.; Kluyber, D.; Massocato, G.F.; Attias, N. Super Ordem Xenartra. In Biologia, Ecologia e Conservação de Mamíferos do Pantanal; Mourão, G.M., Tomas, W.M., Cheida, C.C., Eds.; 2017. Unpublished work. (In Portuguese) [Google Scholar]
  45. Brondizio, E.S.; Ostrom, E.; Young, O.R. Connectivity and the governance of multilevel social-ecological systems: The role of social capital. Ann. Rev. Environ. Resour. 2009, 34, 253–278. [Google Scholar] [CrossRef]
  46. Bennett, E.L.; Robinson, J.G. Hunting for the Snark. In Hunting for Sustainability in Tropical Forests; Robinson, J., Bennett, E., Eds.; Columbia University Press: New York, NY, USA, 2000; pp. 3–10. [Google Scholar]
  47. Fahrig, L. Effects of habitat fragmentation on biodiversity. Ann. Rev. Ecol. Evol. Syst. 2003, 34, 487–515. [Google Scholar] [CrossRef]
  48. Damascos, M.A.; Prado, C.H.B.A.; Ronquim, C.C. Bud composition, branching patterns and leaf phenology in Cerrado woody species. Ann. Bot. 2005, 96, 1075–1084. [Google Scholar] [CrossRef] [PubMed]
  49. Sano, E.E.; Ferreira, L.G.; Asner, G.P.; Steinke, E.T. Spatial and temporal probabilities of obtaining cloud-free Landsat images over the Brazilian tropical savanna. Int. J. Remote Sens. 2007, 28, 2739–2752. [Google Scholar] [CrossRef]
  50. SISLA. Available online: http://sisla.imasul.ms.gov.br/Downloads/dados_complementares/ (accessed on 12 June 2015).
  51. Wohlfart, C. Mapping threatened dry deciduous dipterocarp forest in South-east Asia for conservation management. Trop. Conserv. Sci. 2014, 7, 597–613. [Google Scholar]
  52. Welch, J.R.; Brondízio, E.S.; Hetrick, S.S.; Coimbra, C.E.A., Jr. Indigenous burning as conservation practice: Neotropical savanna recovery amid agribusiness deforestation in Central Brazil. PLoS ONE 2013, 8, 1–10. [Google Scholar] [CrossRef] [PubMed]
Figure 1. Land cover classification of Mato Grosso do Sul with: (a) Largest patches of Cerrado; (b) Gallery forests with fragmented Cerrado patches; (c) Other (non-native vegetation/agriculture) dominated landscape.
Land 05 00012 g001
Figure 2. Patch size variation in the Cerrado landscape ranging from 1–5000 km2.
Land 05 00012 g002
Figure 3. Habitat Connectivity and Least-Cost Path Analysis. (a) Habitat connectivity; (b) least-cost paths.
Land 05 00012 g003
Table 1. Mato Grosso do Sul landscape metrics.
Total Area (km2)Number of PatchesSelected Landscape Metrics
Mean Patch Size (ha)Mean Nearest Neighbor (km)
Cerrado Habitat Total58,458.62646,1939.050.33
Strictly Protected Areas911.21373223.830.14
Indigenous Lands3867.09511275.110.11
Table 2. Landscape area within protected and indigenous areas (km2).
Total AreaStrictly Protected%Sustainable Use%Indigenous%
Forest48,67413142.7045429.338051.65
Cerrado58,4599111.56672811.5138676.62
Other195,5483450.1833,68017.2213780.70
Water39611624.1050412.72180.45
Wetland51,8195731.1111992.3115643.02
358,461.0033050.924665313.0176322.13
Table 3. Mato Grosso do Sul habitat connectivity analysis (km).
CorridorEuclidean DistanceCost-Weighted DistanceLeast-Cost Path DistanceCost-Weighted Distance to Euclidean Distance Ratio
110.9955.9915.701.95
212.3331.4917.582.55
32.0314.066.036.93
413.5526.4236.005.09
Table 4. Mato Grosso do Sul error matrix for 2014 classification.
Reference DataRow TotalUser’s Accuracy
CerradoOther
Cerrado108421500.72
Other314194500.91
Column total139461600
Producer’s accuracy0.780.91
Overall accuracy = 88%; Kappa Coefficient (K) = 0.6674.

