
One Shared Region and Two Different Change Patterns: Land Use Change in the Binational Californian Mediterranean Region


Abstract
:
1. Introduction

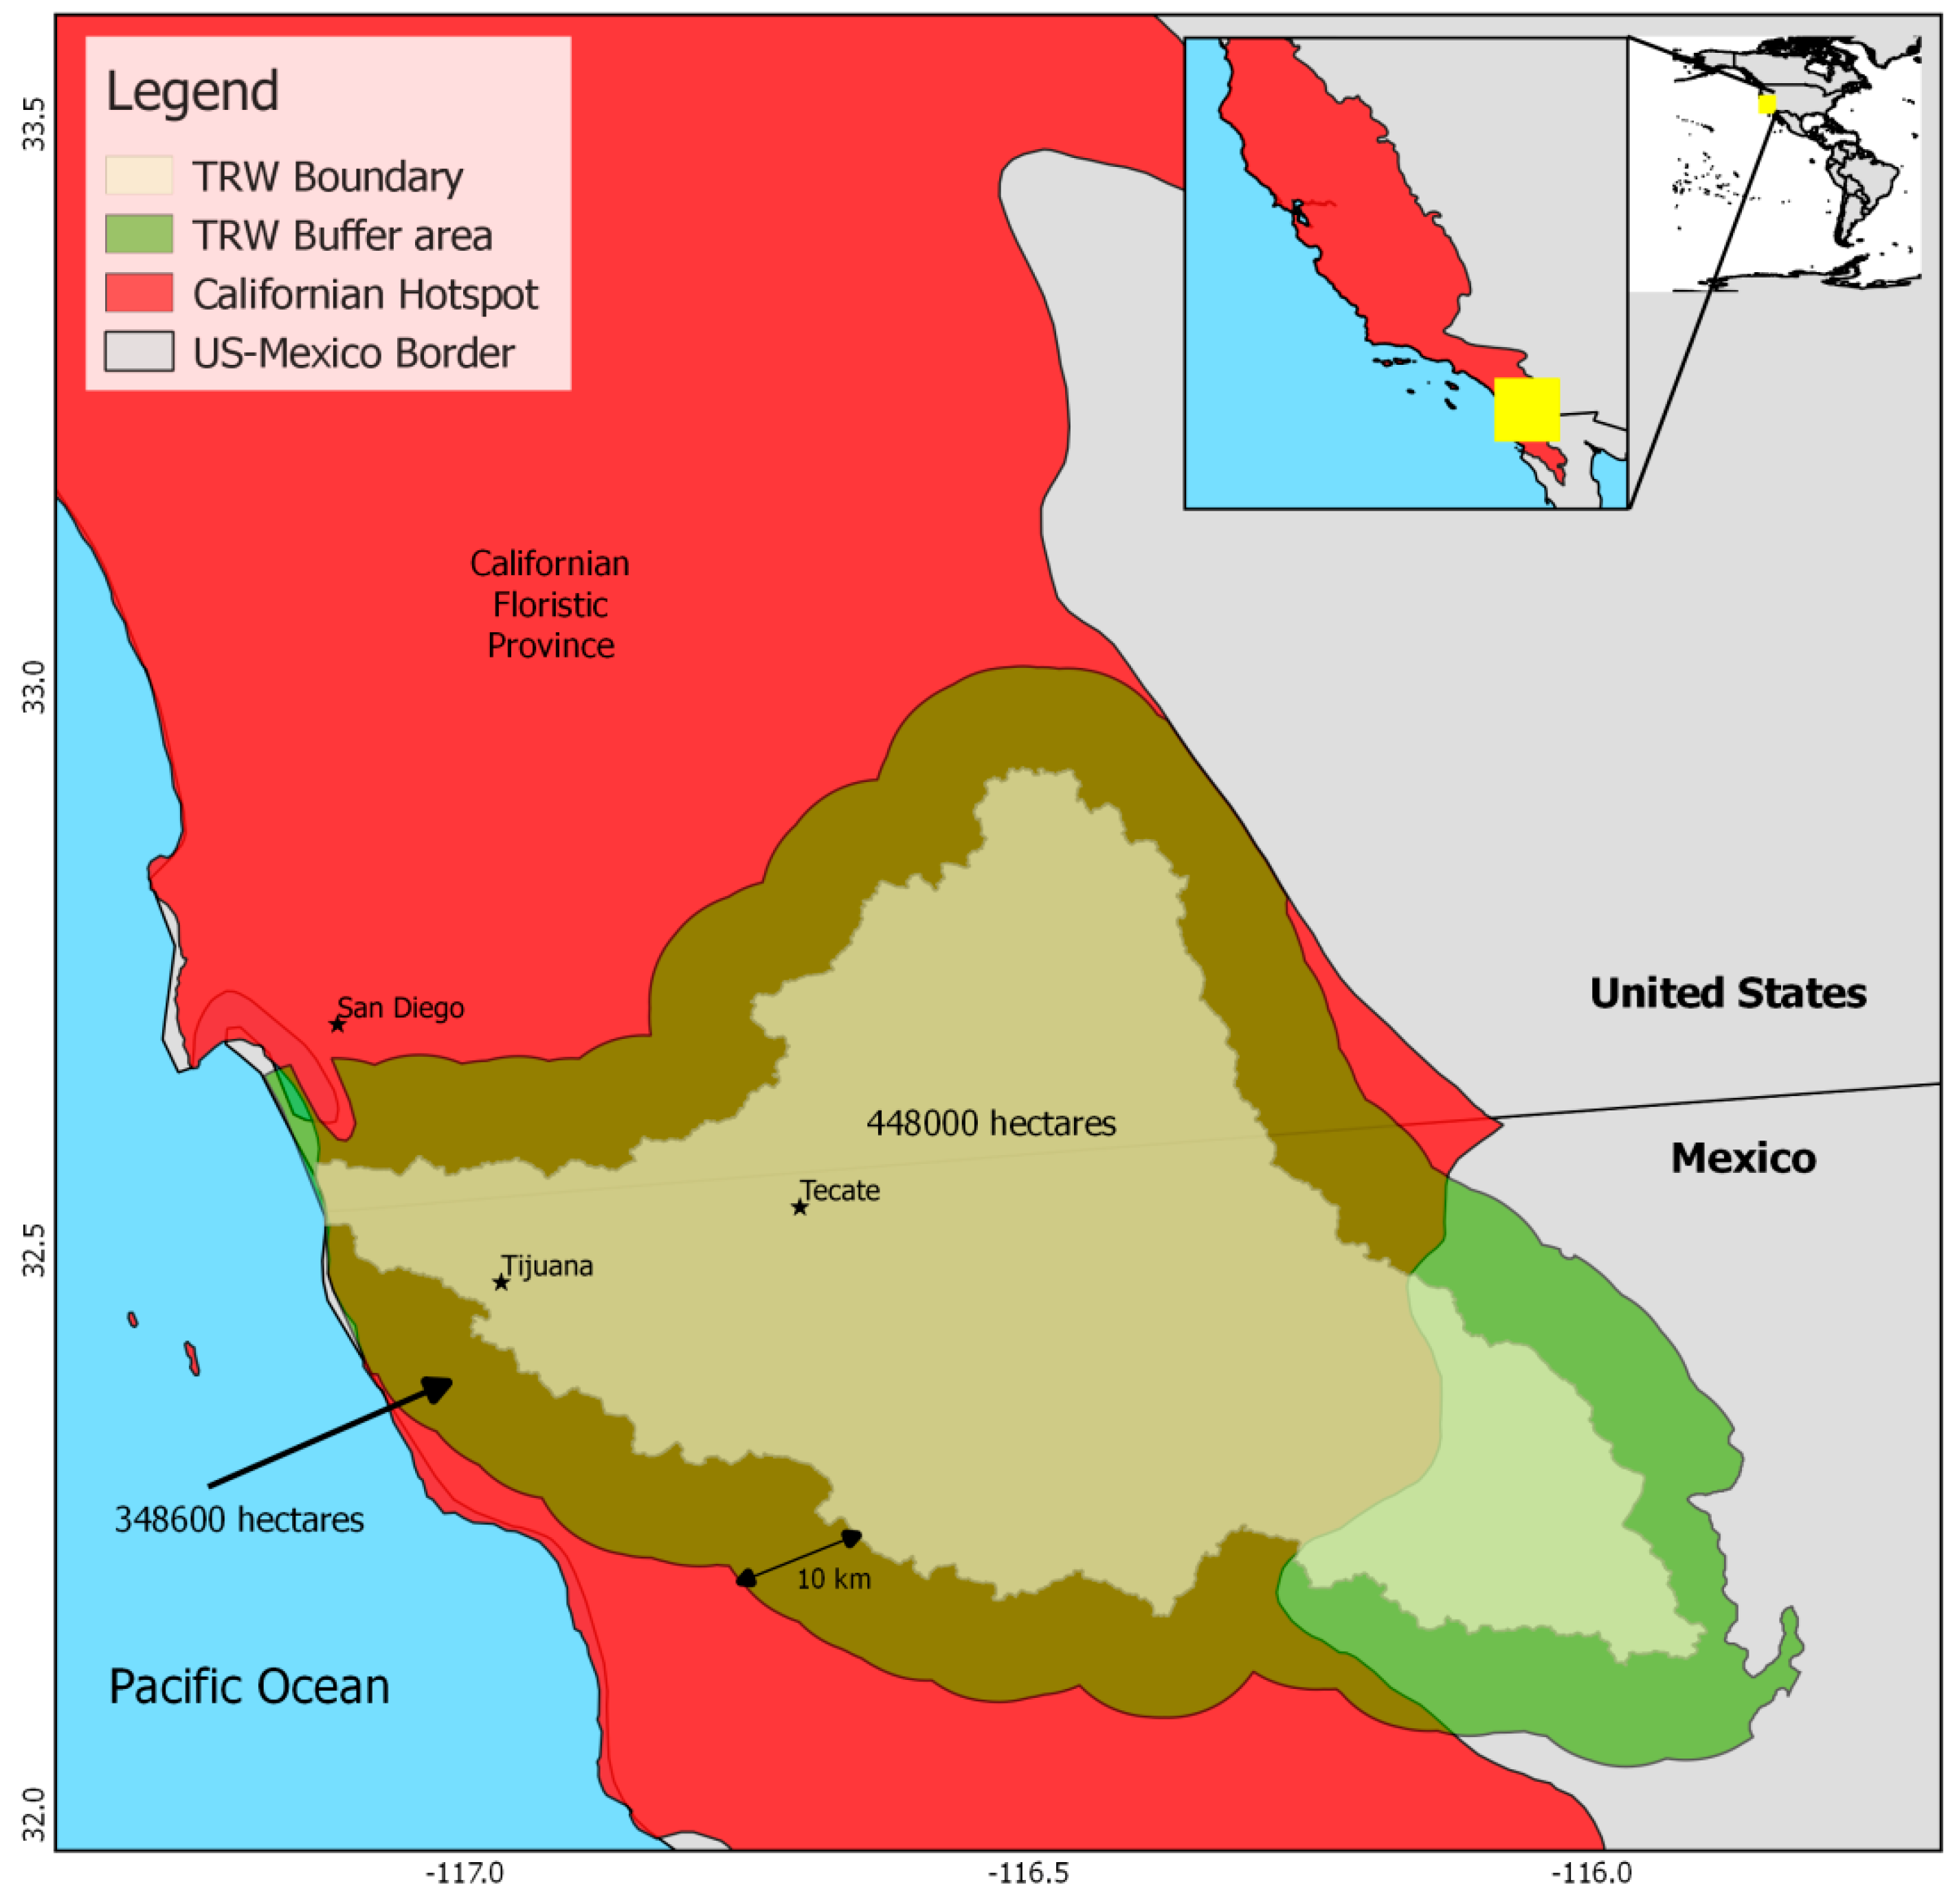
2. Study Area
3. Experimental Section (Methods)
3.1. Information Compilation

| Country | Raw Data Source | Resolution | Classification Method | # LUVC Classes |
|---|---|---|---|---|
| US | 1990 Landsat TM | 30 m | Unsupervised | 21 |
| 2011 Landsat TM | 30 m | Decision tree | 16 | |
| Mexico | 1993 Landsat TM | 30 m | Supervised | 8 |
| 2011 Landsat TM | 30 m | Supervised | 13 |
3.2. Land Use and Vegetation Cover Information Standardization
3.3. LUVC Change and Fragmentation Analyses
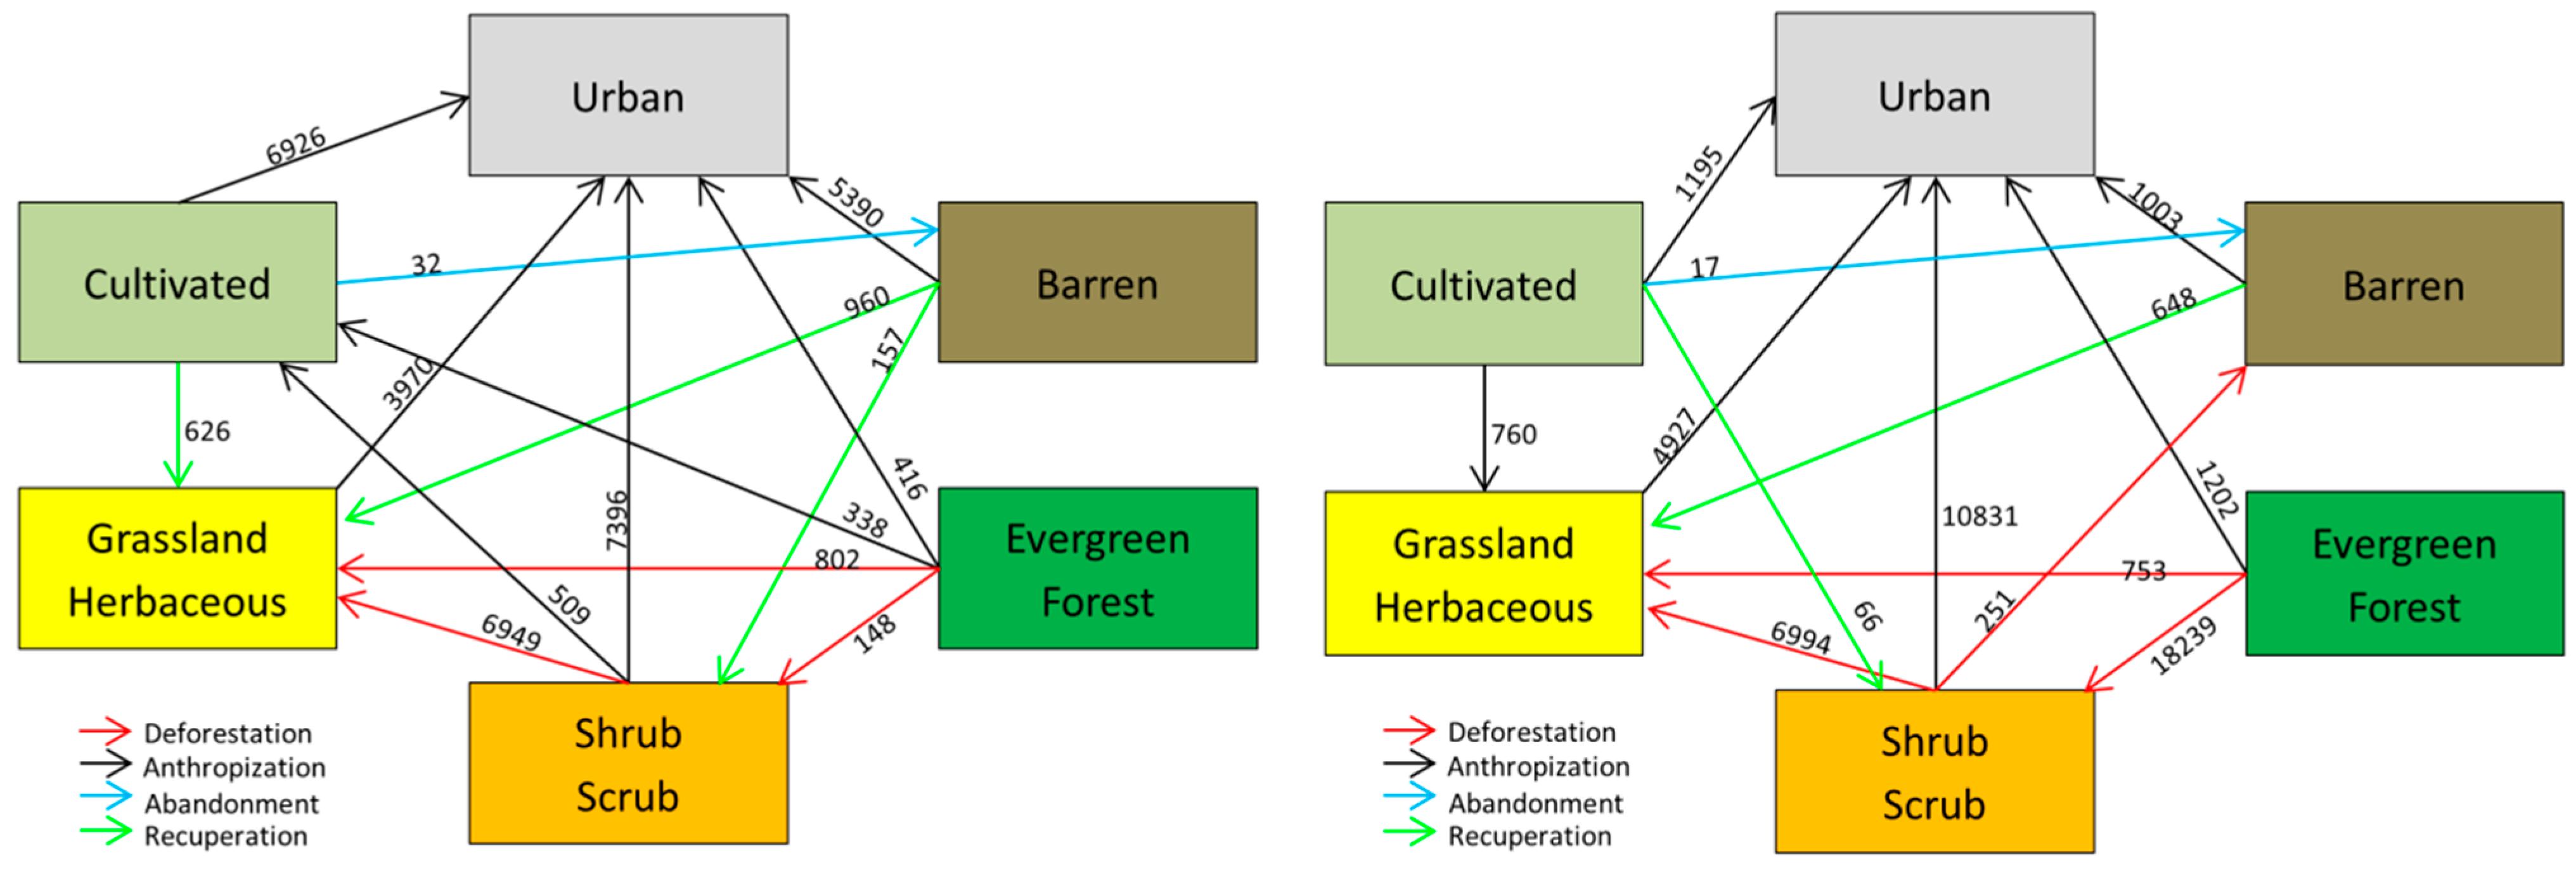
- Deforestation. Loss of primary or secondary natural vegetation cover.
- Anthropization. Change of natural vegetation cover to any predominantly human use, such as urban or cultivated.
- Abandonment. Change of cultivated, agricultural or livestock use to a Barren. Changes in any of these original categories to something different than barren are classified either as anthropization or as recovery, depending on the change.
- Recovery. Change of any non-natural vegetation land use or cover to any natural vegetation cover.
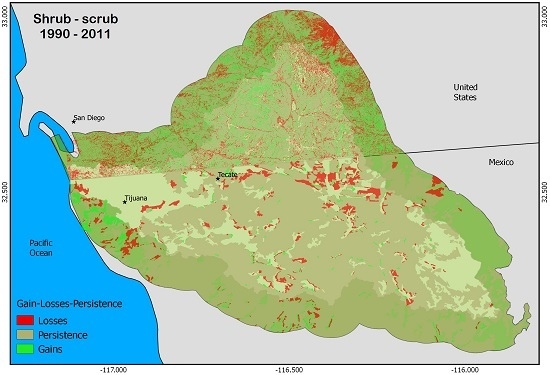
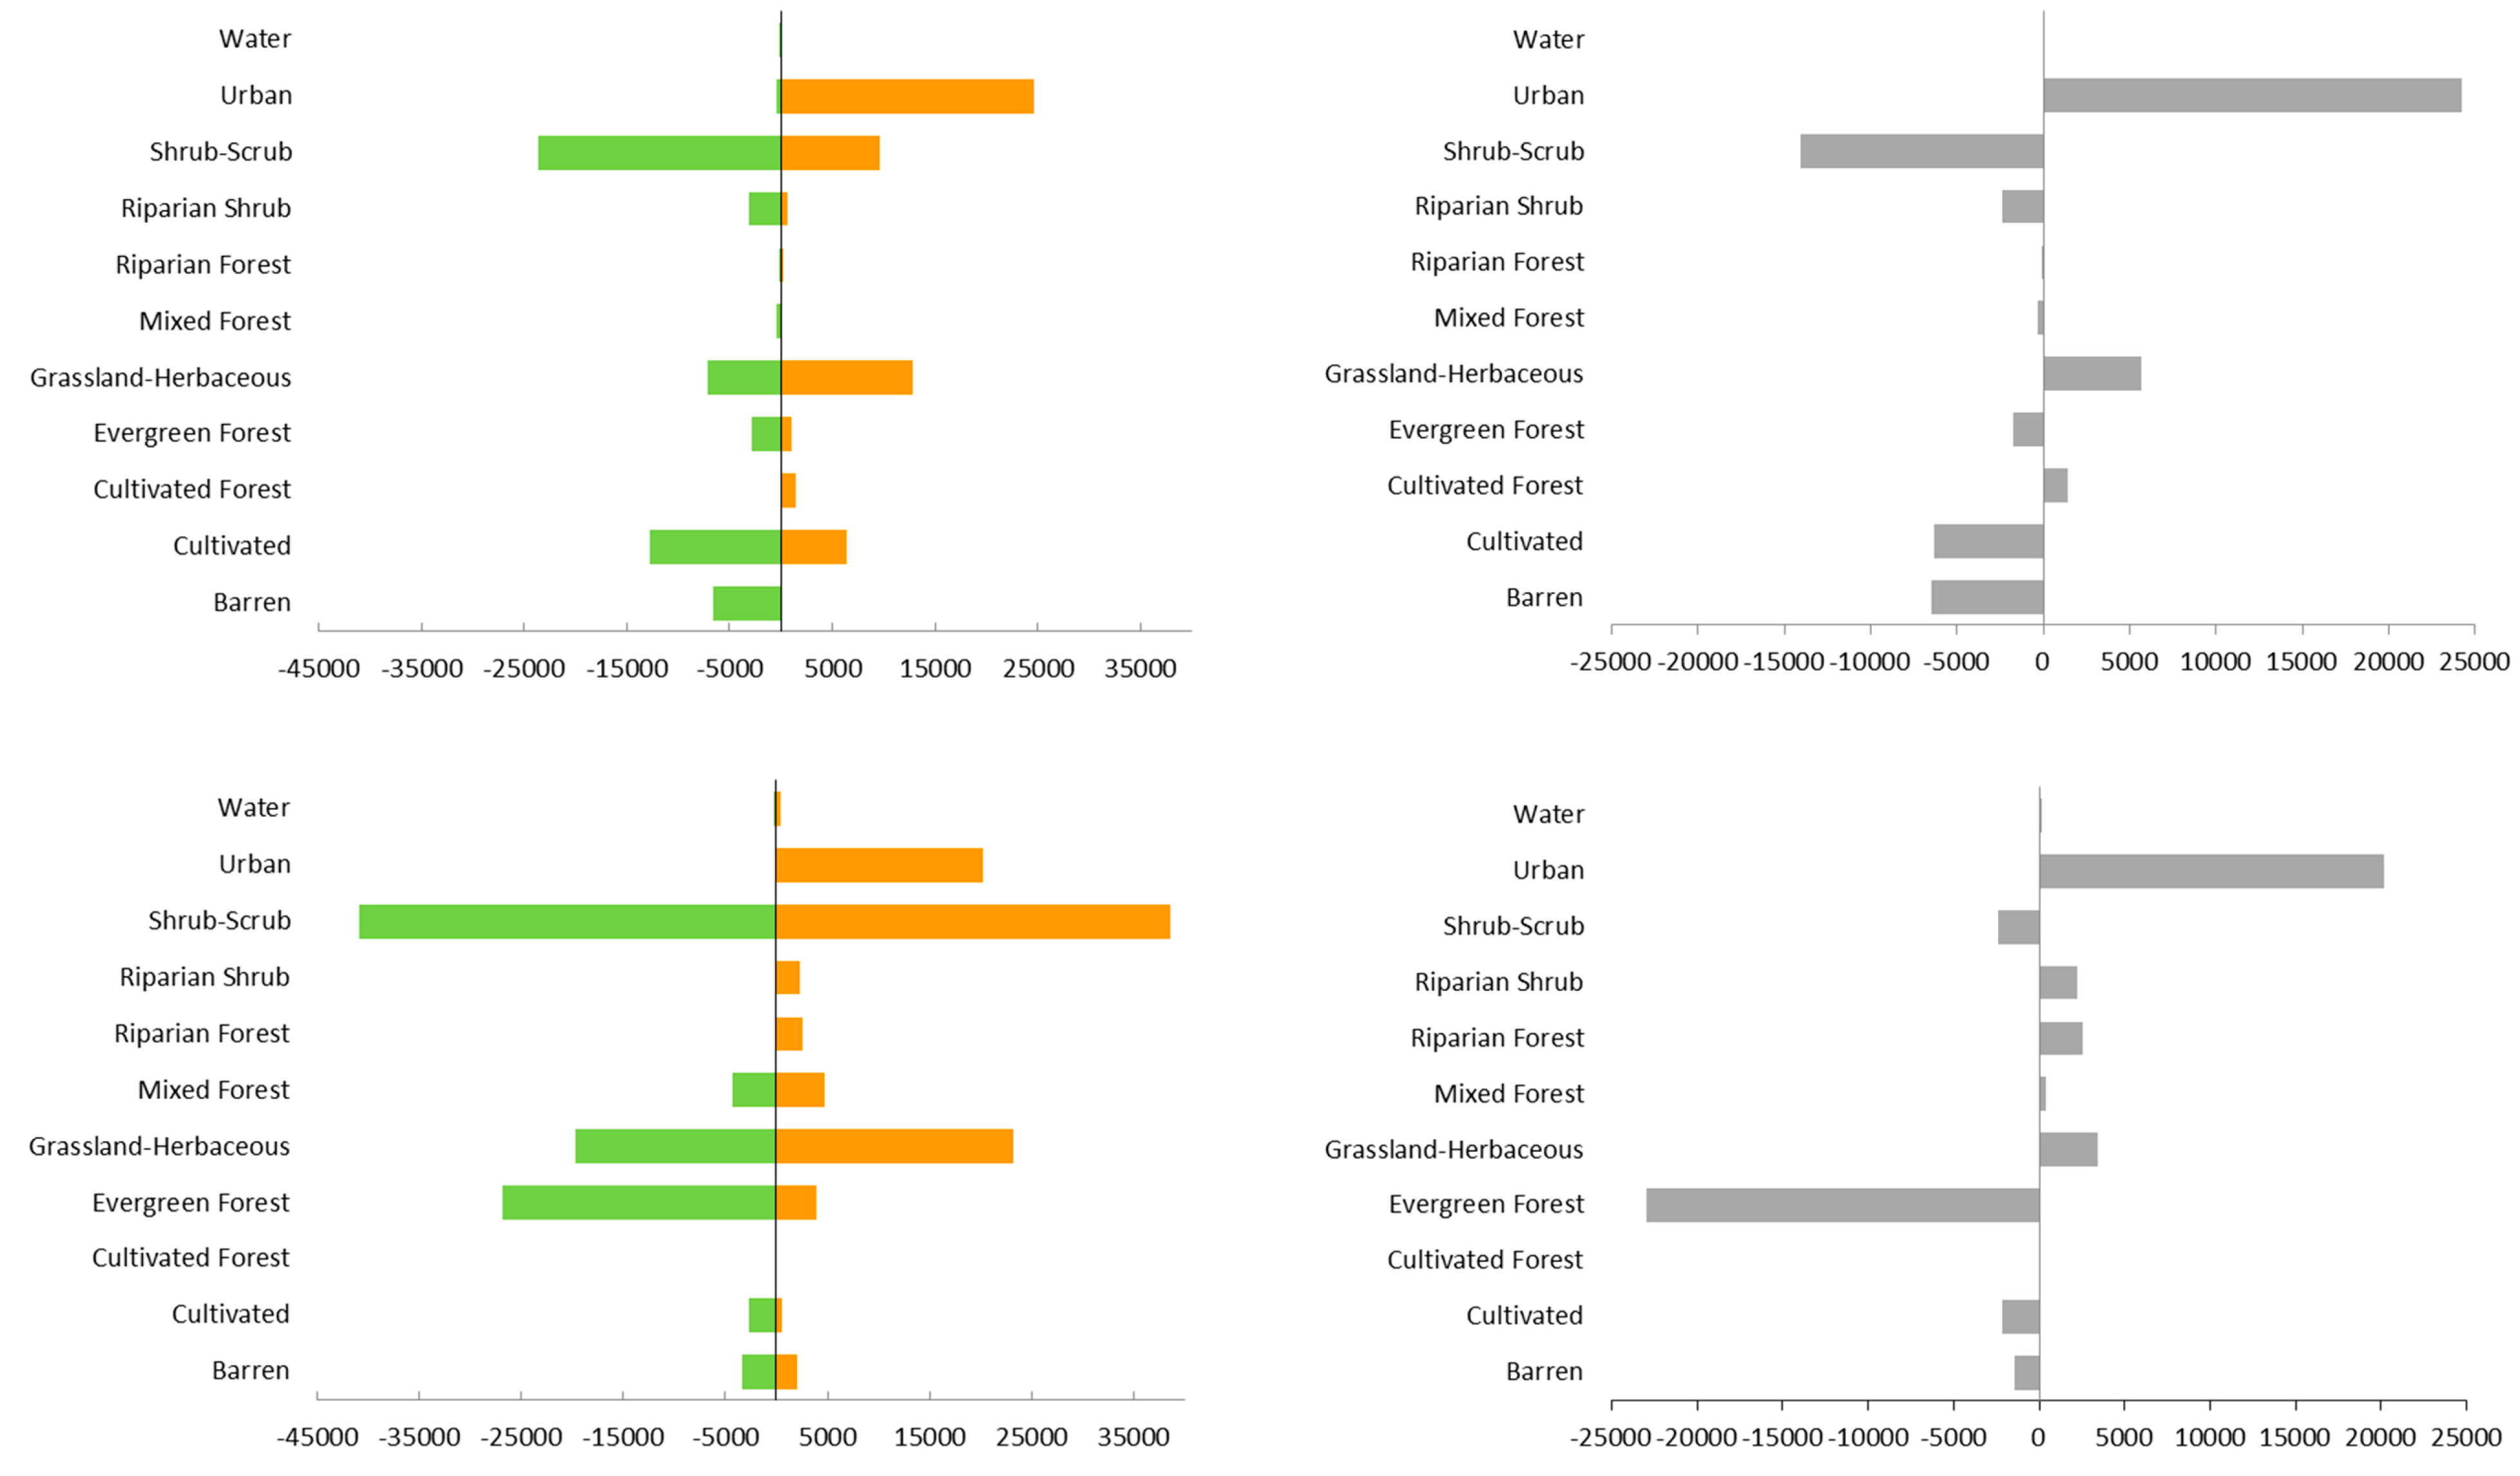
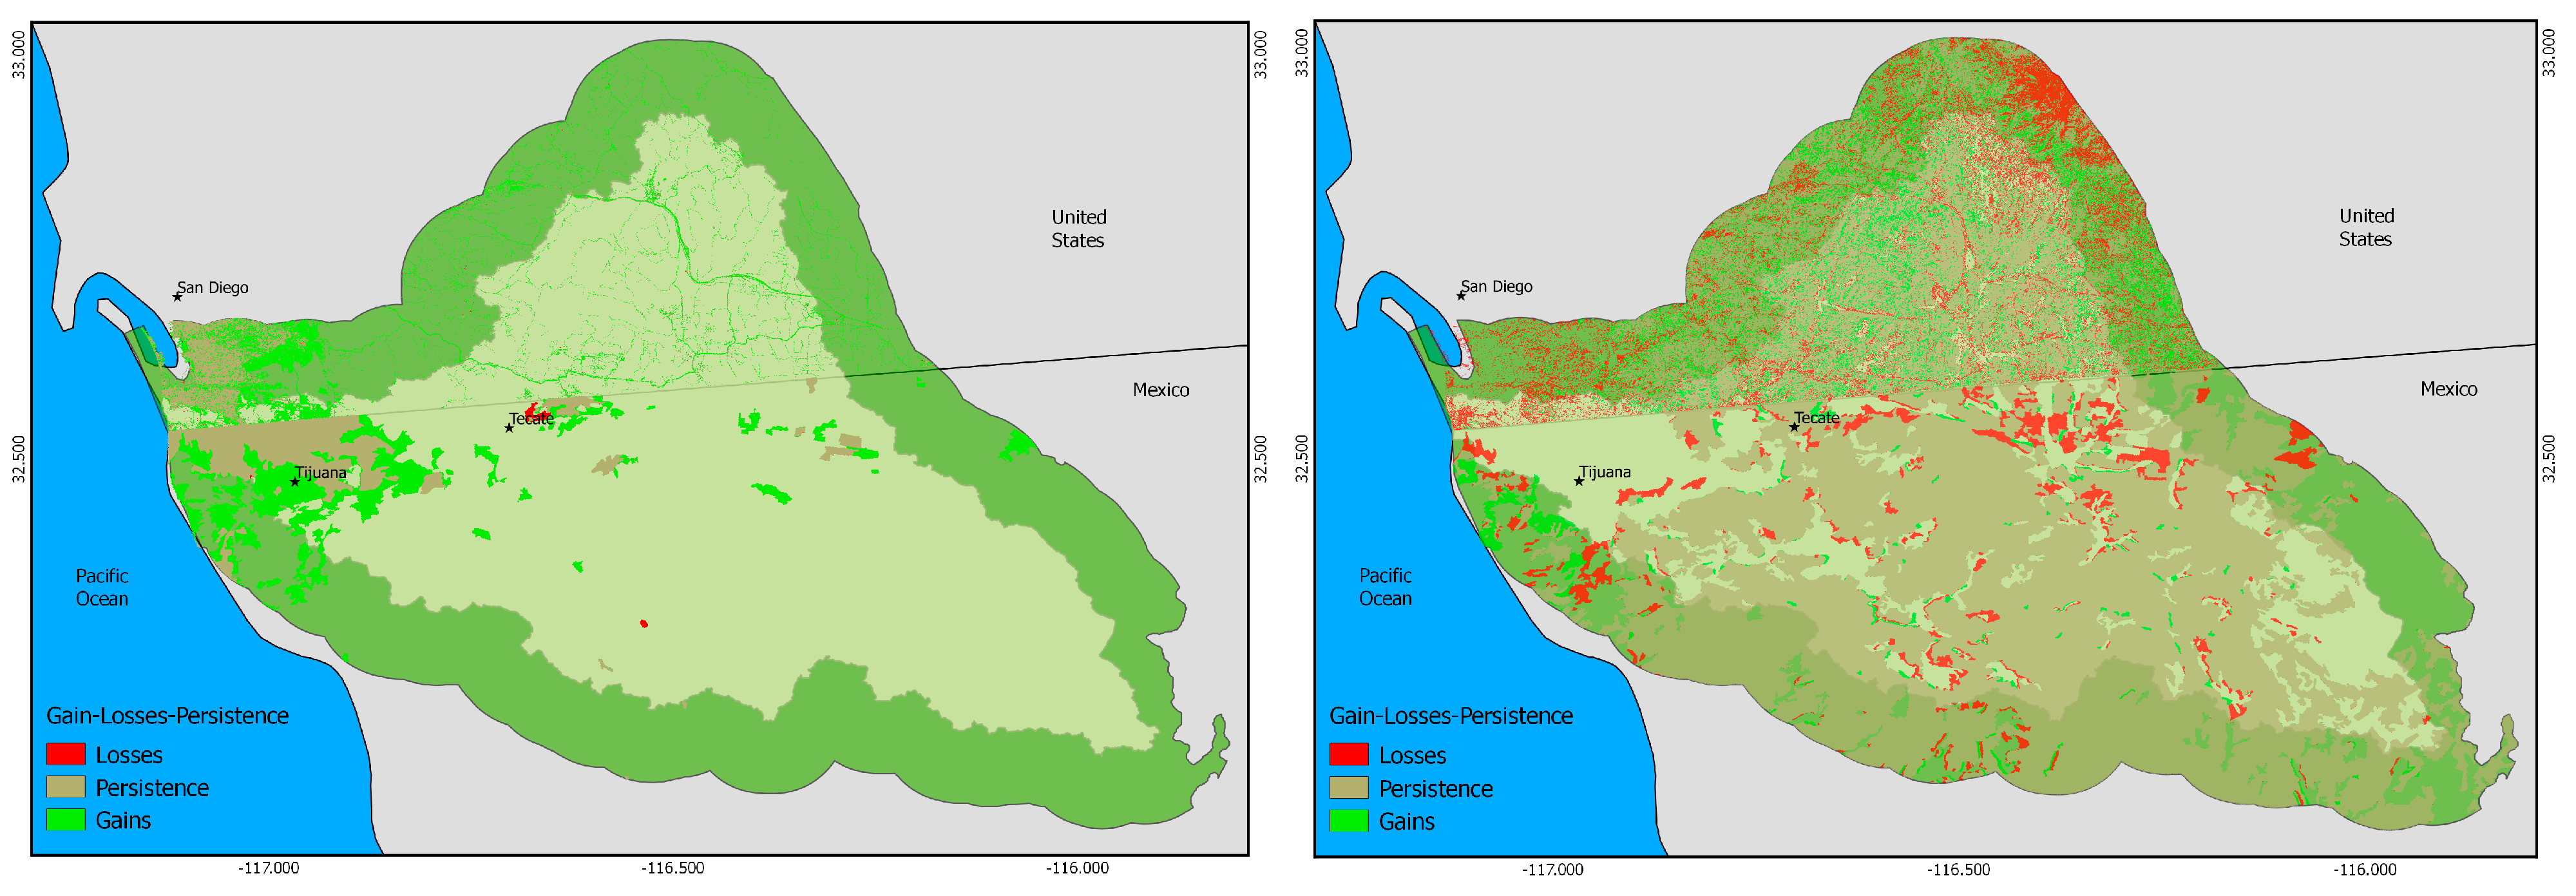
4. Results and Discussion

| Land Cover Classes (Mexico) as Published in Spanish | Land Cover Classes (United States) | Standardized Class Number | Standardized Class Name |
|---|---|---|---|
| Cuerpo de Agua | Open Water | 1 | Water |
| Urbano/Asentamiento Humano | Urban/Developed | 2 | Urban |
| Sin Vegetación | Barren | 3 | Barren |
| Bosque de Pino | Evergreen Forest | 4 | Evergreen Forest |
| Bosque de Pino | Evergreen Forest | 4 | Evergreen Forest |
| Bosque de Juniperus | Evergreen Forest | 4 | Evergreen Forest |
| Bosque de Pino | Evergreen Forest | 4 | Evergreen Forest |
| Bosque de Pino | Evergreen Forest | 4 | Evergreen Forest |
| Bosque de Encino | Mixed Forest | 5 | Mixed Forest |
| Bosque de Encino | Mixed Forest | 5 | Mixed Forest |
| Chaparral | Shrub/Scrub | 6 | Shrub-Scrub |
| Chaparral | Shrub/Scrub | 6 | Shrub-Scrub |
| Matorral Rosetofilo Costero | Shrub/Scrub | 6 | Shrub-Scrub |
| Matorral Desertico Microfilo | Shrub/Scrub | 6 | Shrub-Scrub |
| Matorral Desertico Rosetofilo | Shrub/Scrub | 6 | Shrub-Scrub |
| Chaparral | Shrub/Scrub | 6 | Shrub-Scrub |
| Pastizal Inducido | Grassland/Herbaceous | 7 | Grassland -Herbaceous |
| Pastizal Inducido | Grassland/Herbaceous | 7 | Grassland -Herbaceous |
| Pastizal Inducido | Grassland/Herbaceous | 7 | Grassland -Herbaceous |
| Pastizal Inducido | Grassland/Herbaceous | 7 | Grassland -Herbaceous |
| Agrícola y varios agrícola | Cultivated cropland | 8 | Cultivated |
| Agrícola y varios agrícola | Cultivated cropland | 8 | Cultivated |
| Agrícola y varios agrícola | Cultivated cropland | 8 | Cultivated |
| Bosque de Galería | Woody Wetlands | 9 | Riparian Forest |
| Bosque de Galería | Woody Wetlands | 9 | Riparian Forest |
| Vegetación de Galería | Herbaceous Wetlands | 10 | Riparian Shrub |
| Vegetación de Galería | Herbaceous Wetlands | 10 | Riparian Shrub |
| Vegetación de Galería | Herbaceous Wetlands | 10 | Riparian Shrub |
| Bosque Inducido | NA | 11 | Cultivated Forest |
| Mexico | United States | |||||||||
|---|---|---|---|---|---|---|---|---|---|---|
| LUVC | 1993 (ha) | % of Total | 2011 (ha) | % of Total | Observed Change (ha) | 1990 (ha) | % of Total | 2011 (ha) | % of Total | Observed Change (ha) |
| Water 1,2 | 694.44 | 0.13 | 705.24 | 0.13 | 10.8 | 11,610.00 | 4.51 | 11,754.72 | 4.56 | 144.72 |
| Urban 1,2 | 19,847.16 | 3.80 | 44,066.07 | 8.43 | 24,218.91 | 9035.73 | 3.51 | 29,205.63 | 11.34 | 20,169.9 |
| Barren | 6653.34 | 1.27 | 178.65 | 0.03 | −6474.69 | 3613.86 | 1.40 | 2214.72 | 0.86 | −1399.14 |
| Evergreen Forest 1 | 69,983.46 | 13.39 | 68,260.77 | 13.06 | −1722.69 | 31,542.84 | 12.25 | 8563.86 | 3.32 | −22,978.98 |
| Mixed Forest 2 | 1450.17 | 0.28 | 1092.51 | 0.21 | −357.66 | 4461.39 | 1.73 | 4851.54 | 1.88 | 390.15 |
| Shrub-Scrub 1 | 352,368.45 | 67.43 | 338,304.51 | 64.73 | −14,063.94 | 159,784.56 | 62.03 | 157,422.42 | 61.11 | −2362.14 |
| Grassland-Herbaceous 1,2 | 30,573.45 | 5.85 | 36,239.49 | 6.93 | 5666.04 | 34,361.91 | 13.34 | 37,796.4 | 14.67 | 3434.49 |
| Cultivated1 | 36,333 | 6.95 | 30,023.37 | 5.74 | −6309.63 | 2941.74 | 1.14 | 819.27 | 0.32 | −2122.47 |
| Riparian Forest 1,2 | 516.15 | 0.10 | 507.24 | 0.10 | −8.91 | 42.66 | 0.02 | 2553.48 | 0.99 | 2510.82 |
| Riparian Shrub 2 | 4185.81 | 0.80 | 1782.99 | 0.34 | −2402.82 | 199.26 | 0.08 | 2411.91 | 0.94 | 2212.65 |
| Cultivated Forest | 0 | 0.00 | 1444.59 | 0.28 | 1444.59 | 0.00 | 0.00 | 0 | 0.00 | 0 |
| TOTAL | 522,605.43 | 100 | 522,605.43 | 100 | 257,593.95 | 100 | 257,593.95 | 100 | ||
| LUVC Categories | Rank by Occupied Area in Mexico | Rank by Occupied Area in the U.S. | ||
|---|---|---|---|---|
| 1993 | 2011 | 1990 | 2011 | |
| Shrub-Scrub | 1 | 1 | 1 | 1 |
| Evergreen Forest | 2 | 2 | 3 | 4 |
| Cultivated | 3 | 5 | 6 | 6 |
| Grassland-Herbaceous | 4 | 4 | 2 | 2 |
| Urban | 5 | 3 | 4 | 3 |
| Barren | 6 | 6 | 5 | 5 |


| Number of Patches | Mean Patch Area (ha) | |||
|---|---|---|---|---|
| Country/Year | 1993 | 2011 | 1990 | 2011 |
| Mexico | 373 | 359 | 1422 | 1029.76 |
| U.S. | 124364 | 14635 | 8.5 | 16.27 |
| Mexico | United States | |||||||
|---|---|---|---|---|---|---|---|---|
| 1993 | 2011 | 1990 | 2011 | |||||
| Number of Patches | Mean Patch Area (ha) | Number of Patches | Mean Patch Area (ha) | Number of Patches | Mean Patch Area (ha) | Number of Patches | Mean Patch Area (ha) | |
| Water | 3 | 231.48 | 4 | 176.31 | 154 | 75.39 | 274 | 42.90 |
| Urban | 18 | 1102.62 | 38 | 1159.63 | 3037 | 2.98 | 923 | 31.64 |
| Barren | 1 | 6653.34 | 2 | 89.33 | 12755 | 0.28 | 721 | 3.07 |
| Evergreen Forest | 65 | 1076.67 | 55 | 1241.10 | 37191 | 0.85 | 1330 | 6.44 |
| Mixed Forest | 22 | 65.92 | 10 | 109.25 | 23407 | 0.19 | 1733 | 2.80 |
| Shrub-Scrub | 66 | 5338.92 | 56 | 6041.15 | 14367 | 11.12 | 2528 | 62.27 |
| Grassland-Herbaceous | 102 | 299.74 | 104 | 348.46 | 29468 | 1.17 | 5730 | 6.60 |
| Cultivated | 71 | 511.73 | 73 | 411.28 | 3337 | 0.88 | 52 | 15.76 |
| Riparian Forest | 3 | 172.05 | 3 | 169.08 | 262 | 0.16 | 772 | 3.31 |
| Riparian Shrub | 22 | 190.26 | 13 | 137.15 | 386 | 0.52 | 572 | 4.22 |
| Cultivated Forest | 0 | 0.00 | 1 | 1444.59 | 0 | 0.00 | 0 | 0.00 |
| TOTAL | 373 | 359 | 124364 | 14635 | ||||
5. Conclusions
Acknowledgments
Author Contributions
Conflicts of Interest
References
- Myers, N.; Mittermeier, R.A.; Mittermeier, C.G.; da Fonseca, G.A.; Kent, J. Biodiversity hotspots for conservation priorities. Nature 2000, 403, 853–858. [Google Scholar] [CrossRef] [PubMed]
- Riemann, H.; Exequiel, E. Endemic regions of the vascular flora of the Peninsula of Baja California, Mexico. J. Veg. Sci. 2007, 18, 327–336. [Google Scholar] [CrossRef]
- Conservation International. Biodiversity Hotspots: California Floristic Province. Available online: http://www.cepf.net/resources/hotspots/North-and-Central-America/Pages/California-Floristic-Province.aspx (accessed on 18 March 2015).
- Lesschen, J.P.; Verburg, P.H.; Staal, S.J. Statistical Methods for Analysing the Spatial Dimension of Changes in Land Use and Farming Systems; International Livestock Research Institute: Nairobi, Kenya; Wageningen, The Netherlands, 2005. [Google Scholar]
- Bürgi, M.; Hersperger, A.M.; Schneeberger, N. Driving forces of landscape change—Current and new directions. Landsc. Ecol. 2004, 19, 857–868. [Google Scholar] [CrossRef]
- Hannah, L.; Carr, J.L.; Lankerani, A. Human disturbance and natural habitat: A biome level analysis of a global data set. Biodivers. Conserv. 1995, 4, 128–155. [Google Scholar] [CrossRef]
- Ganster, P.; Sweedler, A.; Clement, N. Development, growth, and the future of the border environment. In The Us-Mexican Border Environment: A Road Map to a Sustainable 2020; Ganster, P., Ed.; San Diego State University Press: San Diego, CA, USA, 2000; pp. 73–103. [Google Scholar]
- Ganster, P.; Pijawka, D.; Rasmussen, P.W.; Van Schoik, R. Overview. In The Us-Mexican Border Environment: A Road Map to a Sustainable 2020; Ganster, P., Ed.; San Diego State University Press: San Diego, CA, USA, 2000. [Google Scholar]
- Spalding, M. Addressing border environmental problems now and in the future: Border XXI and related efforts. In The Us-Mexican Border Environment: A Road Map to a Sustainable 2020; San Diego State University Press: San Diego, CA, USA, 2000; pp. 105–137. [Google Scholar]
- Ojeda-Revah, L.; Bocco, G.; Ezcurra, E.; Espejel, I. Land-cover/use transitions in the binational Tijuana River Watershed during a period of rapid industrialization. Appl. Veg. Sci. 2008, 11, 107–116. [Google Scholar] [CrossRef]
- Atkinson, E.E. Linking Land Use and Policy in the Tijuana River Watershed; San Diego State University: San Diego, CA, USA, 2009. [Google Scholar]
- Comber, A.J.; Fisher, P.F.; Wadsworth, R.A. What is land cover? Environ. Plan. B Plan. Des. 2005, 32, 199–209. [Google Scholar] [CrossRef]
- Fisher, P. Re-Presenting GIS; John Wiley & Sons: Hoboken, NJ, USA, 2005. [Google Scholar]
- Comber, A.J. The separation of land cover from land use using data primitives. J. Land Use Sci. 2008, 3, 215–229. [Google Scholar] [CrossRef]
- Anderson, J.R.; Hardy, E.E.; Roach, J.T.; Timer, R.E. A Land Use and Land Cover Classification System for Use with Remote Sensor Data; Geological Survey Professional Paper 964; U.S. Government Printing Office: Washington, DC, USA, 1976.
- Ojeda-Revah, L.; Espejel-Carbajal, M.I. La cuenca binacional del río tijuana: Un enfoque biohistórico. Econ. Soc. Territ. 2008, 8, 517–548. [Google Scholar]
- Biggs, T.W.; Atkinson, E.; Powell, R.; Ojeda-Revah, L. Land cover following rapid urbanization on the U.S.–Mexico border: Implications for conceptual models of urban watershed processes. Landsc. Urban Plan 2010, 96, 78–87. [Google Scholar] [CrossRef]
- Farley, K.A.; Ojeda-Revah, L.; Atkinson, E.E.; Eaton-González, B.R. Changes in land use, land tenure, and landscape fragmentation in the Tijuana River Watershed following reform of the ejido sector. Land Use Policy 2012, 29, 187–197. [Google Scholar] [CrossRef]
- Bocco, G. The Tijuana River Watershed Geographic Information System: A Tool for Shared Management. In Identifying Priorities for a Geographic Information System (GIS) for the Tijuana River Watershed: Applications for Land Use, Planning and Education; Wright, R., Ries, K., Winckell, A., Eds.; Institute for Regional Studies of the Californias, San Diego State University: San Diego, CA, USA, 1995; pp. 15–18. [Google Scholar]
- Zedler, J.B.; Nordby, C.S.; Kus, B.E. The Ecology of Tijuana Estuary, California: A National Estuarine Research Reserve; NOAA Office of Coastal Resource Management, Santuaries and Reserves Division: Washington, DC, USA, 1992. [Google Scholar]
- Ganster, P. Introduction. In Tijuana River Watershed Atlas/Atlas de la Cuenca del río Tijuana; Wright, R., Vela, P., Ganster, P., Eds.; San Diego State University Press: San Diego, CA, USA, 2005; p. 1. [Google Scholar]
- Center for Earth System Analysis Research (CESAR). Tijuana River Watershed Digital Boundary File. Vector digital file from Tijuana River Watershed GIS Database. Available online: http://geography.sdsu.edu/Resources/Data/Clearinghouse/trw.php (accessed on 17 April 2012).
- Commission for Environmental Cooperation (CEC). Terrestrial Ecoregions. Vector Digital Data. Available online: http://www.cec.org/naatlas/ (accessed on 17 April 2012).
- Institute for Regional Studies of the Californias and the Department of Geography at San Diego State University. A Binational Vision for the Tijuana River Watershed. 2005. Available online: http://irsc.sdsu.edu/docs/pubs/Tijuana_River_Watershed_Binational_Vision.pdf (accessed on 7 August 2015).
- Wright, R. Introduction. In Identifying Priorities for a Geographic Information System (GIS) for the Tijuana River Watershed: Applications for Land Use, Planning and Education; Wright, R., Ries, K., Winckell, A., Eds.; Institute for Regional Studies of the Californias, San Diego State University: San Diego, CA, USA, 1995; pp. 1–2. [Google Scholar]
- Wright, R. Topography. In Tijuana River Watershed Atlas/Atlas de la Cuenca del río Tijuana; Wright, R., Vela, P., Ganster, P., Eds.; San Diego State University Press: San Diego, CA, USA, 2005; p. 5. [Google Scholar]
- Deméré, T.A. Geology: Generalized rock types and faults. In Tijuana River Watershed Atlas/Atlas de la Cuenca del río Tijuana; Wright, R., Vela, R., Ganster, P., Eds.; San Diego State University Press: San Diego, CA, USA, 2005; p. 6. [Google Scholar]
- Winckel, A. Geomorphology. In Tijuana River Watershed Atlas/Atlas de la Cuenca del río Tijuana; Wright, R., Vela, R., Ganster, P., Eds.; San Diego State University Press: San Diego, CA, USA, 2005; p. 7. [Google Scholar]
- Aguado, E. Temperature and precipitacion. In Tijuana River Watershed Atlas/Atlas de la Cuenca del río Tijuana; Wright, R., Vela, R., Ganster, P., Eds.; San Diego State University Press: San Diego, CA, USA, 2005; pp. 10–11. [Google Scholar]
- Conservation Biology Institute. La Posta Linkage Portfolio, San Diego County, California. 2003. Available online: http://www.sandiegocounty.gov/content/dam/sdc/pds/ceqa/Soitec-Documents/Final-EIR-Files/references/rtcref/ch9.0/rtcrefaletters/O14%202014-12-19_CBI2003.pdf (accessed on 14 August 2013). [Google Scholar]
- Lu, D.; Moran, E.; Hetrick, S.; Li, G. Land-use and land-cover change detection. In Advances in Environmental Remote Sensing: Sensors, Algorithms, and Applications; CRC Press: New York, NY, USA, 2011; pp. 273–290. [Google Scholar]
- Pontius, R.G.; Shusas, E.; McEachern, M. Detecting important categorical land changes while accounting for persistence. Agric. Ecosyst. Environ. 2004, 101, 251–268. [Google Scholar] [CrossRef]
- Eastman, J.R. IDRISI Selva Manual, Manual Version 17; Clark University: Worcester, MA, USA, 2012. [Google Scholar]
- Mishra, V.N.; Rai, P.K.; Mohan, K. Prediction of land use changes based on land change modeler (LCM) using remote sensing: A case study of muzaffarpur (Bihar), India. J. Geogr. Inst. Jovan Cvijic SASA 2014, 64, 111–127. [Google Scholar] [CrossRef]
- Pontius, R.G., Jr.; Chen, H. Land Change Modeling with GEOMOD; Clark University: Worcester, MA, USA, 2006. [Google Scholar]
- De Alba, H.; Barros, J. Deforestation in the kayabi indigenous territory: Simulating and predicting land use and land cover change in the brazilian amazon. In Proceedings of the III Coloquio Internacional en Geografia, Michoacán, México, 21–24 March 2012.
- Garibay, C.; Bocco, G. Cambios de uso del Suelo en la Meseta Purépecha (1976–2005); INE-SEMARNAT & CIGA-UNAM: Mexico, D.F., Mexico, 2011. [Google Scholar]
- Bonilla-Moheno, M.; Redo, D.J.; Aide, T.M.; Clark, M.L.; Grau, H.R. Vegetation change and land tenure in Mexico: A country-wide analysis. Land Use Policy 2013, 30, 355–364. [Google Scholar] [CrossRef]
- Lambin, E.F.; Turner, B.L.; Geist, H.J.; Agbola, S.B.; Angelsen, A.; Bruce, J.W.; Xu, J. The causes of land-use and land-cover change: Moving beyond the myths. Glob. Environ. Chang. 2001, 11, 261–269. [Google Scholar] [CrossRef]
- Fahrig, L. Effects of habitat fragmentation on biodiversity. Annu. Rev. Ecol. Evol. Syst. 2003, 34, 487–515. [Google Scholar] [CrossRef]
- Stallcup, J.A.; Randall, J.M.; Smith, T.; Cohen, B.S.; Guerrero Avila, C.; Vargas, M.A.; Morrison, S.A. Las Californias Binational Conservation Initiative 2015: A Decadal Review of Conservation Status of the California—Baja California Border Region; The Nature Conservancy: Arlington County, VA, USA, 2015. [Google Scholar]
- Castro-Ruiz, J.L.; Ganster, P.; Wright, R.; Comer, K.; Silvan, L.; Saxod, E.; Zúñiga, W. Beyond the generation of data for watershed management: The experience of the Tijuana River Bi-National Watershed Advisory Council. Presented at the Border Institute VIII Cooperation on Planning and Operation of Trans-boundary Watersheds: Sharing Data across Borders, Rio Rico, AZ, USA, 22–24 May 2006; Available online: http://scerpfiles.org/bi/bi-viii/papers.htm (accessed on 7 August 2015).
© 2015 by the authors; licensee MDPI, Basel, Switzerland. This article is an open access article distributed under the terms and conditions of the Creative Commons Attribution license (http://creativecommons.org/licenses/by/4.0/).
Share and Cite
Eaton-Gonzalez, R.; Mellink, E. One Shared Region and Two Different Change Patterns: Land Use Change in the Binational Californian Mediterranean Region. Land 2015, 4, 1138-1154. https://doi.org/10.3390/land4041138
Eaton-Gonzalez R, Mellink E. One Shared Region and Two Different Change Patterns: Land Use Change in the Binational Californian Mediterranean Region. Land. 2015; 4(4):1138-1154. https://doi.org/10.3390/land4041138
Chicago/Turabian StyleEaton-Gonzalez, Ricardo, and Eric Mellink. 2015. "One Shared Region and Two Different Change Patterns: Land Use Change in the Binational Californian Mediterranean Region" Land 4, no. 4: 1138-1154. https://doi.org/10.3390/land4041138
APA StyleEaton-Gonzalez, R., & Mellink, E. (2015). One Shared Region and Two Different Change Patterns: Land Use Change in the Binational Californian Mediterranean Region. Land, 4(4), 1138-1154. https://doi.org/10.3390/land4041138