Article

Modelling Deforestation and Land Cover Transitions of Tropical Peatlands in Sumatra, Indonesia Using Remote Sensed Land Cover Data Sets

1
Department of Geography, University of Leicester, Leicester LE1 7RH, UK
2
Zoological Society of London, Regent's Park, London NW1 4RY, UK
*
Author to whom correspondence should be addressed.
These authors contributed equally to this work.
Land 2015, 4(3), 670-687; https://doi.org/10.3390/land4030670
Submission received: 9 March 2015 / Revised: 18 July 2015 / Accepted: 30 July 2015 / Published: 10 August 2015
(This article belongs to the Special Issue Carbon Emission Reductions and Removals in Tropical Forests)

Abstract

:
In Southeast Asia land use change associated with forest loss and degradation is a major source of greenhouse gas (GHG) emissions. This is of particular concern where deforestation occurs on peat soils. A business-as-usual (BAU) land change model was developed using Dinamica EGO© for a REDD+ Demonstration Activity area in south-east Jambi Province, Sumatra, Indonesia containing Berbak National Park (NP). The model output will be used as baseline land change predictions for comparison with alternative land cover management scenarios as part of a REDD+ feasibility study. The study area is approximately 376,000 ha with approximately 50% on peat soils. The model uses published 2000 and 2010 land cover maps as input and projects land cover change for thirty years until 2040. The model predicted that under a BAU scenario the forest area, 185,000 ha in 2010, will decline by 37% by 2040. In protected forest areas, approximately 50% of the study area, forest cover will reduce by 25%. Peat swamp forest will reduce by almost 37%. The greatest land cover category increases are plantation/regrowth areas (which includes oil palm) and open areas which each increase by 30,000 ha. These results indicate that the site has great potential as an Indonesian REDD+ Demonstration Activity.

Graphical Abstract

1. Introduction

Preventing deforestation and forest degradation is one of the major issues in reducing greenhouse gas emissions as land use change contributes 8% of anthropogenic CO2 emissions per year [1]. Tropical moist forest loss is of particular concern as these are the most carbon rich and the most endangered forests. Indonesia was second only to Brazil in total loss of forest area in the two decades from 1990 (24 Mha and 55 Mha, respectively), and while there has been a reduction in the deforestation rate in Brazil, the deforestation rate in Indonesia appears to be increasing [2,3]. In Indonesia the highest rate of forest loss has occurred in Sumatra, estimated at 25.6% lost during the 1990s [4] and continuing in the following decade (2000 to 2010), with the eastern lowlands losing 5% per annum [5].
Deforestation of peat swamp forest often results in drainage and drying of the peat soil as agricultural expansion is a major driver in Southeast Asia deforestation [6]. Land cover change drivers can be divided into proximate (e.g., wood extraction, agricultural expansion) and underlying causes (population dynamics, economic policies) [6,7,8]. Oil palm plantation expansion has been identified as a particularly important proximate cause of land cover change [9] resulting in enhanced carbon emissions due to deforestation and loss of forest biodiversity and ecosystem services [10]
Drying allows oxidation of the thousands of years of accumulated peat, either through microbial decomposition or fire, resulting in the rapid release of large quantities of carbon to the atmosphere [11]. Indonesia’s peatlands are a major carbon store both in the forest biomass and particularly in the thick, organic soil [12]. It is estimated that almost 70 gigatonnes of carbon (GtC) is held in the peat soils of insular Southeast Asia with over 55 GtC in Indonesia alone [12]. These quantities of stored carbon are equivalent to 39% and 31% respectively of the estimated 180 GtC released by deforestation and land use change in the period from 1750 until 2011 [13]. Peatlands are therefore a key target for emissions reduction measures.
Despite their high carbon storage capacity, over the period 2000–2010, the deforestation rate for peat swamp forests in Southeast Asia was higher, at 2.2% year−1, than for lowland forests, at 1.2% year−1 [5]. The analysis by Miettinen et al. [5] indicates large spatial variations, with the eastern lowland region of Sumatra, including the provinces of Riau and Jambi which have extensive coastal peatlands, and the peatlands of Sarawak on the island of Borneo, having the highest deforestation rates of 5.0% year−1.
Berbak forest in Jambi Province, Sumatra, is the oldest protected forest in Indonesia originally gazetted as a wildlife reserve in 1935 and subsequently declared a National Park in 1992 [14,15]. Berbak was listed on the International Convention of Wetlands (Ramsar) list in 1991 as it was considered to be of significant importance as the largest remaining contiguous area of swamp forest in South-East Asia, with 110,000 hectares of peat swamp forest and 40,000 hectares of freshwater swamp forest, and a high diversity of flora and fauna.
Despite its National Park designation, the forests of Berbak have been subject to a range of disturbances. Forest fires during the 1997/1998 El Niño event caused damage inside and outside the National Park, with more than 17,000 hectares of forest destroyed [16,17]. Pristine forest reduced from 95% to 73% of the park area with larger decreases outside the park during the period from the 1970s to 2009 [16]. Most of the fire-degraded areas inside the park have begun a natural regeneration with fern, grass, shrub and secondary forest [16]. Natural regeneration does not result in the same level of biodiversity as the original forest in the medium term without manual intervention [17,18].
Owing to the extent of its remaining forest cover with high associated carbon storage capacity and biodiversity, Berbak National Park has been proposed for a REDD+ Demonstration Activity for Indonesia [19]. A pre-requisite to estimating the potential carbon emissions reductions that can be achieved by a REDD+ programme is to develop a business-as-usual (BAU) baseline scenario against which to compare alternative forest management strategies. Baseline studies are usually based upon historical deforestation or land use change data [20]. Spatial analysis of land cover change allows determination of not only how much but where deforestation may occur. A spatial analysis of deforestation can be useful as it enables modification of baseline levels to account for initiatives outside the REDD+ activity. Separate initiatives impacting deforestation rates could result in under or over estimating the emissions reductions achieved by the REDD+ project [21]. Many of the methodologies specified for the Verifiable Carbon Standard [22] require that spatial analysis is undertaken [23].
The study aims to provide a BAU land change model for deforestation in the area of south east Jambi Province over the period 2010–2040. This will allow comparison with alternative land management scenarios as part of a REDD+ Demonstration Activity. The model will identify where deforestation could occur and what land cover types will replace forest. This will enable future studies to determine biomass changes, identify where land cover change may occur and identify the proximate causes of the predicted deforestation.

2. Study Area and Methods

The study area is located in the south-east of Jambi Province, Sumatra, delimited by the South China Sea to the north and east and by Sungai Batanghari and Sungai Kua (rivers) to the west and by the provincial border with South Sumatra province to the south (Figure 1). The total study area comprises 375,749 ha of which 193,294 ha is protected forest (Berbak National Park and adjacent protected forest and forest reserve areas), 68,209 ha is forest timber logging concessions, all on peat soils, and 54,818 ha is oil palm concessions (Table 1). Peat soils cover 209,483 ha, i.e., 56% of the total area.
The land cover change model used in this study was Dinamica EGO© (Environment for Geoprocessing Objects) [24,25]. Dinamica has been shown to be a suitable modeling tool for land cover change in a comparison study of alternative land change modeling tools in a binary, forest/non-forest, study in peat swamp forest areas of Kalimantan [26]. Dinamica is a weights-of-evidence model, a method that traditionally is used in geological applications [27,28,29,30,31]. Weights-of-evidence is based upon a series of factors, evidential themes, which must be conditionally independent of each other for each land cover transition identified [32]. These weights-of-evidence factors are either binary, for which coefficients are determined which indicate that the factor is either favourable or unfavourable, or continuous, e.g., distances, which are handled by determining segments of optimal length range with a coefficient determined for each range [29].
Figure 1. Study area location with detailed inset. Yellow polygon indicates extent of study area. (Image sources Google Earth, Image Date 4 October 2013)
Land 04 00670 g001
Table 1. 2010 Protected and Concession Areas and Soil Type Areas and as Percentage of Study Area.
Hectares% Study Area
Protected Forest19329451.4%
Oil Palm Concession5481814.6%
Timber Concession6920918.4%
Peat Soil20948355.8%
Mineral soil16626644.2%
This study is based upon the CRISP Insular South-East Asia 250 m land cover maps for 2000 and 2010 [33,34], available from Japan Aerospace Exploration Agency (http://www.eorc.jaxa.jp/SAFE/LC_MAP/) [33]. The accuracy of these maps is 83% and 85% respectively [33,34]. These data have been used previously to study deforestation over a wider area [5]. As this study is for a smaller area than the previous analysis the data were re-projected to UTM WGS 1984 Zone 48S. The study area contained only seven of the original 13 land cover categories which were reclassified into six categories for use in the model (Table 2). The oil palm plantation land cover category was reclassified as plantation/regrowth as it did not occur in the 2000 land cover and was generated as a subset of the plantation regrowth category for the 2010 land cover map using ALOS radar imaging. This only allowed closed canopy oil palm plantations to be identified which would have been established in 2003 or earlier [10].
Table 2. Land cover classification from CRISP land cover indicating categories which occur in the area of interest. Category 13, Oil Palm Plantation, does not appear on the land cover map for 2000 and was reclassified as Plantation/Regrowth in the 2010 land cover map.
CategoryNameCommentReclassification
2Mangrove1
3Peat Swamp Forest2
4Lowland Forest<750 m above sea level3
7Plantation/Regrowth4
8Lowland Mosaic<750 m above sea level5
10Lowland Open<750 m above sea level6
13Oil Palm PlantationLarge scale4
The weights-of-evidence are factors which allow the model to determine probability of land cover transitions. The factors used in this study were distance from rivers, roads and coast, protected forest areas, timber concessions, peat soil, and fire density. The weights of evidence allow the model to produce land cover transition probability maps which are input to the model steps to predict the land cover changes. Slope, often a factor in deforestation as it can impact accessibility to an area, is not important in the eastern lowlands of Sumatra as the land rarely rises to more than 20 m above sea level. Dynamic factors of distance from land cover types, plantation/regrowth, lowland open and lowland mosaic were used in the model. All factors were obtained as vector shape files and converted to raster maps with the same resolution as the land cover for use in the models using ArcGIS. As we had access to distance factors at a much higher spatial resolution than the baseline land cover map, we performed preliminary analysis at 250 m (native resolution) and used 50 m resolution for the land cover modeling presented here. This required resampling of the 250 m land cover maps for use with the 50 m resolution model. The preliminary investigation indicated that the finer grained resolution obtained for the distance factors improved model accuracy. Whether the increased accuracy from higher resolution images is applicable in other studies is a matter for further investigation. In this study the results presented below are obtained from the models at 50 m resolution run at 30 discrete yearly intervals. The results reported here are at 5-year intervals.
Model accuracy has two key areas. The transition rates determine how much area of each land cover transition occurs. The land cover change probability maps, based upon the weights-of-evidence, and using the expander/patcher ratio determines locational accuracy. The percentage of transitions allocated to expanding existing land cover areas or creating new land cover patches defines the expander/patcher ratio [25].
The multi-step transition matrix generated from the 2000 and 2010 land cover maps was used as the basis for the transitions. Only possible transitions were included with removal of “impossible” transitions, Table 3. Trial and error was applied to modify the transition values after removal of “impossible” transitions so that acceptable land cover transition accuracy was achieved.
Table 3. Land cover transitions permitted in the model.
To
FromMangrovePeat Swamp ForestLowland ForestPlantation/RegrowthLowland MosaicLowland Open
Mangrove
Peat Swamp Forest
Lowland Forest
Plantation/Regrowth
Lowland Mosaic
Lowland Mosaic
Positional accuracy was measured using a constant decay function which implemented fuzzy similarity based upon fuzziness of category and location on maps of changes. Accuracy is based upon comparison of the observed and predicted land cover changes. The observed changes use the original (2000) and final (2010) land cover maps while the predicted changes use the initial observed (2000) and final simulated land cover maps [25,35]. Multiple window sizes are used when determining accuracy as there is no single correct resolution at which accuracy can be determined [36].
Multiple simulations for the period (2000 to 2010) were undertaken using different expander/patcher ratios, from 50/50 to 100/0. Each was assessed using the constant decay function with the largest patch of peat swamp forest, as the largest contiguous land cover area to determine the optimum expander/patcher ratio. The accuracy results were very similar for all ratios as were the largest peat swamp forest land cover patches. As the most accurate result at the smallest window size an expander/patcher ratio of 70/30 was chosen for the model projections.
More details of the model preparation are provided in the Supplementary Information provided with this article.

3. Results and Discussion

3.1. Land Cover Change

The modelled land cover change in the entire study area (Table 4, Figure 2 and 
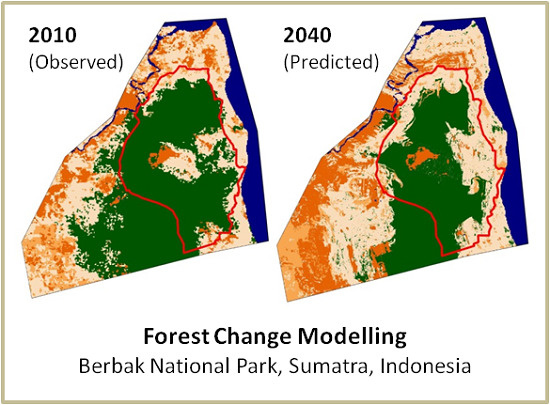
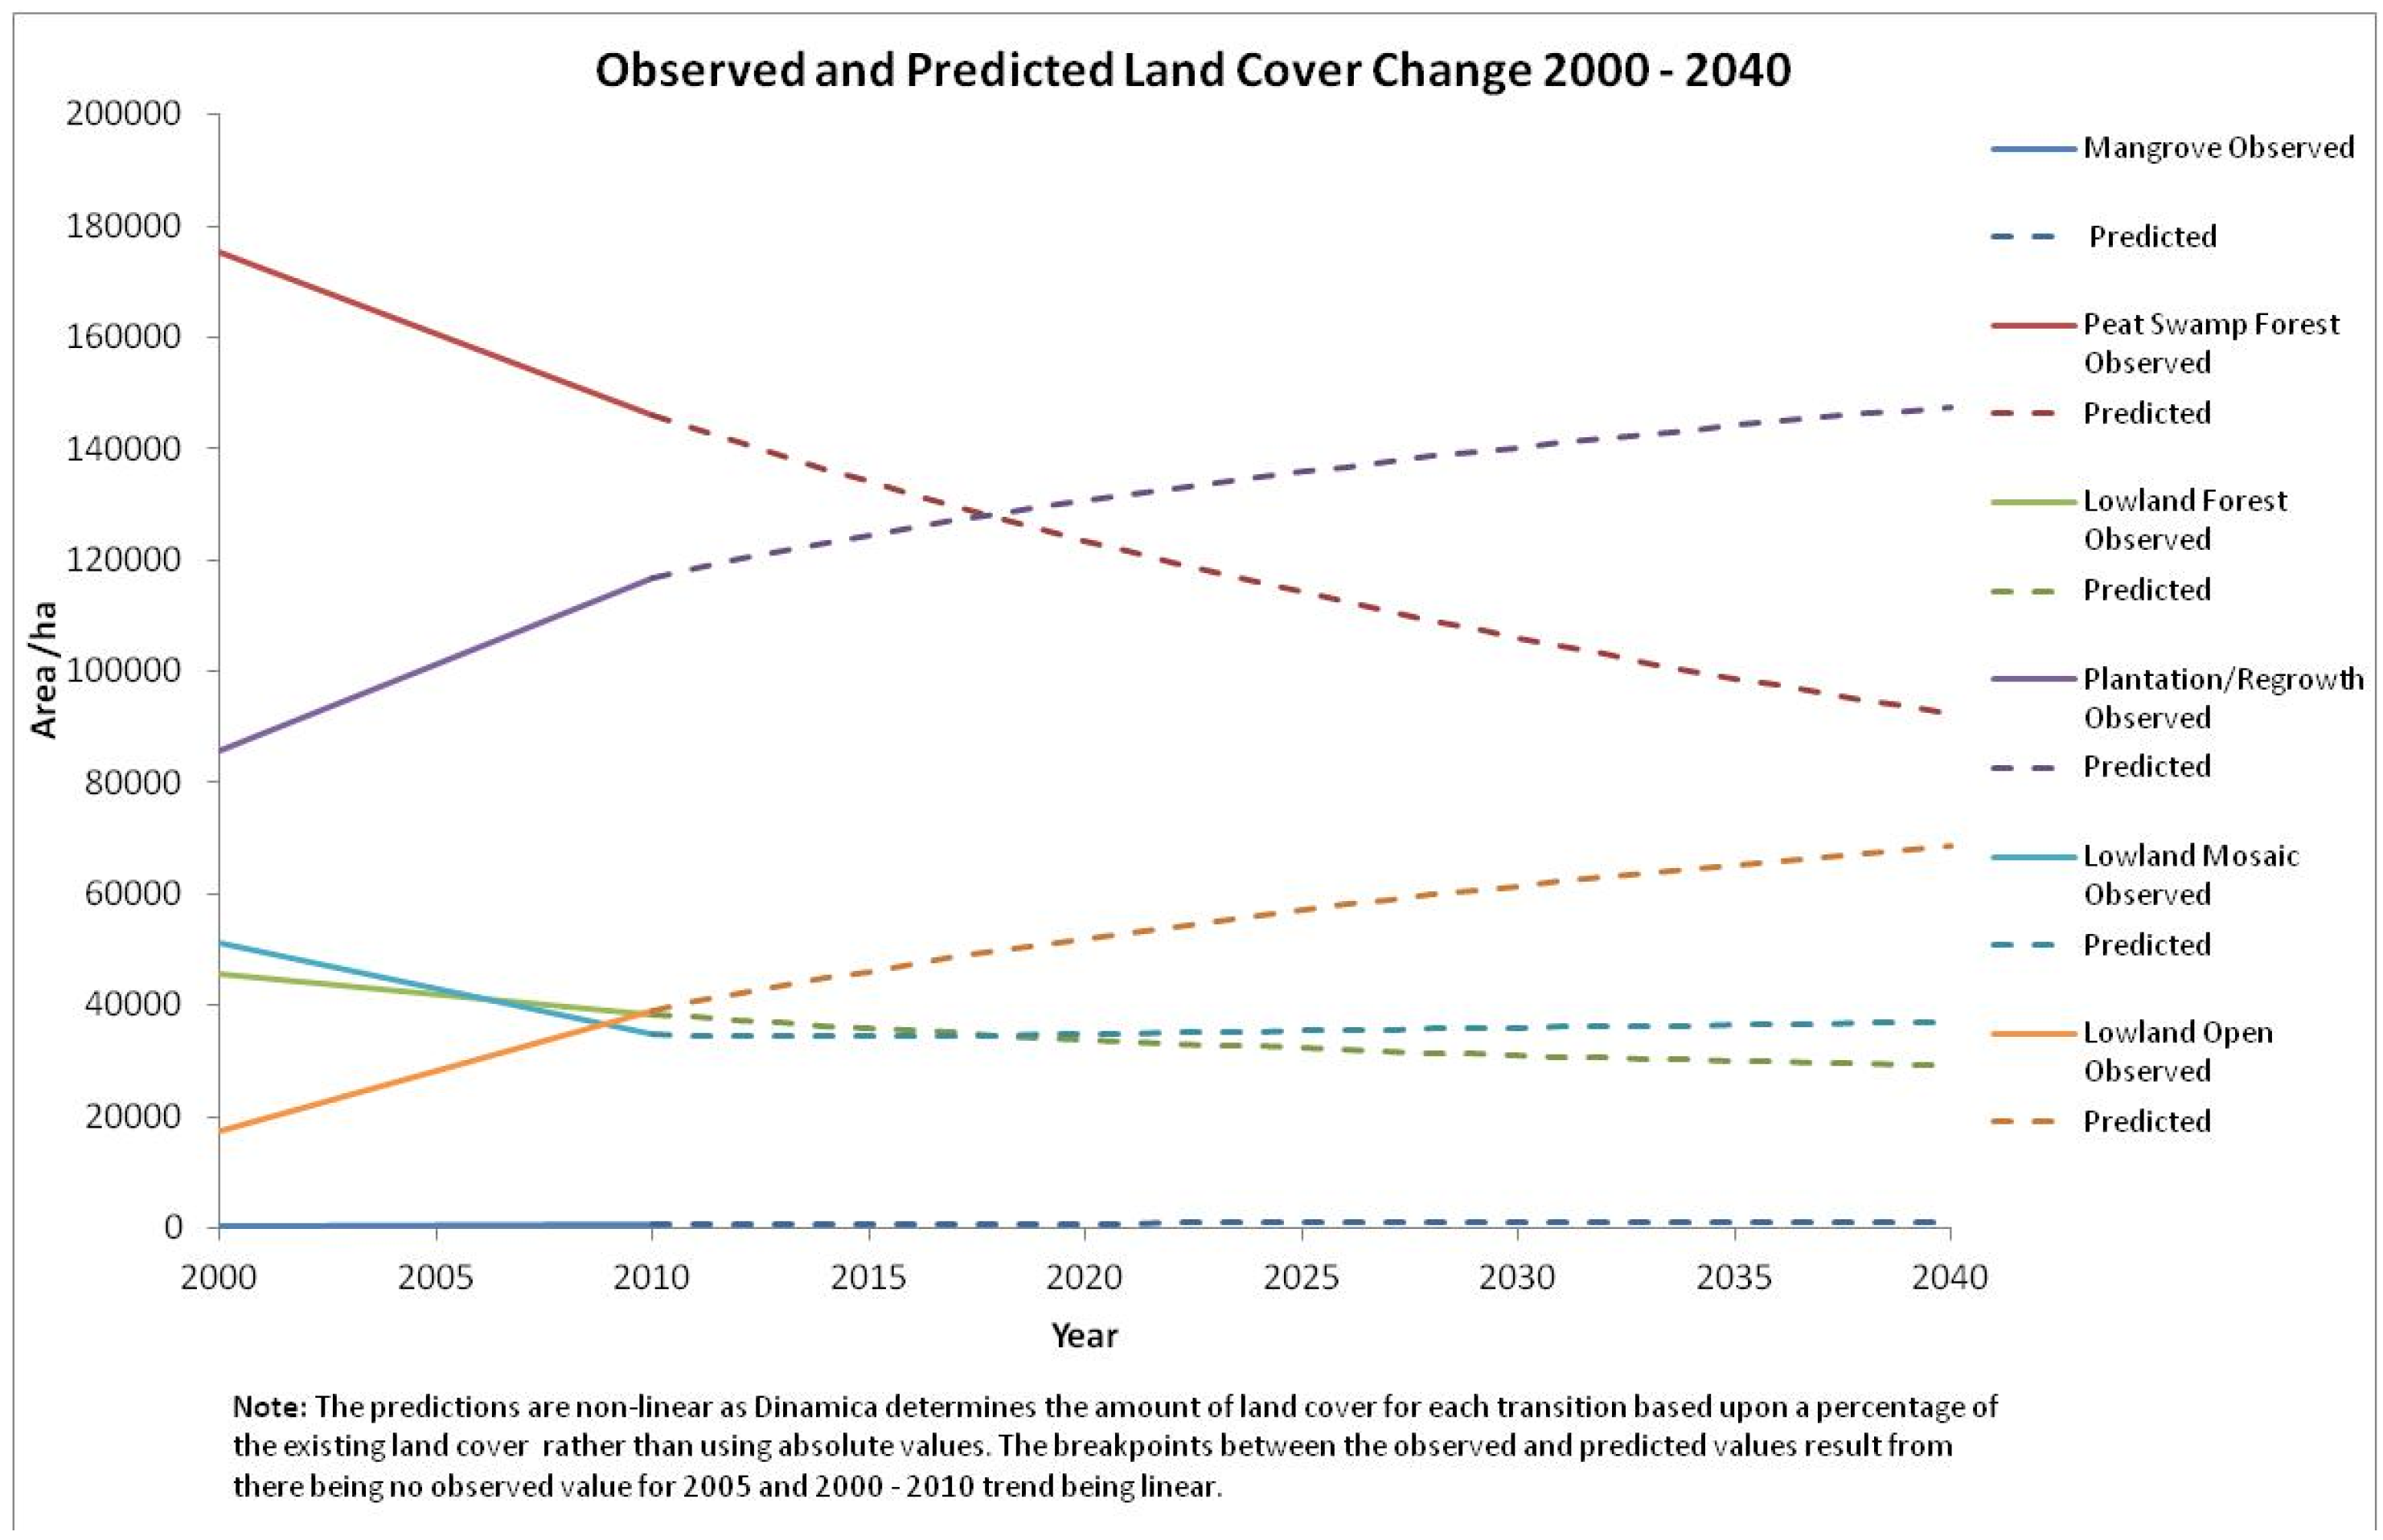
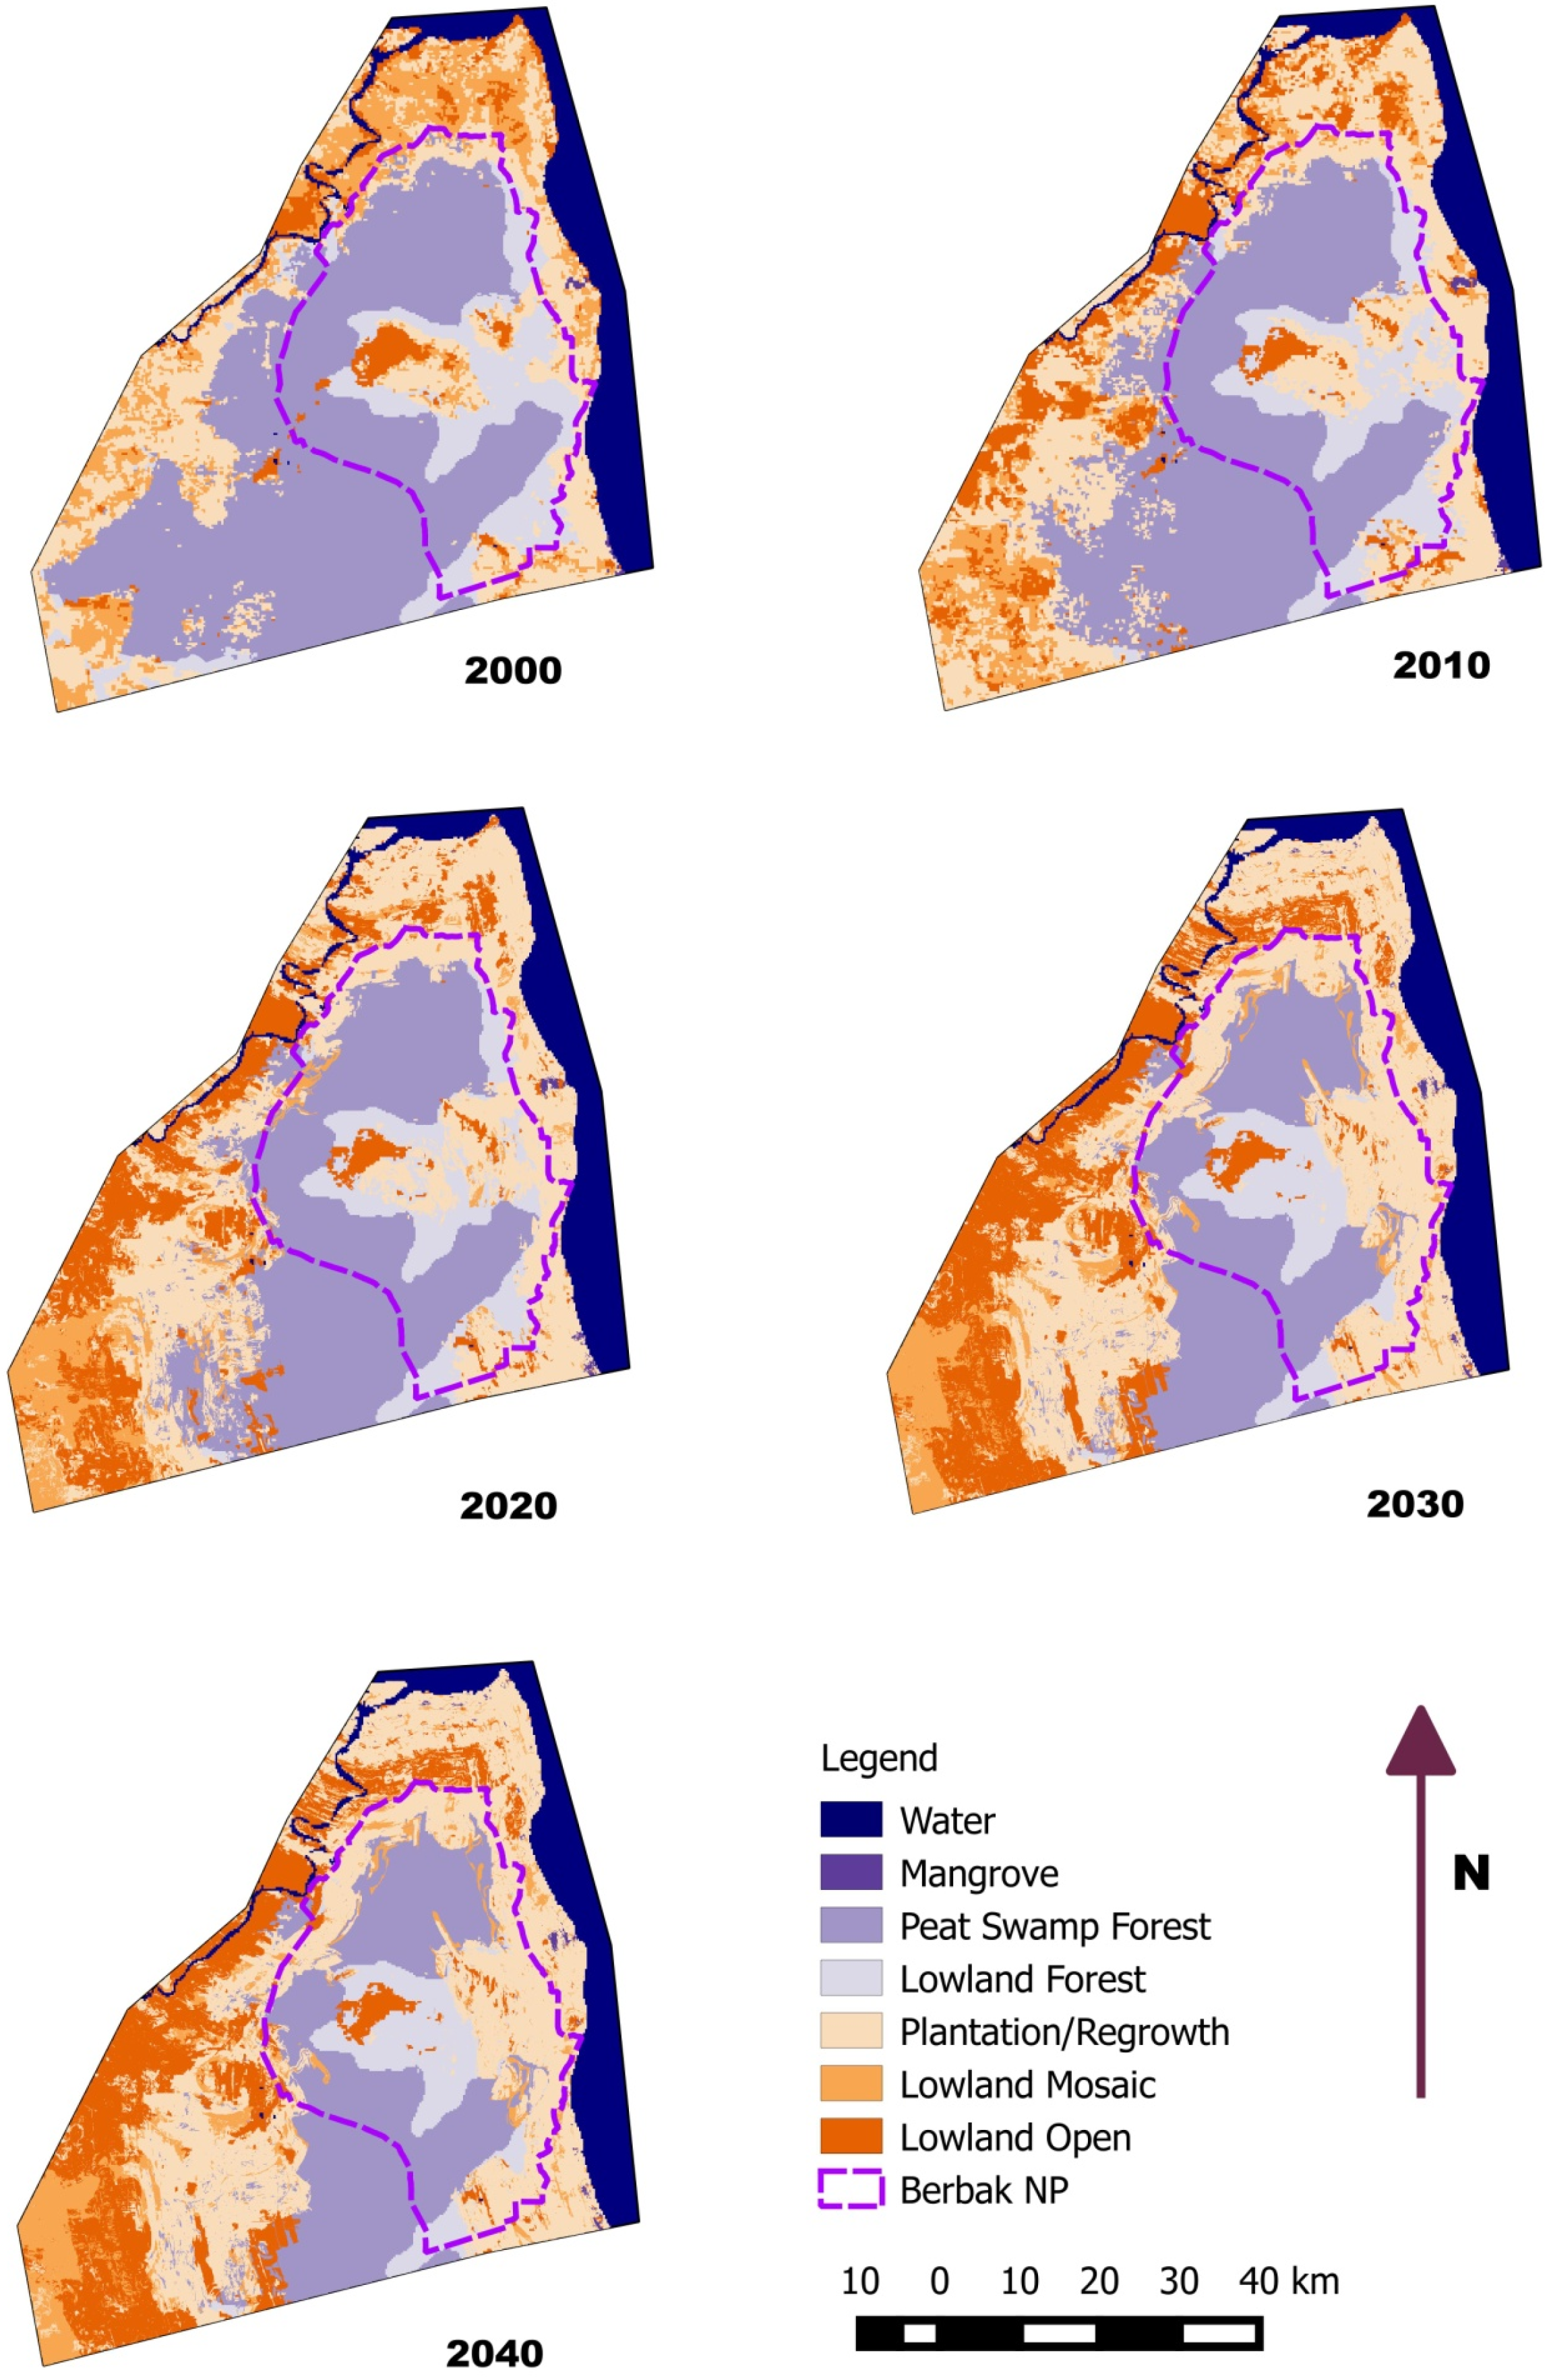
Figure 3) shows an overall forest decrease between 2010 and 2040 (lowland, peat swamp and mangrove forest categories) of 62,000 ha (−34%) with the largest land cover category changes being a loss of 53,000 ha of Peat Swamp Forest (−37%) and increases of 30,000 ha for Plantation/Regrowth (+26%) and Lowland Open (+75%). The modelling predicts that 55% of the deforestation occurs in protected forest areas and 86% on peat soil. Importantly, the models show that the core forest area in Berbak National Park and associated protected forest areas remain intact over the study period with deforestation occurring on the edges of the main forest areas.
The output from the model shows annual forest loss rates in the range 1.1% to 1.6%, with an overall predicted annual forest loss for the period from 2010–2040 of 1.36%. This is significantly less than the reported 5% per annum forest loss for the eastern lowlands of Sumatra as a whole for the period 2000–2010 [5]. The lower figures may result from the protected forest status of the Berbak National Park and adjacent protected forests as well as the inaccessibility of this central forest region. Another factor may be that uncultivated areas are mainly on peat soil which will be the last land to be converted following conversion of more easily cultivated mineral soils.
Table 4. Projected land cover change (ha) for 30 years at five year intervals from observed data, 2000 & 2010, until 2040. Total Forest includes Mangrove, Peat Swamp and Lowland forests.
YearMangrovePeat Swamp ForestLowland ForestPlantation/RegrowthLowland MosaicLowland OpenTotal Forest
2000(O)414175,29245,67885,64751,17517,287221,383
2010(O)598146,04238,431116,83934,74039,099185,072
2015703134,08835,913124,52034,38546,142170,703
2020806123,55233,892130,65034,80352,047158,249
2025906114,25532,274135,82235,38757,105147,435
20301003106,04630,985140,28135,96261,472138,034
2035109798,79729,965144,15336,48365,254129,859
2040118592,39329,166147,53036,94268,532122,744
Area Change 2000–2010184−29,250−724731,192−16,43521,812−36,311
Area Change 2010–2040587−53,649−926530,691220329,433−62,328
% Change 2010–204098.1%−36.7%−24.1%26.3%6.3%75.3%−33.7%
% Annual Change 2000–20103.76%−1.81%−1.71%3.15%−3.80%8.50%−1.78%
% Annual Change 2010–20402.30%−1.51%−0.92%0.78%0.21%1.89%−1.36%
Figure 2. Observed and Projected Land Cover Change 2010–2040.
Land 04 00670 g002
Figure 3. Land Cover Maps 2000–2040 showing land cover and extent of Berbak NP.
Land 04 00670 g003
Of significant interest are the projected forest changes in specific subsections of the study area, particularly the protected forest areas and the peat soil areas (Table 5 and Table 6). The protected forest areas comprise 193,294 ha, 51.4% of the study area, of which 72% was forested in 2010. It is projected that forest loss of 34,000 ha will occur within these areas during the 30-year period up to 2040, representing a 26% forest loss. The largest increase is in the Plantation/Regrowth Category of 25,000 ha.
In the peat soil areas, covering 209,483 ha (55.8% of the study area) the projected forest loss is 53,000 ha, i.e., 37% of the 2010 forest cover. Analysis of predicted annual change in the forest cover in peat soil areas shows annual deforestation rates in the range of 1.3% year−1 to 1.7% year−1. This is less than the peat swamp deforestation rates for insular Southeast Asia of 2.2% year−1 and 5.2% for all Sumatra over the period 2000–2010 [5]. The lower deforestation rate in the study area may be less than that for insular Southeast Asia and Sumatra as 59% of the peat soil area is located within protected forest areas.
Table 5. Land Cover Change (ha) in Protected Areas. (Category Mangrove is not present in Protected Forest areas.)
YearPeat Swamp ForestLowland ForestPlantation/RegrowthLowland MosaicLowland OpenTotal Forest
2000112,63038,35427,04489456313150,984
2010102,77435,40439,185590310,029138,178
201598,52433,56945,492459111,119132,093
202093,30831,93149,204660012,251125,239
202588,11430,48953,068814513,479118,603
203083,96529,29256,803837514,859113,257
203580,00728,30260,460910815,418108,308
204075,96427,48464,203917216,472103,448
Area Change 2000–2010−9856−295012,142−30423716−12,806
Area Change 2010–2040−26,810−792025,01832696,443−34,7230
% Change 2010–2040−26.1%−22.4%63.8%55.4%64.2%−25.1%
Table 6. Land Cover Change (ha) in Peat Soil Areas. (Category Mangrove is not present in Peat Soil areas.)
YearPeat Swamp Forest (/ha)Lowland Forest (/ha)Plantation/Regrowth (/ha)Lowland Mosaic (/ha)Lowland Open (/ha)Total Forest (/ha)
2000171,605270523,41897741982174,310
2010142,155281239,00316,1749340144,967
2015130,200281842,17922,58111,705133,019
2020119,662283448,15222,99415,842122,495
2025110,365283852,49722,92720,857113,203
2030102,156284157,67222,57624,238104,997
203594,907285162,78122,17226,77297,758
204088,503286266,34422,70329,07191,365
Area Change 2000–2010−29,45010715,58564007358−29,343
Area Change 2010–2040−53,6525027,341652919,731−53,602
% Change 2010–2040−37.7%1.8%70.1%40.4%211.3%−37.0%
The model predictions show that the protected forest areas suffer from a lower percentage forest loss than non-protected areas but still 56% of all deforestation is predicted to occur in protected areas and 86% of all deforestation is predicted to occur in peat soil areas. Deforestation in peat soil areas is often associated with a lowering of the water table for agricultural use. Lowering the water table results in enhanced rates of peat oxidation and loss of stored carbon to the atmosphere in addition to the loss of carbon in forest biomass. In areas of Timber Concessions the forest will decline by 62% reducing from 64% of land cover in 2010 to 24% in 2040.
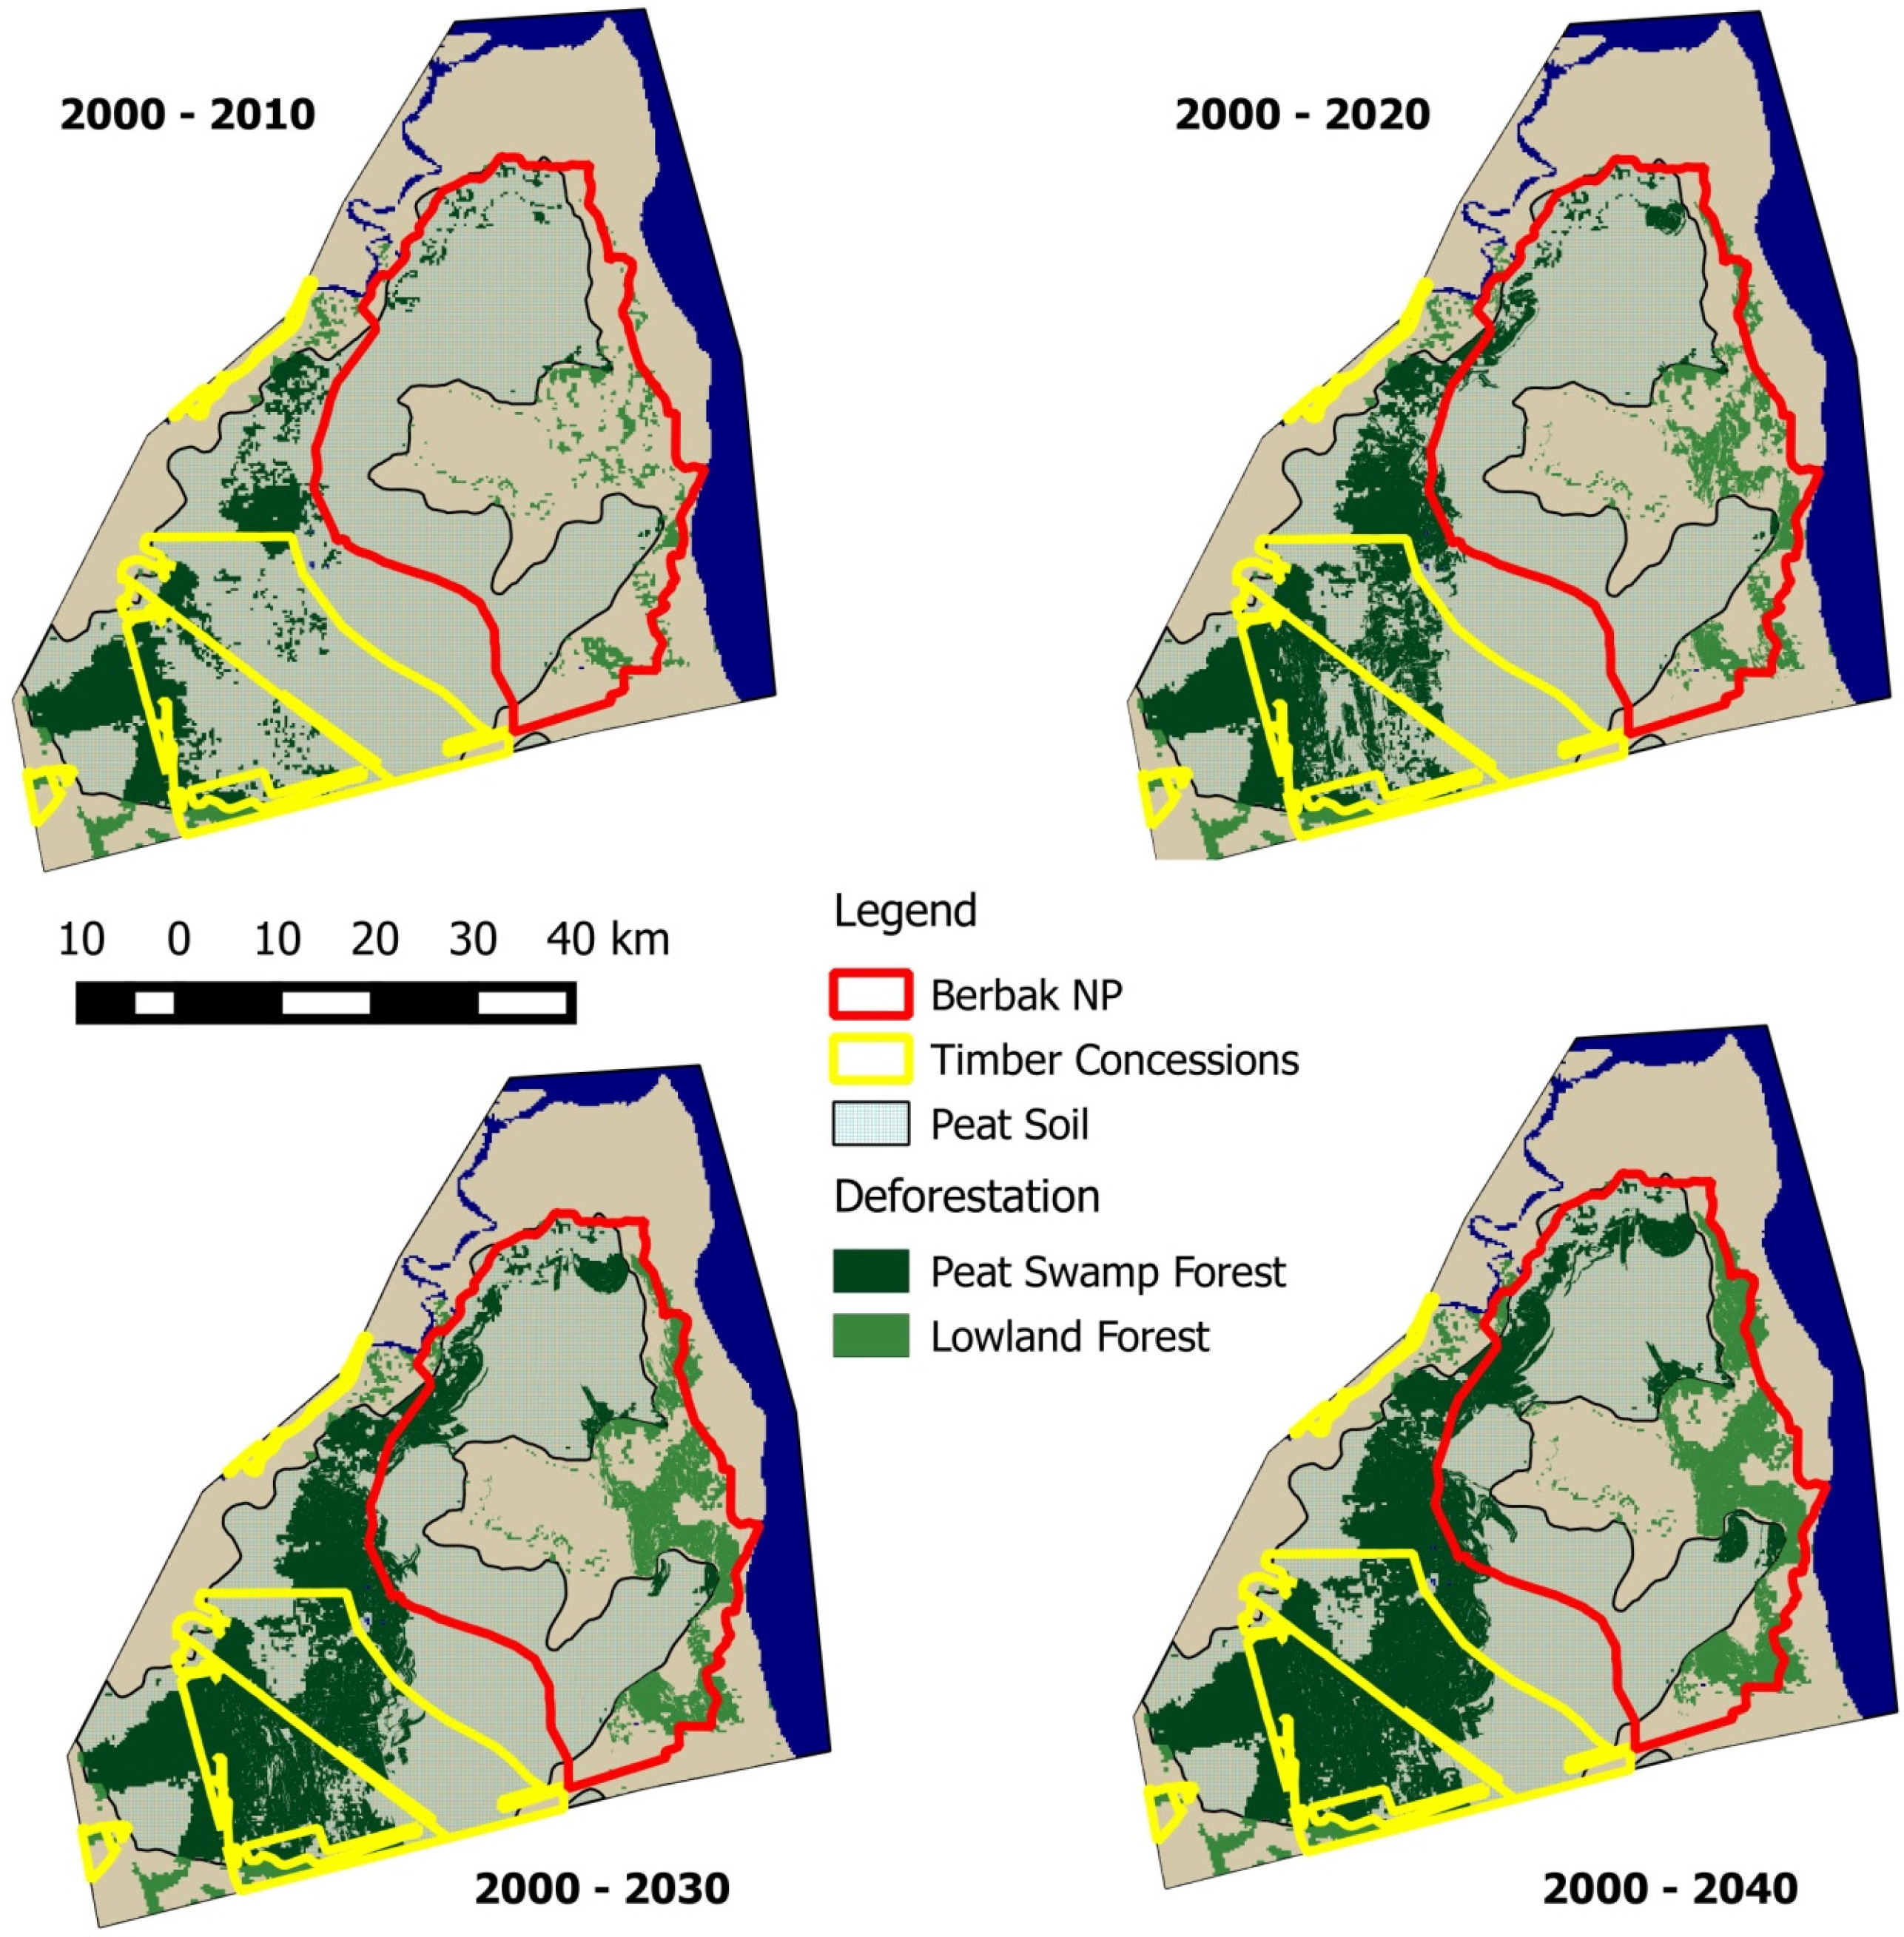
The deforestation areas, Figure 4, predict that while there was limited deforestation in Berbak NP between 2000 and 2010 this will increase in the following decades. Peat swamp forest deforestation occurs in the west of Berbak NP while lowland forest loss will occur to the east. While there has been some significant deforestation in the timber concessions by 2010 the model predicts that this area will be almost totally deforested by 2040.
Figure 4. Deforestation 2000–2040 showing areas of deforestation for Peat Swamp and Lowland forest with peat soil area, Berbak National Park and timber concessions.
Land 04 00670 g004
While the original land cover map (2000) did not include the Oil Palm Plantation (OPP) category planted oil palm plantations most probably existed in 2000. Koh et al. [10] indicate that the land cover identified in the 2010 land cover map was created as a subset of the plantation/regrowth category and consisted of closed canopy oil palm plantation which must have been planted in 2003 or earlier. Much of this oil palm plantation was probably planted prior to 2000. In the 2010 land cover map the Oil Palm Plantation comprises 12% of the combined plantation/regrowth and oil palm plantation categories, 14,446 ha. As this only includes the closed cover oil palm plantation this is a minimum estimate. If the oil palm plantation were restricted to the same percentage of the plantation/regrowth category in the 2040 prediction then the area of oil palm will have grown to 45,000 ha which is growth of over 200%. There may also be issues with more recent regulations regarding oil palm plantations which will limit the growth areas, for example, the recent Law on Prevention and Eradication of Forest Destruction issued by the Government of Indonesia in 2013 and the commitment by many companies trading in and using palm oil to sustainable practice, e.g., Wilmar International, the world’s largest palm oil trader, committed to “no deforestation”, “no peat”, and “no exploitation” (Wilmar International, 2013). The factors influencing oil palm plantation growth, economic and political, and the designation of oil palm leases along with the planning required for development of plantations may require that oil palm plantation growth should be modelled separately, e.g., as undertaken by Carlson (2012).
No individual modelling of El Niño Southern Oscillation (ENSO) events was undertaken as part of this study. The available land cover maps did not allow separation of the specific, time-limited land cover changes occurring during ENSO versus non-ENSO periods. The ten-year period between the initial and final land cover maps will have captured three ENSO events, 2002–2003, 2004–2005 and 2009–2010 [37] resulting in the effects of these events being included in the model output. Impacts of drought resulting from ENSO can be unpredictable as the impact of fires will vary between ENSO events. This is illustrated by the impact of the 1997–1998 ENSO, outside the study training and prediction period, which resulted in severe fires which impacted the Berbak landscape [16]. It is difficult to include severe ENSO events in land cover change modelling due to the unpredictability of their occurrence.
The prediction model shows land cover transitions which were not included in the original transition matrices determined as an input to the model. This will occur due to multiple land cover transitions occurring during the modelling period. The same effect occurred in the original transition matrices due to the 10-year period between the initial and final observed land cover models but these transitions were removed from the transition matrix used in the model. This will not affect the overall outcome of the model, however, as it only masks short term transitions by longer term ones.
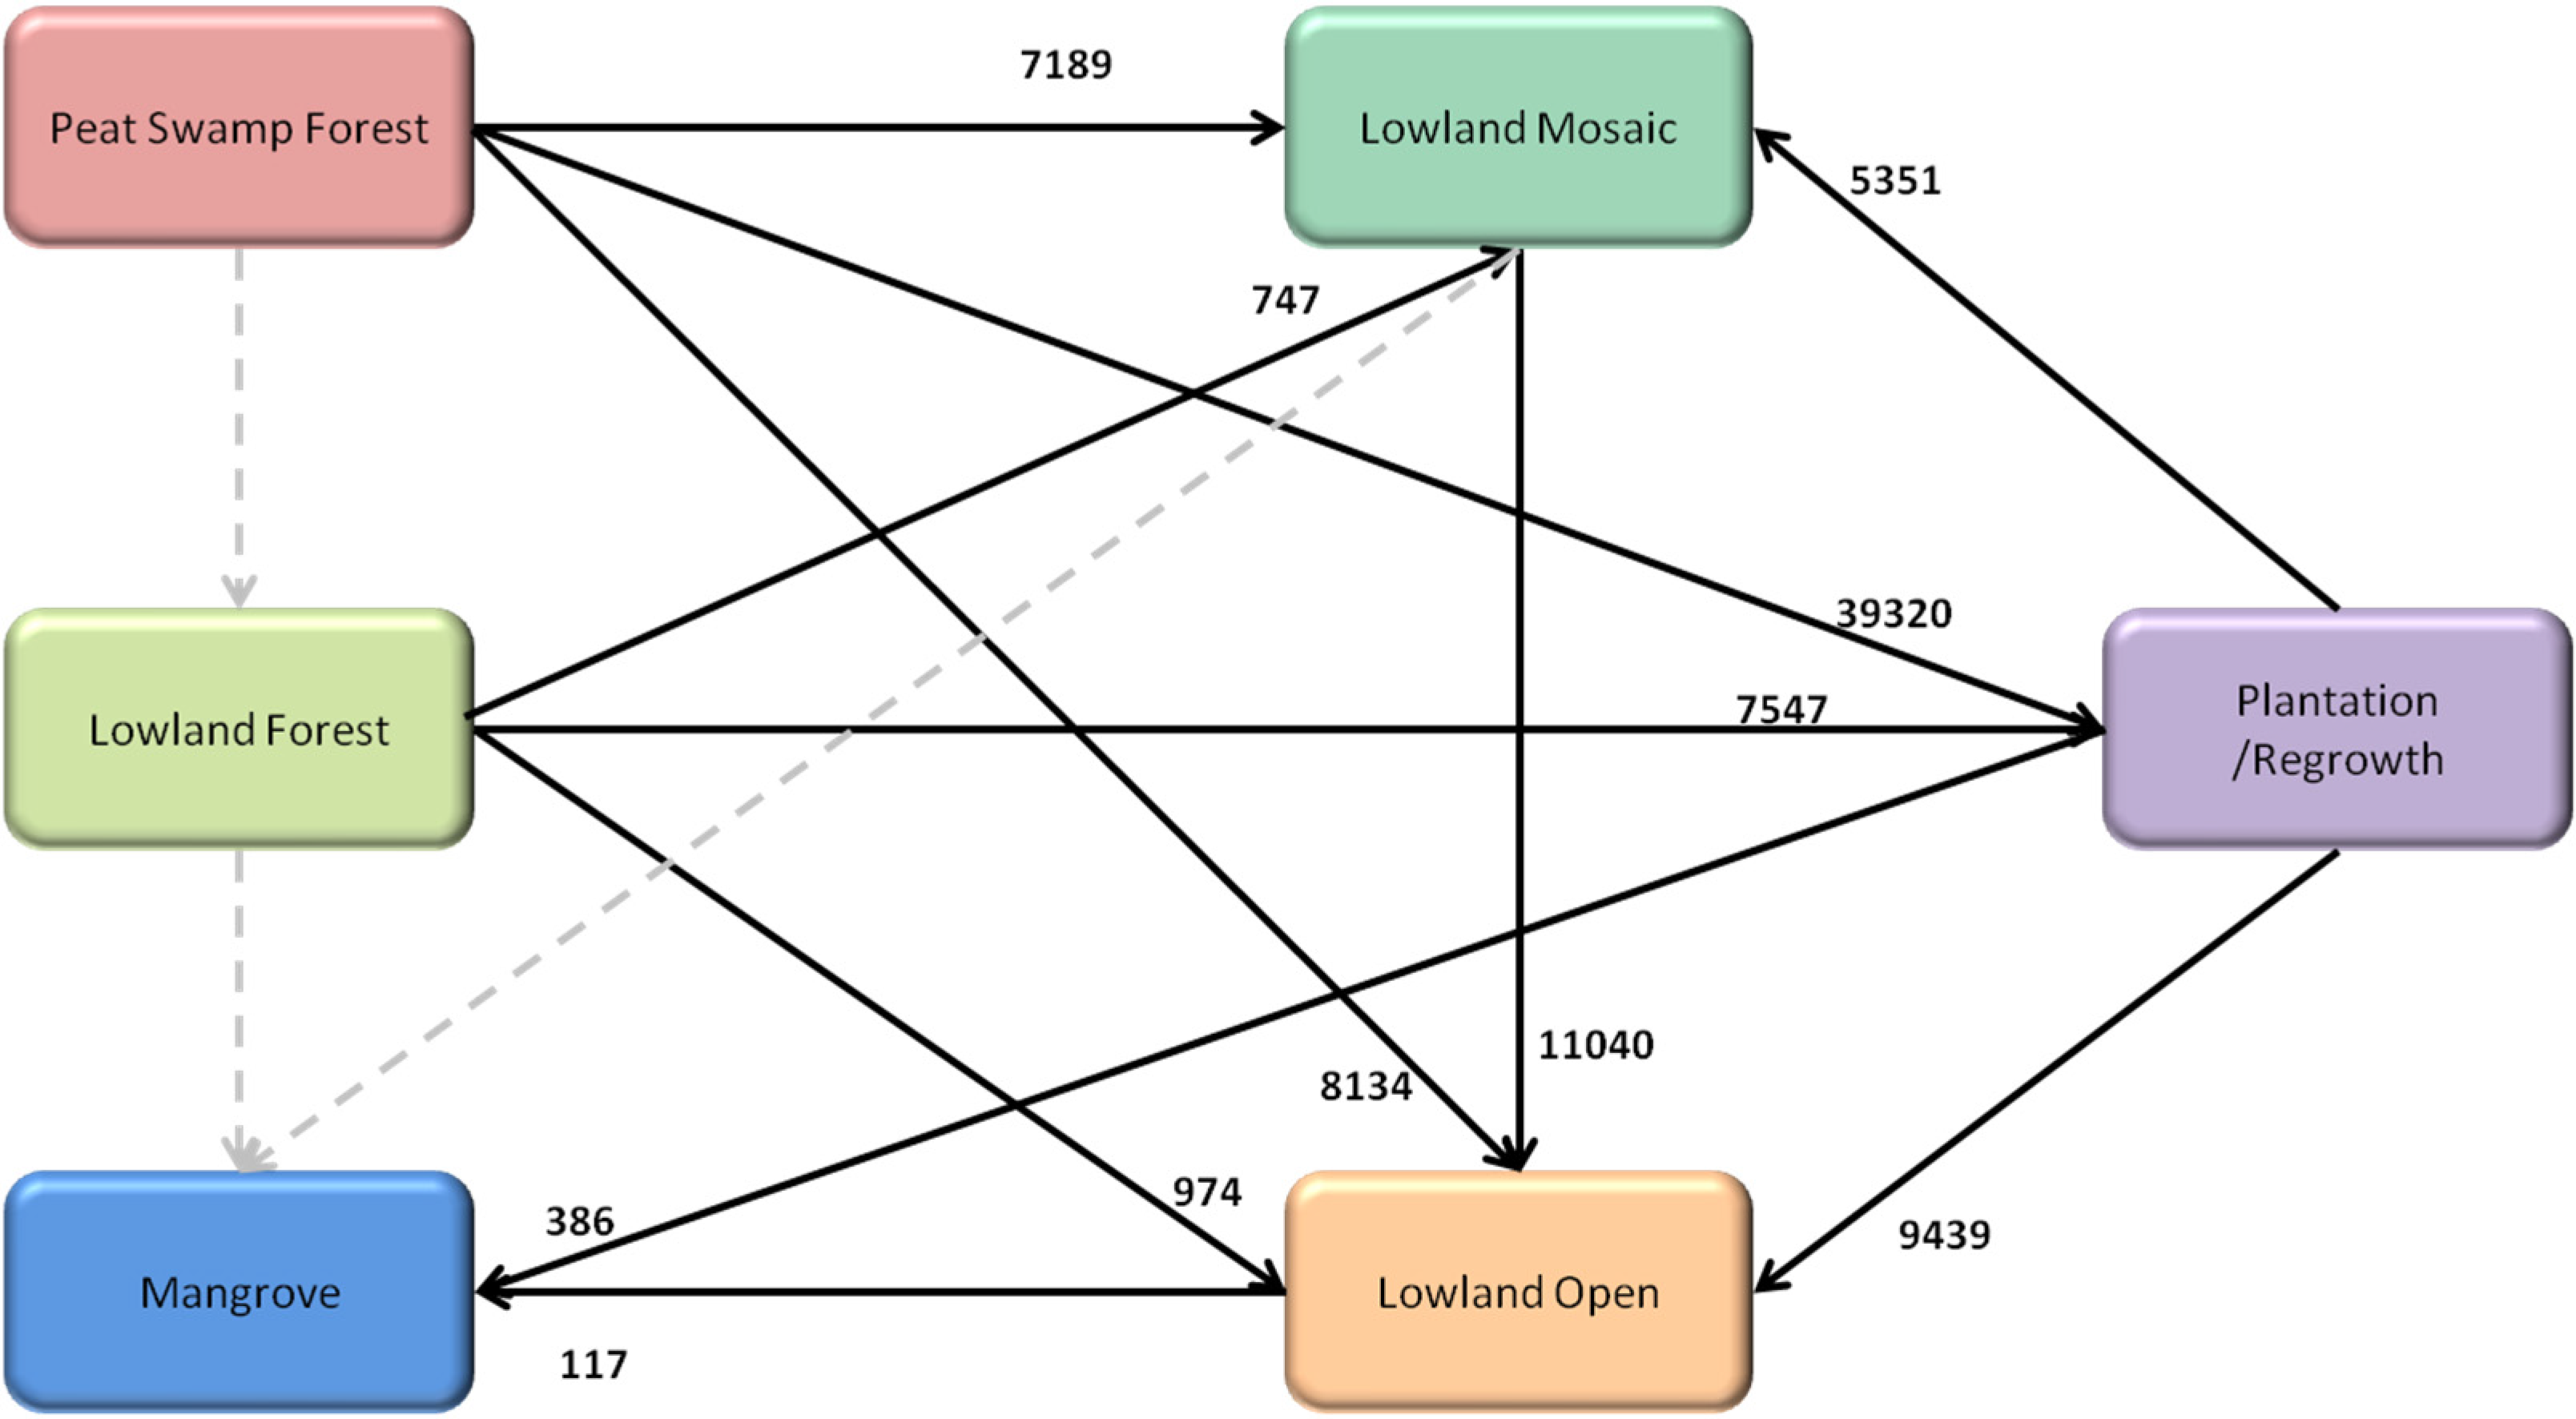
It is necessary to understand the net transitions which have occurred between land cover types as these are the significant changes from which calculations of business as usual biomass change calculations can be calculated and to understand the trend in land cover changes (Figure 5). This shows a general trend from forested areas, peat swamp and lowland, to the categories, open, mosaic and plantation/regrowth. Almost 72% of deforestation on peat soils (PSF) and 81% of deforestation on mineral soils (LLF) changes to plantation/regrowth, although some of the plantation/regrowth is cleared for other agricultural purposes.
Figure 5. Net land cover transitions in hectares (only showing transitions >100 ha) over 30-year projection. Data from Table 7 rounded to nearest 100 ha. Minor transitions shown by grey dashed arrows.
Land 04 00670 g005

3.2. Land Cover Transitions

The modelled land cover transitions for the 30-year study period are shown in Table 7.
Table 7. Projected land cover transitions over 30-year modelling period 2010–2040. Net Change highlights the actual land cover changes over the modelling period. The shaded rows highlight transitions which must have occurred over more than a single transition step.
2010 Category2040 CategoryChange (ha)Net Change (ha)
MangrovePlantation/Regrowth175.0
MangroveLowland Mosaic19.8
MangroveLowland Open5.5
Peat Swamp ForestLowland Forest9.37.3
Peat Swamp ForestPlantation/Regrowth39,344.538,319.8
Peat Swamp ForestLowland Mosaic7250.57188.8
Peat Swamp ForestLowland Open8136.58133.5
Lowland ForestMangrove3.83.8
Lowland ForestPeat Swamp Forest2.0
Lowland ForestPlantation/Regrowth15,944.37547.0
Lowland ForestLowland Mosaic1023.5747.3
Lowland ForestLowland Open1186.0974.3
Plantation/RegrowthMangrove561.3386.3
Plantation/RegrowthPeat Swamp Forest1024.8
Plantation/RegrowthLowland Forest8397.3
Plantation/RegrowthLowland Mosaic16,310.55350.5
Plantation/RegrowthLowland Open19,548.39438.8
Lowland MosaicMangrove100.0
Lowland MosaicPeat Swamp Forest61.8
Lowland MosaicLowland Forest276.3
Lowland MosaicPlantation/Regrowth10,960.0
Lowland MosaicLowland Open13,935.311,003.8
Lowland OpenMangrove122.0116.5
Lowland OpenPeat Swamp Forest3.0
Lowland OpenLowland Forest211.8
Lowland OpenPlantation/Regrowth10,109.5
Lowland OpenLowland Mosaic2931.5
The forest transitions show the significance of the loss of Peat Swamp Forest with large areas being lost to the open, mosaic and plantation/regrowth land cover categories. Lowland forest also shows a significant loss to Plantation/Regrowth with small losses to Lowland Open and Mosaic land cover types. Mangrove is the only forest type to gain area but this is only a relatively small area compared to the other forest land cover categories.

3.3. Model Accuracy

The accuracy of the original land cover maps is 83% and 85% respectively [33,34]. This accuracy was calculated over the entire insular South East Asia area and may not be applicable for the subset used as the study area.
Land cover area accuracy obtained by modification by trial and error of the transition values resulted in an overall error level, when comparing modeled 2010 output with 2010 observed land cover, of <0.1%. Individual land cover types had area errors of <0.7%.
The model has positional accuracy for a single 50 m pixel of 46% and with a window size of 1050 m this rises to 78%. A previous study in West Kalimantan [9] using seven land cover categories showed accuracy figures for a 100 m resolution model of 25% (single pixel) and 81% for 1100 m. The model proved more accurate at the single pixel level but was slightly less accurate at the greater distance. Another study around the Xingu National Park in the Brazilian Amazon [38] based upon three land cover categories (Forests, Pastureland and Cropland) resulted in 30% accuracy at 100 m and 60% accuracy at 1.9 km with an estimate that at 1100 m the accuracy was approximately 50%. Comparison with these contemporary studies which also used the Dinamica EGO toolset indicates that the accuracy of the Jambi model compares favourably.

3.4. Model Limitations

Land change models can only provide projections based upon the inputs to the model. Depending upon the historical period chosen the model can over or underestimate future change [21] Over or underestimation may occur as a result of fluctuations in the annual land change rates. The ten year historical period used for calibrating the model removes the impact of annual fluctuations on the predicted output.
Deforestation rates will vary over time and the model predicts that deforestation rates will be lower in the prediction period than in the calibration period, Table 4. This occurs as the Dinamica model determines transitions as a percentage of the existing land cover for each land cover type transition. As the area of forest declines the amount of deforestation decreases but as plantation/regrowth area increases the reforestation area increases. This may not represent an accurate deforestation/reforestation scenario as reforestation takes longer to occur than deforestation.
The model shows projected transitions over the period from 2010–2040 which would not occur in nature, notably the transitions between the peat swamp and lowland forest types, Table 7. Small differences in the original maps show 12.5 ha of peat forest being converted to lowland forest between 2000 and 2010. These small anomalies are not considered significant in relation to the whole study area. To remove this peat to lowland forest transition, forest types found in the earlier map, 2000, were corrected to align with the 2010 map on the assumption that the later study was more accurate.
The soil maps provided by the Jambi REDD+ Commission used in this study were different from those used for the CRISP land cover maps with discrepancies indicated by small areas of lowland forest shown to be on peat soil and peat swamp forest on mineral soil. This difference in soil type maps may also have contributed to the forest type transitions observed in the model.
Small area changes between forest types over the 30 year prediction period could have been removed by changes to the model, either by splitting the model by soil type or by modification of the transition coefficients to reduce the probability of forest transitions being assigned to the “wrong” soil type. However, due to the very small areas concerned these changes were not considered to be warranted.
The lack of accurate identification of all oil palm plantations in input land cover maps and the removal of this category from the land cover model is a more significant limitation as it does not allow determination of the impact of oil palm plantations on deforestation. This deficiency may compromise future forest management proposals. For users interested in applying these products to determine REDD+ baseline levels, it should be noted that the land change model only predicts future change based upon the historical evidence and does not consider other proposals, e.g., reduction in the amount of timber which may be cut, which may impact deforestation rates [21]

4. Conclusions

The modelling of land cover change in the Berbak area of Jambi Province, Sumatra, has shown that the amount of forest cover and particularly peat swamp forest cover is expected to decline significantly over the period until 2040. The percentage of forest loss is highest in the timber concession areas with over 60% reduction in forest area. In protected forest areas the reduction in forest is 25% compared with 52% in areas which are not protected. This aligns with previous studies that demonstrate that forest loss is lower in protected areas than in areas where no protection exists [4]. Any REDD+ Demonstration Activity in this landscape will need to enhance the protection of Berbak National Park and its associated conservation forests while addressing a key driver of deforestation, namely logging activities in the buffer zone. Furthermore, there will be implications for carbon emission and water table management strategies under the modelled forest change scenarios.
The model provides a business as usual prediction, based upon historical land use change, as a basis for comparison with alternative forest management strategies as part of a REDD+ feasibility study. Care must be taken when using the output as changing government legislation and regulation, land management techniques and economic circumstances will impact land cover change. This does not invalidate the model as a baseline for understanding potential impacts of modified land cover and carbon emission management practices.
The model provides a good spatial view of potential deforestation which can be adapted based upon other initiatives to allow generation of baseline carbon emissions. The spatial nature of the model can be used to make allowances for other initiatives, e.g., reducing deforestation in Berbak National Park, in the determination of the overall projected deforestation.
Previous studies have expressed concern over the impact of increasing plantation land use and concomitant reduction in forest area [9,39,40,41]. While this model does not explicitly model changes to oil palm plantation the evidence from Koh et al. [10] on the presence of oil palm in the plantation/regrowth category and the projected increase in land area of this land use category indicates that oil palm plantation increase is one of the drivers of deforestation.
Further study is required to determine the depth of peat soil and the water table lowering that would occur in conjunction with the deforestation of peat soils in order to quantify the scale of carbon release that would result from forest loss and drainage. This would need to take account of the relative contributions of fire and oxidation on below-ground carbon stocks. In addition, the potential impact of forest loss on threatened species such as the Critically Endangered Sumatran tiger requires further investigation based on knowledge of habitat requirements. Further development of the model, in the context of emerging initiatives and private policies, such as Zero Net Deforestation and Forest Degradation (ZNDD) [42] and Tropical Forest Alliance 2020 [43], will also be an important future development.

Supplementary Files

Supplementary File 1

Acknowledgements

The authors thank Berbak National Park Authority for its ongoing support and collaboration. The authors also wish to thank the independent reviewers for their concise comments and assistance in improving this paper.

Author Contributions

This paper was based upon the research component of an MSc in Geographic Information Systems undertaken by Ian Elz. Susan Page and Kevin Tansey were academic supervisors of this research. Mandar Trivedi from ZSL suggested that this work be undertaken as ZSL is working in the study area to protect the habitat for endangered species. The main preparation of this paper was undertaken by Ian Elz with valuable contributions by all the other authors.

Conflicts of Interest

The authors declare no conflict of interest.

References

  1. Global Carbon Project (GCP). Available online: http://www.globalcarbonproject.org/carbonbudget/14/hl-full.htm (accessed on 14 June 2015).
  2. Global Forest Resources Assessment 2010; Food and Agricultural Organisation: Rome, Italy, 2010; p. 343.
  3. Hansen, M.C.; Potapov, P.V.; Moore, R.; Hancher, M.; Turubanova, S.A.; Tyukavina, A.; Thau, D.; Stehman, S.V.; Goetz, S.J.; Loveland, T.R.; et al. High-Resolution Global Maps of 21st-Century Forest Cover Change. Science 2013, 342, 850–853. [Google Scholar] [CrossRef] [PubMed]
  4. Gaveau, D.L.; Epting, J.; Lyne, O.; Linkie, M.; Kumara, I.; Kanninen, M.; Leader-Williams, N. Evaluating whether protected areas reduce tropical deforestation in Sumatra. J. Biogeogr. 2009, 36, 2165–2175. [Google Scholar] [CrossRef]
  5. Miettinen, J.; Shi, C.; Liew, S.C. Deforestation rates in insular Southeast Asia between 2000 and 2010. Glob. Change Biol. 2011, 17, 2261–2270. [Google Scholar] [CrossRef]
  6. Geist, H.J.; Lambin, E.F. What Drives Tropical Deforestation? A Meta-Analysis of Proximate and Underlying Causes of Deforestation Based on Subnational Case Study Evidence; LUCC Report Series 4; LUCC International Project Office: Louvain-la-Neuve, Belgium, 2001; p. 116. [Google Scholar]
  7. Geist, H.J.; Lambin, E.F. Proximate causes and underlying driving forces of tropical deforestation: Tropical forests are disappearing as the result of many pressures, both local and regional, acting in various combinations in different geographical locations. BioScience 2002, 52, 143–150. [Google Scholar] [CrossRef]
  8. Lambin, E.F.; Geist, H.J.; Lepers, E. Dynamics of land-use and land-cover change in tropical regions. Annu. Rev. Environ. Resour. 2003, 28, 205–241. [Google Scholar] [CrossRef]
  9. Carlson, K.M.; Curran, L.M.; Ratnasari, D.; Pittman, A.; Soares-Filho, B.S.; Asner, G.; Trigg, S.N.; Gaveau, D.A.; Lawrence, D.; Rodrigues, H.O. Committed carbon emissions, deforestation, and community land conversion from oil palm plantation expansion in West Kalimantan, Indonesia. Proc. Natl. Acad. Sci. USA 2012, 109, 7559–7564. [Google Scholar] [PubMed]
  10. Koh, L.P.; Miettinen, J.; Liew, S.C.; Ghazoul, J. Remotely sensed evidence of tropical peatland conversion to oil palm. Proc. Natl. Acad. Sci. USA 2011, 108, 5127–5132. [Google Scholar] [PubMed]
  11. Page, S.E.; Siegert, F.; Rieley, J.; Boehm, H.D.V.; Jaya, A.; Limin, S. The amount of carbon released from peat and forest fires in Indonesia during 1997. Nature 2002, 420, 61–65. [Google Scholar] [PubMed]
  12. Page, S.E.; Rieley, J.O.; Banks, C.J. Global and regional importance of the tropical peatland carbon pool. Glob. Change Biol. 2011, 17, 798–818. [Google Scholar] [CrossRef]
  13. IPCC. Climate Change 2013: The Physical Science Basis. Contribution of Working Group I to the Fifth Assessment Report of the Intergovernmental Panel on Climate Change; Cambridge University Press: Cambridge, UK, New York, NY, USA, 2013; p. 1535. [Google Scholar]
  14. Claridge, G. Management of coastal ecosystems in eastern Sumatra: The case of Berbak Wildlife Reserve, Jambi Province. Hydrobiologia 1994, 285, 287. [Google Scholar] [CrossRef]
  15. Ramsar Ramsar Information Sheet—Berbak National Park. 1991. Available online: https://rsis.ramsar.org/ris/554 (accessed on 13 July 2013).
  16. Miettinen, J.; Wang, J.; Hooijer, A.; Liew, S. Peatland conversion and degradation processes in insular Southeast Asia: a case study in Jambi, Indonesia. Land Degrad. Dev. 2011, 24, 334–341. [Google Scholar] [CrossRef]
  17. van Eijk, P.; Leenman, P. Regeneration of Fire Degraded Peatswamp Forest in Berbak National Park and Implementation in Replanting Programmes; Alterra Green World Research: Wageningen, The Netherlands, 2004; p. 71. [Google Scholar]
  18. Page, S.; Hoscilo, A.; Wösten, H.; Jauhiainen, J.; Silvius, M.; Rieley, J.; Ritzema, H.; Tansey, K.; Graham, L.; Vasander, H. Restoration ecology of lowland tropical peatlands in Southeast Asia: current knowledge and future research directions. Ecosystems 2009, 12, 888–905. [Google Scholar] [CrossRef]
  19. Minister of Forestry. Indonesia Forestry Minister’s Decision No. SK.549/2013—The Approval Procedures REDD+ Demonstration Activities in Berbak National Park Area; Minister of Forestry: Jakarta, Indonesia, 2013. [Google Scholar]
  20. Ainembabazi, J.H. A stepwise framework for developing REDD+ reference levels. In Analysing REDD+: Challenges and Choices; Cifor: Bogor Barat, Indonesia, 2012; pp. 279–300. [Google Scholar]
  21. Angelsen, A. How do we set the reference levels for REDD payments? In Moving Ahead with REDD: Issues, Options and Implications; Center for International Forestry Research (CIFOR): Bogor, Indonesia, 2008; pp. 53–56. [Google Scholar]
  22. Verified Carbon Standard. Available online: http://www.v-c-s.org/ (accessed on 13 July 2015).
  23. Estrada, M.; Joseph, S. Baselines and monitoring in local REDD+ projects. In Analysing REDD+: Challenges and Choices; Cifor: Bogor Barat, Indonesia, 2012; pp. 247–260. [Google Scholar]
  24. Dinamica Project. Available online: http://www.csr.ufmg.br/dinamica/ (accessed on 13 July 2013).
  25. Soares-Filho, B.S.; Rodrigues, H.O.; Costa, W.L.S. Modeling Environmental Dynamics with Dinamica EGO; Centro de Sensoriamento Remoto/UFMG: Belo Horizonte, MG, Brazil, 2009; p. 115. Available online: http://www.csr.ufmg.br/dinamica/tutorial/Dinamica_EGO_guidebook.pdf (accessed on 13 July 2015).
  26. Fuller, D.O.; Hardiono, M.; Meijaard, E. Deforestation projections for carbon-rich peat swamp forests of Central Kalimantan, Indonesia. Environ. Manage. 2011, 48, 436–447. [Google Scholar] [CrossRef] [PubMed]
  27. Agterberg, F.P. Combining indicator patterns in weights of evidence modeling for resource evaluation. Nonrenewable Resour. 1992, 1, 39–50. [Google Scholar] [CrossRef]
  28. Agterberg, F.P.; Bonham-Carter, G.F.; Cheng, Q.; Wright, D.F. Weights of evidence modeling and weighted logistic regression for mineral potential mapping. Comput. Geol. 1993, 25, 13–32. [Google Scholar]
  29. Cheng, Q.; Agterberg, F.P. Fuzzy Weights of Evidence Method and Its Application in Mineral Potential Mapping. Nat. Resour. Res. 1999, 8, 27–35. [Google Scholar] [CrossRef]
  30. Neuhäuser, B.; Terhorst, B. Landslide susceptibility assessment using “weights-of-evidence” applied to a study area at the Jurassic escarpment (SW-Germany). Geomorphology 2007, 86, 12–24. [Google Scholar] [CrossRef]
  31. Raines, G.L. Evaluation of weights of evidence to predict epithermal-gold deposits in the great basin of the western United States. Nat. Resour. Res. 1999, 8, 257–276. [Google Scholar] [CrossRef]
  32. Bonham-Carter, G.F.; Agterberg, F.P. Arc-WofE: A GIS tool for statistical integration of mineral exploration datasets. Bull Int Stat Inst 1999, 52, 497–500. [Google Scholar]
  33. CRISP SAFE—Resources—Land Cover Map. Available online: http://www.eorc.jaxa.jp/SAFE/LC_MAP/ (accessed on 12 August 2013).
  34. Miettinen, J.; Shi, C.; Tan, W.J.; Liew, S.C. 2010 land cover map of insular Southeast Asia in 250-m spatial resolution. Remote Sens. Lett. 2012, 3, 11–20. [Google Scholar] [CrossRef]
  35. Hagen, A. Fuzzy set approach to assessing similarity of categorical maps. Int. J. Geogr. Inf. Sci. 2003, 17, 235–249. [Google Scholar] [CrossRef]
  36. Costanza, R. Model goodness of fit: A multiple resolution procedure. Ecol. Model. 1989, 47, 199–215. [Google Scholar] [CrossRef]
  37. NOAA Climate Prediction Center—Monitoring & Data: ENSO Impacts on the U.S.—Previous Events. Available online: http://www.cpc.ncep.noaa.gov/products/analysis_monitoring/ensostuff/ensoyears.shtml (accessed on 15 August 2013).
  38. Maeda, E.E.; de Almeida, C.M.; de Carvalho Ximenes, A.; Formaggio, A.R.; Shimabukuro, Y.E.; Pellikka, P. Dynamic modeling of forest conversion: Simulation of past and future scenarios of rural activities expansion in the fringes of the Xingu National Park, Brazilian Amazon. Int. J. Appl. Earth Obs. Geoinf. 2011, 13, 435–446. [Google Scholar] [CrossRef]
  39. Lambin, E.F.; Meyfroidt, P. Global land use change, economic globalization, and the looming land scarcity. Proc. Natl. Acad. Sci. USA 2011, 108, 3465–3472. [Google Scholar] [CrossRef] [PubMed]
  40. Miettinen, J.; Hooijer, A.; Shi, C.; Tollenaar, D.; Vernimmen, R.; Liew, S.C.; Malins, C.; Page, S.E. Extent of industrial plantations on Southeast Asian peatlands in 2010 with analysis of historical expansion and future projections. GCB Bioenergy 2012, 4, 908–918. [Google Scholar] [CrossRef]
  41. Miettinen, J.; Hooijer, A.; Tollenaar, D.; Page, S.; Malins, C.; Vernimmen, R.; Shi, C.; Liew, S.C. Historical Analysis and Projection of Oil Palm Plantation Expansion on Peatland in Southeast Asia; International Council on Clean Transportation: Washington, DC, USA, 2012. [Google Scholar]
  42. WWF. WWF—Zero Net Deforestation and Degradation and Deforestation Fronts. Available online: http://wwf.panda.org/what_we_do/footprint/agriculture/soy/soyreport/soy_and_deforestation/zndd___deforestation_fronts/ (accessed on 14 July 2015).
  43. TFA2020 Tropical Forest Alliance 2020—Deforestation & Climate Change. Available online: http://www.tfa2020.com/ (accessed on 15 July 2015).

