Article

Glacier and Snow Cover Dynamics and Their Affecting Factors on the Pamir Plateau Section of the China–Pakistan Economic Corridor

1
College of Geographic Science and Tourism, Xinjiang Normal University, Urumqi 830054, China
2
Xinjiang Arid Area Lake Environment and Resources Laboratory, Key Laboratory of Xinjiang Uygur Autonomous Region, Urumqi 830054, China
3
Xinjiang Key Laboratory of Water Cycle and Utilization in Arid Zone, Urumqi 830011, China
4
State Key Laboratory of Desert and Oasis Ecology, Key Laboratory of Ecological Safety and Sustainable Development in Arid Lands, Xinjiang Institute of Ecology and Geography, Chinese Academy of Sciences, Urumqi 830011, China
5
State Key Laboratory of Lithospheric and Environmental Coevolution, Institute of Geology and Geophysics, Chinese Academy of Sciences, Beijing 100029, China
*
Authors to whom correspondence should be addressed.
Land 2025, 14(4), 880; https://doi.org/10.3390/land14040880
Submission received: 4 March 2025 / Revised: 11 April 2025 / Accepted: 15 April 2025 / Published: 16 April 2025

Abstract

:
The China–Pakistan economic corridor (CPEC) traverses the ecologically fragile and geologically hazardous Pamir plateau (PP), where glacier dynamics are critical for water resources and ecological stability. This study analyzes glacier changes in the PP segment of CPEC from 2000 to 2022 using Google Earth engine (GEE) and an improved glacier and snow cover extraction method. Results show that before CPEC’s initiation (2000–2014), glacier area fluctuated with an annual increase of 422 km2, peaking in 2010. After 2015, glacier area declined continuously at 1000 km2 per year, reaching a minimum in 2022. Snow cover also declined, especially post-2015. Glacier retreat was most severe in low-altitude regions, particularly in the eastern and southern PP, while higher altitudes (5000–7000 m) exhibited slower retreat. Climatic analysis reveals a strengthening negative correlation between temperature, evapotranspiration, and glacier area, indicating accelerated retreat due to global warming. These findings provide scientific support for ecological protection, water resource management, and geological hazard mitigation along CPEC.

1. Introduction

Global climate change has emerged as a major challenge affecting the Earth’s ecosystems. Glaciers, as sensitive indicators of climate change, reflect trends in the climate system [1,2]. In addition to serving as vital components of the Earth’s atmospheric and hydrological cycles, glaciers play an irreplaceable role in global water distribution and ecosystem services [3,4]. With rising temperatures, glaciers worldwide are generally retreating, particularly in high-mountain and high-latitude regions, where glacier areas have been decreasing annually and the instability of meltwater has significantly increased [5]. Accelerated glacier melt driven by global warming carries significant economic and social consequences [6]. Reduced glacial runoff can trigger water scarcity, which in turn adversely affects agricultural yields, hydropower production, and domestic water supply in downstream communities [7,8]. Moreover, the decline in glacier mass elevates the risk of natural hazards such as glacial lake outburst floods, which can severely damage infrastructure and disrupt local livelihoods [9,10]. Recent studies further reveal that the rapid loss of glacier mass not only jeopardizes water security but also places considerable economic and social burdens on communities dependent on glacial meltwater, thereby underscoring the urgent need for adaptive water management strategies [11,12]. Glacier retreat not only alters the spatiotemporal distribution of water resources but also has profound impacts on ecosystem stability and biodiversity; in regions frequently affected by geological hazards, such as the Pamir plateau (PP), glacier retreat further exacerbates the risks of landslides, debris flows, and other geohazards [13,14]. Therefore, systematically studying the spatiotemporal characteristics of glacier changes and their driving mechanisms is crucial for assessing the impacts of climate change on global ecosystems and the future dynamics of water resources [15,16].
The PP, located in a key area of the China–Pakistan economic corridor (CPEC), functions as the “water tower” of inland Asia, providing abundant glacial water resources to surrounding regions [17,18]. However, in recent years, glacier changes on the PP have become particularly pronounced, with the rate of glacier retreat accelerating significantly, glacier areas gradually diminishing, and meltwater volumes exhibiting considerable uncertainty [19,20]. As the primary provider of water resources in the region, changes in glaciers directly affect downstream river flow, agricultural irrigation, energy production, and the stability of the ecological environment [8,21]. In the context of increasingly scarce water resources, the issues related to water supply brought on by glacier retreat have become increasingly prominent, posing enormous challenges to the region’s socio-economic development and ecosystem integrity [22,23]. Moreover, glacier retreat has heightened the risk of geological hazards, further threatening local infrastructure and the safety of residents [24]. In-depth research on the characteristics of glacier changes on the PP and an exploration of their driving mechanisms are essential prerequisites for understanding future water resource supply, for understanding ecological changes, and for addressing the risks of geohazards in the region [25,26].
As a strategic corridor connecting China and Pakistan, the ecological environment along the CPEC is of paramount importance. The PP section, being a critical area within the corridor, has increasingly drawn attention in studies on glacier change [27,28,29]. In 2013, the long-term vision for the CPEC was formally proposed with the aim of supporting Pakistan’s infrastructure expansion and upgrade [30,31]. By 2015, the project was officially launched, further elevating Sino–Pak relations as the two nations evolved from a strategic partnership to an all-weather strategic partnership [32,33]. Although some studies have focused on glacier changes in the PP—particularly the rate of glacier retreat and its spatial distribution—these investigations have mostly concentrated on specific time periods or localized regions, lacking a systematic and comprehensive spatiotemporal analysis [34,35]. Existing research has primarily focused on the surface changes associated with glacier retreat, while in-depth examinations of the spatial distribution, dynamic evolution, and driving mechanisms of glacier change remain insufficient [36,37]. The driving factors of glacier change are complex and multifaceted, involving climatic factors, topographic features, the intrinsic dynamics of glaciers, and human activities [38]; notably, the impacts of climate change on mountain glaciers remain highly uncertain [39,40]. There remain significant gaps in the literature regarding these aspects, underscoring the urgent need for a comprehensive, multi-factor analysis to accurately assess and predict the trends of glacier change and its impacts on regional ecosystems [41,42].
Accordingly, the primary objectives of this study are to (1) analyze the spatiotemporal variations in glacier and snow cover areas in the PP section of the CPEC from 2000 to 2022 by employing an improved glacier and snow extraction method based on the Google Earth engine (GEE) platform, and to assess the accuracy of this method; (2) quantitatively examine the spatiotemporal variation patterns of glacier area across different elevation zones; and (3) explore the impact of climatic factors on glacier area changes using Pearson’s correlation analysis. The outcomes of this study not only provide new data support for research in regional climate change and glaciology but also offer a scientific basis and reference for ecological protection and water resource management along the CPEC, particularly by laying an important theoretical foundation for addressing the risks of geohazards triggered by glacier retreat.

2. Materials and Methods

2.1. Study Area

The CPEC spans the Xinjiang Uyghur Autonomous Region in China and the entire territory of Pakistan, stretching from Kashgar in northern Xinjiang to Gwadar Port in southwestern Pakistan (Figure 1) [43]. Based on the actual distribution of the corridor and relevant studies, this research focuses on the PP section (33–38° N, 71–78° E) as the study area, which is characteristic of an arid, high-mountain ecosystem [44,45]. The region’s high elevation and complex, variable climate make it one of the areas most significantly affected by global climate change, thereby holding considerable value for studies on ecology, climate, and water resources. The PP is a key component of the “Asian Water Tower” and nurtures the largest endorheic river in Central Asia—the Amu Darya—and its major tributaries [46,47]. Situated in the upper reaches of the Amu Darya and deep inland, the area experiences a strongly continental climate, with sparse precipitation on the plains and runoff primarily sustained by mountain precipitation and glacial meltwater [48,49]. Mountain glaciers on the PP cover an area exceeding 10,000 km2, with large-scale glaciers mainly concentrated around the Somoni Peak–Lenin Peak region in the northwest and the Mustagh–Kongur Peak area in the southeast, while other mountainous regions are dominated by smaller glaciers [50].

2.2. Data Sources

The remote sensing data used in this study were obtained through the GEE (https://earthengine.google.com, accessed 11 December 2024) and cover the period from 2000 to 2022. The datasets employed for glacier and snow cover extraction include the MODIS 8-day composite surface reflectance product Version 006 (MOD09A1) with a resolution of 500 m, and the L5-thematic mapper (TM) and L8-operational land imager (OLI) surface reflectance products with a resolution of 30 m, which were used for accuracy validation. In addition, annual climate factor data (including temperature, precipitation, wind speed, solar radiation, and evapotranspiration) for the PP section of the CPEC were extracted through GEE for the period 2000 to 2022. These data, sourced from the “ECMWF/ERA5_LAND/MONTHLY_AGGR” dataset, were used to analyze the climatic driving factors influencing glacier area changes. Detailed optical band characteristics of the satellite data are provided in Table 1.

2.3. Methods

2.3.1. Remote Sensing-Based Extraction of Glacier and Snow Cover in GEE

The GEE is a geospatial data processing platform based on cloud computing, offering a large quantity of remote sensing images and environmental datasets. It offers powerful analysis and visualization capabilities and is widely used in environmental monitoring and scientific research [51]. GEE has been extensively applied to extract geographic information such as glaciers, vegetation, and land use, as well as for change detection and environmental assessment [52]. Therefore, this study employs GEE to extract glacier and snow cover areas in the PP section of the CPEC. To analyze snow cover changes from 2000 to 2022, this study uses MODIS 8-day composite remote sensing imagery. Summer is the optimal season for distinguishing glaciers from seasonal snow because snow in high-altitude areas provides material for glaciers, whereas seasonal snow typically melts by the end of summer. However, cloud cover is common on the PP during summer, which complicates the extraction of glacier boundaries. To reduce the influence of snow on glacier area extraction, all images from the summer months (July to September) were utilized, and a composite surface reflectance image was generated using median time-series filtering. Ultimately, areas with a normalized difference snow index (NDSI) greater than 0.4 were designated as glacier areas, even though this may include some late-summer seasonal snow.
Glaciers and snow exhibit strong reflectance in the green band and significant absorption in the shortwave infrared band, resulting in distinct spectral differences that enable their differentiation from other land cover types while effectively minimizing atmospheric effects [53,54]. Therefore, the normalized difference snow index (NDSI) is commonly used for extracting glaciers and snow. The specific formula is as follows:
N D S I = G r e e n M O D I S   b a n d   4 S W I R M O D I S   b a n d   6 G r e e n M O D I S   b a n d   4 + S W I R M O D I S   b a n d   6
The NDSI takes advantage of the inherent spectral differences in snow and ice—exhibiting high reflectance in the visible green band due to high albedo and low reflectance in the SWIR as a result of molecular absorption—to effectively distinguish these surfaces from other land covers. Based on previous research, we adopted an NDSI threshold of 0.4 as optimal for identifying glacier and snow cover in remote sensing imagery [55,56]. Sensitivity analyses, which varied the threshold between 0.35 and 0.45, confirmed that 0.4 offers the best balance between accurate detection and the minimization of false positives under variable atmospheric conditions.
By applying median filtering to the MODIS surface reflectance data, composite summer surface reflectance images for each band were generated, and the normalized difference snow index (NDSI) was calculated using bands 4 and 6. Pixels with an NDSI value of 0.4 or higher were defined as glacier, thereby deriving the interannual glacier area and determining the preliminary glacier boundaries.
The near-infrared band (NIR band ≥ 0.11) is widely used to reduce the interference of water pixels in glacier extraction. To minimize the misclassification of water pixels as snow during NDSI extraction, this study employed the normalized difference water index (NDWI) combined with a threshold method to extract water body coverage and generate a water mask [57,58]. Because water vapor exhibits strong absorption in the near-infrared band and high reflectance in the green band, NDWI effectively enhances water body information while reducing vegetation interference using the following equation [59]:
N D W I = G r e e n M O D I S   b a n d   4 N I R M O D I S   b a n d   2 G r e e n M O D I S   b a n d   4 + N I R M O D I S   b a n d   2
Combining the normalized difference water index (NDWI) with a threshold method (NDWI > 0.2, NIR band < 0.2), water bodies were extracted and a water mask was generated. Using the composite summer surface reflectance data, the interannual glacier area in the PP section of the CPEC was calculated for the period 2000 to 2022, and the water mask was applied to remove the influence of water pixels on the glacier area extraction.
For snow cover extraction, this study utilized the MODIS 8-day composite surface reflectance data to compute the normalized difference snow index (NDSI) and extract seasonal snow cover areas [60]. The snow cover extraction method is similar to that for glaciers: MODIS bands 4 and 6 were used to calculate the NDSI, and pixels were selected based on a combination of NDSI ≥ 0.4 and band 2 > 0.11 to obtain the preliminary seasonal snow cover area [61]. To further reduce the misclassification of water pixels, a water mask was generated using NDWI > 0.2 and band 2 < 0.2, and this mask was used to eliminate water pixel influence from the preliminary seasonal snow cover area [60]. Finally, pixels overlapping with the summer glacier area of the same year were removed to ensure that the extracted area accurately reflects the rapidly changing seasonal snow regions. The detailed operational workflow is shown in Figure 2.

2.3.2. Linear Regression Analysis

In this study, we employ a simple linear regression model to quantitatively assess the trends in glacier and snow cover changes over time in the PP section of the CPEC. Simple linear regression is a statistical method used to model the relationship between a dependent variable (Y) and an independent variable (X) via a straight-line equation [62], given by the following:
Y = a + b X
where Y represents the dependent variable, X represents the independent variable, a is the intercept, and b is the slope. In our analysis, time (year) is used as the independent variable, while glacier (or snow cover) area serves as the dependent variable. The resulting regression equations and corresponding slopes provide a numerical measure of the trend’s direction and magnitude, allowing us to confirm whether the observed variations indicate an overall increasing or decreasing trend. This approach complements our NDSI-based area calculations by offering robust statistical validation of the long-term trends observed in the study area.

2.3.3. Correlation Analysis

Pearson’s correlation analysis is commonly used to explore the linear relationships between variables and to determine whether they exhibit a positive or negative association [63]. In this study, Pearson’s correlation analysis was employed to investigate the relationship among diverse climatic factors such as temperature, precipitation, and glacier area. The specific formula is as follows:
r = X i X ¯ Y i Y ¯ X i X ¯ 2 Y i Y ¯ 2
where X i and Y i represent the values of the two variables, while X ¯ and Y ¯ denote their respective means. The Pearson correlation coefficient, r, ranges from −1 to +1. When r = 1, it indicates a perfect positive correlation, meaning that there is a perfect linear positive relationship between the two variables. Conversely, when r = −1, it signifies a perfect negative correlation, indicating a perfect linear negative relationship between them. An r value of 0 suggests that there is no linear relationship between the variables.

3. Results

3.1. Spatiotemporal Characteristics of Glaciers and Snow Cover

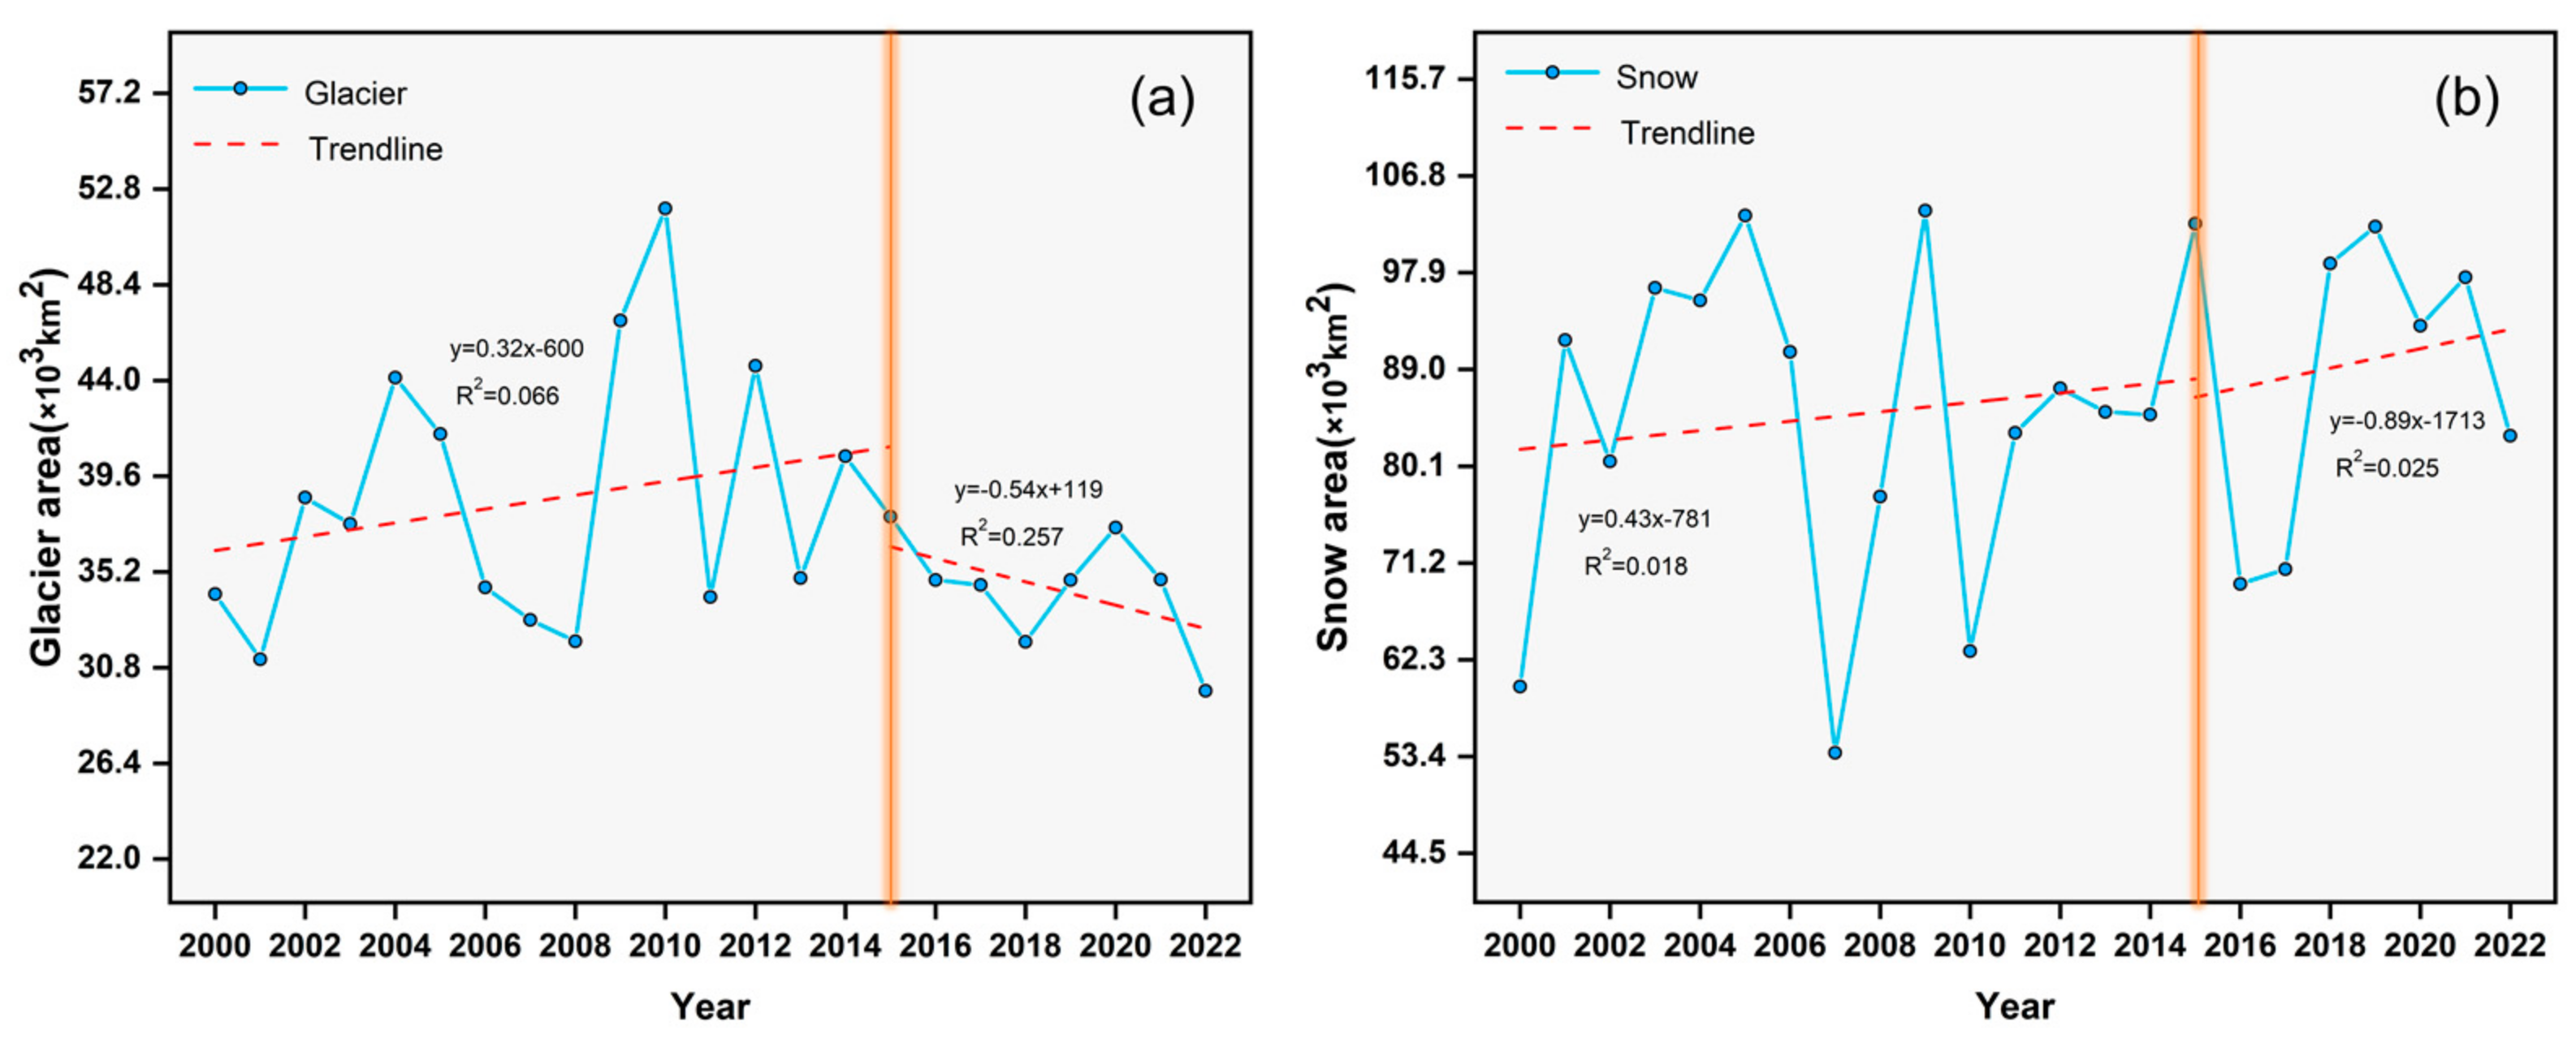
3.1.1. Temporal Variation Characteristics

By applying NDSI analysis to the MODIS summer composite imagery and using a threshold extraction method, the interannual variations in glacier and snow cover areas in the PP section of the CPEC before and after its launch (around 2015) were derived (Figure 3). The results indicate that between 2000 and 2022, the glacier area ranged from 29.74 × 10³ km2 to 51.90 × 10³ km2 (Figure 3a). Specifically, the glacier area was at its smallest in 2022 and at its largest in 2010. A comparative analysis of glacier area changes before and after the launch of the CPEC shows that before 2015, the glacier area increased in a fluctuating manner: from 34.19 × 10³ km2 in 2000 to its maximum in 2010 and then decreasing to 40.52 × 10³ km2 by 2014. Overall, prior to the corridor’s launch, the glacier area in the PP section exhibited an upward trend, with an average annual increment of around 422 km2. In contrast, after 2015, the glacier area decreased from 37.74 × 10³ km2 to 31.99 × 10³ km2 in 2018, then continued to decline in a fluctuating manner, ultimately reaching 29.74 × 10³ km2 in 2022. In summary, following the launch of the CPEC, the glacier area in the PP section demonstrated a continuous downward trend, with an average annual decrease of about 1000 km2.
The temporal trend of snow cover area in the PP section before and after the corridor’s launch was also analyzed (Figure 3b). The results indicate that from 2000 to 2022, the snow cover area generally exhibited an increasing trend. Notably, the minimum snow cover area occurred in 2007 (86.73 × 10³ km2), while the maximum was observed in 2009 (150.37 × 10³ km2). Analysis of the snow cover area changes reveals that before 2015, the snow cover area increased from 94 × 103 km2 in 2000 to 144.70 × 10³ km2 in 2005, followed by fluctuations that resulted in a decrease to 125.36 × 10³ km2 by 2014, with an average annual increase of approximately 1667 km2. After 2015, the snow cover area began to decline in a fluctuating manner, decreasing from 140.15 × 10³ km2 to 112.62 × 10³ km2 in 2022, with an average annual decrease of about 2440 km2.

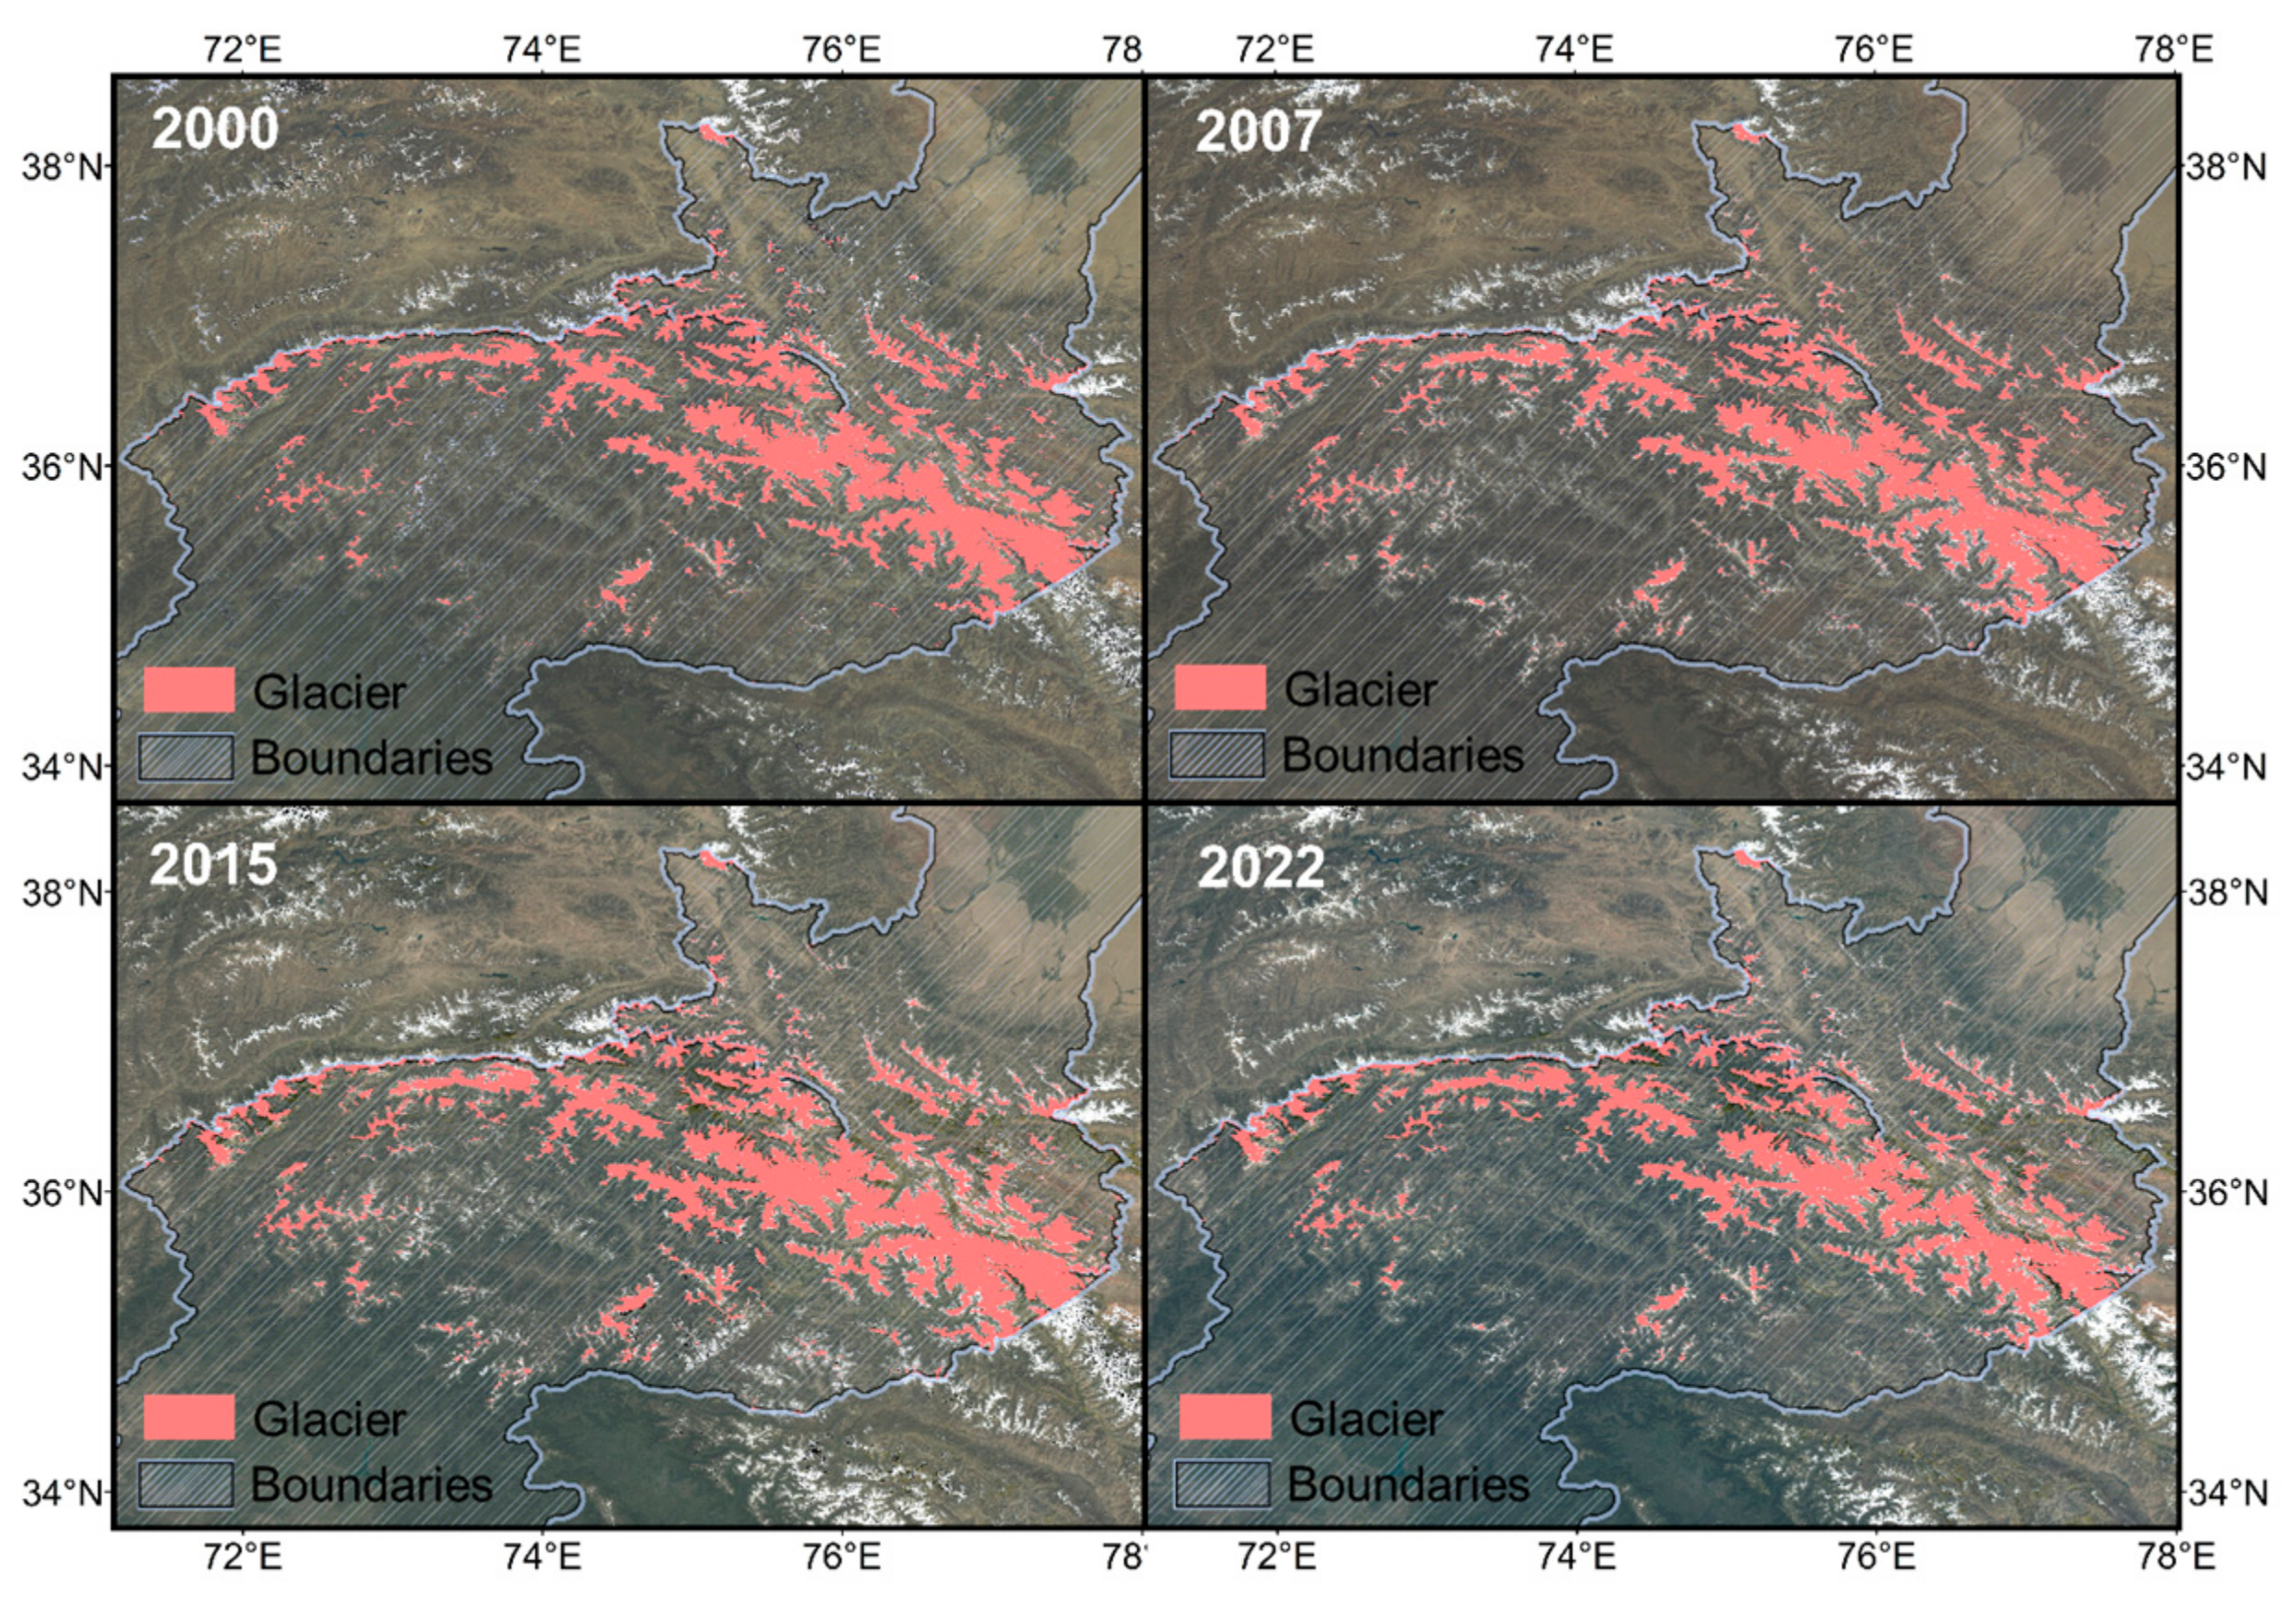
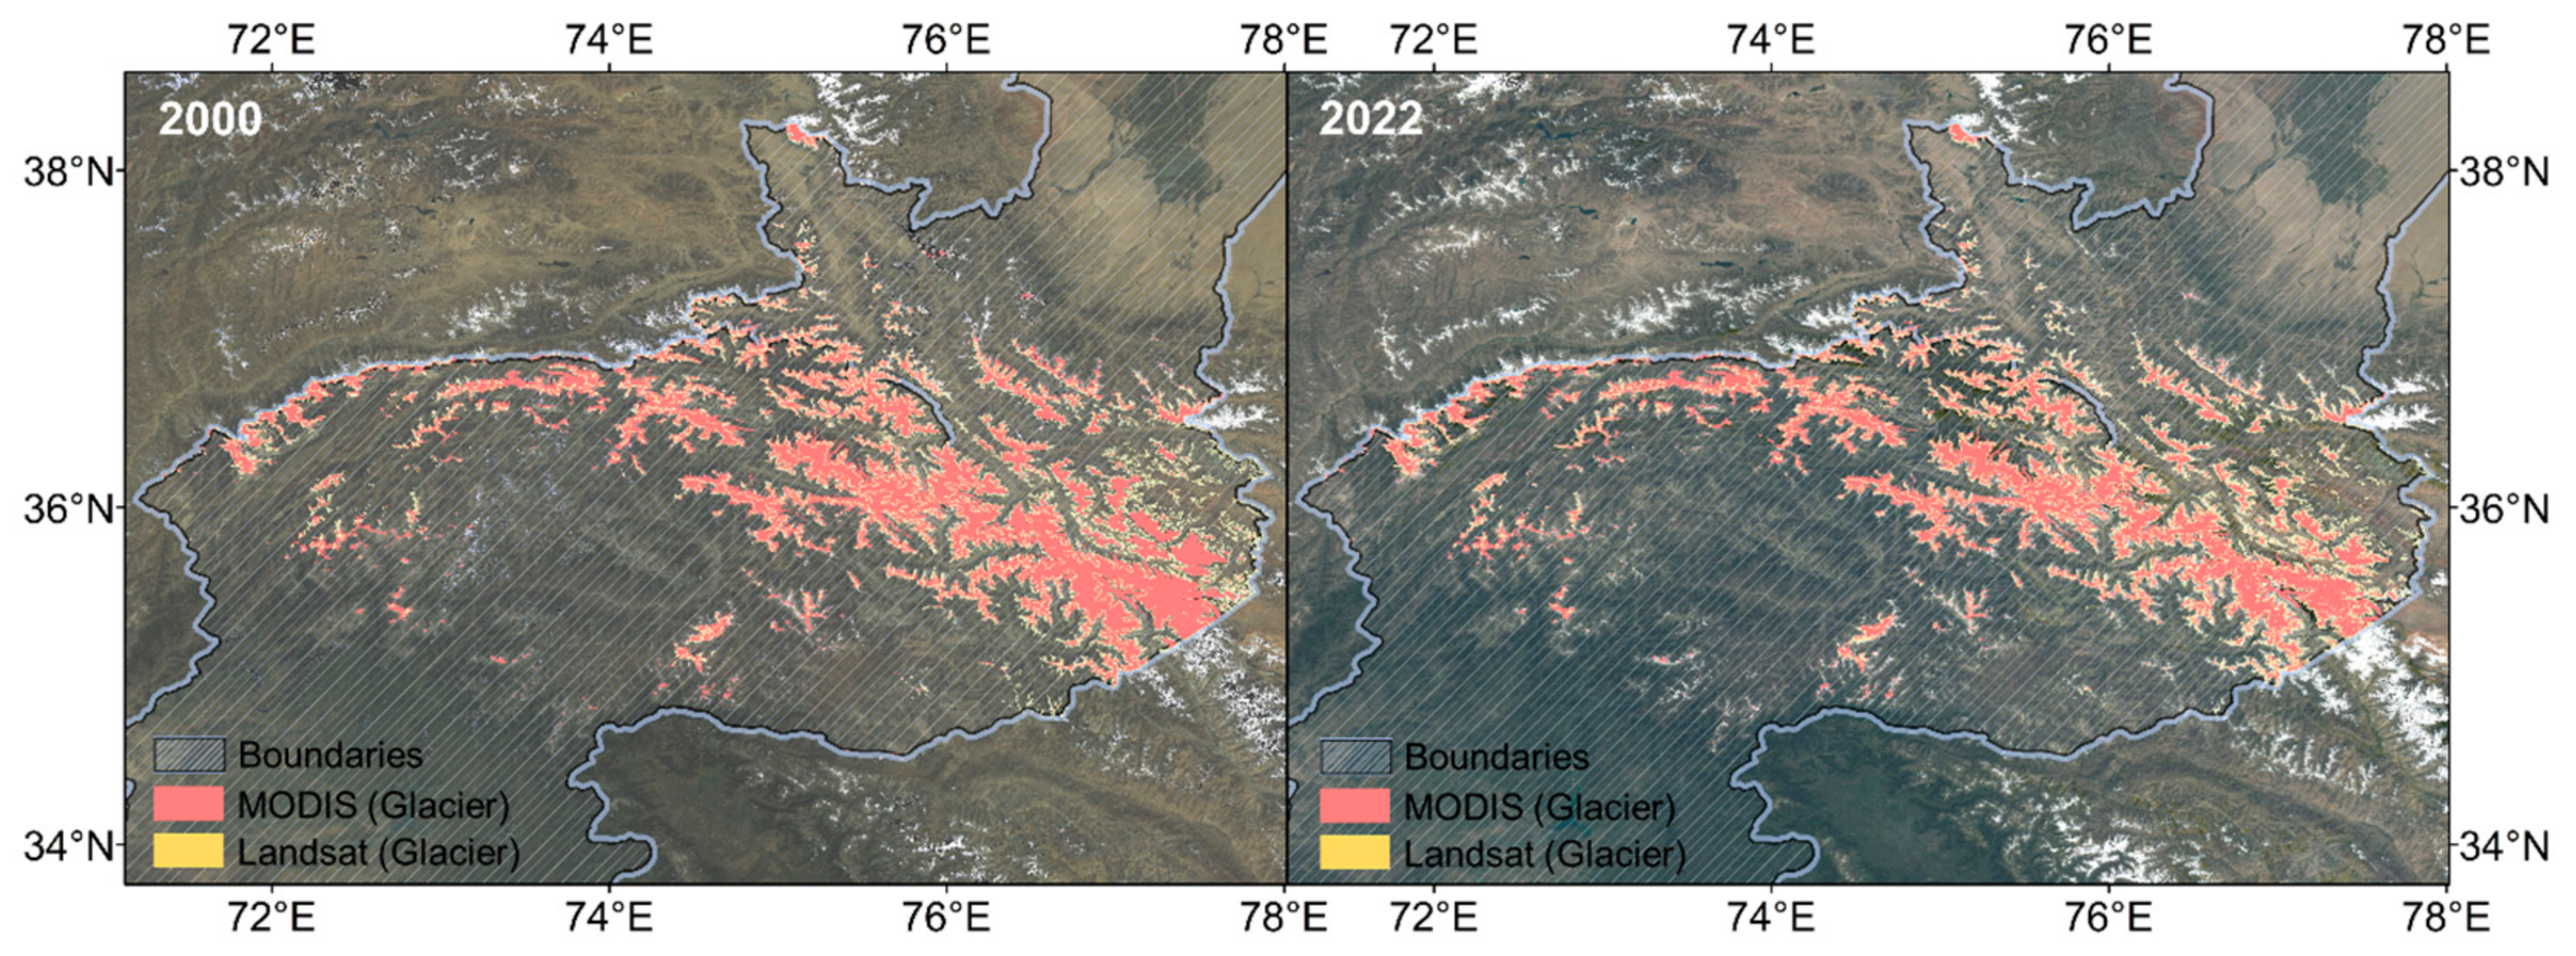
3.1.2. Spatial Variation Characteristics

In terms of spatial distribution, from 2000 to 2022 the trend of glacier retreat in the PP section gradually became evident, with notable differences in the degree of retreat among different regions (Figure 4). In 2000, glaciers were widely distributed in high-mountain areas, almost covering most of the region and showing a relatively stable distribution pattern. However, as time progressed, glacier areas gradually diminished, with the retreat becoming especially pronounced in 2007, 2015, and 2022. During these years, glacier areas progressively shrank, particularly in the eastern and southern regions of the PP where glaciers nearly completely degraded, clearly reflecting the impact of climate change. By 2022, the retreat had reached its peak, with significant glacier recession observed in almost all regions. Glacier distribution became noticeably concentrated in high-mountain areas, while glaciers in low-altitude regions almost disappeared. These changes indicate that global warming has had a profound impact on glaciers in the PP section, with the retreat intensifying both temporally and spatially, especially in certain areas. Such changes reflect the far-reaching influence of climate change on glacier distribution in the PP and provide important evidence for further research on water resource variations, ecological impacts, and regional climate change.

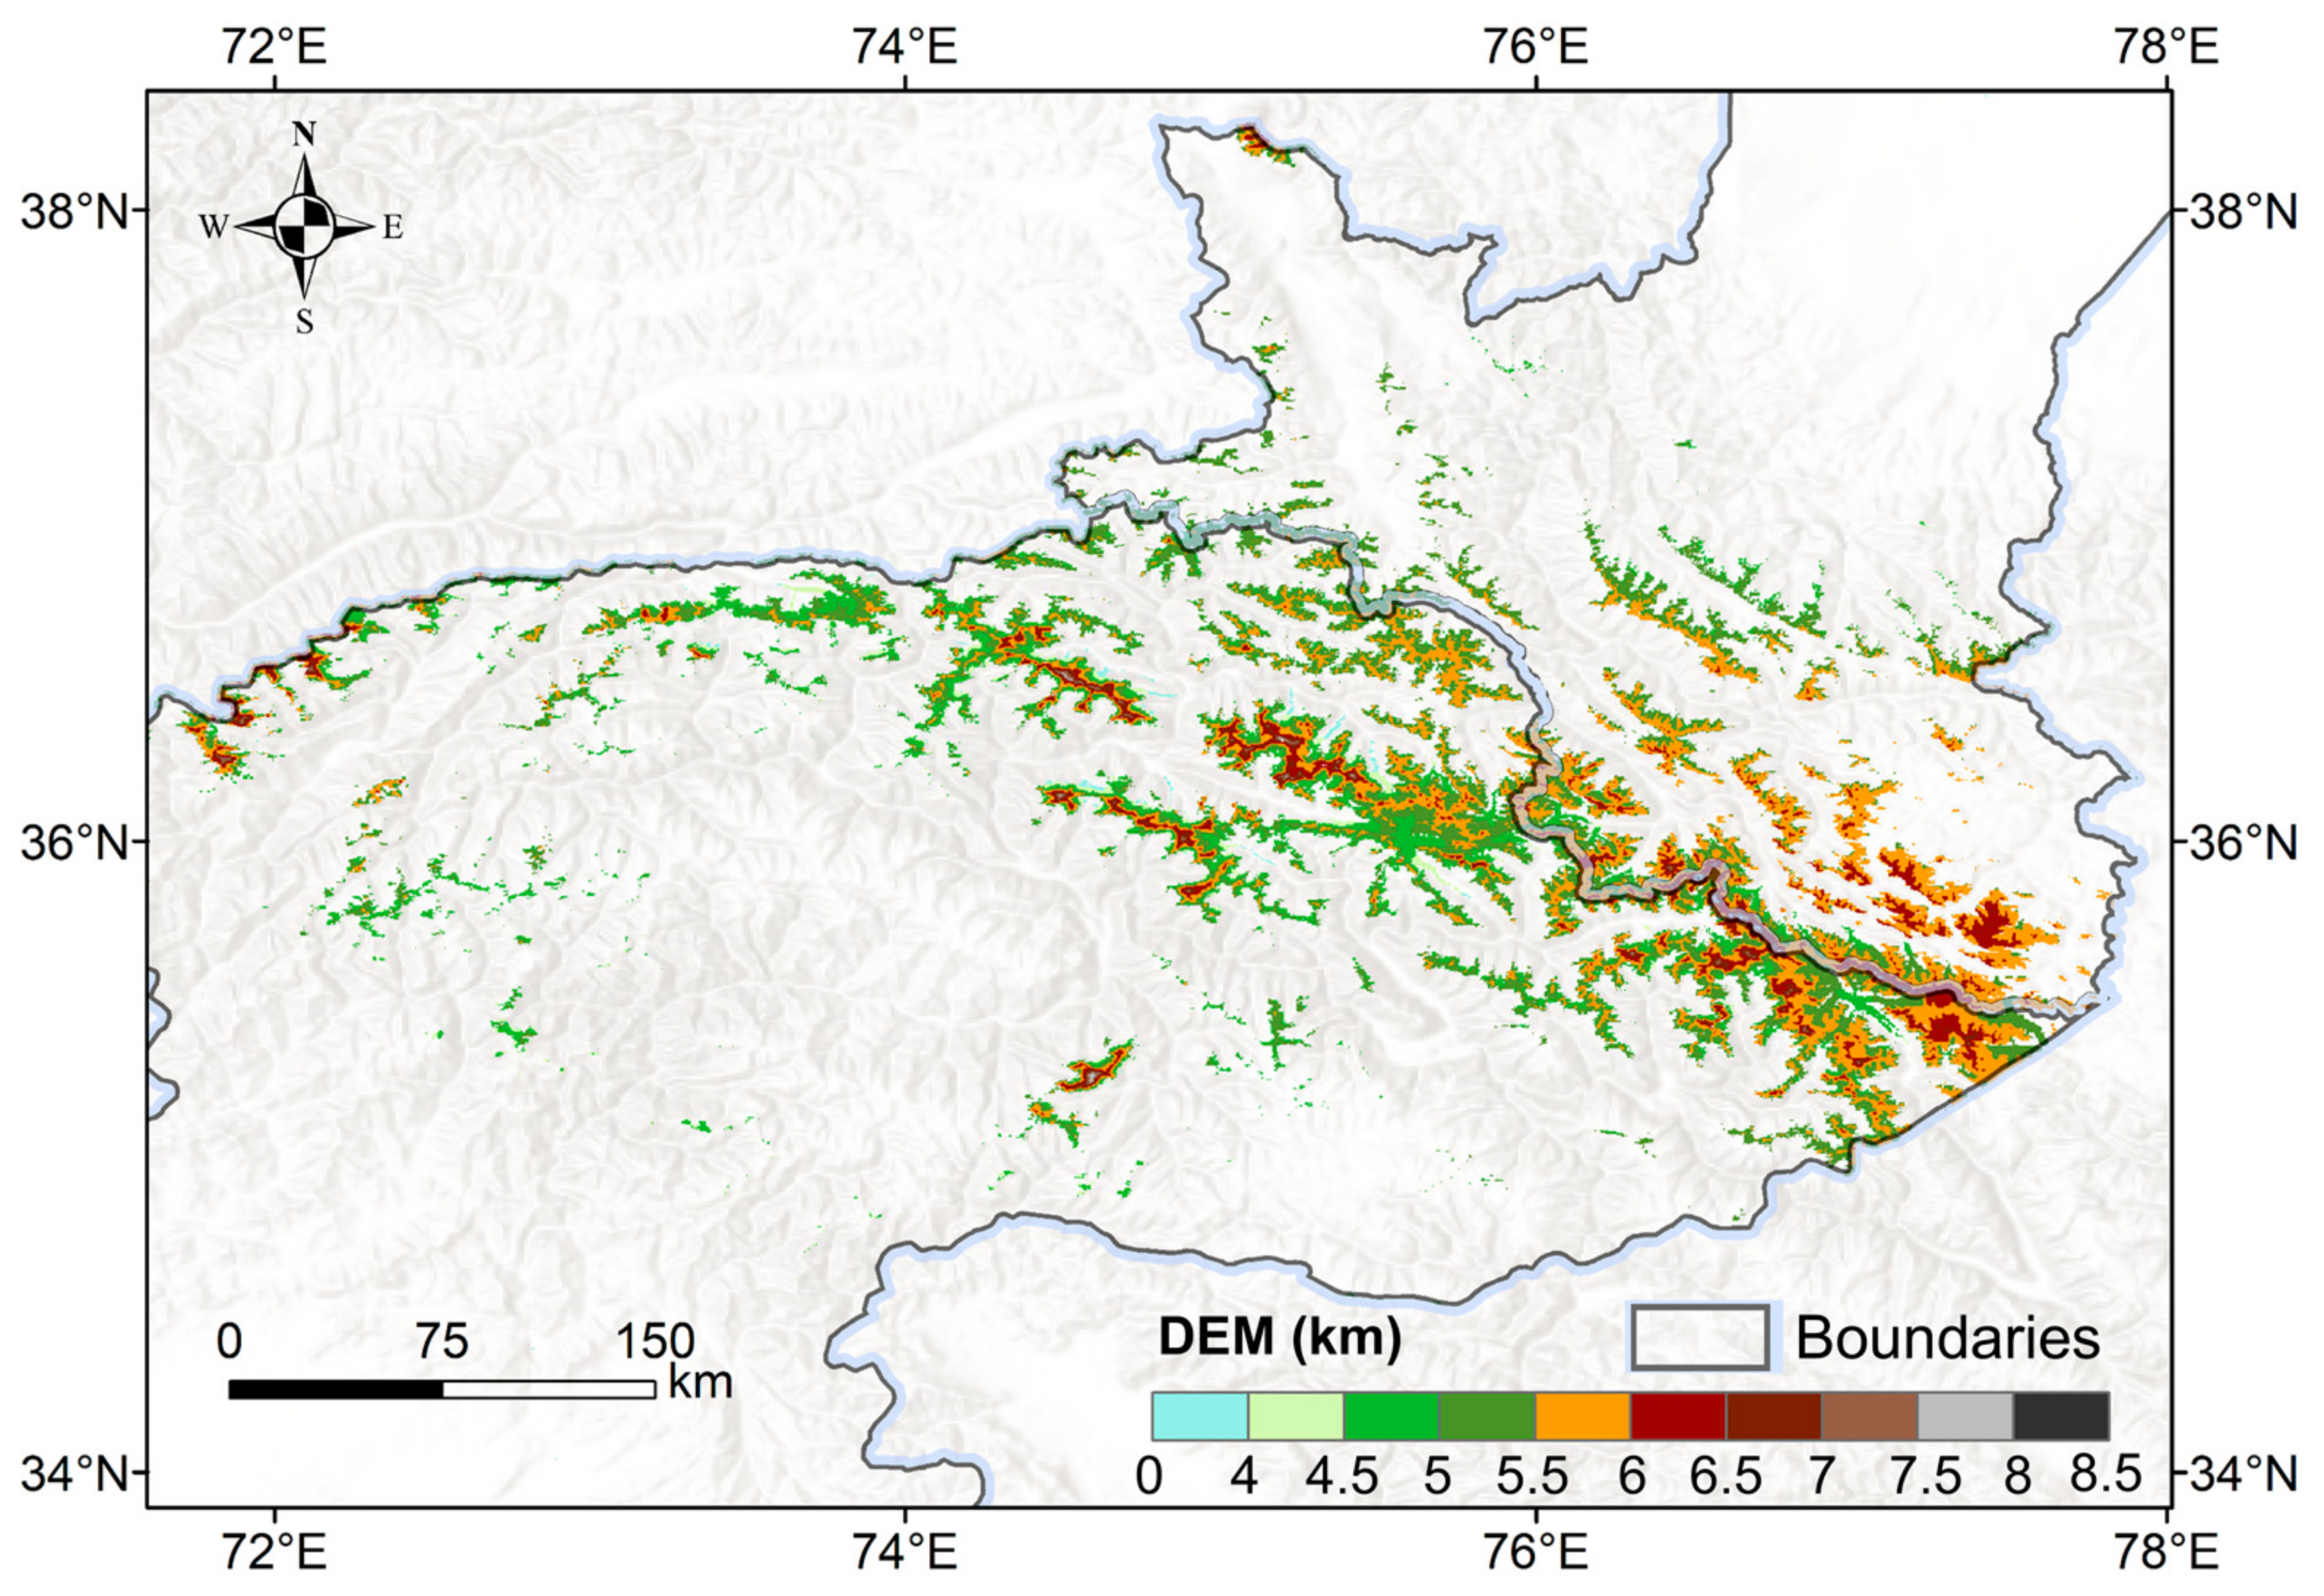
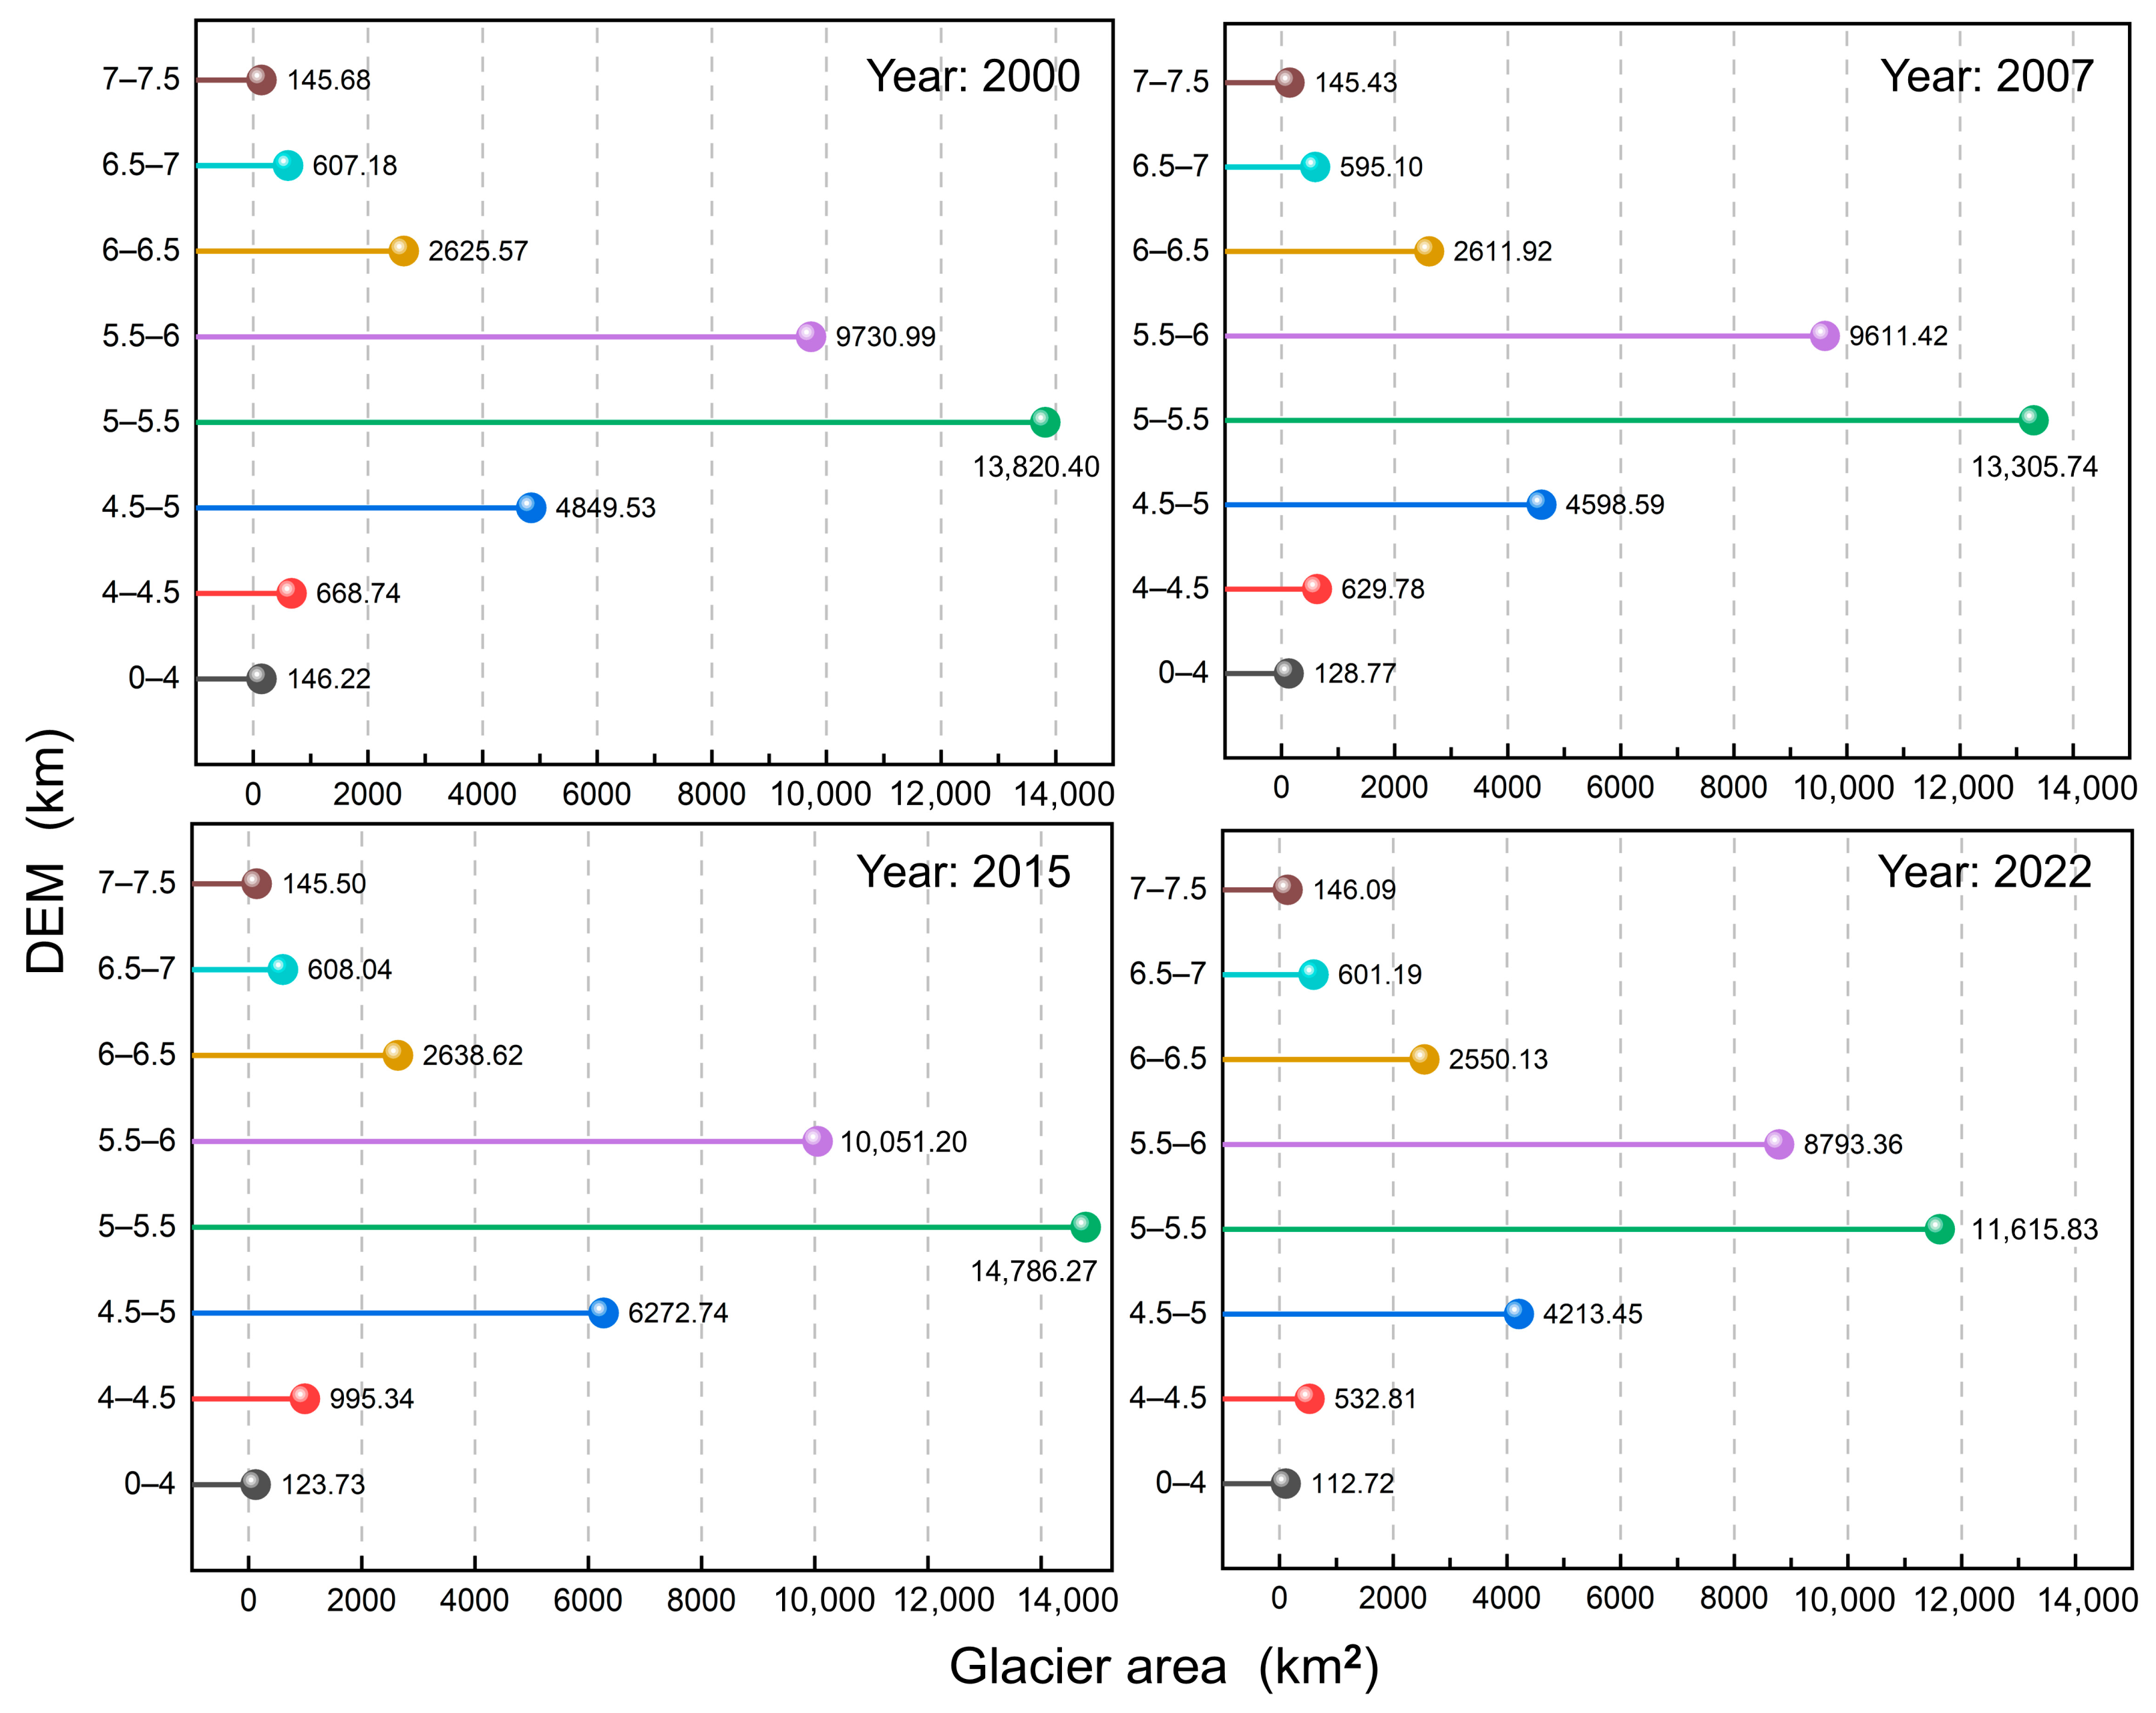
3.2. Glacier Distribution at Different Elevations

The spatial distribution of glaciers in the PP section of the CPEC shows a significant correlation with elevation (Figure 5). Glaciers in high-altitude areas are more widely distributed, while those in low-altitude regions exhibit a clear retreating trend. Overall, glaciers are primarily distributed within an elevation range of 4.5 km to 7 km. In higher elevation zones, particularly above 5 km, glacier coverage is relatively concentrated. These areas, typically located in the central and eastern parts of the PP, constitute the primary glacier distribution belt. Glaciers in these high-elevation areas remain relatively stable and maintain larger extents, suggesting that they respond more slowly to climate change with only minor variations. In contrast, in low-elevation areas—especially those below 4 km—the distribution of glaciers is sparse and the retreat phenomenon is particularly pronounced. In these regions, glacier areas have significantly decreased; notably, in the western PP, glaciers have nearly vanished, indicating that glaciers at lower elevations are more strongly affected by climate change. Overall, glaciers in low-elevation regions are degrading rapidly, whereas those in high-elevation areas remain relatively stable. This spatial distribution pattern highlights the strong influence of elevation on glacier distribution. Glaciers in high-elevation zones continue to maintain a broad distribution, while those at lower elevations have experienced significant retreat due to global warming.
In terms of temporal changes, the glacier areas at different elevations in the PP section of the CPEC in 2000, 2007, 2015, and 2022 show significant differences (Figure 6). Glaciers are primarily distributed within an elevation range of 4500 to 6500 m. Among these, the 5 to 5.5 km elevation band exhibits the largest glacier area, followed by the 5.5 to 6 km and 4.5 to 5 km bands, while the glacier area above 7.5 km is the smallest. Compared with 2000, the glacier area in the 5 to 5.5 km elevation band decreased from 138.20 × 10² km2 to 116.16 × 10² km2 by 2022, with a total reduction of 2204 km2 and an average annual decrease of approximately 95.83 km2. In the 5.5 to 6 km band, the glacier area declined from 97.31 × 10² km2 to 87.93 × 10² km2, with a total loss of 938 km2 and an average annual decrease of about 40.78 km2. In the 4.5 to 5 km elevation band, the glacier area decreased from 48.50 × 10² km2 in 2000 to 42.13 × 10² km2 in 2022, with a total reduction of 636 km2 and an average annual decrease of approximately 27.65 km2. In contrast, changes in other elevation bands over the past two decades were relatively minor. Notably, in the 7 to 7.5 km elevation band, the glacier area slightly increased from 145.68 km2 to 146.09 km2, with a total increase of only 0.41 km2 and an average annual growth rate of 0.02 km2.

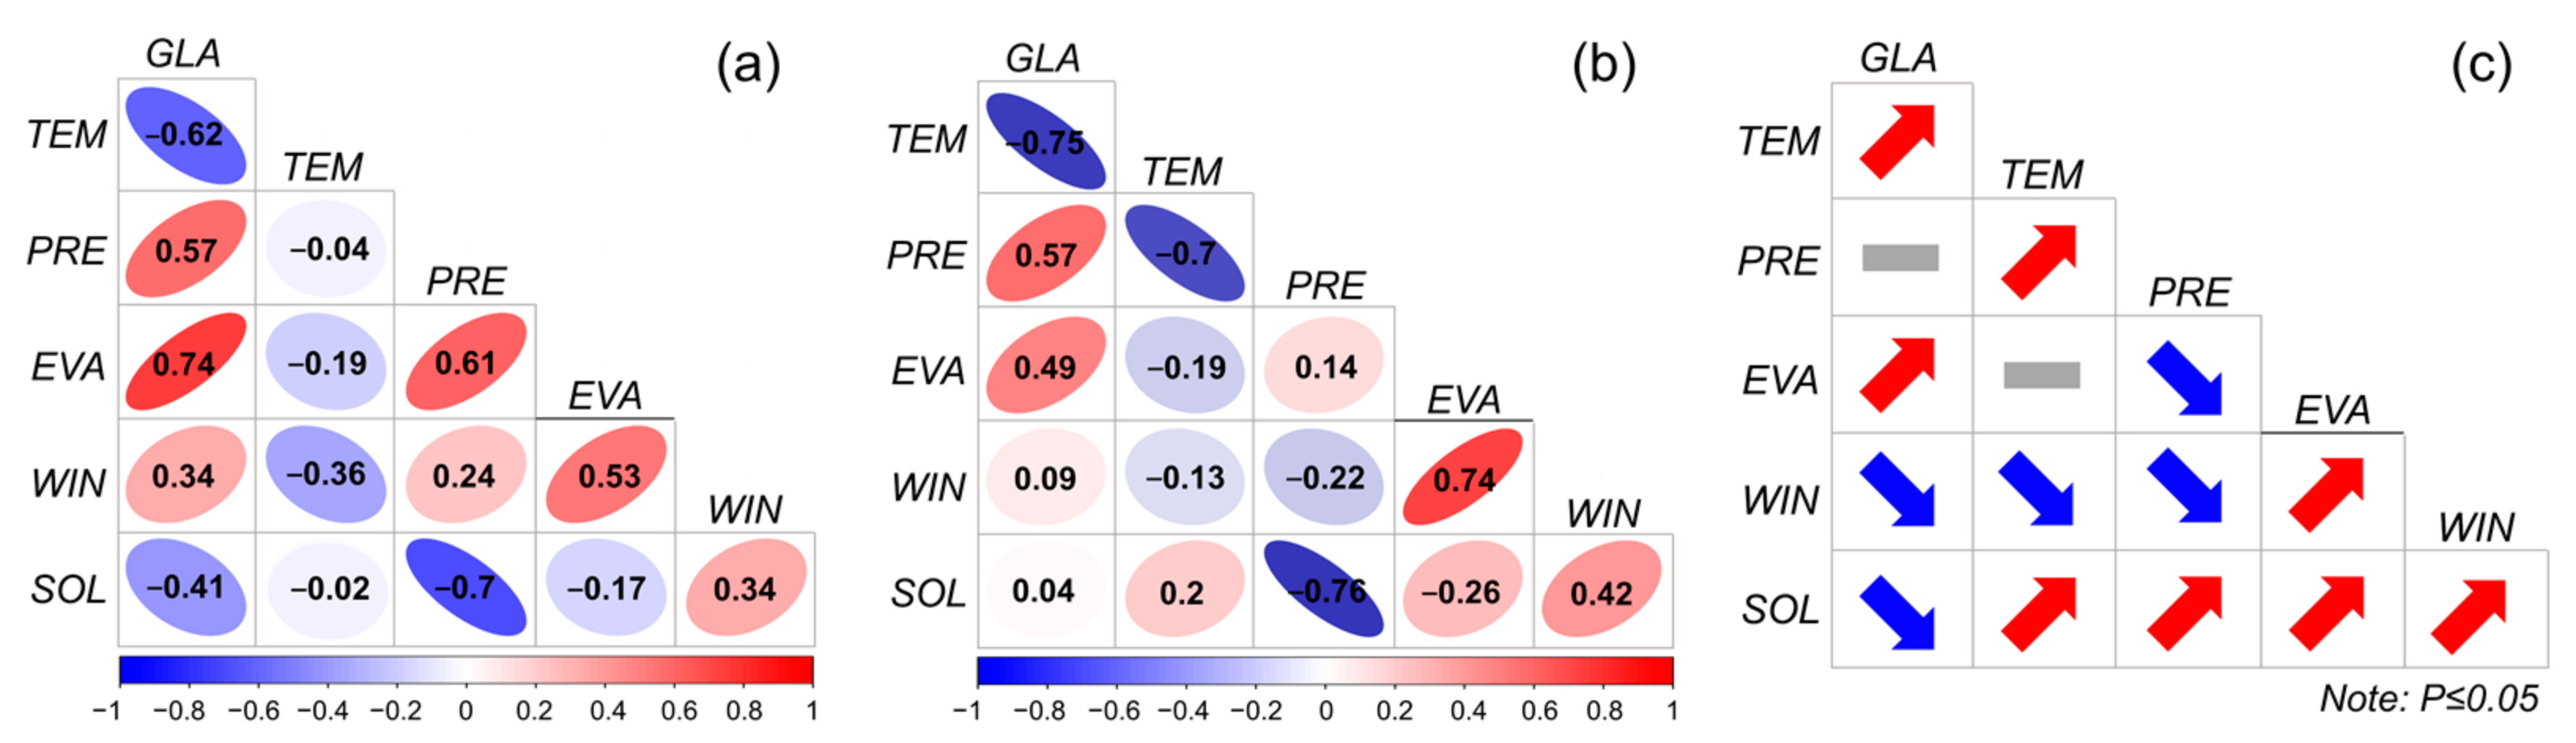
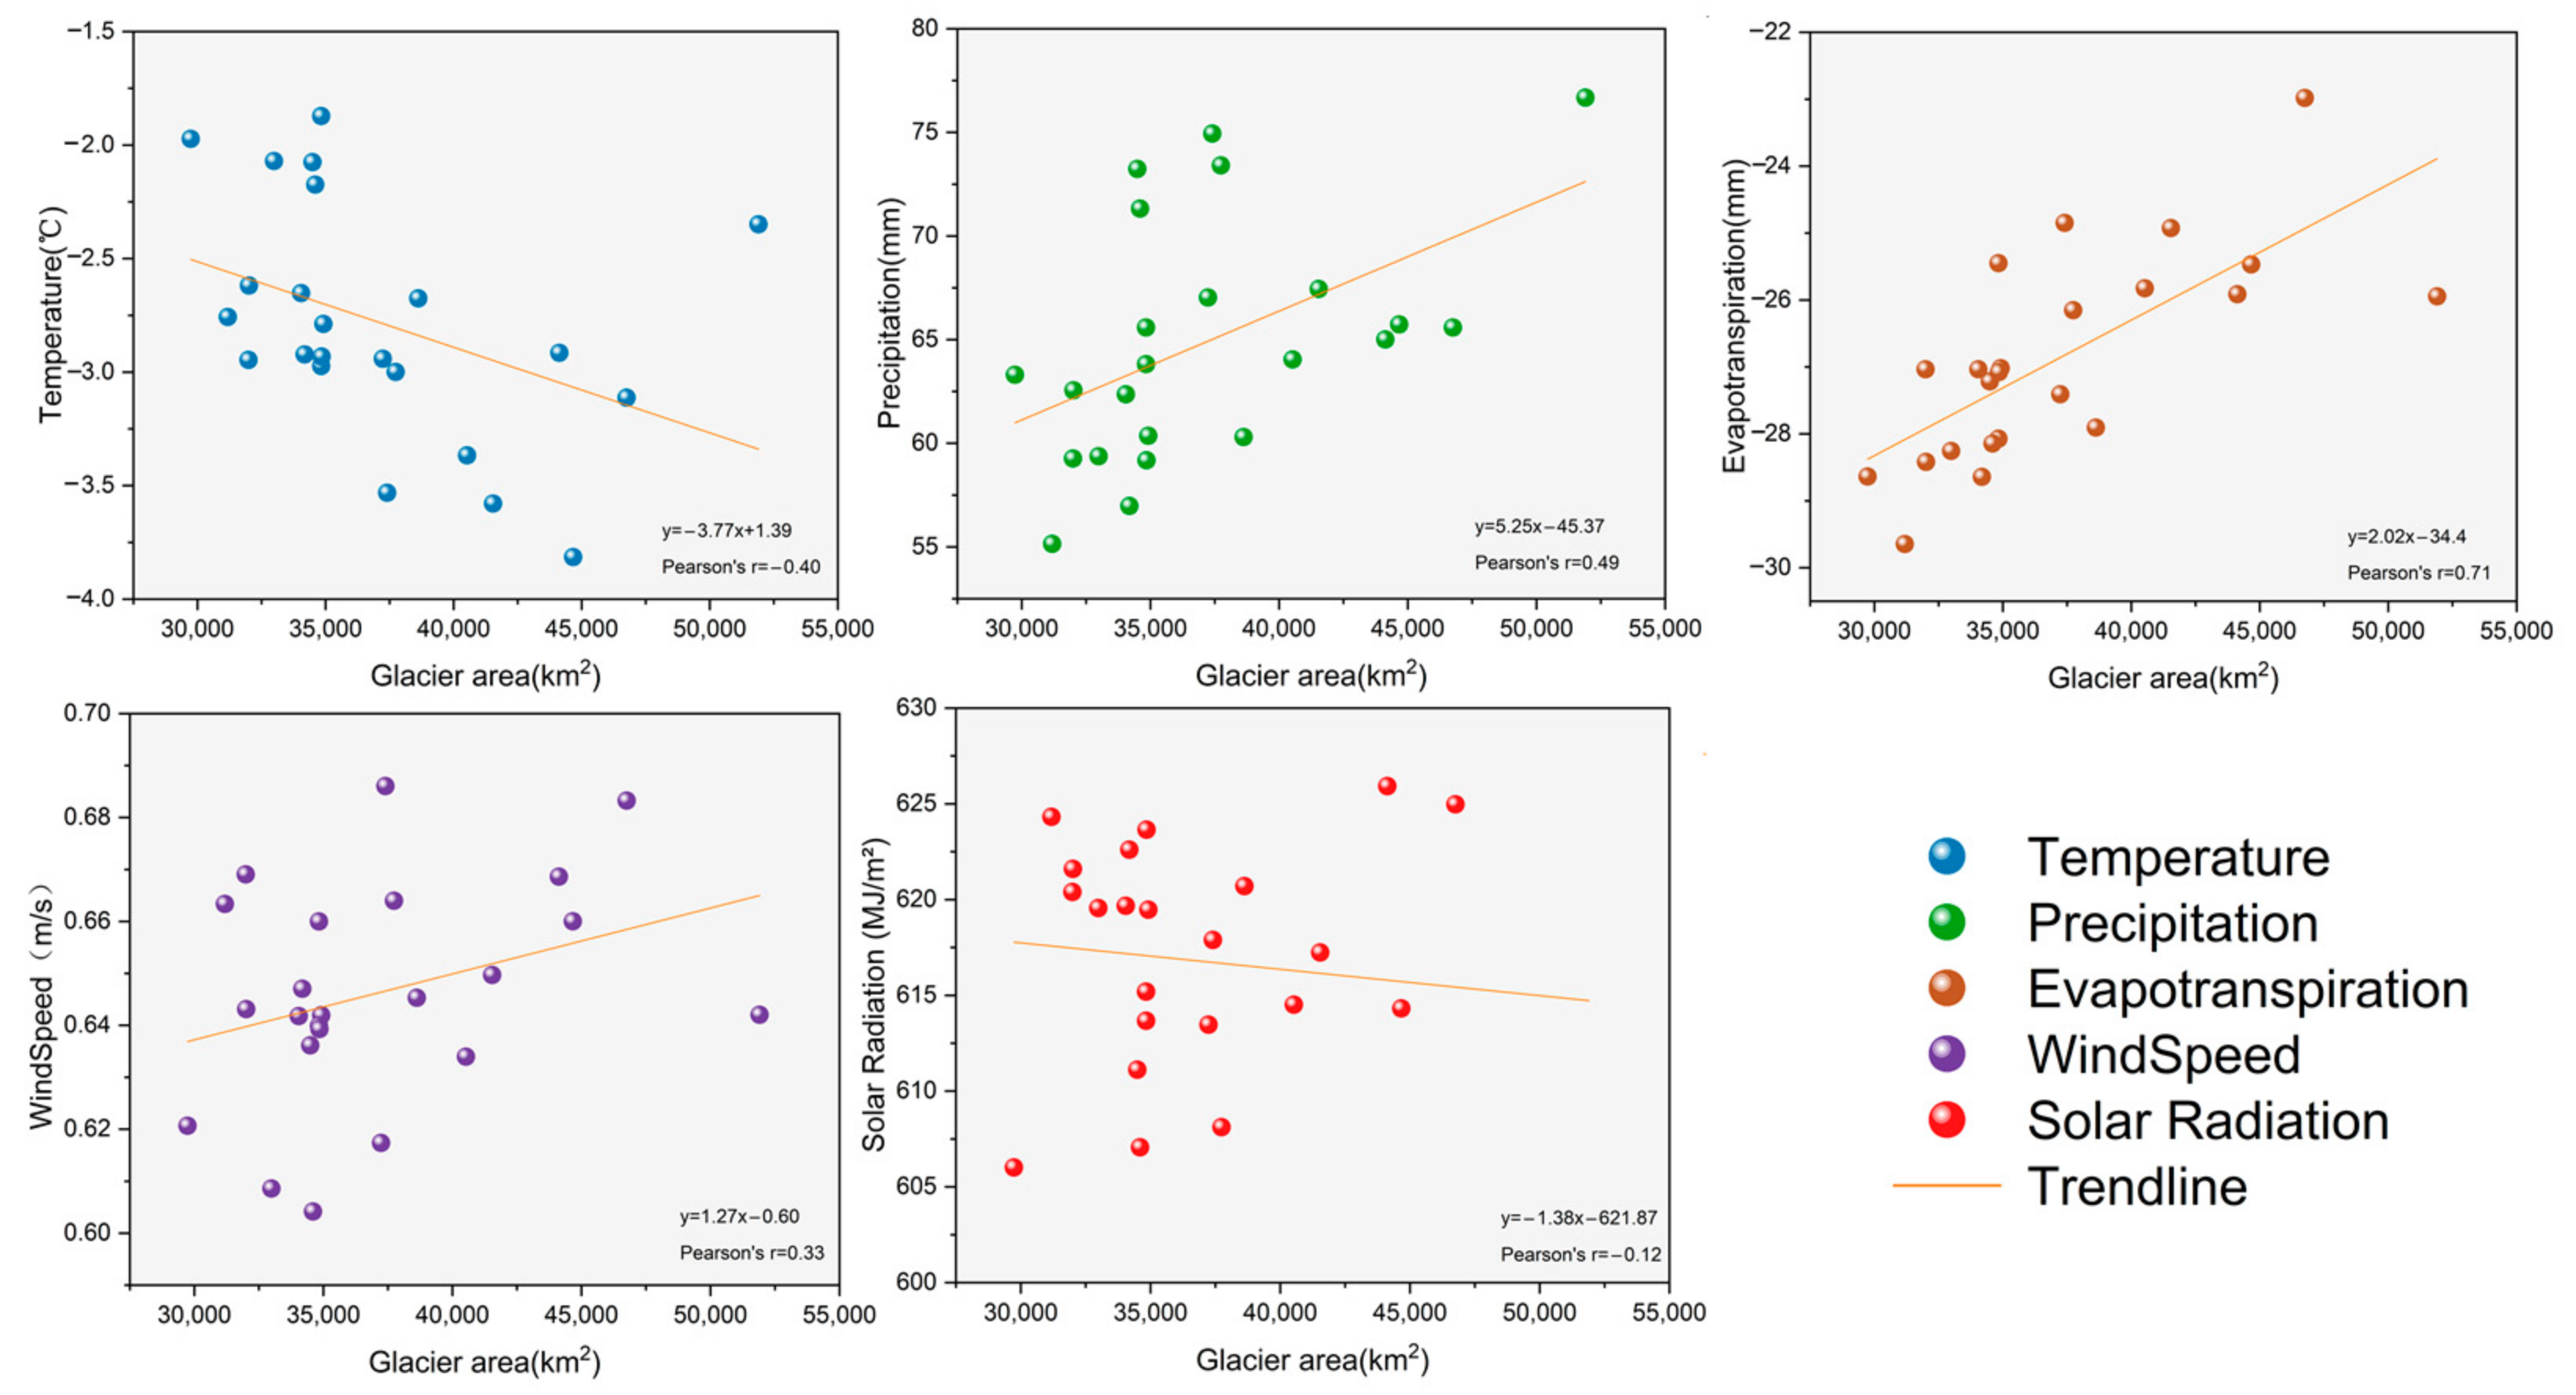
3.3. Correlation Analysis Between Climatic Factors and Glaciers

By performing correlation analysis between various climatic factors and glacier area in the PP section before and after the initiation of the CPEC (Figure 7), the results indicate significant changes in these relationships. Before 2015 (Figure 7a), evapotranspiration (EVA) exhibited the strongest positive correlation (+0.74) with glacier area (GLA), indicating that over the 2000–2022 period, EVA was the most influential factor affecting glacier change, with its increase likely accelerating glacier melt and retreat. Secondly, temperature (TEM) showed a significant negative correlation (−0.62) with glacier area, meaning that higher TEMs are associated with more pronounced glacier changes. Precipitation (PRE) and wind speed (WIN) displayed correlations of +0.57 and +0.34 with glacier area, respectively, suggesting a moderate positive association. In contrast, solar radiation (SOL) exhibited the lowest correlation (−0.41), implying that increases in SOL may have a relatively minor effect on glaciers. After 2015 (Figure 7b), TEM showed the strongest negative correlation with glacier area (−0.75). In addition, PRE and EVA maintained positive correlations with glacier area, at +0.57 and +0.49, respectively. Wind speed (WIN) and SOL had much weaker correlations at +0.09 and +0.04, indicating that their influence on glacier changes is relatively minor. Comparing the trends before and after the project initiation (Figure 7c) reveals that the correlations of TEM and EVA with glacier area have increased over the past 20 years, indicating that the driving effect of climate change on glacier retreat has become more significant. In contrast, the correlations for WIN and SOL have decreased, suggesting that their impact on glacier change is gradually diminishing. The influence of PRE on glaciers has remained relatively stable, with its correlation level showing little variation.
For a more quantitative assessment, Figure 8 presents the results of linear regression analyses between glacier area and key climatic factors. The derived regression equations robustly illustrate both the magnitude and direction of these relationships. Notably, the negative coefficients for temperature indicate that increasing temperatures are strongly associated with reductions in glacier area, whereas the positive coefficients for evapotranspiration underscore its considerable influence on glacier dynamics. Overall, these regression models not only validate our correlation analysis but also quantitatively delineate the sensitivity of glacier retreat to climatic variations, thereby enhancing our understanding of the underlying driving mechanisms.

4. Discussion

4.1. Uncertainty Analysis

This study utilized Landsat 5 and Landsat 8 data in combination with the NDSI and threshold extraction methods to obtain glacier area estimates for the PP section of the CPEC in 2000 and 2022. These estimates were compared with those derived from MODIS data for the corresponding years to evaluate the accuracy of MODIS-based glacier area extraction. The results indicate that there are notable differences between MODIS and Landsat in glacier area extraction. In particular, the glacier areas derived from MODIS data were generally higher than those from Landsat data in both 2000 and 2022, resulting in relatively large relative errors. According to the comparison results (Table 2), in 2000 the glacier area extracted from MODIS was 33.06 × 10³ km2, whereas the area from Landsat data was 24.43 × 10³ km2, corresponding to a relative error of 35.31%. By 2022, the glacier area from MODIS was 29.03 × 10³ km2, compared to 21.66 × 10³ km2 from Landsat data, yielding a relative error of 34.01%.These findings suggest that although Landsat data, with its higher spatial resolution (30 m), can provide more detailed glacier boundary information, its excessively fine resolution does not offer a clear advantage in large-scale glacier area estimation and may even amplify local errors [64]. In contrast, MODIS data—with its lower spatial resolution (250 m to 1 km)—can effectively estimate glacier area over larger regions, particularly in high-elevation areas where it provides more consistent and broadly covered glacier distribution data, thereby conferring a distinct advantage in large-scale glacier monitoring [65]. In terms of spatial distribution (Figure 9), glacier maps generated from MODIS data are more widespread and uniform, accurately reflecting glacier distribution trends across large areas. Conversely, Landsat data, which focuses on finer local details, may lead to overestimation or unnecessarily detailed delineation in certain regions. The observed one-third relative error underscores a significant limitation in our current approach, suggesting that future research should explore multi-sensor fusion or advanced processing techniques to reconcile these discrepancies and further reduce uncertainty in glacier area estimation. Therefore, despite the higher precision of Landsat data for glacier boundary extraction, MODIS data—with its superior spatiotemporal coverage—more effectively reflects overall glacier changes, making it particularly suitable for long-term, extensive glacier change studies [66].

4.2. Spatial and Temporal Heterogeneity in Glacier Evolution

The CPEC, as an important strategic construction project connecting China and Central Asia, traverses the ecologically fragile PP [67,68]. The advancement of the corridor has significantly affected the glacier system in the PP through climate change. In contrast, human activities—such as land use changes and pollution—have had a much smaller impact as the region is largely remote and sparsely populated [69,70]. Analysis of glacier area changes from 2000 to 2022 indicates that glacier evolution exhibits clear spatial and temporal heterogeneity. Specifically, glacier retreat shows marked differences across regions, with substantial disparities between high- and low-elevation areas [71,72]. Temporally, glacier area changes exhibit distinct phases. Between 2000 and 2014—prior to the launch of the CPEC—glacier areas demonstrated significant interannual variability, with occasional increases that peaked in 2010. This behavior, driven mainly by short-term climatic fluctuations, is consistent with the findings of Negi et al. [73], who also reported interannual variations in glacier extents under variable climatic conditions. Since 2015, glacier areas have experienced a consistent decline, with an increasingly rapid annual reduction. This pattern results from the synergistic effects of global warming, altered precipitation patterns, and changes in evapotranspiration rates, along with shifts in glacier hydrology—evidenced by a decline in glacier-water equivalents—that could reduce downstream freshwater availability. This accelerated retreat aligns with results reported by other researchers, such as Mehta [74], further confirming the dominant impact of recent warming trends on glacier dynamics. Spatially, glacier retreat is particularly pronounced in the eastern and southern sections of the PP, where glaciers in low-elevation areas have nearly disappeared [36,75]. Moreover, the hydrological, ecological, and socio-economic implications of these changes are significant as reduced glacier extents directly affect regional water supplies, alter local biodiversity, and place additional pressure on communities reliant on meltwater for agriculture and domestic use. Overall, the spatial and temporal heterogeneity of glacier evolution reflects the complex impacts of climate change on glacier dynamics [76]. Future research should integrate climate simulations and eco-hydrological models to further analyze glacier retreat trends across different elevations and regions [77], thereby offering a scientific foundation for the management of water resources and ecological protection in the CPEC and its adjacent areas.

5. Conclusions

Based on our analysis of MODIS data using composite summer imagery and NDSI threshold extraction, our study demonstrates that glaciers in the Pamir plateau section of the CPEC underwent significant spatiotemporal changes from 2000 to 2022. Prior to the corridor’s launch in 2015, glacier areas experienced a fluctuating increase—with an average annual growth of approximately 422 km2 and a peak in 2010—whereas after 2015, the glaciers entered a phase of continuous decline at an average annual rate of about 1000 km2. This temporal transition is paralleled by changes in snow cover, which increased until 2014 but then began declining, and is further underscored by marked spatial heterogeneity; glacier retreat is especially pronounced in low-elevation regions, notably in the eastern and southern areas where glaciers have nearly vanished, while those at higher elevations (primarily between 4.5 and 7 km) remain comparatively stable. Our correlation analyses reveal that rising temperatures and increasing evapotranspiration have intensified their negative impacts on glacier area over time, emphasizing the predominant role of global warming in glacier retreat. Moreover, our uncertainty analysis, which compared higher-resolution Landsat data with MODIS estimates, indicates a relative error of roughly one-third. This highlights the trade-off between detailed boundary delineation and broad-scale monitoring, and suggests that future research should explore multi-sensor fusion and advanced processing techniques to further refine glacier area estimations. Collectively, these findings underscore the complex interplay between climate change and regional development in this ecologically sensitive region.

Author Contributions

Conceptualization, methodology, Y.H. and X.M.; software, Y.H.; validation, Y.S.; formal analysis, investigation, Y.W.; resources, Y.W.; data curation, X.M.; writing—original draft preparation, Y.H.; writing—review and editing, visualization, Y.H.; supervision, Y.W.; project ad-ministration, funding acquisition, Y.S. and X.M.; All authors have read and agreed to the published version of the manuscript.

Funding

The authors of this study would like to express their appreciation for the sponsorship provided by the Science and Technology Partnership Program of the Shanghai Cooperation Organization and the International Science and Technology Cooperation Program, the Xinjiang Department of Science and Technology (Grant No. 2023E01005), the National Natural Science Foundation (42261051), the Xinjiang Tianshan Youth Talent Top Project (2023TSYCCX0078), and the Open Project of Key Laboratory, Xinjiang Uygur Autonomous Region (2023D04073).

Data Availability Statement

Data will be made available on request.

Acknowledgments

We would like to express our sincere thanks to the anonymous reviewers.

Conflicts of Interest

The authors declare no conflicts of interest.

References

  1. Cannone, N.; Diolaiuti, G.; Guglielmin, M.; Smiraglia, C. Accelerating climate change impacts on alpine glacier forefield ecosystems in the European Alps. Ecol. Appl. 2008, 18, 637–648. [Google Scholar] [CrossRef] [PubMed]
  2. Kløve, B.; Ala-Aho, P.; Bertrand, G.; Gurdak, J.J.; Kupfersberger, H.; Kværner, J.; Muotka, T.; Mykrä, H.; Preda, E.; Rossi, P. Climate change impacts on groundwater and dependent ecosystems. J. Hydrol. 2014, 518, 250–266. [Google Scholar] [CrossRef]
  3. Zhang, Z.; Liu, L.; He, X.; Li, Z.; Wang, P. Evaluation on glaciers ecological services value in the Tianshan Mountains, Northwest China. J. Geogr. Sci. 2019, 29, 101–114. [Google Scholar] [CrossRef]
  4. Fu, Q.; Li, B.; Yang, L.; Wu, Z.; Zhang, X. Ecosystem services evaluation and its spatial characteristics in Central Asia’s arid regions: A case study in Altay Prefecture, China. Sustainability 2015, 7, 8335–8353. [Google Scholar] [CrossRef]
  5. Benn, D.I.; Owen, L.A. Himalayan glacial sedimentary environments: A framework for reconstructing and dating the former extent of glaciers in high mountains. Quat. Int. 2002, 97, 3–25. [Google Scholar] [CrossRef]
  6. Mishra, A.K.; Singh, V.P.; Jain, S.K. Impact of global warming and climate change on social development. J. Comp. Soc. Welf. 2010, 26, 239–260. [Google Scholar] [CrossRef]
  7. Molden, D.J.; Shrestha, A.B.; Nepal, S.; Immerzeel, W.W. Downstream implications of climate change in the Himalayas. In Water Security, Climate Change and Sustainable Development; Springer: Berlin/Heidelberg, Germany, 2015; pp. 65–82. [Google Scholar] [CrossRef]
  8. Milner, A.M.; Khamis, K.; Battin, T.J.; Brittain, J.E.; Barrand, N.E.; Füreder, L.; Cauvy-Fraunié, S.; Gíslason, G.M.; Jacobsen, D.; Hannah, D.M. Glacier shrinkage driving global changes in downstream systems. Proc. Natl. Acad. Sci. USA 2017, 114, 9770–9778. [Google Scholar] [CrossRef]
  9. Shah, S.; Ishtiaque, A. Adaptation to Glacial Lake Outburst Floods (GLOFs) in the Hindukush-Himalaya: A Review. Climate 2025, 13, 60. [Google Scholar] [CrossRef]
  10. Dubey, S.; Goyal, M.K. Glacial lake outburst flood hazard, downstream impact, and risk over the Indian Himalayas. Water Resour. Res. 2020, 56, e2019WR026533. [Google Scholar] [CrossRef]
  11. Clason, C.; Rangecroft, S.; Owens, P.N.; Łokas, E.; Baccolo, G.; Selmes, N.; Beard, D.; Kitch, J.; Dextre, R.M.; Morera, S. Contribution of glaciers to water, energy and food security in mountain regions: Current perspectives and future priorities. Ann. Glaciol. 2022, 63, 73–78. [Google Scholar] [CrossRef]
  12. Drenkhan, F.; Buytaert, W.; Mackay, J.D.; Barrand, N.E.; Hannah, D.M.; Huggel, C. Looking beyond glaciers to understand mountain water security. Nat. Sustain. 2023, 6, 130–138. [Google Scholar] [CrossRef]
  13. Brighenti, S.; Tolotti, M.; Bruno, M.C.; Wharton, G.; Pusch, M.T.; Bertoldi, W. Ecosystem shifts in Alpine streams under glacier retreat and rock glacier thaw: A review. Sci. Total Environ. 2019, 675, 542–559. [Google Scholar] [CrossRef] [PubMed]
  14. Milner, A.M.; Brown, L.E.; Hannah, D.M. Hydroecological response of river systems to shrinking glaciers. Hydrol. Process. Int. J. 2009, 23, 62–77. [Google Scholar] [CrossRef]
  15. Su, B.; Xiao, C.; Chen, D.; Huang, Y.; Che, Y.; Zhao, H.; Zou, M.; Guo, R.; Wang, X.; Li, X. Glacier change in China over past decades: Spatiotemporal patterns and influencing factors. Earth Sci. Rev. 2022, 226, 103926. [Google Scholar] [CrossRef]
  16. Momblanch, A.; Holman, I.P.; Jain, S.K. Current practice and recommendations for modelling global change impacts on water resource in the Himalayas. Water 2019, 11, 1303. [Google Scholar] [CrossRef]
  17. Rippa, A. Mapping the margins of China’s global ambitions: Economic corridors, Silk Roads, and the end of proximity in the borderlands. Eurasian Geogr. Econ. 2020, 61, 55–76. [Google Scholar] [CrossRef]
  18. Tao, S.; Hui, L.; Yeerken, W. Decentralization and collaborative disaster governance for the China-Pakistan Economic Corridor: Current trends and implications. J. Resour. Ecol. 2023, 14, 974–982. [Google Scholar] [CrossRef]
  19. Wang, W.; Xiang, Y.; Gao, Y.; Lu, A.; Yao, T. Rapid expansion of glacial lakes caused by climate and glacier retreat in the Central Himalayas. Hydrol. Process. 2015, 29, 859–874. [Google Scholar] [CrossRef]
  20. Wang, R.; Yao, Z.; Wu, S.; Liu, Z. Glacier retreat and its impact on summertime run-off in a high-altitude ungauged catchment. Hydrol. Process. 2017, 31, 3672–3681. [Google Scholar] [CrossRef]
  21. Ross, A.R.; Chang, H. Modeling the system dynamics of irrigators’ resilience to climate change in a glacier-influenced watershed. Hydrol. Sci. J. 2021, 66, 1743–1757. [Google Scholar] [CrossRef]
  22. Sivakumar, B. Global climate change and its impacts on water resources planning and management: Assessment and challenges. Stoch. Environ. Res. Risk Assess. 2011, 25, 583–600. [Google Scholar] [CrossRef]
  23. Thompson, S.S.; Benn, D.I.; Dennis, K.; Luckman, A. A rapidly growing moraine-dammed glacial lake on Ngozumpa Glacier, Nepal. Geomorphology 2012, 145, 1–11. [Google Scholar] [CrossRef]
  24. Jóhannesdóttir, G.; Gísladóttir, G. People living under threat of volcanic hazard in southern Iceland: Vulnerability and risk perception. Nat. Hazards Earth Syst. Sci. 2010, 10, 407–420. [Google Scholar] [CrossRef]
  25. Wu, K.; Feng, J.; Cheng, P.; Bolch, T.; Jiang, Z.; Liu, S.; Tahir, A.A. Surge Mechanisms of Garmo Glacier: Integrating Multi-Source Data for Insights into Acceleration and Hydrological Control. Remote Sens. 2024, 16, 4619. [Google Scholar] [CrossRef]
  26. Han, Y.; Zuo, D.; Xu, Z.; Wang, G.; Peng, D.; Pang, B.; Yang, H. Attributing the impacts of vegetation and climate changes on the spatial heterogeneity of terrestrial water storage over the Tibetan Plateau. Remote Sens. 2022, 15, 117. [Google Scholar] [CrossRef]
  27. Kuszewska, A.; Nitza-Makowska, A. Multifaceted aspects of economic corridors in the context of regional security: The China–Pakistan economic corridor as a stabilising and destabilising factor. J. Asian Secur. Int. Aff. 2021, 8, 218–248. [Google Scholar] [CrossRef]
  28. Zhou, Y.; Li, X.; Zheng, D.; Zhang, X.; Wang, Y.; Ren, S.; Guo, Y. Decadal changes in glacier area, surface elevation and mass balance for 2000–2020 in the eastern tanggula mountains using optical images and tandem-x radar data. Remote Sens. 2022, 14, 506. [Google Scholar] [CrossRef]
  29. Munir, R.; Khayyam, U. Ecological corridors? The case of China-Pakistan economic corridor. Geoforum 2020, 117, 281–284. [Google Scholar] [CrossRef]
  30. Hussain, H.; Bogheiry, A.; Alam, T. China Pakistan Economic Corridor (CPEC): Opportunities and challenges for Implementation. Pak. J. Int. Aff. 2023, 6. [Google Scholar] [CrossRef]
  31. Kousar, S.; Rehman, A.; Zafar, M.; Ali, K.; Nasir, N. China-Pakistan Economic Corridor: A gateway to sustainable economic development. Int. J. Soc. Econ. 2018, 45, 909–924. [Google Scholar] [CrossRef]
  32. Lin, Y. Opportunities and challenges in current China–Pakistan economic and trade relations. In Annual Report on the Development of the Indian Ocean Region (2017) The Belt and Road Initiative and South Asia; Springer: Berlin/Heidelberg, Germany, 2018; pp. 213–236. [Google Scholar] [CrossRef]
  33. Weidong, S. Pakistan-China relations: CPEC and beyond. Policy Perspect. J. Inst. Policy Stud. 2017, 14, 3–12. [Google Scholar] [CrossRef]
  34. Zhang, Z.; Xu, J.-L.; Liu, S.-Y.; Guo, W.-Q.; Wei, J.-F.; Feng, T. Glacier changes since the early 1960s, eastern Pamir, China. J. Mt. Sci. 2016, 13, 276–291. [Google Scholar] [CrossRef]
  35. Yahya, M.; Noreen, U.; Attia, K.A.; Jabeen, F.; Aslam, A.; Anjum, N.; Abbasi, A.; Zaidi, S.F.H. Assessing climate-driven glacial retreat, snow-cover reduction and GLOF risks: Implications for water resource management amid rising global temperatures and CO2. Mar. Freshw. Res. 2024, 75, MF24177. [Google Scholar] [CrossRef]
  36. Zhang, M.; Chen, F.; Zhao, H.; Wang, J.; Wang, N. Recent changes of glacial lakes in the high mountain asia and its potential controlling factors analysis. Remote Sens. 2021, 13, 3757. [Google Scholar] [CrossRef]
  37. Liu, Z.; Yang, Z.; He, N.; Wei, L.; Zhu, Y.; Jiao, W.; Wang, Z.; Zhang, T.; Zhang, J.; Zou, X. Three decades of glacial lake research: A bibliometric and visual analysis of glacial lake identification. Front. Ecol. Evol. 2023, 11, 1296111. [Google Scholar] [CrossRef]
  38. Moore, R.; Fleming, S.; Menounos, B.; Wheate, R.; Fountain, A.; Stahl, K.; Holm, K.; Jakob, M. Glacier change in western North America: Influences on hydrology, geomorphic hazards and water quality. Hydrol. Process. Int. J. 2009, 23, 42–61. [Google Scholar] [CrossRef]
  39. Li, J.; Li, Z.-W.; Ding, X.-L.; Wang, Q.-J.; Zhu, J.-J.; Wang, C.-C. Investigating mountain glacier motion with the method of SAR intensity-tracking: Removal of topographic effects and analysis of the dynamic patterns. Earth Sci. Rev. 2014, 138, 179–195. [Google Scholar] [CrossRef]
  40. Urrutia, R.; Vuille, M. Climate change projections for the tropical Andes using a regional climate model: Temperature and precipitation simulations for the end of the 21st century. J. Geophys. Res. Atmos. 2009, 114, 2461–2479. [Google Scholar] [CrossRef]
  41. Montillet, J.-P.; Kermarrec, G.; Forootan, E.; Haberreiter, M.; He, X.; Finsterle, W.; Fernandes, R.; Shum, C. A review on how Big Data can help to monitor the environment and to mitigate risks due to climate change. IEEE Geosci. Remote Sens. Mag. 2024, 12, 67–89. [Google Scholar] [CrossRef]
  42. Feng, A.; Chao, Q. An overview of assessment methods and analysis for climate change risk in China. Phys. Chem. Earth Parts A/B/C 2020, 117, 102861. [Google Scholar] [CrossRef]
  43. Ali, S.M.; Ali, S.M. Case study 1: The China–Pakistan economic corridor. In China’s Belt and Road Vision: Geoeconomics and Geopolitics; Springer: Berlin/Heidelberg, Germany, 2020; pp. 175–230. [Google Scholar] [CrossRef]
  44. Shafqat, S. The China–Pakistan Economic Corridor. Rethink. China Middle East Asia Mult. World 2022, 34, 96. [Google Scholar] [CrossRef]
  45. Minxing, H.; Sayed, M. China-Pakistan Economic Corridor and Geostrategic Development in The Middle East. J. Pak. China Stud. 2022, 3, 37–52. [Google Scholar] [CrossRef]
  46. Yao, T.; Bolch, T.; Chen, D.; Gao, J.; Immerzeel, W.; Piao, S.; Su, F.; Thompson, L.; Wada, Y.; Wang, L. The imbalance of the Asian water tower. Nat. Rev. Earth Environ. 2022, 3, 618–632. [Google Scholar] [CrossRef]
  47. Zhang, Y.; Gao, T.; Kang, S.; Shangguan, D.; Luo, X. Albedo reduction as an important driver for glacier melting in Tibetan Plateau and its surrounding areas. Earth Sci. Rev. 2021, 220, 103735. [Google Scholar] [CrossRef]
  48. Khromova, T.; Osipova, G.; Tsvetkov, D.; Dyurgerov, M.; Barry, R. Changes in glacier extent in the eastern Pamir, Central Asia, determined from historical data and ASTER imagery. Remote Sens. Environ. 2006, 102, 24–32. [Google Scholar] [CrossRef]
  49. Wang, J.; Zhou, S.; Zhao, J.; Zheng, J.; Guo, X. Quaternary glacial geomorphology and glaciations of Kongur Mountain, eastern Pamir, China. Sci. China Earth Sci. 2011, 54, 591–602. [Google Scholar] [CrossRef]
  50. Li, Z.; Wang, N.; Chen, A.A.; Liang, Q.; Yang, D. Slight change of glaciers in the Pamir over the period 2000–2017. Arct. Antarct. Alp. Res. 2022, 54, 13–24. [Google Scholar] [CrossRef]
  51. Waleed, M.; Sajjad, M. On the emergence of geospatial cloud-based platforms for disaster risk management: A global scientometric review of google earth engine applications. Int. J. Disaster Risk Reduct. 2023, 97, 104056. [Google Scholar] [CrossRef]
  52. Ghosh, S.; Kumar, D.; Kumari, R. Google earth engine based computational system for the earth and environment monitoring applications during the COVID-19 pandemic using thresholding technique on SAR datasets. Phys. Chem. Earth Parts A/B/C 2022, 127, 103163. [Google Scholar] [CrossRef]
  53. Salomonson, V.V.; Appel, I. Estimating fractional snow cover from MODIS using the normalized difference snow index. Remote Sens. Environ. 2004, 89, 351–360. [Google Scholar] [CrossRef]
  54. Raghubanshi, S.; Agrawal, R.; Rathore, B.P. Enhanced snow cover mapping using object-based classification and normalized difference snow index (NDSI). Earth Sci. Inform. 2023, 16, 2813–2824. [Google Scholar] [CrossRef]
  55. Scherler, D.; Wulf, H.; Gorelick, N. Global assessment of supraglacial debris-cover extents. Geophys. Res. Lett. 2018, 45, 11798–11805. [Google Scholar] [CrossRef]
  56. Riggs, G.A.; Hall, D.K.; Román, M.O. Overview of NASA’s MODIS and visible infrared imaging radiometer suite (VIIRS) snow-cover earth system data records. Earth Syst. Sci. Data 2017, 9, 765–777. [Google Scholar] [CrossRef]
  57. Xu, H. Modification of normalised difference water index (NDWI) to enhance open water features in remotely sensed imagery. Int. J. Remote Sens. 2006, 27, 3025–3033. [Google Scholar] [CrossRef]
  58. Rad, A.M.; Kreitler, J.; Sadegh, M. Augmented Normalized Difference Water Index for improved surface water monitoring. Environ. Model. Softw. 2021, 140, 105030. [Google Scholar] [CrossRef]
  59. Liu, S.; Qiu, J.; Li, F. A remote sensing water information extraction method based on unsupervised form using probability function to describe the frequency Histogram of NDWI: A case study of Qinghai Lake in China. Water 2024, 16, 1755. [Google Scholar] [CrossRef]
  60. Ali, S.; Cheema, M.J.M.; Waqas, M.M.; Waseem, M.; Awan, U.K.; Khaliq, T. Changes in snow cover dynamics over the Indus Basin: Evidences from 2008 to 2018 MODIS NDSI trends analysis. Remote Sens. 2020, 12, 2782. [Google Scholar] [CrossRef]
  61. Shreve, C.M.; Okin, G.S.; Painter, T.H. Indices for estimating fractional snow cover in the western Tibetan Plateau. J. Glaciol. 2009, 55, 737–745. [Google Scholar] [CrossRef]
  62. Su, X.; Yan, X.; Tsai, C.L. Linear regression. Wiley Interdiscip. Rev. Comput. Stat. 2012, 4, 275–294. [Google Scholar] [CrossRef]
  63. Sedgwick, P. Pearson’s correlation coefficient. BMJ 2012, 345, e4483. [Google Scholar] [CrossRef]
  64. Racoviteanu, A.E.; Nicholson, L.; Glasser, N.F. Surface composition of debris-covered glaciers across the Himalaya using linear spectral unmixing of Landsat 8 OLI imagery. Cryosphere 2021, 15, 4557–4588. [Google Scholar] [CrossRef]
  65. Brun, F.; Dumont, M.; Wagnon, P.; Berthier, E.; Azam, M.; Shea, J.; Sirguey, P.; Rabatel, A.; Ramanathan, A. Seasonal changes in surface albedo of Himalayan glaciers from MODIS data and links with the annual mass balance. Cryosphere 2015, 9, 341–355. [Google Scholar] [CrossRef]
  66. Shea, J.; Menounos, B.; Moore, R.; Tennant, C. An approach to derive regional snow lines and glacier mass change from MODIS imagery, western North America. Cryosphere 2013, 7, 667–680. [Google Scholar] [CrossRef]
  67. Zhang, R.; Shi, G.; Wang, Y.; Zhao, S.; Ahmad, S.; Zhang, X.; Deng, Q. Social impact assessment of investment activities in the China–Pakistan economic corridor. Impact Assess. Proj. Apprais. 2018, 36, 331–347. [Google Scholar] [CrossRef]
  68. Hu, S. Connecting the “One Belt and One Road” initiative with the interconnected Himalayan region—Reflections on the construction of the China–Nepal–India Economic Corridor. In Annual Report on the Development of the Indian Ocean Region (2017) The Belt and Road Initiative and South Asia; Springer: Berlin/Heidelberg, Germany, 2018; pp. 51–101. [Google Scholar] [CrossRef]
  69. Pei, Y.; Qiu, H.; Yang, D.; Liu, Z.; Ma, S.; Li, J.; Cao, M.; Wufuer, W. Increasing landslide activity in the Taxkorgan River Basin (eastern Pamirs Plateau, China) driven by climate change. Catena 2023, 223, 106911. [Google Scholar] [CrossRef]
  70. Pei, Y.; Qiu, H.; Zhu, Y.; Wang, J.; Yang, D.; Tang, B.; Wang, F.; Cao, M. Elevation dependence of landslide activity induced by climate change in the eastern Pamirs. Landslides 2023, 20, 1115–1133. [Google Scholar] [CrossRef]
  71. Schmidt, S.; Nüsser, M. Changes of high altitude glaciers in the Trans-Himalaya of Ladakh over the past five decades (1969–2016). Geosciences 2017, 7, 27. [Google Scholar] [CrossRef]
  72. Bogdal, C.; Bucheli, T.D.; Agarwal, T.; Anselmetti, F.S.; Blum, F.; Hungerbühler, K.; Kohler, M.; Schmid, P.; Scheringer, M.; Sobek, A. Contrasting temporal trends and relationships of total organic carbon, black carbon, and polycyclic aromatic hydrocarbons in rural low-altitude and remote high-altitude lakes. J. Environ. Monit. 2011, 13, 1316–1326. [Google Scholar] [CrossRef]
  73. Negi, H.S.; Kumar, A.; Kanda, N.; Thakur, N.; Singh, K. Status of glaciers and climate change of East Karakoram in early twenty-first century. Sci. Total Environ. 2021, 753, 141914. [Google Scholar] [CrossRef]
  74. Mehta, M. Existing and Potential Changes in Himalayan Glaciers: In Climate Change Perspective. In Natural Hazards and Risk Mitigation: Natural Hazards in Himalaya and Risk Mitigation; Springer: Berlin/Heidelberg, Germany, 2024; pp. 149–172. [Google Scholar]
  75. Schoenbohm, L.M.; Chen, J.; Stutz, J.; Sobel, E.R.; Thiede, R.C.; Kirby, B.; Strecker, M.R. Glacial morphology in the Chinese Pamir: Connections among climate, erosion, topography, lithology and exhumation. Geomorphology 2014, 221, 1–17. [Google Scholar] [CrossRef]
  76. Guo, S.; Du, P.; Xia, J.; Tang, P.; Wang, X.; Meng, Y.; Wang, H. Spatiotemporal changes of glacier and seasonal snow fluctuations over the Namcha Barwa–Gyala Peri massif using object-based classification from Landsat time series. ISPRS J. Photogramm. Remote Sens. 2021, 177, 21–37. [Google Scholar] [CrossRef]
  77. Porporato, A.; Feng, X.; Manzoni, S.; Mau, Y.; Parolari, A.J.; Vico, G. Ecohydrological modeling in agroecosystems: Examples and challenges. Water Resour. Res. 2015, 51, 5081–5099. [Google Scholar] [CrossRef]
Figure 1. Overview map of the study area in the PP section of the CPEC.
Land 14 00880 g001
Figure 2. Flowchart of glacier and snow cover extraction.
Land 14 00880 g002
Figure 3. Temporal variation trends in glacier and snow cover areas in the PP section of the CPEC before and after its launch from 2000 to 2022. (a) Represents the temporal trend of glaciers, and (b) represents the temporal trend of snow cover.
Land 14 00880 g003
Figure 4. Spatial distribution characteristics of glaciers in the PP section of the CPEC from 2000 to 2022.
Land 14 00880 g004
Figure 5. Elevation range of glaciers in the PP section of the CPEC.
Land 14 00880 g005
Figure 6. Glacier area at different elevations in the PP section of the CPEC from 2000 to 2022.
Land 14 00880 g006
Figure 7. Correlations between climatic factors and glacier area in the PP section of the CPEC before and after the project initiation. Figures (a,b) depict the correlations before and after 2015, respectively, while Figure (c) shows the trends in these correlations (red arrows indicate strengthening correlations, and blue arrows indicate weakening correlations). GLA, TEM, PRE, EVA, WIN, and SOL represent glacier area, temperature, precipitation, evapotranspiration, wind speed, and solar radiation, respectively.
Land 14 00880 g007
Figure 8. Linear regression between various climate factors and glaciers.
Land 14 00880 g008
Figure 9. Comparison of glacier area extraction results using Landsat data and MODIS data in the PP section of the CPEC.
Land 14 00880 g009
Table 1. Band characteristics table.
ProductBand NumberSpatial ResolutionTime RangeBand Name
MODISsur_refl_b02
sur_refl_b04 sur_refl_b06
500 m2000–2022near-IR (NIR)
Green
SWIR2
Landsat 5B230 m2000Green
B4near-IR (NIR)
B5SWIR1
Landsat 8B330 m2020Green
B5near-IR (NIR)
ERA5-Land Monthly Aggregated—ECMWF Climate Reanalysistemperature_2m11,132 m2000–2022Temperature
total_precipitation_sumPrecipitation
surface_solar_radiation_downwards_sumSolar radiation
total_evaporation_sumEvapotranspiration
u_component_of_wind_10m
v_component_of_wind_10m
Wind speed
Table 2. Accuracy of glacier area estimates using Landsat and MODIS data.
YearLandsat (×103 km2)MODIS(×103 km2)Relative Error (%)
200024.4333.0635.31
202221.6629.0334.01
Disclaimer/Publisher’s Note: The statements, opinions and data contained in all publications are solely those of the individual author(s) and contributor(s) and not of MDPI and/or the editor(s). MDPI and/or the editor(s) disclaim responsibility for any injury to people or property resulting from any ideas, methods, instructions or products referred to in the content.

