Article

Where to Protect? Spatial Ecology and Conservation Prioritization of the Persian Squirrel at the Westernmost Edge of Its Distribution

by
Yiannis G. Zevgolis
1,*,
Alexandros D. Kouris
2,
Apostolos Christopoulos
3,
Marios Leros
1,
Maria Loupou
1,
Dimitra-Lida Rammou
4,
Dionisios Youlatos
4,5 and
Andreas Y. Troumbis
1
1
Biodiversity Conservation Laboratory, Department of Environment, University of the Aegean, 81132 Mytilene, Greece
2
Department of Sustainable Agriculture, University of Patras, 30131 Agrinio, Greece
3
Department of Zoology and Marine Biology, Faculty of Biology, National and Kapodistrian University of Athens, 15772 Athens, Greece
4
Laboratory of Marine and Terrestrial Animal Diversity, Department of Zoology, School of Biology, Aristotle University of Thessaloniki, 54124 Thessaloniki, Greece
5
International Center for Biodiversity and Primate Conservation, Dali University, Dali 671003, China
*
Author to whom correspondence should be addressed.
Land 2025, 14(4), 876; https://doi.org/10.3390/land14040876
Submission received: 25 March 2025 / Revised: 12 April 2025 / Accepted: 14 April 2025 / Published: 16 April 2025
(This article belongs to the Section Land, Biodiversity, and Human Wellbeing)

Abstract

:
Understanding fine-scale spatial ecology is essential for defining effective conservation priorities, particularly at the range margins of vulnerable species. Here, we investigate the spatial ecology and habitat associations of the Persian squirrel (Sciurus anomalus) on Lesvos Island, Greece, representing the species’ westernmost distribution. Using a randomized grid-based survey, we recorded 424 presence records across the island and applied a suite of spatial analyses, including Kernel Density Estimation, Getis-Ord Gi*, and Anselin Local Moran’s I, to detect hotspots, coldspots, and spatial outliers. Binomial Logistic Regression, supported by Principal Component Analysis, identified key ecological drivers of habitat use, while spatial regression models (Spatial Lag and Spatial Error Models) quantified the influence of land-use characteristics and spatial dependencies on hotspot intensity and clustering dynamics. Our results showed that hotspots were primarily associated with olive-dominated and broadleaved landscapes, while coldspots and Low–Low clusters were concentrated in fragmented or degraded habitats, often outside protected areas. Spatial outliers revealed fine-scale deviations from broader patterns, indicating local habitat disruptions and emerging conservation risks not captured by existing Natura 2000 boundaries. Spatial regression confirmed that both hotspot intensity and clustering patterns were shaped by specific land-use features and spatially structured processes. Collectively, our findings underscore the fragmented nature of suitable habitats and the absence of cohesive population cores, reinforcing the need for connectivity-focused, landscape-scale conservation.

1. Introduction

Islands are among the most ecologically significant and biologically unique systems on Earth, supporting an exceptionally high proportion of endemic species due to their geographic isolation, evolutionary distinctiveness, and specialized ecological conditions [1]. This isolation has driven adaptive radiations and niche specialization, leading to the formation of unique species assemblages that significantly contribute to global biodiversity [2]. As a result, islands have been recognized as critical conservation priorities, with nearly one-third of all identified global biodiversity hotspots mostly or entirely consisting of insular ecosystems [3].
Despite their ecological significance, insular ecosystems are exceptionally vulnerable to environmental change and anthropogenic pressures due to the inherent biological and spatial constraints of island species [4,5,6,7]. Small population sizes [8], limited dispersal capacity [9], and reduced genetic diversity [10,11,12] diminish the resilience of insular taxa, restricting their ability to adapt to habitat alterations [7,13], biological invasions [14,15], and climate-induced shifts in resource availability [16]. The cumulative effects of these pressures are intensified by anthropogenic land-use modifications [17,18,19], including agricultural expansion, urbanization, and infrastructure development [20], which accelerate habitat degradation, alter trophic dynamics, and reduce the availability of essential resources [13,21].
Among the world’s insular regions, the Mediterranean Basin, a well-known biodiversity hotspot [22], represents a dynamic system where species distributions have been shaped by a long history of climatic fluctuations, geological processes, and human influence [23]. Within this region, the Aegean Archipelago, with more than 7500 islands and islets, stands as a crucial biogeographic nexus, linking Europe, Asia, and Africa, while supporting high levels of species richness and endemism [24].
However, insularity imposes significant ecological constraints on the species inhabiting these islands, particularly vertebrates [25]. To cope with these challenges, many exhibit distinct morphological [26], behavioral [27,28], and ecological adaptations [29] that enhance survival in isolated environments. While these adaptations are beneficial under stable conditions, their restricted geographic ranges often reduce their capacity to respond to environmental and anthropogenic pressures, making them increasingly vulnerable to extinction [30,31], as their limited dispersal ability hampers recolonization efforts following population declines [24].
Given these multifaceted threats, conservation strategies on islands must prioritize species with restricted distributions [32,33,34] and fragmented populations [35], along with habitats undergoing rapid environmental transformation [2], employing spatially explicit approaches to mitigate biodiversity loss and enhance ecological resilience [31,32]. In this context, spatially explicit conservation planning plays a pivotal role in addressing the challenges posed by habitat fragmentation and species isolation in insular environments. By incorporating spatial analyses, conservation efforts can move beyond static habitat classifications to evaluate species distributions, habitat connectivity, and ecological processes shaping population persistence [36]. Conventional conservation assessments, which often rely on broad-scale habitat classifications, may fail to capture species-environment interactions at ecologically meaningful scales, particularly in fragmented insular landscapes where fine-scale spatial dependencies determine species persistence [37,38]. In contrast, the integration of spatial statistics and geospatial modeling provides a more nuanced understanding of how species are distributed across insular landscapes [38,39] and how their persistence is shaped by spatially structured environmental variables [20,40]. These techniques facilitate the identification of non-random spatial patterns [41], the assessment of ecological connectivity [42], and the delineation of priority conservation areas by analyzing species–environment interactions [43,44].
One species that epitomizes the conservation challenges of Aegean insular vertebrates, the Persian squirrel, Sciurus anomalus, stands out as a taxon of significant biogeographical and ecological importance. As the sole representative of the Sciuridae family on the Aegean islands of Gökçeada (Turkey) [45] and Lesvos (Greece) [46], it constitutes one of the few arboreal rodents inhabiting the Eastern Mediterranean region. Notably, the island of Lesvos, Greece, represents the westernmost limit of the species’ global distribution, making it the only location where this southwest Asian mammal occurs in Europe [47], while its population is estimated to range between 500 and 3000 mature individuals [48]. Given its insular isolation, this population may exhibit distinct genetic structure and localized ecological adaptations, as is commonly observed in other range-edge or insular populations due to limited gene flow, founder effects, and prolonged ecological isolation [49,50,51,52,53].
Historically, S. anomalus has experienced conservation status fluctuations, reflecting regional variability in population trends and increasing anthropogenic pressures. While the species is currently categorized as Least Concern on a global scale [54], national assessments provide a more refined evaluation of its vulnerability in specific regions. In Greece, this keystone species [55] was initially classified as Near Threatened [56] but was recently uplisted to Vulnerable in the National Red Data Book [57] due to growing conservation concerns. This regional reclassification highlights the importance of fine-scale conservation assessments, as insular populations often face heightened risks of habitat loss, demographic instability, and genetic bottlenecks, risks that may not be fully captured in broader global assessments. In fact, the insular population of S. anomalus is increasingly threatened by habitat fragmentation and loss, road network expansion (Y.G.Z. pers. obs.), wildfires (Y.G.Z. pers. obs.), and predation by feral cats [54,58]. In the eastern parts of its distribution range, additional pressures such as deforestation, habitat fragmentation, and poaching further jeopardize the long-term viability of the species [54,59,60].
Despite the conservation significance of S. anomalus in Greece, a critical knowledge gap remains regarding its spatial ecology and conservation priorities at the westernmost extent of its global distribution. As the species faces increasing anthropogenic pressures, a spatially explicit approach is essential for identifying priority conservation areas and ensuring its long-term viability within its insular range. While previous studies have documented its occurrence and broad-scale habitat suitability [61], its fine-scale spatial structure, distribution hotspots, and the ecological variables influencing its presence on the island of Lesvos remain largely unexamined.
For this, we examine the spatial ecology and conservation priorities of S. anomalus on the island of Lesvos, employing a spatially explicit approach to support habitat prioritization and evidence-based conservation planning. Specifically, we aim to (a) identify the main ecological and anthropogenic drivers determining the species’ presence across the island, (b) analyze spatial distribution patterns including hotspots, spatial clusters, and areas of spatial deviation, and (c) determine the ecological and spatial drivers influencing the formation and intensity of hotspots and clustering patterns.

2. Materials and Methods

2.1. Study Area

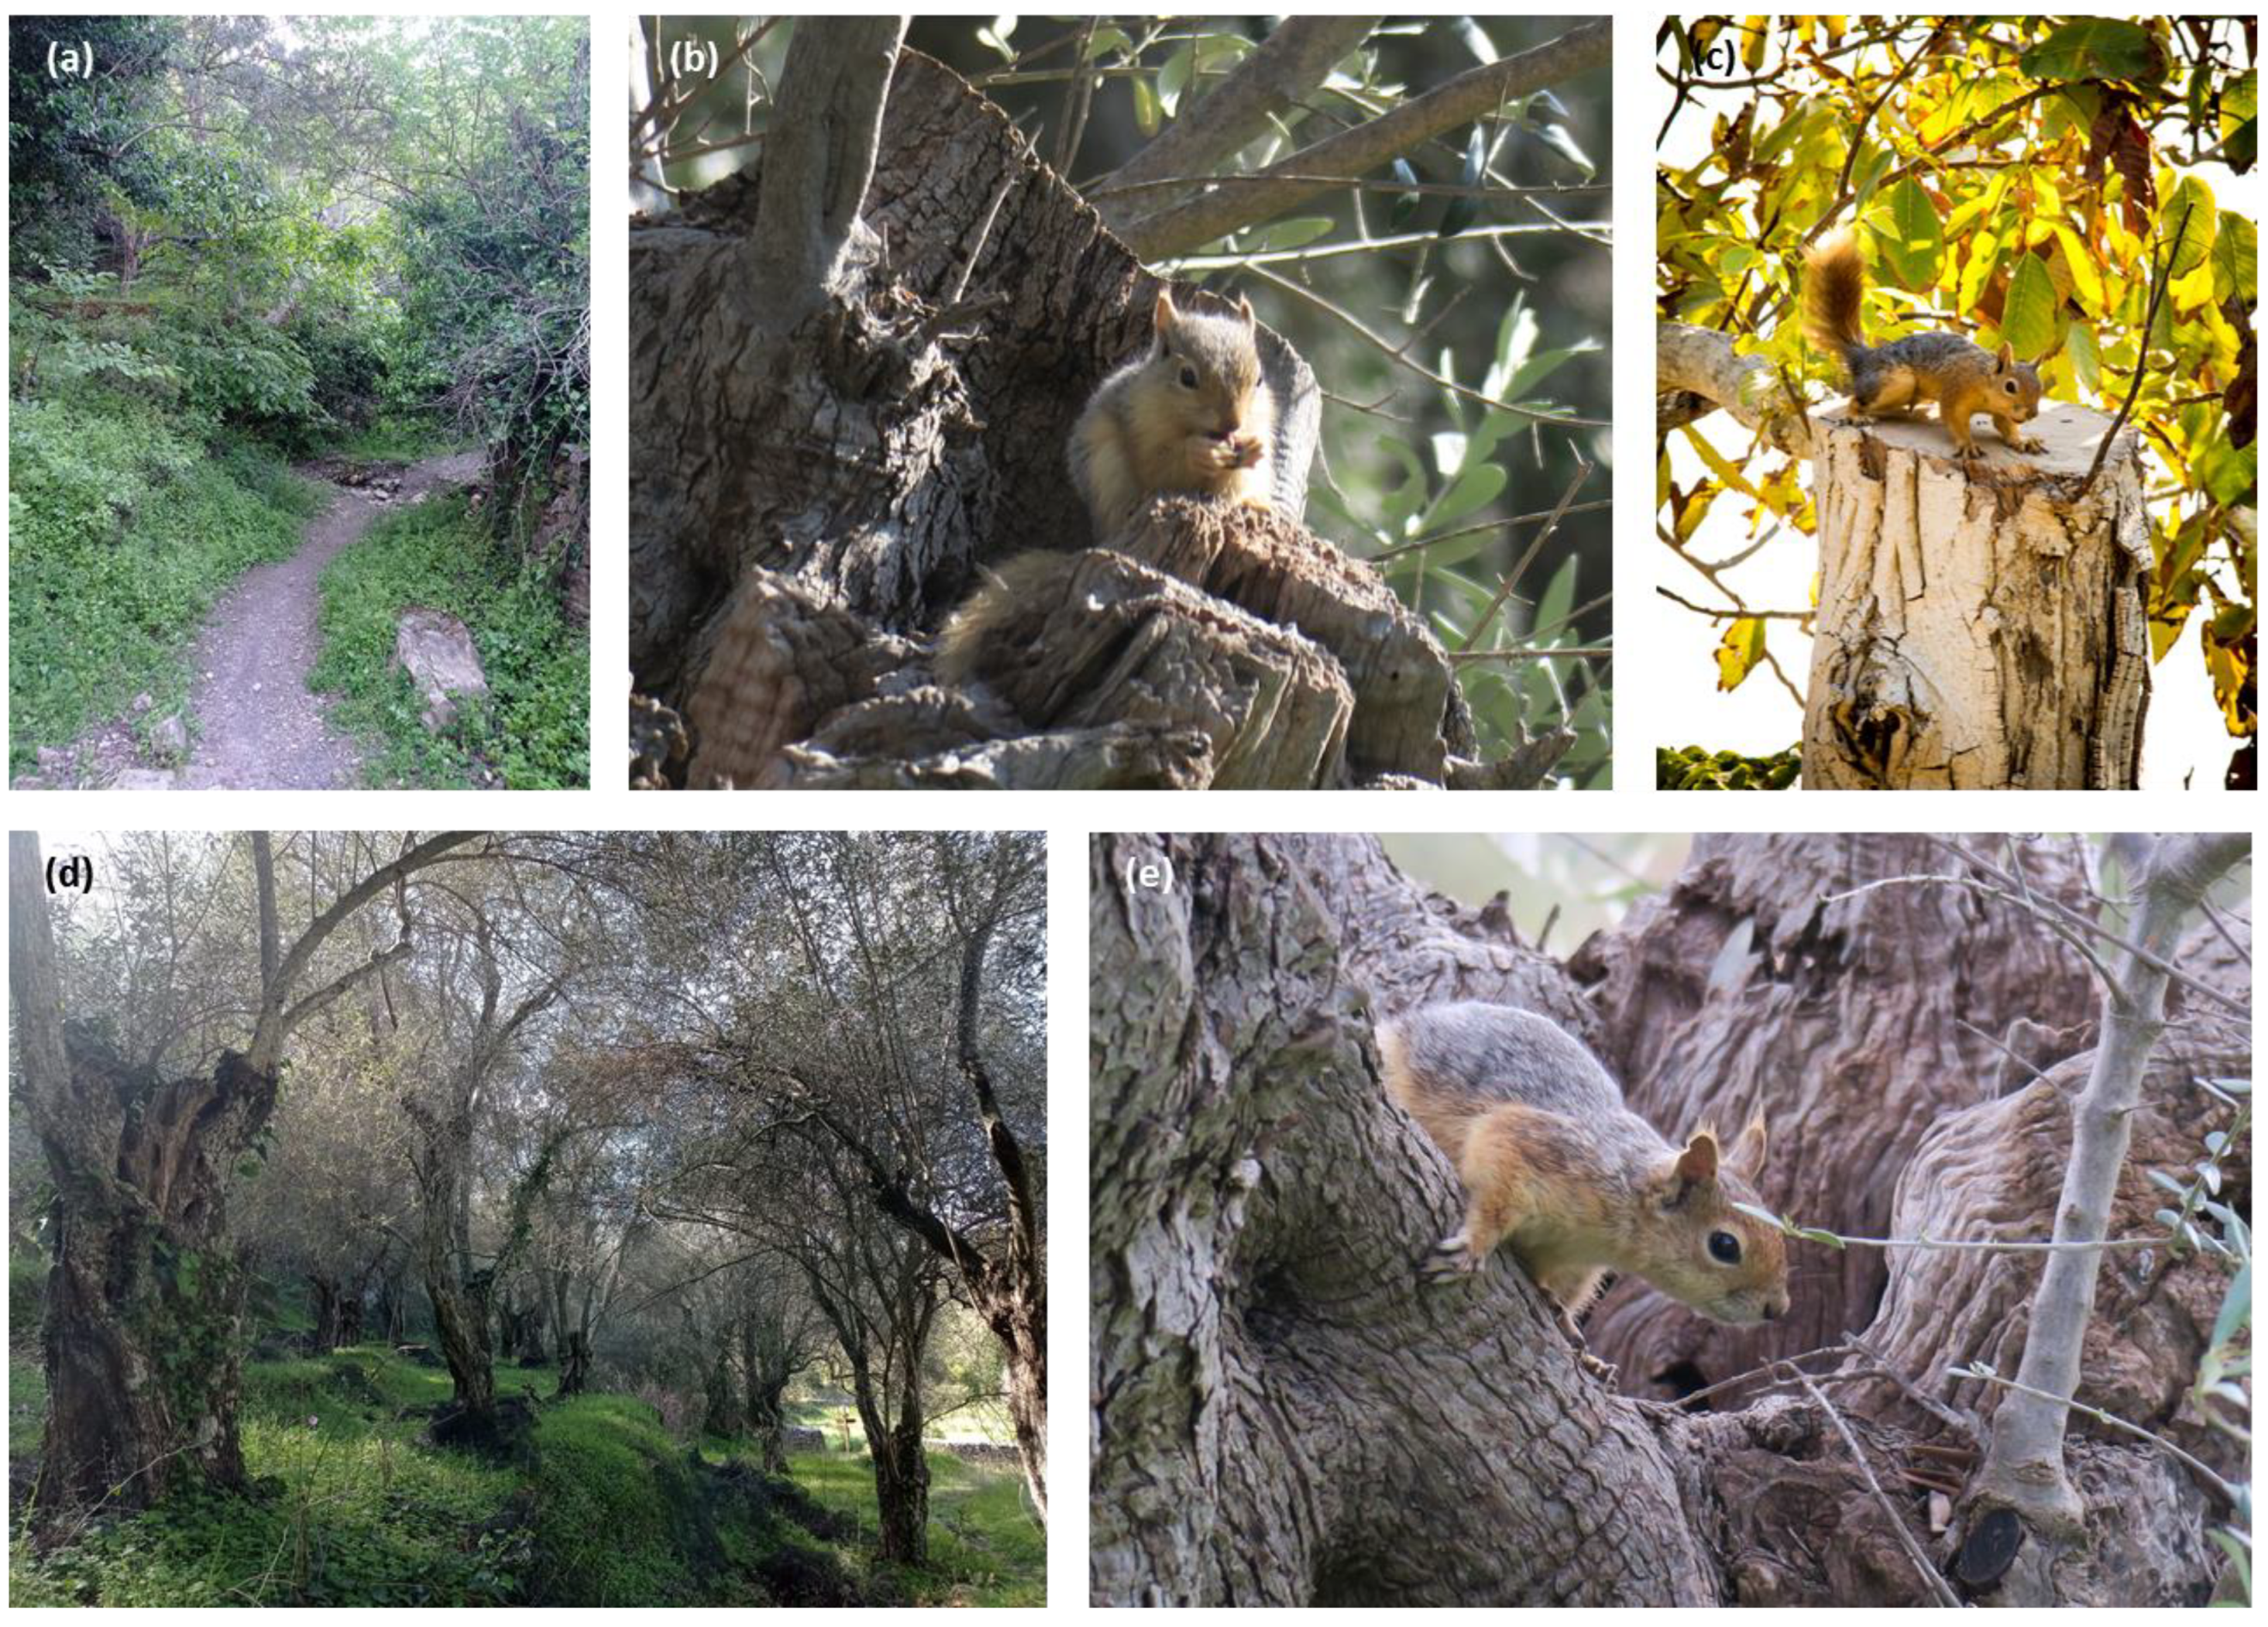
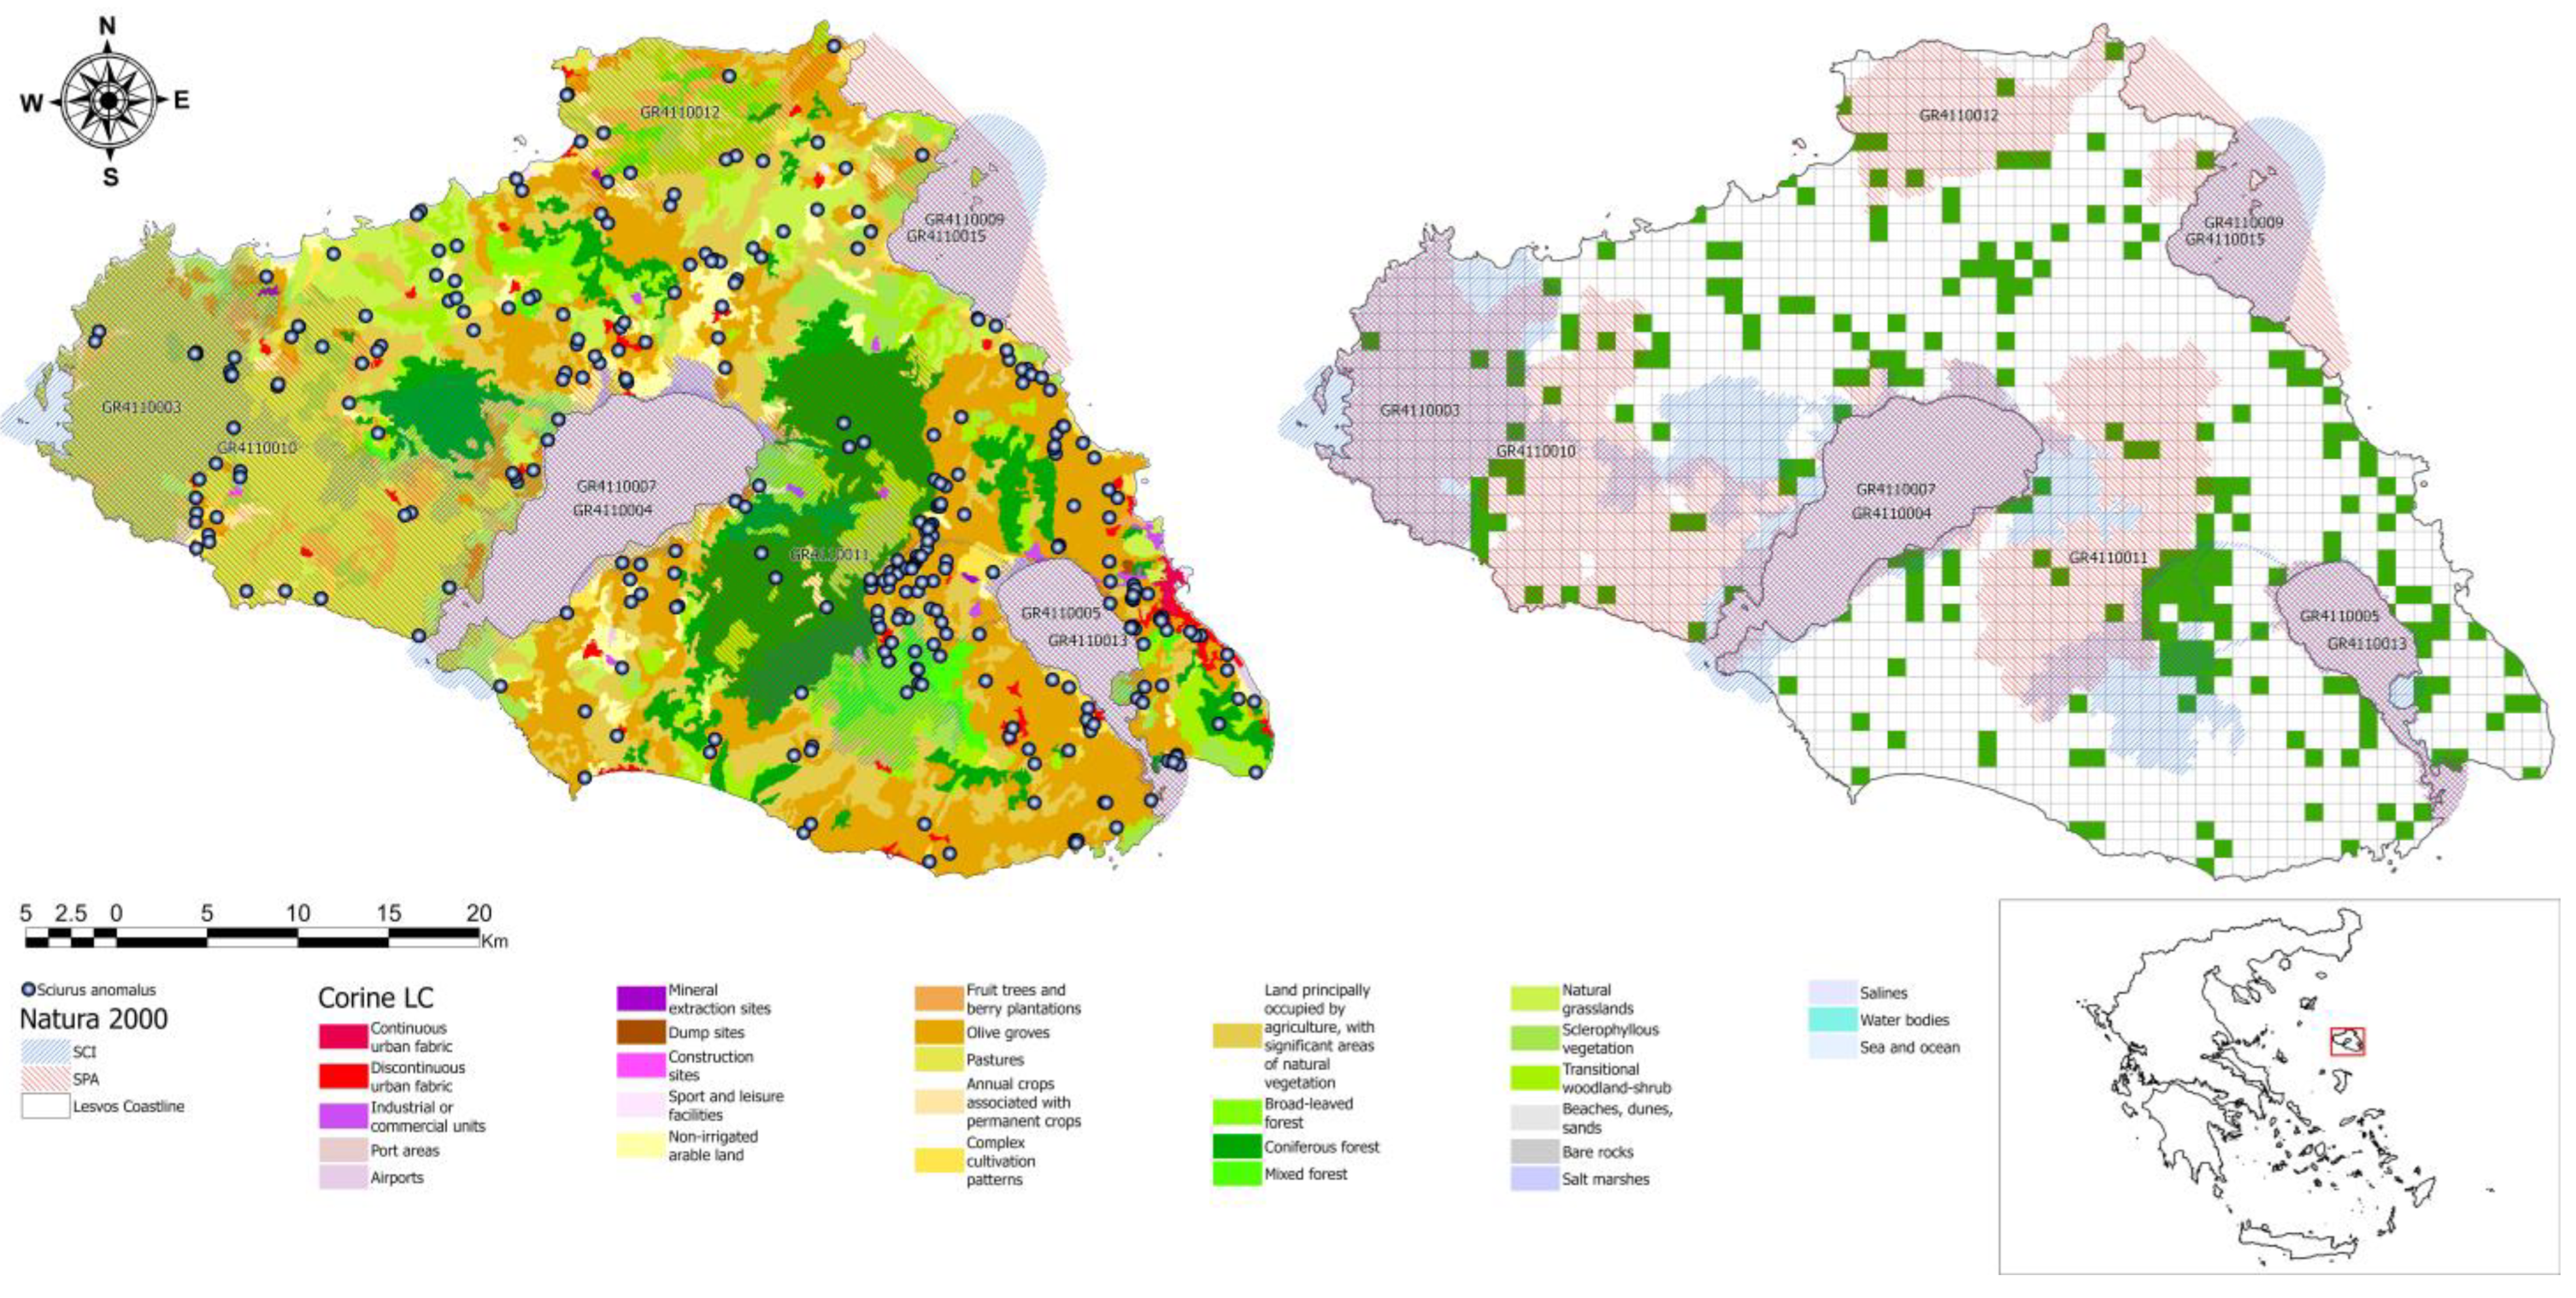
The island of Lesvos, covering an area of 1632.8 km2, is situated in the northeastern Aegean Sea and ranks as the third-largest island in Greece and the eighth-largest in the Mediterranean. Its diverse topography is characterized by a semi-mountainous landscape with two prominent peaks, Mt. Lepetymnos (968 m) in the north and Mt. Olympus (967 m) in the central part of the island. The islands’ landscape consists of extensive traditional olive groves (Olea europaea) [62], continuous and homogeneous pine forests (Pinus brutia and Pinus nigra) [63], scattered oak woodlands (Quercus coccifera and Quercus ithaburensis), Mediterranean scrublands (maquis), and numerous wetland ecosystems [64], forming a heterogeneous mosaic of habitats that support high biodiversity (Figure 1).
This landscape diversity, shaped by Lesvos’ isolation, large size, complex geological history, and geographical position, establishes the island as one of the most ecologically significant wildlife zones in Europe, harboring higher biodiversity than most other Mediterranean islands of comparable or even larger size [20]. The biogeographic position of Lesvos, in close proximity to the Anatolian mainland, places it at the interface of the Mediterranean and Anatolian bioregions, leading to species assemblages where Anatolian and Mediterranean taxa coexist, enhancing its unique biodiversity. This transitional zone fosters high species richness, including several endemic and range-restricted species, making the island a crucial site for conservation and biogeographical research.
Due to its ecological significance, Lesvos is part of the Natura 2000 network, which includes four Special Areas of Conservation (SACs) (GR4110003, GR4110004, GR4110005, GR4110015) and seven Special Protection Areas (SPAs) (GR4110007, GR4110009, GR4110010, GR4110011, GR4110012, GR4110013, GR4110016), designated under the Habitats Directive (92/43/EEC) and Birds Directive (2009/147/EC), respectively (Figure 1).
The island experiences a typical Mediterranean climate, characterized by cool and moist winters and warm, dry summers [65].

2.2. Field Surveys

To assess the spatial distribution of S. anomalus, and given the challenges associated with studying insular wildlife populations, we adopted a randomized grid-based survey design by dividing the entire island into 1863 grid cells of 1 × 1 km using ArcGIS Pro 3.4 (ESRI Inc., Redlands, CA, USA), providing a spatially explicit basis for systematic sampling (Figure 1). Due to the irregular coastline of the island, 1432 of these grid cells measured exactly 1 km2, while the remaining 431 cells, located along the island’s periphery, had reduced areas (~0.48 km2), ensuring that both interior and marginal habitats were represented in the dataset. To eliminate selection biases, we applied randomization at multiple levels, encompassing site selection, survey scheduling, and observer movement within each cell. Each grid cell was assigned a unique numerical identifier, and a fully randomized sequence of visitation was generated using a random number generator.
We conducted a total of 288 field surveys over a four-year period (2020–2023) during spring (March–May) and autumn (September–November), as these seasons coincide with peak activity periods of S. anomalus on the island [66]. Surveys were conducted on three randomly selected sunny days (18–28 °C) per week, and each one lasted approximately seven hours per day, divided into two daily observation periods (08:00–12:00 and 16:00–19:00) to coincide with peak activity time windows of the species [67].
To account for the island’s habitat and topography heterogeneity, we employed a combination of vehicle-based and on-foot surveys. Vehicle-based surveys were conducted by a team of at least two experienced researchers along accessible primary and secondary road networks at controlled speeds (10–15 km/h), with periodic stops to scan the surrounding area using binoculars (10 × 42) suitable for medium-range mammal detection. In contrast, on-foot surveys were implemented in road-inaccessible areas, following dynamically determined routes within each grid cell to avoid preferential sampling of particular habitat features such as forest edges, open trails, or accessible clearings that could bias detectability.
Given the cryptic and arboreal nature of S. anomalus, observer interference was minimized through standardized protocols that reduced human-induced disturbance and ensured detection reliability. We maintained a consistent movement speed, avoided loud noises, and used unobtrusive observation techniques such as passive scanning and stationary observation points (i.e., passive scanning from a distance and the use of stationary observation points located in shaded or concealed areas) to mitigate the effects of human presence on the species’ behavior. To further enhance data reliability, we recorded only direct sightings of S. anomalus (Figure 2), excluding indirect evidence such as tracks, dens, feeding remains, or vocalizations, thereby minimizing false positives and ensuring that each recorded presence was confirmed with the highest degree of certainty. Each confirmed sighting was georeferenced using handheld GPS devices, and metadata were systematically recorded, including time of observation, habitat type, and weather conditions.
All fieldwork adhered to ethical research standards. Specifically, our study followed the guidelines of the IUCN Position Statement on Research Involving Species at Risk of Extinction [68]. No animals were captured, handled, or otherwise disturbed, and all observations were conducted using non-invasive, observational techniques.

2.3. Ecological and Anthropogenic Drivers

To characterize the habitat features influencing the presence of S. anomalus on the island, we generated 50 m circular plots around each recorded presence point using ArcGIS Pro 3.4 (ESRI Inc., Redlands, CA, USA). This spatial scale was selected as an ecologically meaningful approximation of the species’ home range, aligning with movement patterns and foraging behavior documented for S. anomalus [55,58,61] and congeneric species such as S. vulgaris and S. carolinensis [69,70]. These circular plots served as standardized spatial units for extracting ecological and anthropogenic variables, allowing for a fine-scale assessment of habitat composition, structural complexity, and human influences within the immediate vicinity of confirmed species records.
The ecological variables extracted from the 50 m circular plots encompassed topographic features, vegetation composition, and habitat productivity, all of which are recognized as key determinants of habitat selection in arboreal rodents. Elevation and slope, derived from a 30 × 30 m Digital Elevation Model (DEM) provided by the Biodiversity Conservation Laboratory, University of the Aegean, were included as key topographic factors, with minimum, maximum, and mean values calculated for both variables to capture terrain heterogeneity.
Vegetation structure was assessed using land cover classifications derived from the CORINE Land Cover dataset [71], quantifying the proportion of broadleaf forests, coniferous forests, sweet chestnut plantations (Castanea spp.), and olive groves within each buffer. To account for additional habitat components, non-forest vegetation types such as grasslands and small woody features were incorporated using the Copernicus High-Resolution Layers [72] at a spatial resolution of 5 × 5 m. These classifications enabled a comprehensive evaluation of alternative habitat structures that may influence species occurrence. Furthermore, we incorporated vegetation productivity as a proxy for resource availability, extracting minimum, maximum, and mean productivity values based on a multi-year (2020–2023) average from the Copernicus Vegetation Productivity Dataset [73]. To assess forest canopy characteristics, we utilized the tree cover density (TCD) subset of the Copernicus High-Resolution Layers at a 10 m spatial resolution [74], which provided data on arboreal vegetation type (deciduous, evergreen, and coniferous) and canopy density.
Beyond ecological variables, we also examined anthropogenic factors that may influence the spatial distribution of S. anomalus, particularly those related to human disturbance, infrastructure development, and agricultural activities. The proximity of each presence location to major anthropogenic features, including roads, livestock facilities, settlements, and water sources, was calculated to assess the species’ spatial response to human-modified landscapes. Water sources were defined as any water body type that could serve as a drinking resource for the species, including dams, lakes, waterholes, and estuaries. Given the dry Mediterranean conditions of the study area, the availability of such water resources is expected to be an important factor influencing habitat selection. Regarding livestock facilities, we recorded all existing structures and focused our searches in areas where livestock farming is present, as these locations not only provide additional water sources through an extensive network of reservoirs and man-made waterholes, locally known as “giolia” [64], but also serve as small-scale supplementary foraging sites for S. anomalus (Y.G.Z. pers. obs.). Additionally, many livestock farmers cultivate small vegetable patches adjacent to their facilities, primarily during the summer and autumn months (typically including seasonal crops such as tomatoes, zucchini, cucumbers, grapevines, and leafy greens like lettuce and spinach). Although these cultivated plots are typically very small in scale, often spanning only a few square meters, they may provide an additional food resource for S. anomalus, particularly in periods of low natural food availability.
To quantify the extent of agricultural land use within each plot, we integrated a suite of agricultural variables derived from the Greek Payment Authority of Common Agricultural Policy Aid Schemes [75]. These data represent the proportional cover of actively cultivated land types, including olive groves, cereal crops, vineyards, legumes, fodder crops, orchards, and tree plantations. Unlike remote-sensing-based land cover classifications, this dataset reflects declared agricultural use, providing information into the extent of human-managed agricultural fields. To provide a broader measure of agricultural intensity, we computed a composite index of total cultivated agricultural land, representing the cumulative proportion of all cultivated land types within each plot.
Finally, to account for the potential influence of protected areas on species distribution, we included variables related to Natura 2000 sites. Specifically, we calculated the proximity of each presence point to the nearest Natura 2000 site, recorded whether each circular plot overlapped with designated protected areas, and determined the percentage of each buffer zone falling within the boundaries of Natura 2000 sites. These spatial datasets were obtained from the open-access geospatial data repository for Greece (geodata.gov.gr, accessed on 20 November 2024).

2.4. Spatial Analysis

To explore the underlying spatial structures of S. anomalus on Lesvos Island, we employed a multi-tiered geospatial analysis, integrating density estimation, spatial clustering, and autocorrelation techniques. This approach allowed us to quantify spatial patterns at different scales, distinguishing between areas of high species presence and regions exhibiting significant clustering or spatial heterogeneity. To ensure methodological robustness, all spatial statistical analyses were conducted in ArcGIS Pro 3.4 (ESRI Inc., Redlands, CA, USA). Prior to analysis, we used the “Integrate” and “Collect Events” tools to merge close proximity points to account for GPS positioning errors and group occurrences with similar environmental conditions, effectively quantifying relative density.
We applied Kernel Density Estimation (KDE), a non-parametric spatial analysis technique commonly used to estimate the probability density of point occurrences across a given landscape. This method allowed us to generate a continuous surface representing the intensity of S. anomalus presences, providing information into broader spatial patterns of species distribution. KDE assigns weights to neighboring presence points, with closer points exerting a stronger influence, thereby accounting for spatial clustering and ensuring a smoothed density surface that reflects underlying ecological patterns [20,76]. However, since KDE primarily depicts density variations rather than statistically significant clustering [77], we complemented this analysis with two complementary spatial statistical techniques, the Getis-Ord Gi* and Anselin Local Moran’s I, to detect statistically significant clustering patterns, identify conservation-relevant hotspots, and assess the presence of spatial clusters and outliers in S. anomalus presence records.
To identify areas where the species’ presences were spatially aggregated at a statistically significant level, we employed the Getis-Ord Gi* statistic. This method detects spatial clusters by comparing local values with those of neighboring locations to determine whether high or low values are concentrated beyond what would be expected under a random spatial distribution. The output of this analysis includes z-scores (GiZscore) and p-values [78], which provide a measure of statistical significance and directionality of clustering. High positive z-scores indicate the presence of hotspots, where significant concentrations of S. anomalus presences are observed, while significantly negative z-scores reveal coldspots, denoting areas of low presence clustering. To ensure ecological relevance, we applied a fixed distance band of 50 m, corresponding to the species’ estimated movement range.
To further refine our spatial assessment, we conducted a cluster and outlier analysis using the Anselin Local Moran’s I statistic [79], which enables the identification of clusters and spatial anomalies in species distribution. This technique distinguishes spatial clusters of similar values, i.e., High–High (HH) clusters, indicating regions with a high density of species presence, and Low–Low (LL) clusters, representing areas with low species presence, as well as spatial outliers, such as High–Low (HL) and Low–High (LH), where a point significantly deviates from its neighboring spatial context (LMiZscores). This analysis allowed us to differentiate between regions where the species forms aggregations and areas where isolated records may indicate either rare occurrences or potential habitat fragmentation.

2.5. Statistical Analysis

To systematically analyze the factors influencing the presence of S. anomalus, we employed a multi-step statistical approach integrating logistic modeling and spatial regression techniques. Given the difficulty in confirming true absences of a mobile arboreal species, we initially generated pseudo-absence points using ArcGIS Pro 3.4 (ESRI Inc., Redlands, CA, USA) to allow for a comparative analysis against presence locations. To minimize biases associated with proximity effects, pseudo-absences were randomly distributed across the study area while maintaining a minimum distance of 1 km from recorded presences. The number of pseudo-absences was set equal to the number of presences [80], thereby creating a balanced dataset for subsequent statistical analysis. For each pseudo-absence point, we extracted the same set of environmental and anthropogenic variables as for the presence points, allowing direct comparisons under the same analytical framework. All continuous variables were standardized to z-scores prior to analysis.
To address collinearity among predictor variables and reduce dimensionality while preserving ecological interpretability, we then applied a Principal Component Analysis (PCA) using R (v. 4.4.2, R Core Team, Vienna, Austria). The suitability of the dataset for PCA was assessed through the Kaiser–Meyer–Olkin (KMO) measure of sampling adequacy and Bartlett’s test of sphericity, ensuring that the dataset contained significant intercorrelations appropriate for PCA. Variables with low communality values (<0.6) were removed to retain only the most informative predictors. Principal components with eigenvalues exceeding 1.0 were retained following Varimax rotation to enhance clarity in variable grouping.
The extracted principal components were subsequently used as independent variables in a binary logistic regression (BLR) model to identify the factors influencing the presence of S. anomalus across the study area. Model fit was assessed using Nagelkerke’s R2 [81], while the Hosmer–Lemeshow test evaluated overall goodness-of-fit [82]. The model’s discrimination ability was analyzed using a classification table, while the predictive accuracy of the model was quantified using the area under the receiver operating characteristic (ROC) curve (AUC). Additionally, we conducted a Relative Importance Analysis (RIA) to quantify the contribution of each principal component to the predictive power of the model, ranking predictors based on their standardized regression coefficients.
Finally, to examine the spatial determinants of S. anomalus’ distribution and assess the factors influencing hotspot intensity and clustering patterns obtained from the Getis-Ord Gi* and Anselin Local Moran’s I statistics, we employed spatial regression models, the Spatial Lag Model (SLM) and the Spatial Error Model (SEM), using GeoDa software (v. 1.22.0.10) [83], that explicitly account for spatial dependencies within the dataset.
The SLM accounts for spatial spillover effects, meaning that the dependent variable at a given location (e.g., hotspot intensity of S. anomalus) is influenced not only by the local ecological and anthropogenic factors but also by the values of the dependent variable in neighboring locations. This spatial interaction is accounted for through the spatial autoregressive parameter (Rho), which measures the degree to which neighboring locations affect one another [83,84,85,86]. In contrast, the SEM corrects for spatial autocorrelation in the residuals, capturing unmeasured ecological or anthropogenic factors that introduce spatial dependence, by introducing a spatial error parameter (Lambda), which adjusts for these spatially structured unobserved influences, preventing model misspecification [87,88]. A significant Lambda coefficient indicates that some degree of spatial autocorrelation remains unexplained by the independent variables, meaning that additional ecological or anthropogenic processes are structuring the species’ spatial distribution.
Given the fact that spatial autocorrelation is quite common in ecological data [84,85,86,89], we first conducted Moran’s I test to assess whether spatial dependence was present in our dependent variables: (a) hotspot intensity (GiZscore) and (b) clustering patterns (LMiZscore). The presence of significant spatial autocorrelation necessitated further investigation through Lagrange Multiplier (LM) diagnostics (LM-Lag test, LM-Error test, Robust LM-Lag, Robust LM-Error) [84,90] within an Ordinary Least Squares (OLSs) regression framework to determine whether the SLM or the SEM was more appropriate. The LM-Lag test assessed whether the dependent variables were directly influenced by neighboring values, supporting the use of an SLM when significant. Conversely, the LM-Error test detected whether spatial dependence was present in the residuals, suggesting that an SEM was more appropriate. In cases where both tests were significant, we examined their Robust LM versions to confirm the most suitable model; a significant Robust LM-Lag indicated that the SLM was preferable, whereas a significant Robust LM-Error suggested that the SEM was required to correct for spatial dependence in the residuals.
In both models, the Getis-Ord Gi z-scores (GiZscore) and Local Moran’s I z-scores (LMiZscore) were used as dependent variables, representing hotspot intensity and clustering patterns, respectively. The extracted principal components served as independent predictor variables, while the spatial autoregressive (Rho) and spatial error (Lambda) parameters accounted for spatial dependencies, ensuring robust statistical inference in explaining the spatial distribution of S. anomalus across the study area.

3. Results

3.1. Spatial Distribution of the Persian Squirrel

We documented S. anomalus in 11.9% (221 out of 1863) of the surveyed 1 × 1 km grid cells across the island of Lesvos, indicating a spatially heterogeneous distribution within the landscape. In total, we documented 424 presence records (Figure 3), with the highest concentrations recorded in the eastern and southeastern regions, where olive groves and complex cultivation patterns predominate. Specifically, the majority of records were associated with olive groves (43.2%), followed by areas characterized by complex cultivation patterns (11.6%) and agricultural land with interspersed natural vegetation (15.6%). In contrast, fewer records were documented in the northern, northwestern, and southwestern parts of the island, where sparser vegetation cover and rugged terrain dominate. In these regions, S. anomalus sporadically occurred in fragmented patches of broadleaved and coniferous forests, as well as in transitional woodland–shrub habitats.
Regarding elevation and terrain characteristics, S. anomalus was primarily recorded in low-to-mid elevation areas, with a mean elevation of 184.6 ± 16.8 m, with a relatively moderate slope inclination, as indicated by a mean slope of 11.3 ± 8.2°, ranging from flat areas to steeper terrain (0–35.7°). Proximity to anthropogenic features varied, with records documented at a mean distance of 152.4 ± 267.1 m from roads, 2187.3 ± 3461.6 m from livestock facilities, 1052.9 ± 1032.4 m from water sources, and 1485.7 ± 1235.9 m from settlements.
A substantial proportion of the records were documented within protected areas, with 134 of them (31.6%) located inside Natura 2000 sites. Of these, 88 fell within SACs, while 46 were within SPAs. The remaining 290 (68.4%) were located outside the Natura 2000 network, primarily in agricultural and semi-natural habitats.

3.2. Principal Components of Ecological and Anthropogenic Drivers

The PCA identified five significant components with eigenvalues exceeding 1.0, collectively explaining 81.46% of the total variance in the dataset (Table 1). PC1—Olive-dominated agricultural areas (eigenvalue = 2.724, variance = 22.70%) was characterized by high loadings for actively cultivated olive groves (0.920), total cultivated land (0.908), olive tree cover density (0.655), and vegetation productivity (0.624). PC2—Chestnut forests (eigenvalue = 2.091, variance explained = 17.42%) was associated with chestnut plantations (0.977) and chestnut tree cover density (0.976). PC3—Coniferous forests (eigenvalue = 1.780, variance explained = 14.84%) was defined by coniferous tree cover density (0.913) and coniferous forest extent (0.863). PC4—Proximity to water and livestock farming (eigenvalue = 1.597, variance explained = 13.31%) was primarily associated with proximity to livestock facilities (0.863) and proximity to water sources (0.801). PC5—Broadleaved forests (eigenvalue = 1.583, variance explained = 13.19%) was characterized by broadleaf tree cover density (0.871) and broadleaved forest extent (0.777).

3.3. Factors Influencing the Presence of the Persian Squirrel Across the Island

The BLR model evaluating the factors influencing S. anomalus’ presence across the island of Lesvos was statistically significant [χ2 (4, N = 848) = 705.82, p < 0.001; Table 2], confirming that four out of the five selected predictor variables effectively contributed to explaining the species presence. The model exhibited strong predictive capacity, indicating that 79.9% of the variance in S. anomalus’ presence (Nagelkerke R2 = 0.799) was explained by the model.
Model validation through the ROC curve analysis yielded an AUC value of 0.952 ± 0.052 (95% CI: 0.921–0.954, p = 0.014), indicating excellent discriminatory power in differentiating between presence and absence locations. The classification table further supported the model’s robustness, highlighting a high degree of distinction showing an overall predictive accuracy of 90.5%, correctly classifying 89.6% of absences and 91.3% of presences. Additionally, the Hosmer–Lemeshow test (p > 0.05) indicated that the model’s goodness of fit was acceptable, as the lack of statistical significance in the Chi-square test suggested no substantial deviation between observed and predicted values.
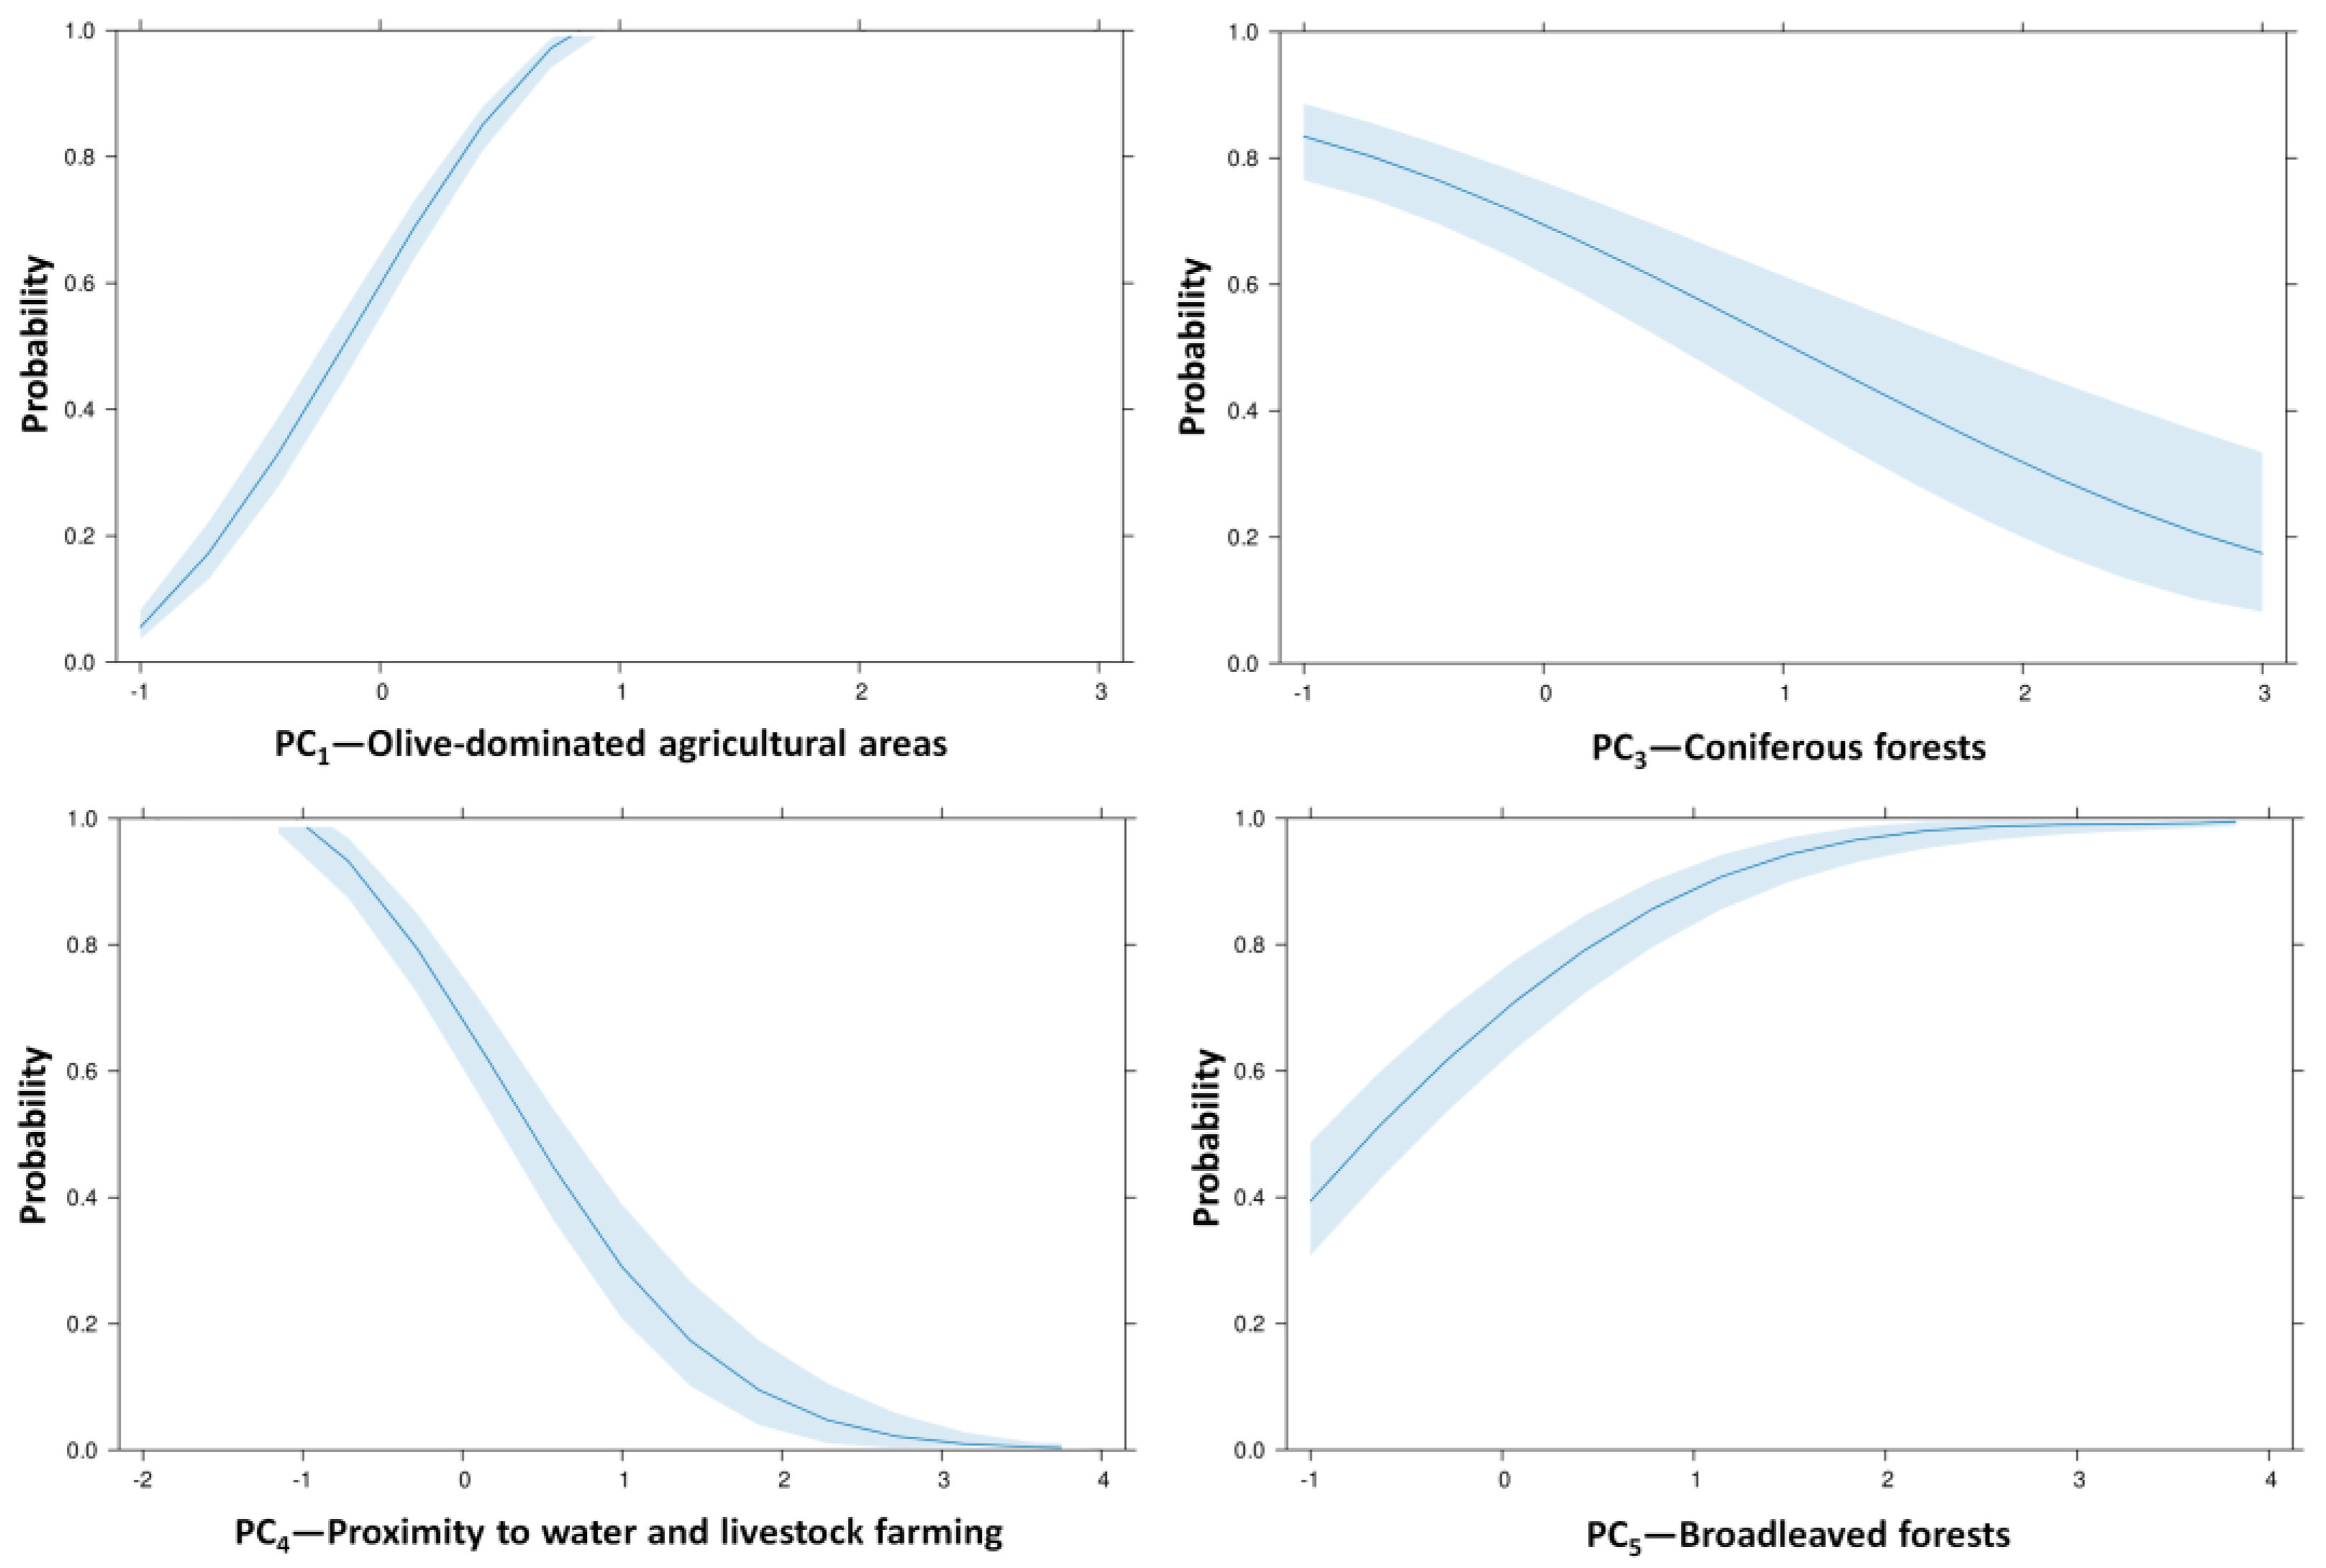
Among the predictor variables, PC1—Olive-dominated agricultural areas had the strongest positive association with S. anomalus [B = 3.660, p < 0.001, Exp(B) = 38.880], reinforcing the species’ preference for landscapes dominated by olive groves and extensive cultivated land. This was further supported by the Relative Importance Analysis (RIA), where PC1 emerged as the most influential predictor, contributing 72.19% to the overall model (z = 5.99, p < 0.001). PC5—Broadleaved forests [B = 1.255, p < 0.001, Exp(B) = 3.509], with a relative importance of 8.49% (z = 4.90, p < 0.001), was also positively associated with species presence, highlighting the importance of broadleaved forest habitats.
Conversely, PC3—Coniferous forests [B = −0.793, p < 0.001, Exp(B) = 0.453] and PC4—Proximity to water and livestock farming [B = −1.720, p < 0.001, Exp(B) = 0.179] exhibited a significant negative association with S. anomalus’ presence, indicating that coniferous-dominated landscapes, as well as areas near water sources and livestock facilities, were less favorable for the species. These findings were further corroborated by the RIA, which indicated that PC3 contributed −3.39% (z = −2.90, p = 0.004) and PC4 −15.94% (z = −4.65, p < 0.001) to the overall model, highlighting the negative influence of these factors on the species’ spatial distribution.
To further elucidate the influence of the PCs on S. anomalus’ presence, effect plots were generated to illustrate the predicted probability of occurrence across varying predictor values. These visual representations (Figure 4) provide an intuitive interpretation of the modeled relationships, demonstrating how changes in significant variables impact species distribution.

3.4. High-Density Areas, Hotspots, and Spatial Clusters of Sciurus Anomalus

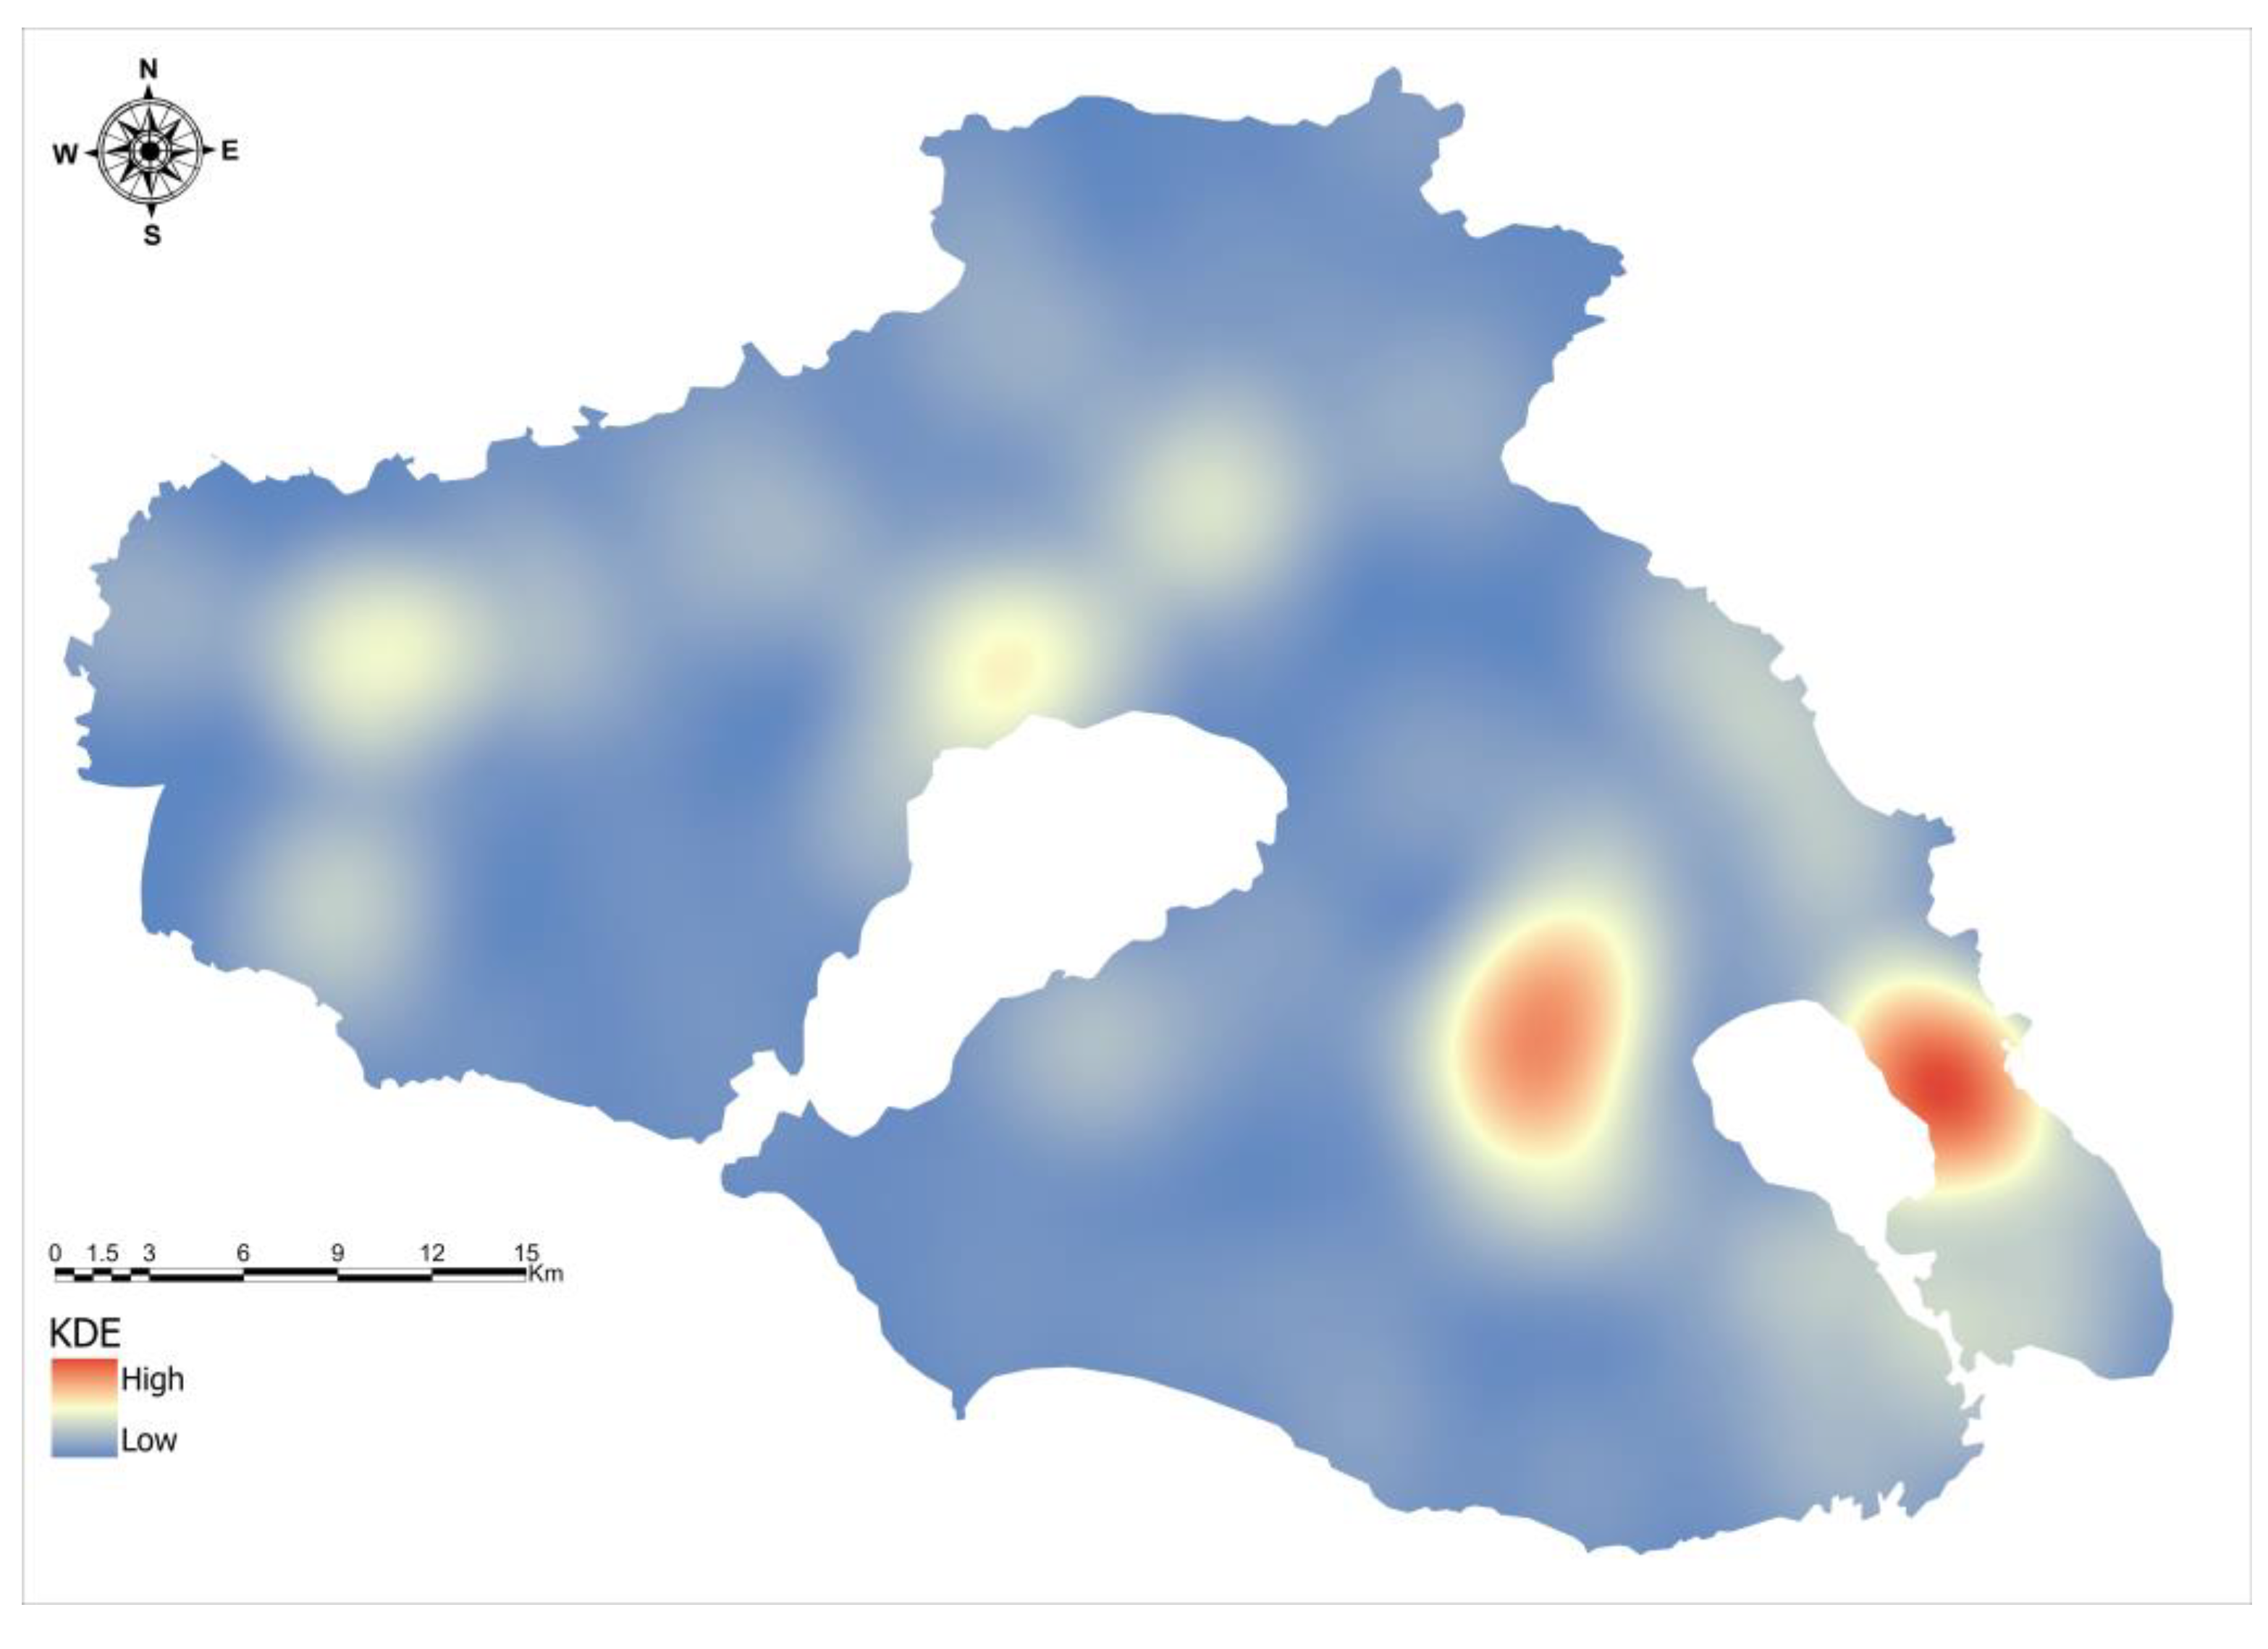
The KDE analysis identified multiple high-density areas, with the most pronounced aggregations occurring in the southeastern and eastern regions of the island (Figure 5). These areas primarily correspond to landscapes dominated by olive groves and mixed agricultural land. Lower-density regions, characterized by sparse or isolated occurrences, were predominantly found in the northern and southwestern parts of the island, where more fragmented forest patches and steeper terrain prevail.
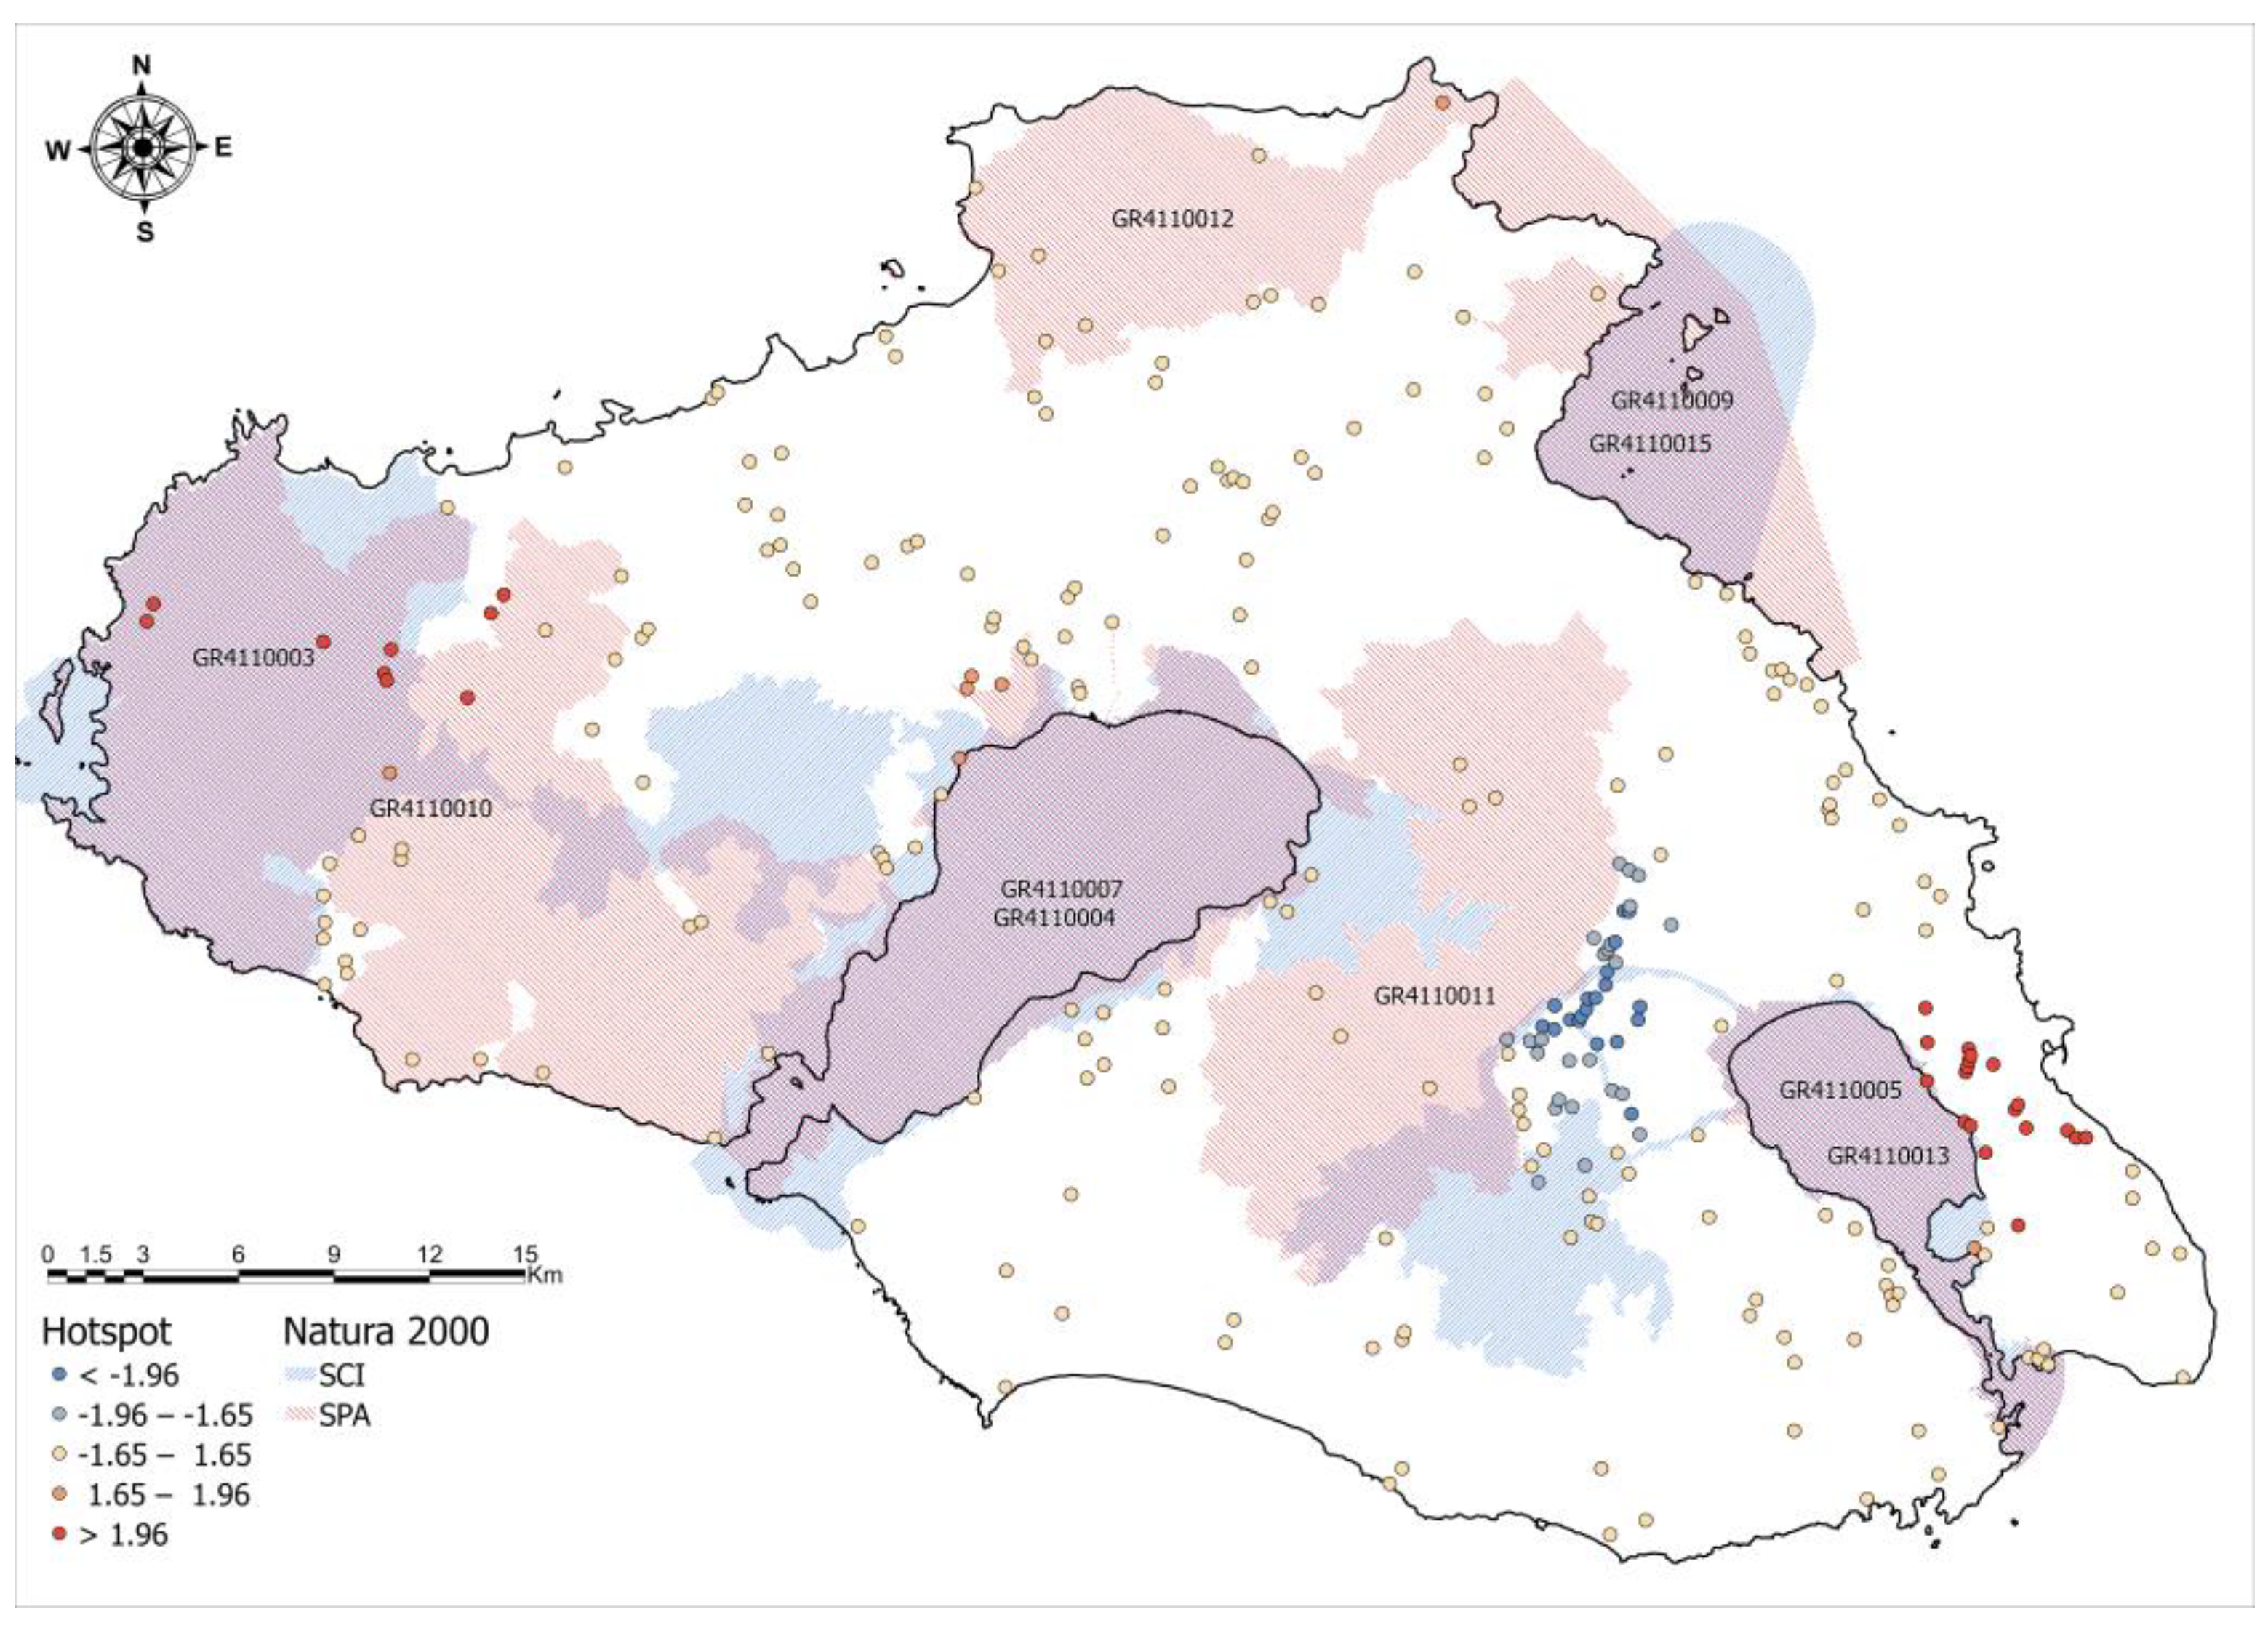
The Getis-Ord Gi* analysis delineated the spatial clustering patterns of S. anomalus across the island into five categories: hotspots (z-score > 1.96), intermediate hotspots (1.65 < z-score ≤ 1.96), neutral areas (−1.65 ≤ z-score ≤ 1.65), intermediate coldspots (−1.96 ≤ z-score < −1.65), and coldspots (z-score < −1.96) (Figure 6). These classifications distinguish areas with higher or lower species presence than expected under a random distribution.
Hotspots (95% confidence level) were identified at 28 locations (mean z-score = 3.03, SD = 0.53) and encompassed a total of 78 records. These clusters were primarily concentrated in the eastern and western parts of the island, with nineteen occurring in the eastern region, four of which overlapped with Natura 2000 sites, and nine in the western region, all of which were within protected areas. Intermediate hotspots (90% confidence level) were recorded at seven locations, containing 15 records with a mean z-score of 1.77 (SD = 0.05). These clusters were distributed across different parts of the island, with one occurring in the north, one in the west, and four in the central region, with six of the seven located within Natura 2000 sites.
Neutral areas, where species presences did not significantly deviate from a random spatial pattern, accounted for the largest portion of the island, comprising 197 locations and encompassing 281 records (mean z-score = −0.19, SD = 0.70).
In contrast, intermediate coldspots (90% confidence level), which exhibited lower-than-expected species presence, were identified at 24 locations, all situated in the central–eastern part of the island, with a mean z-score of −1.82 (SD = 0.10) and containing 29 records. Additionally, 19 coldspots (95% confidence level) were detected in the same region, encompassing 21 records and exhibiting a mean z-score of −2.14 (SD = 0.11).
To further refine the spatial structure of S. anomalus’ presence, Anselin Local Moran’s I analysis was employed to identify localized clusters and spatial outliers, classifying the dataset into Low–Low (LL) clusters, High–Low (HL) and Low–High (LH) outliers, and non-significant clusters across the study area (Figure 7).
Low–Low (LL) clusters, indicative of spatial aggregation where low presence values are surrounded by similarly low values, were the most prominent pattern detected. A total of 30 LL clusters were identified, encompassing 30 records, with 8 clusters situated within Natura 2000 sites. The z-scores for these clusters ranged from 1.05 to 2.13 (mean = 1.59, SD = 0.27), reflecting a statistically significant spatial concentration of low-density records predominantly in the central–eastern parts of the island.
High–Low (HL) outliers, representing locations where high presence values were surrounded by areas of low presence, were less prevalent. A total of eight HL outliers were identified, incorporating 23 records, with half of these situated within Natura 2000 sites. The z-scores for HL outliers ranged from −1.90 to −0.42 (mean = −0.88, SD = 0.57), suggesting spatially isolated high-density records within otherwise low-density regions.
Low–High (LH) outliers, signifying low presence values occurring within high-density regions, were the least frequently observed pattern. A total of six LH outliers were recorded, accounting for six presence points, with three of these falling within Natura 2000 sites in the eastern part of the island. The z-scores for LH outliers ranged from −6.97 to −3.44 (mean = −4.99, SD = 1.33), indicating isolated low-density occurrences embedded within areas of high S. anomalus presence.
Non-significant clusters represented the majority of the dataset, with 230 clusters encompassing 365 presence records. These locations did not exhibit statistically significant clustering or outlier characteristics, suggesting that S. anomalus’ presence in these areas is spatially heterogeneous, without forming distinct localized aggregations or deviations.

3.5. Spatial Regression Analysis of Hotspot Intensity and Clustering Patterns

The Moran’s I test confirmed significant spatial autocorrelation in both hotspot intensity (GiZscore) and clustering patterns (LMiZscore), necessitating spatial regression modeling.
For hotspot intensity (GiZscore), Moran’s I test revealed strong spatial autocorrelation (I = 0.6295, p < 0.0001), and both LM-Lag and LM-Error tests were highly significant (p < 0.0001). However, the Robust LM-Lag test (p < 0.0001) exhibited a higher degree of statistical significance than the Robust LM-Error test (p = 0.00039), indicating that the SLM was the best-fit model. This model was applied to evaluate how the extracted principal components influenced the intensity of S. anomalus hotspots while simultaneously accounting for spatial spillover effects.
The SLM identified significant spatial dependence in S. anomalus hotspot intensity (Table 3), as indicated by the spatial autoregressive parameter (Rho = 0.411, p < 0.001). The model explained 80.8% of the total variance (R2 = 0.808) and demonstrated strong performance based on model selection criteria, including the Akaike Information Criterion (AIC = 1143.82) and Schwarz Criterion (SC = 1168.11). The Likelihood Ratio Test (p < 0.001) further confirmed the significance of spatial dependence. Of the explained variance, 41.1% was attributed to spatial dependence, as captured by the spatial autoregressive parameter, while 39.7% was explained by ecological and anthropogenic drivers (PC1–PC3, PC5).
The estimated coefficients indicated that PC1—Olive-dominated agricultural areas was the most influential predictor of hotspot intensity (B = 2.567, p < 0.001), followed by PC5—Broadleaved forests (B = 0.463, p < 0.001), and PC2—Chestnut forests (B = 0.306, p < 0.001). Conversely, PC3—Coniferous forests exhibited a negative effect (B = −0.602, p < 0.001).
For clustering patterns (LMiZscore), Moran’s I detected weaker but still significant spatial autocorrelation (I = 0.1088, p < 0.0001). Both LM-Lag and LM-Error tests were significant (p = 0.01418 and p = 0.00031, respectively), indicating the presence of spatial dependence. However, the Robust LM-Lag test was non-significant (p = 0.54616), while the Robust LM-Error test remained significant (p = 0.00668). This suggests that spatial dependence is primarily driven by unmeasured ecological or anthropogenic factors rather than direct spatial spillover effects, making the Spatial Error Model (SEM) the preferred approach to account for residual spatial autocorrelation.
The SEM identified significant spatial autocorrelation in the residuals of S. anomalus clustering patterns, as indicated by the spatial error parameter (Lambda = 0.188, p < 0.001). The model explained 43.8% of the total variance (R2 = 0.438), with 18.8% attributed to spatial autocorrelation in the residuals and 25.0% explained by ecological and anthropogenic predictors (PC1, PC5). Model performance was supported by the Akaike Information Criterion (AIC = 1207.19) and Schwarz Criterion (SC = 1219.34), while the Likelihood Ratio Test (p < 0.001) confirmed the necessity of accounting for residual spatial autocorrelation. Among the predictor variables, PC5—Broadleaved forests (B = 0.460, p < 0.001) exhibited the highest effect on clustering patterns, followed by PC1—Olive-dominated agricultural areas (B = 0.419, p < 0.001) (Table 3).

4. Discussion

In this study, we present the first spatially explicit assessment of S. anomalus in an insular environment, utilizing a large-scale dataset and an integrative geospatial framework to examine habitat preferences, spatial clustering, and the ecological and anthropogenic drivers shaping the species’ distribution. Through a multi-year, randomized, grid-based field survey, we combined KDE, Getis-Ord Gi* analysis, Anselin Local Moran’s I clustering, and spatial regression models to identify high-priority conservation areas and quantify spatial dependencies influencing both hotspot intensity and clustering patterns. This comprehensive approach not only refines our understanding of S. anomalus’ distributional dynamics but also provides an essential foundation for evidence-based conservation planning, particularly in insular and fragmented landscapes where limited dispersal, habitat fragmentation, and demographic isolation can elevate extinction risks [91,92].
Our focus on S. anomalus is especially relevant given both its ecological role and conservation status. Classified as Vulnerable in Greece [57], its persistence is closely linked to habitat connectivity, resource availability, and human-induced landscape change. Although its distribution spans much of the Middle East, research to date has primarily emphasized anatomy, morphology, taxonomy, threats, and broad-scale habitat associations [55,58,59,60,61,93,94,95,96,97,98,99], with limited attention to its fine-scale spatial ecology. This gap is particularly significant in peripheral or island populations, where ecological pressures are often amplified and conservation needs are more urgent.
Indeed, species at the edges of their range—particularly on islands—often display distinct demographic, ecological, and behavioral traits [100], influencing population density [101,102], spatial distribution [103,104], and habitat selection [105]. On islands, such constraints are amplified by isolation, limited resources, and the evolutionary pressures of the “insular syndrome” [106,107], increasing conservation challenges [108] and susceptibility to anthropogenic disturbances [8]. This is particularly true for islands like Lesvos, where species must navigate a complex landscape shaped by environmental heterogeneity, habitat fragmentation, and increasing anthropogenic pressures. Despite the presence of multiple SACs and SPAs (Figure 1), these protected areas often fall short of covering the full habitat requirements of species like S. anomalus, which rely on a diverse mosaic of landscape elements. This gap is exacerbated by land-use change, unsustainable and intensified agriculture, and infrastructure development [20,55,62], all of which continue to reshape habitat availability and connectivity. While SACs and SPAs provide a framework for habitat and species protection [109,110,111], their fixed boundaries may not align with the spatial dynamics of species dependent on both natural and semi-natural habitats [112].
Given these challenges, accurately assessing the spatial ecology of S. anomalus in an insular context required careful interpretation of presence records, which reflect habitat occupancy rather than direct estimates of population size. Since individual identification methods (e.g., ear tags, GPS collars) were not employed, factors such as seasonal shifts in activity or home range overlaps during the reproductive period could not be directly quantified. However, our survey design mitigated these limitations, as each grid cell was visited once, thereby reducing the likelihood of recording the same individual multiple times within a single sampling event. Resampling the same individual across locations was minimized by the species’ territorial behavior, limited daily movement [47,66,113], and scent-marking with urine and feces, which reinforce spatial boundaries and reduce home range overlap [66]. Reliable detections were further ensured by its diurnal activity, peaking in the morning and late afternoon with a midday lull, a pattern observed in Israel [94], Jordan [96], and Greece [66]. Although winter activity may shift toward midday [114], surveys were conducted during peak detectability to maximize reliable observations.
The resulting dataset represents the most extensive record of S. anomalus distribution to date, surpassing previous efforts in both sample size and spatial resolution. This spatial framework offers a robust basis for understanding habitat use, particularly given the methodological strengths that enhance data reliability. Nonetheless, future integration of complementary approaches, such as capture–mark–recapture, radio telemetry, or genetic sampling [115], would further refine population estimates and allow for long-term demographic assessments.
Building on this foundation, the PCA identified key ecological and anthropogenic factors influencing S. anomalus’ habitat preferences, while the BLR model, with a high predictive accuracy of 90.5%, quantified the relative importance of these factors, explaining 79.9% of the variation in species presence. This combined approach provided a comprehensive understanding of the drivers shaping the species’ distribution across the island.
Among the predictor variables, the strongest positive association was observed with PC1—Olive-dominated agricultural areas, emphasizing the critical role of these landscapes in supporting S. anomalus populations. Lesvos’ olive groves cover approximately a quarter of its total area (415.7 km2) and 87.4% of its agricultural land, while within this extensive olive landscape, 130.06 km2 are classified as High Nature Value farmlands (HNVfs), a designation that underscores their ecological importance in sustaining biodiversity while maintaining traditional, low-intensity agricultural practices [62]. These HNV olive groves, characterized by a heterogeneous structure, provide a multifunctional landscape [116,117,118] that supports a variety of fauna species, including arthropods, birds, and cavity-nesting mammals [119,120,121], including S. anomalus [55], by offering a combination of food resources, nesting sites, and connectivity between fragmented habitats. Unlike modern intensive olive plantations, which are often monocultures with reduced canopy complexity and low habitat diversity, traditional HNV olive groves are defined by the presence of centennial trees with cavities suitable for nesting (pers. obs.), a structurally diverse understory [119], and a mixed tree age composition. The relatively low tree densities (89 to 182 trees/ha) [62,116], combined with the maintenance of semi-natural vegetation under and between the trees, create a semi-open environment that facilitates movement while providing essential resources. A key feature of these groves is the presence of fruit-bearing trees such as cherries (Prunus avium), pears (Pyrus amygdaliformis), and almonds (Prunus amygdalus), which are often planted within or around the groves, supplementing the squirrels’ diet throughout the year. Additionally, the abandonment of olive cultivation in some areas has led to the natural regeneration of kermes oak (Quercus coccifera) within the groves, further enriching the habitat by providing acorns. Along the grove edges, Mediterranean shrubs like the strawberry tree (Arbutus unedo) also flourish, offering additional seasonal food sources. The observed preference for olive groves (43.2% of all records) highlights their functional significance as a primary habitat type within the island’s agroecosystem.
However, traditional olive groves on Lesvos face increasing pressures from agricultural intensification and changing management practices, as, in many areas, deep pruning is frequently conducted for economic reasons, primarily to obtain firewood (Y.G.Z. pers. obs.). This shift has significant ecological consequences [117], as heavy pruning disrupts tree architecture [118], reducing nesting opportunities for the species and altering the availability of foraging resources [120,121,122]. Additionally, the simplification of olive grove structure may compromise the long-term viability of S. anomalus populations by increasing predation risks and reducing habitat connectivity [55]. These negative effects are particularly evident in southern Lesvos, where intensive pruning to maintain low tree height, frequent understory removal, and the use of herbicides further degrade habitat quality, potentially explaining the lower squirrel presence observed in that region despite the extensive olive coverage.
In addition to olive-dominated agricultural areas, S. anomalus’ presence exhibited a significant positive association with PC5—Broadleaved forests, a result that aligns with findings from previous studies, which have highlighted the importance of mixed and deciduous forests in supporting S. anomalus populations [47]. The presence of large, mature trees within these forests further enhances their suitability, as older trees are more likely to develop cavities that serve as nesting sites, while their interlocking branches create multiple access routes to and from nests, facilitating movement and reducing predation risk [123,124,125]. Additionally, fallen logs provide important travel runways [126,127], while decaying logs and snags increase habitat heterogeneity, offering greater availability of food resources, nesting substrates, and protective cover from predators [128,129].
The significant negative association between S. anomalus and pine-dominated landscapes (PC3) highlights the species’ limited suitability for large, homogenous coniferous forests, which cover approximately 342.9 km2 of Lesvos [130]. While Persian squirrels are known to consume pine seeds as part of their diet [59,67,94], the seasonal availability of pine seeds presents an additional limitation, as cones open in early summer, leaving an extended period when food resources within these forests become scarce [61]. This seasonal bottleneck is particularly problematic given that S. anomalus lacks the behavioral adaptations of some other squirrel species, such as the construction of dreys in tree branches [125,131], relying instead on tree cavities for nesting. The scarcity of such cavities in pine forests, where trees tend to be structurally uniform, further diminishes their suitability as core habitat. However, while S. anomalus largely avoids large, contiguous pine forests, the species does utilize individual pines or small clusters of conifers when they occur in a mixed-forest matrix or within close proximity to broadleaf trees, suggesting that conifers may provide supplemental food resources rather than serving as primary habitat (Y.G.Z. pers. obs.).
Similarly, the significant negative association between S. anomalus and PC4—Proximity to water and livestock farming, highlights the species’ avoidance of open landscapes near water and livestock facilities. While hydration is essential, the species likely fulfills its water requirements through indirect sources such as moisture-rich food items, dew accumulation on leaves and branches, especially in the early morning when condensation is high, rainwater trapped in tree cavities or leaf axils, and small ephemeral water pools, reducing the need for direct access to open water bodies (Y.G.Z. pers. obs.). Moreover, livestock infrastructures on the island sustain disproportionately high populations of feral and free-ranging cats [58] and livestock dogs (Y.G.Z. pers. obs.), which represent a major predation threat for several species [28,132,133], including S. anomalus (Y.G.Z. pers. obs.). This elevated predation risk, compounded by reduced nesting opportunities and diminished cover, likely accounts for the negative relationship detected in the model.
The spatial implications of these ecological constraints were further elucidated through KDE, which revealed distinct concentration patterns of S. anomalus across the island. Several high-density clusters predominantly corresponded to landscapes dominated by traditional olive groves and mixed agricultural areas, reinforcing the species’ strong association with HNVf (Figure 5). However, while KDE effectively visualizes spatial intensity, it does not distinguish whether these patterns arise from random aggregation or structured ecological processes, necessitating additional spatial statistical analyses [134,135].
To address this limitation, Getis-Ord Gi* and Anselin Local Moran’s I were utilized to identify statistically significant hotspots, coldspots, and spatial outliers. Hotspots, primarily concentrated in the eastern and western parts of the island, represent areas with significantly higher-than-expected presence of S. anomalus. Their alignment with traditional HNV olive groves emphasizes the role of these semi-natural systems as biodiversity refugia. Importantly, while western hotspots extensively overlap with Natura 2000-protected areas, most eastern hotspots fall outside formal conservation zones (Figure 6), highlighting a potential mismatch between ecological importance and protected area coverage. Given the critical value of centennial olive trees for nesting and foraging, conservation efforts should prioritize the protection of these key habitat patches, particularly in hotspot areas outside formal reserves.
Conversely, coldspots, regions with significantly lower-than-expected presence [78], were clustered in the central–eastern part of the island (Figure 6), within olive-dominated landscapes, which is unexpected given the species’ affinity for these habitats. This spatial contradiction reflects a complex interplay of environmental and anthropogenic constraints that undermine habitat quality despite the presence of seemingly suitable vegetation. The steep topography in these areas restricts arboreal connectivity and increases energetic costs and predation risks associated with ground movement. Moreover, the dense road infrastructure [20], including a major arterial route linking the island’s two largest urban centers and numerous paved secondary roads, fragments the landscape, increasing mortality risks and acting as physical barriers to species’ dispersal. Equally detrimental is the widespread abandonment of traditional management practices. The routine application of illegal herbicides to suppress understory vegetation has led to structurally simplified groves, stripping away critical foraging grounds and concealment opportunities. Additionally, although livestock is largely absent, the presence of small poultry farms enclosed by wire fencing attracts high densities of feral cats due to food availability (Y.G.Z. pers. obs.), thereby posing a significant predation threat to S. anomalus.
Further spatial refinement through Anselin Local Moran’s I revealed localized deviations from the broader patterns. The predominance of LL clusters in the central–eastern part of the island, coinciding with coldspots, represents statistically significant concentrations of low S. anomalus presence records surrounded by similarly low values. Rather than indicating isolated anomalies, these clusters reflect strong local negative spatial autocorrelation and point to the spatial continuity of unsuitable habitat conditions [38,136]. This pattern reinforces the interpretation that a combination of structural habitat limitations and anthropogenic pressures persists across this region, creating contiguous zones of low habitat suitability for the species.
In contrast, HL outliers represent isolated high-presence records of S. anomalus embedded within broader areas of low-density records. These outliers, half of which are located within Natura 2000 sites, particularly in the central–eastern and northern regions of the island (Figure 7), are primarily located along transitional zones between favorable and degraded habitats and notably differ from the identified hotspots. This pattern may indicate habitat fragments acting as ecological refugia, which currently support residual squirrel activity but face imminent risk of local extinction if surrounding conditions continue to deteriorate.
LH outliers, areas of low S. anomalus presence surrounded by high-presence values, represent spatial inconsistencies within otherwise favorable habitat matrices. These outliers (Figure 7) may reflect micro-scale disturbances or recent habitat degradation within an otherwise suitable landscape. Their spatial position highlights the limitations of current protection boundaries in capturing fine-scale habitat heterogeneity and emerging conservation needs. From a conservation perspective, LH outliers may serve as early indicators of habitat deterioration and thus warrant proactive field validation and intervention. The conservation of these transitional zones is crucial, as localized declines within hotspot areas may foreshadow broader-scale fragmentation or functional habitat loss if unaddressed.
Interestingly, the complete absence of HH clusters, an unexpected and ecologically significant outcome, indicated that even the hotspot areas and/or those with the highest recorded presences of S. anomalus lack the spatial cohesion characteristic of stable population cores. HH clusters typically denote robust, well-connected habitat patches capable of supporting resilient subpopulations through demographic and spatial continuity [38]. Their absence on Lesvos suggests that suitable habitats exist in a fragmented and spatially isolated configuration, embedded within a broader matrix of structurally simplified or ecologically degraded landscapes. Furthermore, it reflects a landscape in which even high-quality habitat patches are not large or connected enough to support persistent, self-sustaining populations. From a conservation standpoint, this spatial pattern is particularly concerning, as it implies that S. anomalus is persisting in scattered refugia rather than occupying a cohesive ecological network.
To mitigate this risk, conservation planning must move beyond static protection of isolated habitat patches and toward a landscape-scale approach that promotes connectivity. In this context, and based on the combined findings of the BLR and spatial clustering analyses, the spatial regression models offer critical guidance for conservation planning by explicitly quantifying how both local habitat attributes and spatial dependence shape the observed distribution of S. anomalus.
The SLM revealed that hotspot intensity is not solely the result of isolated land-use features but is also significantly influenced by surrounding habitat conditions. This spatial spillover effect, captured by the autoregressive parameter (Rho) [83,85,89], underscores the ecological connectivity of olive groves, broadleaved forests, and chestnut-dominated landscapes, habitat types that consistently emerged as strong predictors across all models. The high explanatory power of the SLM (R2 = 0.808) reinforces the conservation value of these mainly traditional agroforestry systems, suggesting that targeted management within these habitat types can enhance regional population densities. In parallel, the SEM identified residual spatial autocorrelation in clustering patterns, suggesting the influence of unmeasured variables, potentially related to microhabitat degradation, infrastructure development, or predation pressure, particularly in transitional areas such as coldspots and LH outliers. The absence of HH clusters further supports this interpretation, illustrating that even the most favorable habitats fail to coalesce into cohesive population cores. These findings underscore the need for future management plans to explicitly address the drivers of fragmentation and spatial instability within suitable habitats.
From a conservation perspective, these models collectively enable a multi-scalar spatial framework: KDE and Getis-Ord Gi* can delineate core conservation zones, Moran’s I can highlight fragmented or isolated population nodes requiring habitat connectivity, and spatial regression can prioritize the specific land-use contexts that maximize conservation return. Thus, the integration of these spatially explicit tools allows for the definition of core protected areas, buffer zones, and ecological corridors, while also highlighting mismatches between biodiversity value and existing Natura 2000 coverage. By shifting from static reserve design to a landscape-level, data-informed approach, conservation interventions for S. anomalus can be more precisely targeted, scalable, and responsive to both ecological needs and emerging threats.
Based on our findings, conservation efforts should prioritize the maintenance of structurally complex, traditionally managed olive groves and the protection of remnant broadleaved forests, particularly in regions identified as hotspots or spatial clusters. Management actions should include preserving tree cavities, minimizing intensive pruning, retaining understory vegetation, and avoiding herbicide use. Enhancing ecological connectivity between habitat patches, especially in fragmented landscapes, can also support population viability. Additionally, increased surveillance and targeted habitat improvements in coldspot areas may help mitigate localized declines.
So, where to protect? In the high-value landscapes, particularly traditional olive groves and broadleaved forests, that support spatially dispersed yet ecologically significant populations of S. anomalus.

Author Contributions

Conceptualization, Y.G.Z.; methodology, Y.G.Z.; software, Y.G.Z. and A.D.K.; validation, Y.G.Z., A.D.K., A.C., D.-L.R., D.Y., and A.Y.T.; formal analysis, Y.G.Z. and A.D.K.; investigation, Y.G.Z., A.C., M.L. (Marios Leros), and M.L. (Maria Loupou); resources, Y.G.Z., A.D.K., and A.C.; data curation, Y.G.Z., A.D.K., A.C., D.-L.R., D.Y., and A.Y.T.; writing—original draft preparation, Y.G.Z.; writing—review and editing, Y.G.Z., A.D.K., A.C., M.L. (Marios Leros), M.L. (Maria Loupou), D.-L.R., D.Y., and A.Y.T.; visualization, Y.G.Z. and A.D.K.; supervision, Y.G.Z. All authors have read and agreed to the published version of the manuscript.

Funding

This research received no external funding.

Data Availability Statement

The raw data supporting the conclusions of this article will be made available by the corresponding author on request.

Acknowledgments

We sincerely thank the anonymous reviewers for their constructive comments and valuable suggestions, which improved the quality and clarity of this manuscript. All aspects of this study were conducted in full compliance with Hellenic national law (Presidential Decree 67/81: “On the protection of native flora and wild fauna and the determination of the coordination and control procedure of related research”) on the humane use of animals.

Conflicts of Interest

The authors declare no conflicts of interest.

References

  1. Whittaker, R.J.; Fernández-Palacios, J.M.; Matthews, T.J.; Borregaard, M.K.; Triantis, K.A. Island biogeography: Taking the long view of nature’s laboratories. Science 2017, 357, eaam8326. [Google Scholar] [CrossRef] [PubMed]
  2. Russell, J.C.; Kueffer, C. Island Biodiversity in the Anthropocene. Annu. Rev. Environ. Resour. 2019, 44, 31–60. [Google Scholar] [CrossRef]
  3. Zachos, F.E.; Habel, J.C. Biodiversity Hotspots: Distribution and Protection of Conservation Priority Areas; Springer Science & Business Media: Boston, NY, USA, 2011. [Google Scholar]
  4. Jolly, C.J.; Webb, J.K.; Phillips, B.L. The perils of paradise: An endangered species conserved on an island loses antipredator behaviours within 13 generations. Biol. Lett. 2018, 14, 20180222. [Google Scholar] [CrossRef] [PubMed]
  5. Ogawa-Onishi, Y.; Berry, P.M.; Tanaka, N. Assessing the potential impacts of climate change and their conservation implications in Japan: A case study of conifers. Biol. Conserv. 2010, 143, 1728–1736. [Google Scholar] [CrossRef]
  6. Cronk, Q.C.B. Islands: Stability, diversity, conservation. Biodivers. Conserv. 1997, 6, 477–493. [Google Scholar] [CrossRef]
  7. Adler, G.H.; Levins, R. The Island Syndrome in Rodent Populations. Q. Rev. Biol. 1994, 69, 473–490. [Google Scholar] [CrossRef]
  8. Kier, G.; Kreft, H.; Tien, M.L.; Jetz, W.; Ibisch, P.L.; Nowicki, C.; Mutke, J.; Barthlott, W. A global assessment of endemism and species richness across island and mainland regions. Proc. Natl. Acad. Sci. USA 2009, 106, 9322–9327. [Google Scholar] [CrossRef]
  9. Barreto, E.; Rangel, T.F.; Pellissier, L.; Graham, C.H. Area, isolation and climate explain the diversity of mammals on islands worldwide. Proc. R. Soc. B Biol. Sci. 2021, 288, 20211879. [Google Scholar] [CrossRef]
  10. Sato, J.J.; Tasaka, Y.; Tasaka, R.; Gunji, K.; Yamamoto, Y.; Takada, Y.; Uematsu, Y.; Sakai, E.; Tateishi, T.; Yamaguchi, Y. Effects of Isolation by Continental Islands in the Seto Inland Sea, Japan, on Genetic Diversity of the Large Japanese Field Mouse, Apodemus speciosus (Rodentia: Muridae), Inferred from the Mitochondrial Dloop Region. Zoolog. Sci. 2017, 34, 112. [Google Scholar] [CrossRef]
  11. Jones Lennon, M.; Taggart, D.A.; Temple-Smith, P.D.; Eldridge, M.D.B. The impact of isolation and bottlenecks on genetic diversity in the Pearson Island population of the black-footed rock-wallaby (Petrogale lateralis pearsoni; Marsupialia: Macropodidae). Aust. Mammal. 2011, 33, 152. [Google Scholar] [CrossRef]
  12. Frankham, R. Do island populations have less genetic variation than mainland populations? Heredity 1997, 78, 311–327. [Google Scholar] [CrossRef] [PubMed]
  13. Courchamp, F.; Chapuis, J.; Pascal, M. Mammal invaders on islands: Impact, control and control impact. Biol. Rev. 2003, 78, 347–383. [Google Scholar] [CrossRef] [PubMed]
  14. Bellard, C.; Genovesi, P.; Jeschke, J.M. Global patterns in threats to vertebrates by biological invasions. Proc. R. Soc. B Biol. Sci. 2016, 283, 20152454. [Google Scholar] [CrossRef]
  15. Harper, G.A.; Bunbury, N. Invasive rats on tropical islands: Their population biology and impacts on native species. Glob. Ecol. Conserv. 2015, 3, 607–627. [Google Scholar] [CrossRef]
  16. Helmus, M.R.; Mahler, D.L.; Losos, J.B. Island biogeography of the Anthropocene. Nature 2014, 513, 543–546. [Google Scholar] [CrossRef]
  17. Marathianou, M.; Kosmas, C.; Gerontidis, S.; Detsis, V. Land-use evolution and degradation in Lesvos (Greece): A historical approach. Land Degrad. Dev. 2000, 11, 63–73. [Google Scholar] [CrossRef]
  18. Jesse, W.A.M.; Behm, J.E.; Helmus, M.R.; Ellers, J. Human land use promotes the abundance and diversity of exotic species on Caribbean islands. Glob. Chang. Biol. 2018, 24, 4784–4796. [Google Scholar] [CrossRef]
  19. Sánchez-Ortiz, K.; Taylor, K.J.M.; De Palma, A.; Essl, F.; Dawson, W.; Kreft, H.; Pergl, J.; Pyšek, P.; van Kleunen, M.; Weigelt, P.; et al. Effects of land-use change and related pressures on alien and native subsets of island communities. PLoS ONE 2020, 15, e0227169. [Google Scholar] [CrossRef]
  20. Zevgolis, Y.G.; Kouris, A.; Christopoulos, A. Spatiotemporal Patterns and Road Mortality Hotspots of Herpetofauna on a Mediterranean Island. Diversity 2023, 15, 478. [Google Scholar] [CrossRef]
  21. Dawson, W.; Moser, D.; Van Kleunen, M.; Kreft, H.; Pergl, J.; Pyšek, P.; Weigelt, P.; Winter, M.; Lenzner, B.; Blackburn, T.M.; et al. Global hotspots and correlates of alien species richness across taxonomic groups. Nat. Ecol. Evol. 2017, 1, 0186. [Google Scholar] [CrossRef]
  22. Myers, N.; Mittermeler, R.A.; Mittermeler, C.G.; Da Fonseca, G.A.B.; Kent, J. Biodiversity hotspots for conservation priorities. Nature 2000, 403, 853–858. [Google Scholar] [CrossRef] [PubMed]
  23. Vogiatzakis, I.N.; Mannion, A.M.; Sarris, D. Mediterranean island biodiversity and climate change: The last 10,000 years and the future. Biodivers. Conserv. 2016, 25, 2597–2627. [Google Scholar] [CrossRef]
  24. Sfenthourakis, S.; Triantis, K.A. The Aegean archipelago: A natural laboratory of evolution, ecology and civilisations. J. Biol. Res. 2017, 24, 4. [Google Scholar] [CrossRef]
  25. Masseti, M. Homeless mammals from the Ionian and Aegean islands. Bonner Zool. Beiträge 2010, 57, 367–373. [Google Scholar]
  26. Pafilis, P.; Foufopoulos, J.; Poulakakis, N.; Lymberakis, P.; Valakos, E.D. Tail shedding in island lizards [Lacertidae, Reptilia]: Decline of antipredator defenses in relaxed predation environments. Evolution 2009, 63, 1262–1278. [Google Scholar] [CrossRef]
  27. Runemark, A.; Brydegaard, M.; Svensson, E.I. Does relaxed predation drive phenotypic divergence among insular populations? J. Evol. Biol. 2014, 27, 1676–1690. [Google Scholar] [CrossRef]
  28. Zevgolis, Y.G.; Zotou, S.; Iliou, A.; Christopoulos, A. Subterranean to submarine: Stress-induced locomotor repertoire expansion and aquatic escape in the Anatolian mole rat (Nannospalax xanthodon) under risk of predation. J. Ethol. 2024, 43, 39–43. [Google Scholar] [CrossRef]
  29. Marshall, K.L.A.; Philpot, K.E.; Damas-Moreira, I.; Stevens, M. Intraspecific Colour Variation among Lizards in Distinct Island Environments Enhances Local Camouflage. PLoS ONE 2015, 10, e0135241. [Google Scholar] [CrossRef]
  30. Kumar, L.; Tehrany, M.S. Climate change impacts on the threatened terrestrial vertebrates of the Pacific Islands. Sci. Rep. 2017, 7, 5030. [Google Scholar] [CrossRef]
  31. Leclerc, C.; Villéger, S.; Marino, C.; Bellard, C. Global changes threaten functional and taxonomic diversity of insular species worldwide. Divers. Distrib. 2020, 26, 402–414. [Google Scholar] [CrossRef]
  32. Robertson, J.M.; Langin, K.M.; Sillett, T.S.; Morrison, S.A.; Ghalambor, C.K.; Funk, W.C. Identifying Evolutionarily Significant Units and Prioritizing Populations for Management on Islands. Monogr. West. N. Am. Nat. 2014, 7, 397–411. [Google Scholar] [CrossRef]
  33. Martín, J.L.; Cardoso, P.; Arechavaleta, M.; Borges, P.A.V.; Faria, B.F.; Abreu, C.; Aguiar, A.F.; Carvalho, J.A.; Costa, A.C.; Cunha, R.T.; et al. Using taxonomically unbiased criteria to prioritize resource allocation for oceanic island species conservation. Biodivers. Conserv. 2010, 19, 1659–1682. [Google Scholar] [CrossRef]
  34. Rodrigues, A.S.L.; Brooks, T.M.; Butchart, S.H.M.; Chanson, J.; Cox, N.; Hoffmann, M.; Stuart, S.N. Spatially Explicit Trends in the Global Conservation Status of Vertebrates. PLoS ONE 2014, 9, e113934. [Google Scholar] [CrossRef]
  35. Gibson, L.A.; Cowan, M.A.; Lyons, M.N.; Palmer, R.; Pearson, D.J.; Doughty, P. Island refuges: Conservation significance of the biodiversity patterns resulting from ‘natural’ fragmentation. Biol. Conserv. 2017, 212, 349–356. [Google Scholar] [CrossRef]
  36. Tulloch, A.I.T.; Sutcliffe, P.; Naujokaitis-Lewis, I.; Tingley, R.; Brotons, L.; Ferraz, K.M.P.M.B.; Possingham, H.; Guisan, A.; Rhodes, J.R. Conservation planners tend to ignore improved accuracy of modelled species distributions to focus on multiple threats and ecological processes. Biol. Conserv. 2016, 199, 157–171. [Google Scholar] [CrossRef]
  37. Fletcher, R.J.; McCleery, R.A.; Greene, D.U.; Tye, C.A. Integrated models that unite local and regional data reveal larger-scale environmental relationships and improve predictions of species distributions. Landsc. Ecol. 2016, 31, 1369–1382. [Google Scholar] [CrossRef]
  38. Zevgolis, Y.G.; Konsola, F.; Bouloutsi, A.-Z.; Douskou, N.-N.; Emmanouilidou, I.; Kordatou, M.-A.; Lekka, A.; Limnioti, M.-E.; Loupou, M.; Papageorgiou, D.; et al. Spatial Distribution Patterns, Environmental Drivers, and Hotspot Dynamics of the European Rabbit on a Mediterranean Island: Implications for Conservation and Management. Biology 2025, 14, 225. [Google Scholar] [CrossRef]
  39. La Marca, W.; Elith, J.; Firth, R.S.C.; Murphy, B.P.; Regan, T.J.; Woinarski, J.C.Z.; Nicholson, E. The influence of data source and species distribution modelling method on spatial conservation priorities. Divers. Distrib. 2019, 25, 1060–1073. [Google Scholar] [CrossRef]
  40. Zevgolis, Y.G.; Kouris, A.D.; Zannetos, S.P.; Selimas, I.; Kontos, T.D.; Christopoulos, A.; Dimitrakopoulos, P.G.; Akriotis, T. Invasion Patterns of the Coypu, Myocastor coypus, in Western Central Greece: New Records Reveal Expanding Range, Emerging Hotspots, and Habitat Preferences. Land 2025, 14, 365. [Google Scholar] [CrossRef]
  41. Gotelli, N.J.; Ulrich, W. Statistical challenges in null model analysis. Oikos 2012, 121, 171–180. [Google Scholar] [CrossRef]
  42. Abedin, I.; Singha, H.; Kang, H.-E.; Kim, H.-W.; Kundu, S. Forecasting Suitable Habitats of the Clouded Leopard (Neofelis nebulosa) in Asia: Insights into the Present and Future Climate Projections Within and Beyond Extant Boundaries. Biology 2024, 13, 902. [Google Scholar] [CrossRef] [PubMed]
  43. de Knegt, H.J.; van Langevelde, F.; Coughenour, M.B.; Skidmore, A.K.; de Boer, W.F.; Heitkönig, I.M.A.; Knox, N.M.; Slotow, R.; van der Waal, C.; Prins, H.H.T. Spatial autocorrelation and the scaling of species–environment relationships. Ecology 2010, 91, 2455–2465. [Google Scholar] [CrossRef] [PubMed]
  44. Fletcher, R.; Fortin, M.-J. Connectivity. In Spatial Ecology and Conservation Modeling; Springer International Publishing: Cham, Switzerland, 2018; pp. 321–367. [Google Scholar]
  45. Gavish, L.; Gurnell, J. Sciurus anomalus Güldenstaedt, 1785. In The Atlas of the European Mammals; Mitchell-Jones, A.J., Amori, G., Bogdanowicz, W., Krystufek, B., Reijnders, P.J.H., Spitzenberger, F., Stubbe, M., Thissen, J.B.M., Vohralik, V., Zima, J., Eds.; Academic Press: London, UK, 1999; pp. 176–177. [Google Scholar]
  46. Ondrias, J.C. The taxonomy and geographical distribution of the rodents of Greece. Saugetierkd. Mitteilungen 1966, 14, 1–134. [Google Scholar]
  47. Koprowski, J.L.; Gavish, L.; Doumas, S.L. Sciurus anomalus (Rodentia: Sciuridae). Mamm. Species 2016, 48, 48–58. [Google Scholar] [CrossRef]
  48. European Topic Centre on Biological Diversity Article 17 Web Tool on Biogeographical Assessment of Conservation Status of Species and Habitat Under Article 17 of the Habitats Directive. Available online: https://nature-art17.eionet.europa.eu/article17/species/summary/?period=5&group=Mammals&subject=Sciurus+anomalus&region= (accessed on 15 January 2025).
  49. Angert, A.L.; Bontrager, M.G.; Ågren, J. What Do We Really Know About Adaptation at Range Edges? Annu. Rev. Ecol. Evol. Syst. 2020, 51, 341–361. [Google Scholar] [CrossRef]
  50. Hardie, D.C.; Hutchings, J.A. Evolutionary ecology at the extremes of species’ ranges. Environ. Rev. 2010, 18, 1–20. [Google Scholar] [CrossRef]
  51. De Kort, H.; Prunier, J.G.; Ducatez, S.; Honnay, O.; Baguette, M.; Stevens, V.M.; Blanchet, S. Life history, climate and biogeography interactively affect worldwide genetic diversity of plant and animal populations. Nat. Commun. 2021, 12, 516. [Google Scholar] [CrossRef]
  52. Eckert, C.G.; Samis, K.E.; Lougheed, S.C. Genetic variation across species’ geographical ranges: The central–marginal hypothesis and beyond. Mol. Ecol. 2008, 17, 1170–1188. [Google Scholar] [CrossRef]
  53. Duncan, S.I.; Crespi, E.J.; Mattheus, N.M.; Rissler, L.J. History matters more when explaining genetic diversity within the context of the core–periphery hypothesis. Mol. Ecol. 2015, 24, 4323–4336. [Google Scholar] [CrossRef]
  54. Yigit, N.; Kryštufek, B.; Sozen, M.; Bukhnikashvili, A.; Shenbrot, G. Sciurus anomalus (errata version published in 2017). In The IUCN Red List of Threatened Species 2016; E.T20000A115154256; IUCN Global Species Programme Red List Unit: Cambridge, UK, 2016. [Google Scholar]
  55. Zevgolis, Y.G.; Sazeides, C.I.; Bintsi-Frantzi, E.; Kouris, A.D.; Christopoulos, A. Ecological implications of deep pruning: A case report on Persian squirrel nesting in a centennial olive grove on the island of Lesvos, Greece. Hist. Nat. Bulg. 2024, 46, 89–97. [Google Scholar] [CrossRef]
  56. Legakis, A.; Maragou, P. The Red Data Book of Threatened Animals of Greece; Hellenic Zoological Society: Athens, Greece, 2009. [Google Scholar]
  57. Youlatos, D.; Rammou, D.L. Sciurus anomalus. The Greek Red List of Threatened Species. Available online: https://redlist.necca.gov.gr/ (accessed on 5 December 2024).
  58. Zevgolis, Y.G.; Christopoulos, A.; Kalargalis, I.I.; Zannetos, S.P.; Botetzagias, I.; Dimitrakopoulos, P.G. An (Un)Expected Threat for a Regionally Near-Threatened Species: A Predation Case of a Persian Squirrel on an Insular Ecosystem. Animals 2022, 13, 24. [Google Scholar] [CrossRef] [PubMed]
  59. Aidek, A.; Amr, Z.S.; Abu Baker, M. Distribution and conservation of Sciurus anomalus in Syria (Rodentia: Sciuridae). Lynx New Ser. 2022, 52, 5–13. [Google Scholar] [CrossRef]
  60. Aghbolaghi, A.M.; Keyghobadi, N.; Azarakhsh, Z.; Dadizadeh, M.; Aghbolaghi, A.S.; Zamani, N. An evaluation of isolation by distance and isolation by resistance on genetic structure of the Persian squirrel (Sciurus anomalus) in the Zagros forests of Iran. Ecol. Evol. 2023, 13, e10225. [Google Scholar] [CrossRef]
  61. Zannetos, S.P.; Zevgolis, Y.G.; Christopoulos, A.; Akriotis, T. Assessing habitat suitability of the Persian Squirrel in the island of Lesvos, Greece. Hystrix Ital. J. Mammal. in review. 2022. [Google Scholar]
  62. Zevgolis, Y.G.; Kamatsos, E.; Akriotis, T.; Dimitrakopoulos, P.G.; Troumbis, A.Y. Estimating Productivity, Detecting Biotic Disturbances, and Assessing the Health State of Traditional Olive Groves, Using Nondestructive Phenotypic Techniques. Sustainability 2021, 14, 391. [Google Scholar] [CrossRef]
  63. Zevgolis, Y.G.; Sazeides, C.I.; Zannetos, S.P.; Grammenou, V.; Fyllas, N.M.; Akriotis, T.; Dimitrakopoulos, P.G.; Troumbis, A.Y. Investigating the effect of resin collection and detecting fungal infection in resin-tapped and non-tapped pine trees, using minimally invasive and non-invasive diagnostics. For. Ecol. Manag. 2022, 524, 120498. [Google Scholar] [CrossRef]
  64. Christopoulos, A.; Zevgolis, Y.G. A New Invasion of the Common Slider on a Mediterranean Island (Lesvos, Greece): A Potential Threat to Native Terrapin Populations? Diversity 2022, 14, 1018. [Google Scholar] [CrossRef]
  65. HNMS Climatic Data for Selected Stations in Greece. Available online: https://www.emy.gr/en/climatic-data?tab=statistics-tab (accessed on 15 December 2024).
  66. Hecht-markou, P. Beschreibung, geographische Verbreitung, Biotope und Ortswechsel des Sciurus anomalus Gueldenstadt, 1785 auf der Insel Lesbos (Griechenland). Ann. Musei Goulandris 1994, 9, 429–444. [Google Scholar]
  67. Abi-Said, M.R.; El Khoury, J.; Makhlouf, H.; Amr, Z.S. Ecology of the Persian Squirrel, Sciurus anomalus, in Horsh Ehden Nature Reserve, Lebanon. Vertebr. Zool. 2014, 64, 127–135. [Google Scholar] [CrossRef]
  68. IUCN SSC. Position Statement on research involving species at risk of extinction. IUCN Species Survival Commission (SSC). 1989. Available online: https://iucn.org/resources (accessed on 15 January 2025).
  69. Rima, P.C.; Cagnin, M.; Aloise, G.; Preatoni, D.; Wauters, L.A. Scale-dependent environmental variables affecting red squirrel (Sciurus vulgaris meridionalis) distribution. Ital. J. Zool. 2010, 77, 92–101. [Google Scholar] [CrossRef]
  70. Wauters, L.; Dhondt, A.A. Spacing behaviour of red squirrels, Sciurus vulgaris: Variation between habitats and the sexes. Anim. Behav. 1992, 43, 297–311. [Google Scholar] [CrossRef]
  71. Copernicus Land Monitoring Service. CORINE Land Cover Product User Manual, Version 1.0; Copernicus Publications: Göttingen, Germany, 2021; Volume 1.0. [Google Scholar]
  72. Copernicus Land Monitoring Service, Small Woody Features 2018 and Small Woody Features Changes 2015–2018. Available online: https://land.copernicus.eu/en/products/high-resolution-layer-small-woody-features (accessed on 15 January 2025).
  73. Copernicus Land Monitoring Service, High Resolution Vegetation Phenology and Productivity (HRVPP), Seasonal Trajectories, Vegetation Phenology and Productivity Parameters 2021. Available online: https://www.copernicus.eu/en/access-data/copernicus-services-catalogue/high-resolution-vegetation-phenology-and-productivity (accessed on 15 January 2025).
  74. Copernicus Land Monitoring Service. HRL Forest 2018 Product User Manual. 2021. Available online: https://land.copernicus.eu/user-corner/technical-library/forest-2018-user-manual.pdf (accessed on 15 January 2025).
  75. OPEKEPE Greek Payment Authority of Common Agricultural Policy (C.A.P.) Aid Schemes. Available online: https://www.opekepe.gr/en/ (accessed on 29 June 2014).
  76. Kouris, A.D.; Christopoulos, A.; Vlachopoulos, K.; Christopoulou, A.; Dimitrakopoulos, P.G.; Zevgolis, Y.G. Spatiotemporal Patterns of Reptile and Amphibian Road Fatalities in a Natura 2000 Area: A 12-Year Monitoring of the Lake Karla Mediterranean Wetland. Animals 2024, 14, 708. [Google Scholar] [CrossRef] [PubMed]
  77. Hu, Y.; Wang, F.; Guin, C.; Zhu, H. A spatio-temporal kernel density estimation framework for predictive crime hotspot mapping and evaluation. Appl. Geogr. 2018, 99, 89–97. [Google Scholar] [CrossRef]
  78. Getis, A.; Ord, J.K. The Analysis of Spatial Association by Use of Distance Statistics. Geogr. Anal. 1992, 24, 189–206. [Google Scholar] [CrossRef]
  79. Anselin, L. Local Indicators of Spatial Association—LISA. Geogr. Anal. 1995, 27, 93–115. [Google Scholar] [CrossRef]
  80. Barbet-Massin, M.; Jiguet, F.; Albert, C.H.; Thuiller, W. Selecting pseudo-absences for species distribution models: How, where and how many? Methods Ecol. Evol. 2012, 3, 327–338. [Google Scholar] [CrossRef]
  81. Nagelkerke, N.J.D. A Note on a General Definition of the Coefficient of Determination. Biometrika 1991, 78, 691–692. [Google Scholar] [CrossRef]
  82. Hosmer, D.W.; Lemeshow, S. Applied Logistic Regression; Wiley: New York, NY, USA, 2000; ISBN 9780471356325. [Google Scholar]
  83. Anselin, L. An Introduction to Spatial Data Science with GeoDa; Chapman and Hall/CRC: Boca Raton, FL, USA, 2024; ISBN 9781003274919. [Google Scholar]
  84. Anselin, L. Spatial Econometrics: Methods and Models; Studies in Operational Regional Science; Springer: Dordrecht, The Netherlands, 1988; Volume 4, ISBN 978-90-481-8311-1. [Google Scholar]
  85. Lichstein, J.W.; Simons, T.R.; Shriner, S.A.; Franzreb, K.E. Spatial autocorrelation and autoregressive models in ecology. Ecol. Monogr. 2002, 72, 445–463. [Google Scholar] [CrossRef]
  86. Ver Hoef, J.M.; Peterson, E.E.; Hooten, M.B.; Hanks, E.M.; Fortin, M. Spatial autoregressive models for statistical inference from ecological data. Ecol. Monogr. 2018, 88, 36–59. [Google Scholar] [CrossRef]
  87. Fotheringham, A.; Rogerson, P. The SAGE Handbook of Spatial Analysis; SAGE Publications, Ltd.: London, UK, 2009; ISBN 9781412910828. [Google Scholar]
  88. Anselin, L.; Syabri, I.; Kho, Y. GeoDa: An Introduction to Spatial Data Analysis. In Handbook of Applied Spatial Analysis; Springer: Berlin/Heidelberg, Germany, 2010; pp. 73–89. [Google Scholar]
  89. Dormann, C.F.; McPherson, J.M.; Araújo, M.B.; Bivand, R.; Bolliger, J.; Carl, G.; Davies, R.G.; Hirzel, A.; Jetz, W.; Kissling, W.D.; et al. Methods to account for spatial autocorrelation in the analysis of species distributional data: A review. Ecography 2007, 30, 609–628. [Google Scholar] [CrossRef]
  90. Engle, R.F. A general approach to lagrange multiplier model diagnostics. J. Econom. 1982, 20, 83–104. [Google Scholar] [CrossRef]
  91. Parmesan, C. Ecological and Evolutionary Responses to Recent Climate Change. Annu. Rev. Ecol. Evol. Syst. 2006, 37, 637–669. [Google Scholar] [CrossRef]
  92. Mullu, D. A review on the effect of habitat fragmentation on ecosystem. J. Nat. Sci. Res. 2016, 6, 1–15. [Google Scholar]
  93. Couch, L.; Arslan, A.; Duszynski, D.W. Redescription and New Host Record of Eimeria serbica from the Caucasian Tree Squirrel, Sciurus anomalus, from Turkey. J. Parasitol. 2005, 91, 1399–1400. [Google Scholar] [CrossRef]
  94. Gavish, L. Preliminary observations on the behavior and ecology of free-living populations of the subspecies Sciurus anomalus syriacus (golden squirrel) on mount Hermon, Israel. Isr. J. Zool. 1993, 39, 275–280. [Google Scholar] [CrossRef]
  95. Albayrak, I.; Arslan, A. Contribution to the taxonomical and biological characteristics Sciurus anomalus in Turkey (Mammalia: Rodentia). Turkish J. Zool. 2006, 30, 111–116. [Google Scholar]
  96. Amr, Z.; Eid, E.; Qarqaz, M.; Baker, M.A. The Status and Distribution of the Persian Squirrel, Sciurus anomalus (Mammalia: Rodentia: Sciuridae), in Dibbeen Nature Reserve, Jordan. Zool. Abhandlungen 2006, 55, 199–207. [Google Scholar]
  97. Khalili, F.; Sadeghi, M.; Malekian, M. Habitat suitability modelling of Persian squirrel (Sciurus anomalus) in Zagros forests, western Iran. J. Wildl. Biodivers. 2018, 2, 56–64. [Google Scholar] [CrossRef]
  98. Asadi, F.; Rostami, A.; Asadian, P.; Pourkabir, M. Serum biochemistry and hematology values and hemoglobin electrophoresis in Persian squirrels (Sciurus anomalus). Vet. Clin. Pathol. 2007, 36, 188–191. [Google Scholar] [CrossRef]
  99. Sadeghinezhad, J.; Tootian, Z.; Akbari, G.H.; Chiocchetti, R. The Topography and Gross Anatomy of the Abdominal Gastrointestinal Tract of the Persian Squirrel (Sciurus anomalus). Int. J. Morphol. 2014, 30, 524–530. [Google Scholar] [CrossRef]
  100. Juškaitis, R.; Balčiauskas, L.; Baltrūnaitė, L.; Augutė, V. Dormouse (Gliridae) populations on the northern periphery of their distributional ranges: A review. Folia Zool. 2015, 64, 302–309. [Google Scholar] [CrossRef]
  101. Lawton, J.H. Range, population abundance and conservation. Trends Ecol. Evol. 1993, 8, 409–413. [Google Scholar] [CrossRef] [PubMed]
  102. Sagarin, R.D.; Gaines, S.D.; Gaylord, B. Moving beyond assumptions to understand abundance distributions across the ranges of species. Trends Ecol. Evol. 2006, 21, 524–530. [Google Scholar] [CrossRef] [PubMed]
  103. Roy Nielsen, C.L.; Wakamiya, S.M.; Nielsen, C.K. Viability and patch occupancy of a swamp rabbit metapopulation at the northern edge of its distribution. Biol. Conserv. 2008, 141, 1043–1054. [Google Scholar] [CrossRef]
  104. Reif, J.; Št’astný, K.; Bejček, V. Contrasting Effects of Climatic and Habitat Changes on Birds with Northern Range Limits in Central Europe as Revealed by an Analysis of Breeding Bird Distribution in the Czech Republic. Acta Ornithol. 2010, 45, 83–90. [Google Scholar] [CrossRef]
  105. Avila-Flores, R.; Boyce, M.S.; Boutin, S. Habitat Selection by Prairie Dogs in a Disturbed Landscape at the Edge of Their Geographic Range. J. Wildl. Manag. 2010, 74, 945–953. [Google Scholar] [CrossRef]
  106. Pafilis, P.; Foufopoulos, J.; Sagonas, K.; Runemark, A.; Svensson, E.; Valakos, E.D. Reproductive biology of insular reptiles: Marine subsidies modulate expression of the Island syndrome. Copeia 2011, 2011, 545–552. [Google Scholar] [CrossRef]
  107. Novosolov, M.; Raia, P.; Meiri, S. The island syndrome in lizards. Glob. Ecol. Biogeogr. 2013, 22, 184–191. [Google Scholar] [CrossRef]
  108. Siliceo, I.; Díaz, J.A. A comparative study of clutch size, range size, and the conservation status of island vs. mainland lacertid lizards. Biol. Conserv. 2010, 143, 2601–2608. [Google Scholar] [CrossRef]
  109. Jones, N.; Malesios, C.; Ioannidou, E.; Kanakaraki, R.; Kazoli, F.; Dimitrakopoulos, P.G. Understanding perceptions of the social impacts of protected areas: Evidence from three NATURA 2000 sites in Greece. Environ. Impact Assess. Rev. 2018, 73, 80–89. [Google Scholar] [CrossRef]
  110. Gallardo, B.; Aldridge, D.C.; González-Moreno, P.; Pergl, J.; Pizarro, M.; Pyšek, P.; Thuiller, W.; Yesson, C.; Vilà, M. Protected areas offer refuge from invasive species spreading under climate change. Glob. Chang. Biol. 2017, 23, 5331–5343. [Google Scholar] [CrossRef] [PubMed]
  111. Spiliopoulou, K.; Dimitrakopoulos, P.G.; Brooks, T.M.; Kelaidi, G.; Paragamian, K.; Kati, V.; Oikonomou, A.; Vavylis, D.; Trigas, P.; Lymberakis, P.; et al. The Natura 2000 network and the ranges of threatened species in Greece. Biodivers. Conserv. 2021, 30, 945–961. [Google Scholar] [CrossRef]
  112. Kleining, B. Natura 2000—A Coherent Nature Conservation Network? Springer Nature: Cham, Switzerland, 2024; ISBN 978-3-031-56889-3. [Google Scholar]
  113. Kryštufek, B.; Vohralík, V. Mammals of Turkey and Cyprus: Rodentia I: Sciuridae, Dipodidae, Gliridae, Arvicolinae; Zgodovinsko Društvo za Južno Primorsko: Koper, Slovenia, 2005; Volume 88, ISBN 1297-9562. [Google Scholar]
  114. Enukidze, G.P. On the biology of the Transcaucasian squirrel. Soobshcheniia Akad. Nauk Gruz. 1960, 17, 101–123. [Google Scholar]
  115. Di Pierro, E.; Bertolino, S.; Martinoli, A.; Preatoni, D.; Tosi, G.; Wauters, L.A. Estimating offspring production using capture-mark-recapture and genetic methods in red squirrels. Ecol. Res. 2010, 25, 395–402. [Google Scholar] [CrossRef]
  116. Kizos, T.; Dalaka, A.; Petanidou, T. Farmers’ attitudes and landscape change: Evidence from the abandonment of terraced cultivations on Lesvos, Greece. Agric. Human Values 2010, 27, 199–212. [Google Scholar] [CrossRef]
  117. International Olive Council. Production Techniques in Olive Growing; International Olive Council: Madrid, Spain, 2007; ISBN 9788493166366. [Google Scholar]
  118. López-Bernal, Á.; Alcántara, E.; Testi, L.; Villalobos, F.J. Spatial sap flow and xylem anatomical characteristics in olive trees under different irrigation regimes. Tree Physiol. 2010, 30, 1536–1544. [Google Scholar] [CrossRef]
  119. Stavrianakis, G.; Sentas, E.; Stattegger, S.R.; Tscheulin, T.; Kizos, T. Effect of olive grove’s understorey management on arthropod diversity. Agroecol. Sustain. Food Syst. 2024, 48, 1115–1138. [Google Scholar] [CrossRef]
  120. Remm, J.; Lõhmus, A. Tree cavities in forests—The broad distribution pattern of a keystone structure for biodiversity. For. Ecol. Manag. 2011, 262, 579–585. [Google Scholar] [CrossRef]
  121. Grüebler, M.U.; Schaller, S.; Keil, H.; Naef-Daenzer, B. The occurrence of cavities in fruit trees: Effects of tree age and management on biodiversity in traditional European orchards. Biodivers. Conserv. 2013, 22, 3233–3246. [Google Scholar] [CrossRef]
  122. Cockle, K.L.; Martin, K.; Wesołowski, T. Woodpeckers, decay, and the future of cavity-nesting vertebrate communities worldwide. Front. Ecol. Environ. 2011, 9, 377–382. [Google Scholar] [CrossRef]
  123. Rothwell, R. Nest Sites of Red Squirrels (Tamiasciurus hudsonicus) in the Laramie Range of Southeastern Wyoming. J. Mammal. 1979, 60, 404–405. [Google Scholar] [CrossRef]
  124. Halloran, M.E.; Bekoff, M. Nesting Behaviour of Abert Squirrels (Sciurus aberti). Ethology 1994, 97, 236–248. [Google Scholar] [CrossRef]
  125. Edelman, A.J.; Koprowski, J.L. Selection of drey sites by Abert’s squirrels in an introduced population. J. Mammal. 2005, 86, 1220–1226. [Google Scholar] [CrossRef]
  126. Douglass, N.J.; Reinert, H.K. The utilization of fallen logs as runways by small mammals. Proc. Pennsylvania Acad. Sci. 1982, 56, 162–164. [Google Scholar]
  127. Honda, S.; Saito, M. Use of fallen dead trees by Japanese squirrels within cedar plantations in northeastern Japan. iForest—Biogeosci. For. 2023, 16, 262–267. [Google Scholar] [CrossRef]
  128. Smith, A.A.; Mannan, W. Distinguishing Characteristics of Mount Graham Red Squirrel Midden Sites. J. Wildl. Manag. 1994, 58, 437–445. [Google Scholar] [CrossRef]
  129. Carey, A.B.; Harrington, C.A. Small mammals in young forests: Implications for management for sustainability. For. Ecol. Manag. 2001, 154, 289–309. [Google Scholar] [CrossRef]
  130. Palaiologou, P.; Kalabokidis, K.; Ager, A.A.; Day, M.A. Development of comprehensive fuel management strategies for reducing wildfire risk in Greece. Forests 2020, 11, 789. [Google Scholar] [CrossRef]
  131. Wauters, L.A.; Dhondt, A.A. The use of red squirrel Sciurus vulgaris dreys to estimate population density. J. Zool. 1988, 214, 179–187. [Google Scholar] [CrossRef]
  132. Zevgolis, Y.G.; Kotselis, C.; Kouris, A.D.; Christopoulos, A. A New Aspect of Predator–Prey Dynamics: The Case of a Livestock Guardian Dog Predating upon an Invasive Coypu in Lake Kerkini, Greece. Conservation 2024, 4, 609–616. [Google Scholar] [CrossRef]
  133. Doherty, T.S.; Dickman, C.R.; Glen, A.S.; Newsome, T.M.; Nimmo, D.G.; Ritchie, E.G.; Vanak, A.T.; Wirsing, A.J. The global impacts of domestic dogs on threatened vertebrates. Biol. Conserv. 2017, 210, 56–59. [Google Scholar] [CrossRef]
  134. Chen, Y.-C. A tutorial on kernel density estimation and recent advances. Biostat. Epidemiol. 2017, 1, 161–187. [Google Scholar] [CrossRef]
  135. Sussman, A.L.; Gardner, B.; Adams, E.M.; Salas, L.; Kenow, K.P.; Luukkonen, D.R.; Monfils, M.J.; Mueller, W.P.; Williams, K.A.; Leduc-Lapierre, M.; et al. A comparative analysis of common methods to identify waterbird hotspots. Methods Ecol. Evol. 2019, 10, 1454–1468. [Google Scholar] [CrossRef]
  136. Nelson, T.A.; Boots, B. Detecting spatial hot spots in landscape ecology. Ecography 2008, 31, 556–566. [Google Scholar] [CrossRef]
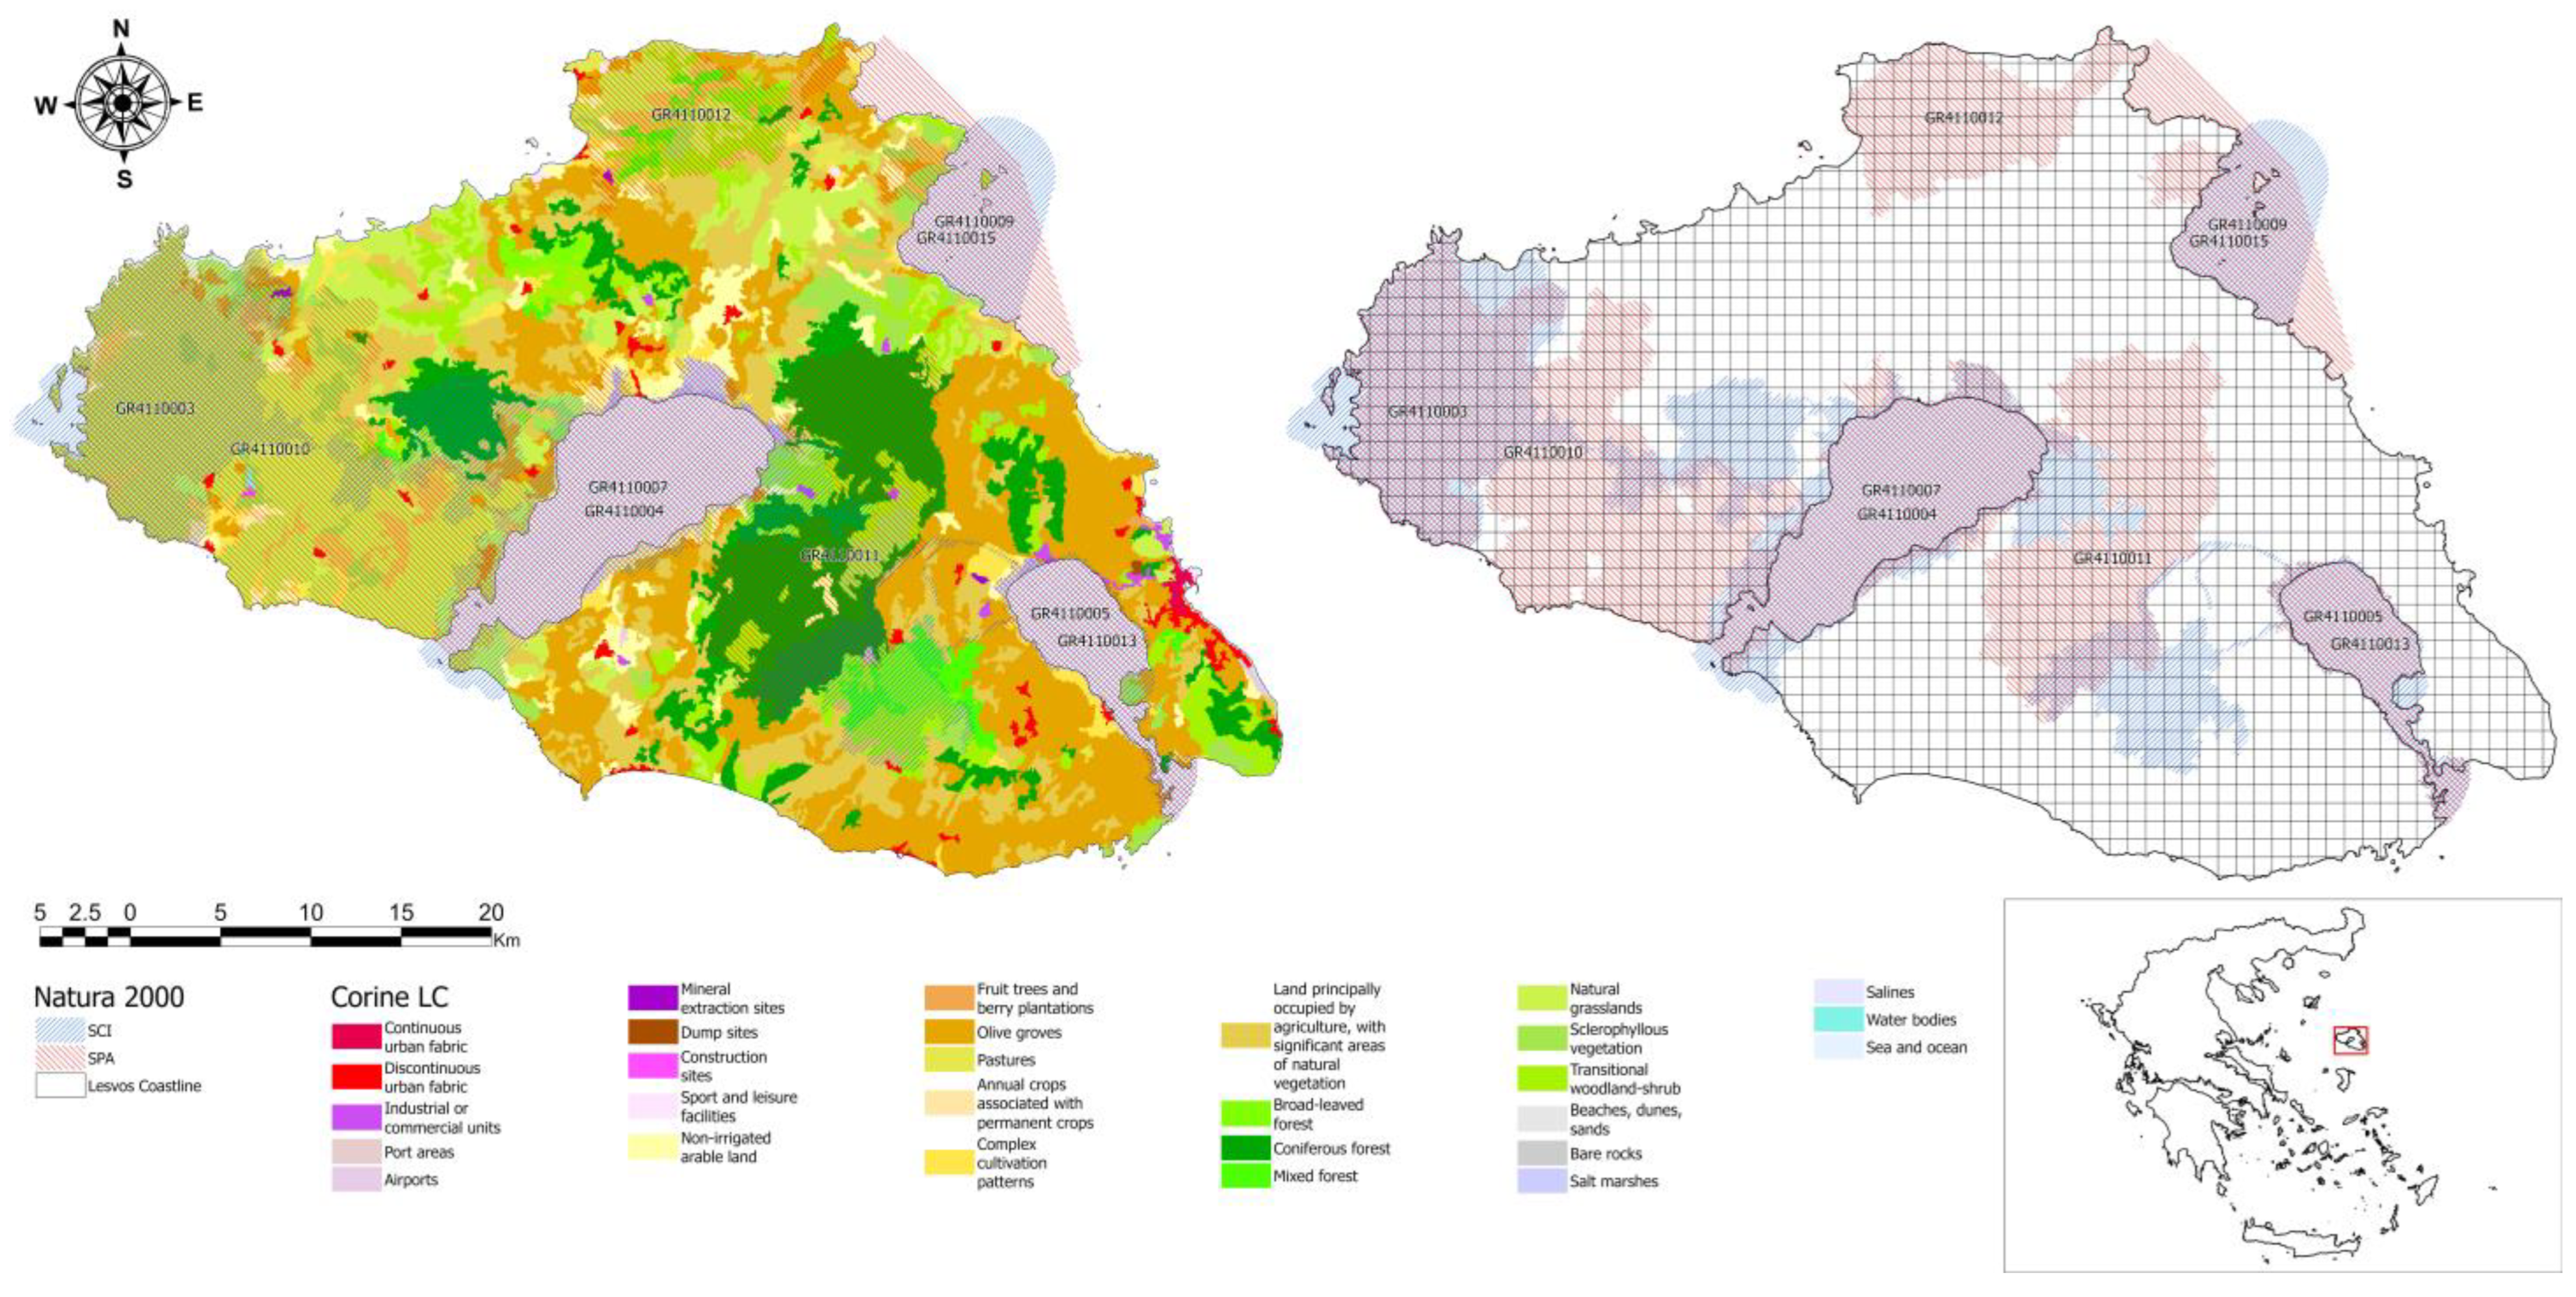
Figure 1. Distribution map of the mainland habitats across the island of Lesvos. The island is divided into a 1 × 1 km grid to facilitate field surveys. Key geographical features, including Natura 2000 sites, are highlighted. The inset map shows the location of Lesvos within Greece (red frame).
Land 14 00876 g001
Figure 2. Habitat and activity of the Persian squirrel (Sciurus anomalus) on Lesvos Island, Greece: (a) a natural pathway within the study area; (b) an individual feeding on an olive tree; (c) a squirrel navigating a common walnut tree; (d) a dense olive grove characteristic of the species’ habitat; (e) a Persian squirrel in an alert posture within an olive tree cavity.
Land 14 00876 g002
Figure 3. Spatial distribution of Sciurus anomalus across the island of Lesvos. The left panel illustrates species presence records (blue circles) overlaid on CORINE Land Cover classifications, highlighting the dominant habitat types. Natura 2000 areas are delineated, with Sites of Community Importance (SCI) in red and Special Protection Areas (SPAs) in blue shading. The right panel presents the surveyed grid cells (1 × 1 km), with green cells indicating those where S. anomalus was recorded. The inset map shows the location of Lesvos within Greece (red frame).
Land 14 00876 g003
Figure 4. Effect plots illustrating the predicted probability of Sciurus anomalus’ presence in relation to the principal components (PCs) derived from the logistic regression model. The solid blue lines represent the predicted probability, while the shaded areas indicate 95% confidence intervals.
Land 14 00876 g004
Figure 5. Kernel Density Estimation (KDE) map illustrating the spatial distribution of Sciurus anomalus across the island of Lesvos. Warmer colors (red and yellow) indicate areas of higher presence density, while cooler colors (blue) represent lower-density regions. The analysis highlights key high-density areas in the southeastern and eastern parts of the island, predominantly associated with olive groves and mixed agricultural landscapes.
Land 14 00876 g005
Figure 6. Spatial clustering of Sciurus anomalus presence records across the island of Lesvos based on the Getis-Ord Gi statistic. Red dots indicate statistically significant hotspots, while blue dots represent coldspots. Intermediate clustering patterns (hotspots and coldspots) are depicted in shades of orange and blue. The z-scores derived from the Getis-Ord Gi* analysis illustrate the statistical significance of the identified clusters. Natura 2000 areas are delineated, with Sites of Community Importance (SCI) in red and Special Protection Areas (SPAs) in blue shading.
Land 14 00876 g006
Figure 7. Spatial clusters and outliers of Sciurus anomalus presence across the island of Lesvos identified using Anselin Local Moran’s I analysis. High–Low (HL) outliers (red) represent high presence values occurring within low-density regions, while Low–High (LH) outliers (blue) denote low presence values within high-density areas. Low–Low (LL) clusters (light blue) indicate areas of low presence surrounded by similarly low values. Non-significant clusters (grey) indicate areas where no statistically significant clustering was detected. Natura 2000 areas are delineated, with Sites of Community Importance (SCI) in red and Special Protection Areas (SPAs) in blue shading.
Land 14 00876 g007
Table 1. The PCA loadings of the five rotated principal components (PCs).
Principal ComponentsVariablePrincipal Components Loadings
PC1PC2PC3PC4PC5
PC1—Olive-dominated agricultural areasOlive groves (actively cultivated)0.920----
Total cultivated land0.908----
Olive cover density0.655----
Vegetation productivity0.624----
PC2—Chestnut forestsChestnut plantations-0.977---
Chestnut cover density-0.976---
PC3—Coniferous forestsConiferous cover density--0.913--
Coniferous forests--0.863--
PC4—Proximity to water and livestock farmingProximity to livestock facilities---0.863-
Proximity to water---0.801-
PC5—Broadleaved forestsBroadleaf cover density----0.871
Broadleaved forests----0.777
Table 2. The binary logistic regression model for the presence of Sciurus anomalus on the island of Lesvos. Β = logistic coefficient; S.E. = standard error of estimate; Wald = Wald Chi-square; df = degree of freedom; p-value = significance.
PredictorΒS.E.Wald’s χ2dfp-Value
PC1—Olive-dominated agricultural areas3.6600.305143.9381<0.0001
PC3—Coniferous forests−0.7930.13634.1311<0.0001
PC4—Proximity to water and livestock farming−1.7200.18487.0761<0.0001
PC5—Broadleaved forests1.2550.12896.4861<0.0001
Constant0.8230.17522.1021<0.0001
Table 3. Spatial Lag Model (SLM) for hotspot intensity and the Spatial Error Model (SEM) for clustering patterns of Sciurus anomalus on the island of Lesvos. The SLM estimates the influence of the PCs on hotspot intensity while accounting for spatial dependence through the spatial autoregressive parameter. The SEM models clustering patterns while addressing spatial autocorrelation in the residuals via the spatial error parameter. Coefficients (B), standard error (S.E.), z-values, and p-values are reported for each predictor.
VariableB S.E.z-Valuep-Value
(a) SLM—Hotspot Intensity
Spatial autoregressive parameter (Rho)0.4100.02814.268<0.0001
Constant−0.2910.052−5.593<0.0001
PC1—Olive-dominated agricultural areas2.5670.21711.780<0.0001
PC2—Chestnut forests0.3060.0378.079<0.0001
PC3—Coniferous forests−0.6020.063−9.539<0.0001
PC5—Broadleaved forests0.4620.04310.65<0.0001
(b) SEM—Clustering Patterns
Spatial error parameter (Lamda)0.1880.0414.517<0.0001
PC1—Olive-dominated agricultural areas0.4190.04010.350<0.0001
PC5—Broadleaved forests0.4600.04410.389<0.0001
Constant−0.0080.059−0.140<0.0001
Disclaimer/Publisher’s Note: The statements, opinions and data contained in all publications are solely those of the individual author(s) and contributor(s) and not of MDPI and/or the editor(s). MDPI and/or the editor(s) disclaim responsibility for any injury to people or property resulting from any ideas, methods, instructions or products referred to in the content.