Abstract
Comprehensive land consolidation (CLC) significantly impacts farmers’ sustainable development, particularly in southwestern mountainous areas with limited alternative livelihood options. However, existing studies have rarely considered the impact of CLC on farmers’ livelihoods under different terrain gradients in mountainous areas. Therefore, this study employs elevation, slope, and the terrain position index to divide terrain gradient zones. Based on 307 responses from household survey data, this study measures the changes in farmers’ livelihood capital and livelihood strategies before and after CLC and analyzes the heterogeneity of the impact of CLC under different terrain gradients. The results show the following: (1) The growth of farmers’ livelihood capital and the net effect of CLC showed the terrain gradient effect of medium-terrain areas > low-terrain areas > high-terrain areas. (2) Traditional agricultural types are transitioning to modern agricultural types and agriculture multi-employment types, while agriculture multi-employment types are shifting to non-agriculture multi-employment types. (3) The direct impact of CLC on livelihood transformation is significant in the low-terrain areas, whereas in the medium-terrain and high-terrain areas, the effects are primarily indirect through livelihood factors. This study can provide suggestions for the sustainable development of farmers in different topographic gradients in the Anning River basin.
1. Introduction
As a policy tool for land management, land consolidation (LC) is commonly employed to reconcile the conflict between economic development and land use across various countries [1]. It serves as a significant catalyst for sustainable rural development [2] and has attracted the attention of scholars, experts, and policymakers worldwide [3]. Relevant studies indicate that land consolidation facilitates the reduction in land fragmentation [4], enhances land use efficiency, improves highway accessibility, optimizes rural spatial structures [5], boosts agricultural output, increases profitability [6] and elevates the living standards of farmers [7]. However, due to the diverse natural, social, economic, and policy environments across different countries, substantial variations exist in the objectives, methods, and procedures of land consolidation [8], leading to differing impacts on rural areas and farmers.
China’s land consolidation has progressed rapidly over the past three decades. Initially, the primary objective of land consolidation was to increase the amount of cultivated land [9]. However, it has now evolved into comprehensive land consolidation (CLC), which aims to enhance intensive production, improve quality of life, and promote ecological sustainability [10]. Currently, China’s rural regions face significant challenges, including the abandonment of agricultural land, the vacancy of residential plots, the outflow of rural talent, and the degradation of the ecological environment [11,12]. These issues severely hinder the sustainable development of rural areas [13]. Particularly in the mountainous areas of southwest China, farmers encounter significant risks in their daily lives and production due to the constraints imposed by the terrain and environmental fragility, which limit available alternative livelihood options [7]. For these farmers, land constitutes the most essential production resource, providing crucial support for survival, agricultural activities, and social security [14,15]. Consequently, investigating the effects of CLC on farmers’ livelihoods is vital for promoting sustainable development in these mountainous regions.
“Livelihood” refers to a living based on capabilities, assets, and activities. A livelihood is considered sustainable when it can withstand external shocks, maintain asset levels, and achieve the sustainable use of natural resources [16]. Scholars around the world have extensively explored the issue of sustainable livelihoods, developing various analytical frameworks. The Sustainable Livelihood Framework (SLF) established by the UK’s Department for International Development (DFID) [17] has become a mainstream paradigm due to its systematic approach and applicability [18]. It analyzes how livelihood assets, within the context of vulnerability, influence livelihood strategies through structures and processes, subsequently affecting livelihood outcomes and promoting sustainable development for farmers. Initially, the SLF was primarily used to analyze the relationship between poverty in rural areas and the vulnerability of farmers [19]. As research has evolved, scholars have utilized SLF to examine the development of farmers’ livelihoods under different vulnerability contexts, such as climate change [20], environmental risks [21], water–energy–food nexus [22], and land reclamation policies [23]. Additionally, some researchers have adapted and innovated SLF in response to contemporary challenges, highlighting a structured, dynamic, and ecologically coordinated approach to defining rural livelihoods [24].
Currently, scholars have begun to investigate the impact mechanisms of land consolidation on farmers’ livelihoods based on the SLF. However, most studies focus on single projects, such as the effects of agricultural land consolidation (ALC) on farmers’ livelihoods [23,25]. For instance, Zhang et al. [26] studied the impact of ALC on the incomes of both impoverished and non-impoverished households, indicating that ALC can promote income increases for both groups, with the income growth effect being greater for non-impoverished households. Olivia et al. [27] examined the changes in smallholder livelihood strategies in Argentina’s Gran Chaco region, which is undergoing large-scale land development, suggesting that due to the constraints of land dynamics and resource acquisition pressures, cattle and sheep breeders may be more inclined towards stable pig farming. The comprehensive land consolidation (CLC) proposed by the FAO (Food and Agriculture Organization of the United Nations) emphasizes not only the reallocation of parcels but also other measures to promote rural development, such as building road networks, controlling soil erosion, and managing and protecting village environments [28]. In China, CLC encompasses not only agricultural land consolidation (ALC) but also rural construction land consolidation (RLC) and ecological protection and restoration (EPR). However, there is currently a lack of systematic elaboration and quantitative research on the effects of CLC on farmers’ livelihoods.
In the southwestern mountainous regions of China, the significant variation in elevation and slope creates heterogeneous geographical conditions that may lead to spatial differentiation in the effects of CLC. Existing research has already highlighted the impact of CLC under different natural conditions on farmers’ livelihoods. For example, Li et al. [29] considered factors such as elevation and slope in their study of the effects of land consolidation on sustainable poverty alleviation, revealing that higher elevations and steeper slopes significantly negatively affect the implementation outcomes of land consolidation. Zhang et al. [30] investigated the income-increasing effects of agricultural land consolidation in both plain and mountainous areas, finding that the income growth effect in plain areas is markedly greater than that in mountainous areas. Most existing studies employ a binary classification framework of “plain-mountain”, overlooking the nuanced regulation of CLC effects by the continuous gradient of topography and lacking a systematic analysis of the relationship between terrain gradients and the effects of CLC. Current studies on terrain gradients primarily focus on multiple factors, including elevation, slope, terrain relief, and terrain position index, to explore the effects of terrain gradients on regional land use [31], habitat quality [32], and rural revitalization [33], thereby providing theoretical support for this research.
This study focuses on the Anning River basin in the mountainous region of southwest China, where it examines terrain gradients using elevation, slope, and the terrain position index. It collects livelihood data from farmers across different terrain gradients through a questionnaire survey, analyzes the impact of CLC on farmers’ livelihood capital and strategies, and offers policy recommendations, aiming to provide references for the implementation of CLC and the sustainable livelihood development of farmers in the Anning River basin.
2. Theoretical Analysis Framework
Based on the SLF, this study positions “land comprehensive consolidation” as a policy tool for the government to achieve sustainable livelihoods for farmers. It constructs an analytical framework of “consolidation intervention—capital restructuring—strategy transformation” to analyze the impact mechanisms of CLC on farmers’ livelihood systems across different terrain gradients (Figure 1).
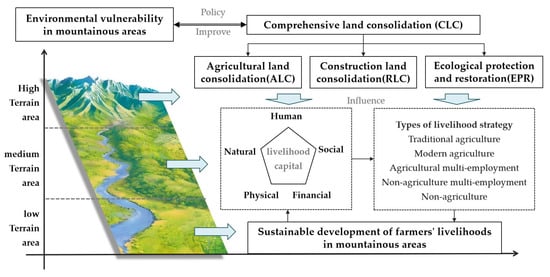
Figure 1.
Framework of effects of comprehensive land consolidation. (Source: Study findings).
2.1. The Theoretical Impact of CLC on Farmers’ Livelihood Capital
Comprehensive land consolidation (CLC) is an important rural land utilization project [34], which promotes the reorganization of farmers’ livelihood capital through comprehensive measures such as agricultural land consolidation (ALC), rural construction land consolidation (RLC), and rural ecological protection and restoration (EPR). Among them, ALC has the most direct impact on farmers’ natural capital, showing a dual nature [35]. On the one hand, it can increase the area and quality of agricultural land through land leveling, field consolidation, reclamation of abandoned land, and soil improvement [30]. On the other hand, it may also reduce the area of agricultural land by widening or building new production roads and irrigation and drainage ditches in the fields [35]. Secondly, ALC can reduce land disputes among farmers and enhance their social capital through land ownership confirmation and adjustment [36]. It can also improve farmers’ financial capital by improving agricultural infrastructure, reducing farming costs, and increasing agricultural income. In addition, ALC enables farmers to understand relevant policies and learn management and planting skills, thereby improving the quality of the labor force [35]. RLC has the greatest impact on the livelihood capital of relocated farmers in mountainous areas. Relocated farmers rebuild houses and supporting infrastructure in the river valley area, thereby enhancing their material capital. However, due to the change in location, farmers may transfer or abandon their mountainous agricultural land, altering their natural capital. At the same time, they can free up surplus labor to engage in non-agricultural production activities, increase family income, and enhance their financial capital. EPR mainly affect farmers’ natural capital such as farmland quality, material capital such as living infrastructure, and financial capital such as non-agricultural income driven by rural ecological tourism. It has little impact on farmers’ human capital and social capital.
The topography of the Anning River basin is complex. Due to factors such as elevation, slope, relief degree, and transportation accessibility, farmers’ livelihoods vary across different terrain gradients. The content, difficulty, and objectives of CLC also differ, resulting in different impacts on farmers’ livelihood capital. In the valley, the terrain is flat, the soil is fertile, and transportation is convenient. Farmers in this area find it easier to engage in agricultural production, seek employment elsewhere, understand policies, and participate in community activities, leading to a relatively higher standard of living. Nonetheless, urbanization has raised population density while diminishing the quantity of arable land, which has led to farmers possessing smaller agricultural plots and a reduction in their natural capital. ALC is a viable approach that can effectively mitigate the fragmentation of agricultural land in the valley regions [35], although the potential for improvement remains constrained. Similarly, the impact of RLC and EPR on enhancing farmers’ livelihood capital is also constrained. In medium-terrain areas, the availability of extensive land and convenient transportation facilitates ALC, which can reduce the slope of cultivated land and improve land use efficiency through land leveling and slope modification. Through modern large-scale farming or land transfer, family labor resources can be reasonably allocated between agricultural and non-agricultural activities [15], thereby increasing household income. RLC and EPR enhance farmers’ material and social capital by improving housing quality, infrastructure, and living environments. In high-terrain areas, ecological protection constraints limit the availability of usable land. Additionally, poor land quality, inconvenient transportation, lagging infrastructure, and limited access to information hinder the implementation of CLC, resulting in minimal project outcomes. However, farmers who are primarily relocated benefit significantly from RLC, as their housing location, quality, and living conditions are greatly improved, providing them with more opportunities to understand policies, participate in activities, and interact with other farmers [35], thus increasing their livelihood capital.
2.2. The Theoretical Impact of CLC on Farmers’ Livelihood Strategy
Livelihood strategy is regarded as the allocation and combination of capital utilization and business activities, including production activities and investment strategies [37]. According to the classification criteria of previous studies [36,38], based on the proportion of time spent in agriculture and other characteristics, the types of farmers’ livelihood strategies are classified into five categories: traditional agricultural type, modern agricultural type, agricultural multi-employment type, non-agricultural multi-employment type, and non-agricultural type (Table 1).

Table 1.
Types of farmers’ livelihood type. (Source: Authors’ elaboration.).
According to the research framework, the impact of CLC on farmers’ livelihood strategy has two paths: one is the direct impact on farmers’ livelihood strategy and the other is the impact on livelihood strategy through the influence on farmers’ livelihood capital [39]. The direct impact of CLC is reflected in the rational allocation of family labor resources between agriculture and non-agriculture brought about by land transfer [15]. For example, under the government-led consolidation model, farmers participate in land consolidation engineering construction, and construction enterprises absorb local farmers to participate in construction and pay wages [40]. The agricultural operation entity-led model is based on land transfer. After farmers transfer their agricultural land, they will choose other non-agricultural employment methods [39]. The indirect impact of CLC on farmers’ livelihood strategy is mainly through the intermediary element of farmers’ livelihood capital, which is mainly manifested as follows: after the implementation of CLC, if farmers’ natural capital, human capital, and material capital increase, it will be convenient to carry out agricultural mechanization and large-scale farming, and farmers will develop from traditional small-scale agriculture to modern large-scale agriculture. For some farmers, ALC increases the comprehensive value of the land, enabling them to obtain higher rental income from land transfer, so they are more willing to transfer agricultural land and then engage in non-agricultural production activities. Some farmers transfer the management rights of their agricultural land for a certain period by shareholding or leasing to agricultural production enterprises or agricultural cooperatives and become agricultural workers of the management entity, obtaining wages from agricultural production [40].
Based on the analysis of the impact of CLC on the livelihood capital of farmers at different terrain gradients, farmers in plain areas are more affected by the ALC and have more livelihood options. When farmers’ human capital, financial capital, and social capital increase, they can carry out business activities based on the knowledge and skills they have and utilize available financial funds and social resources to increase the diversity of their livelihoods. Farmers in medium-terrain gradient areas have more land resources and mainly engage in agricultural production, and are greatly affected by the ALC. After land leveling and slope reduction, large-scale planting can be implemented to develop modern agriculture. Farmers in mountainous areas are more affected by RCL. Due to relocation, their homesteads and agricultural land are reclaimed by the state or it is inconvenient to work in the mountains, so they may choose to work outside or do business, changing their livelihood strategies.
2.3. Selection of Farmers’ Livelihood Capital Variables
Based on the theoretical analysis and related research, this paper selects livelihood capital variables from five aspects, natural, human, physical, financial, and social capital, and constructs a livelihood capital indicator system as shown in Table 2.
Table 2.
Variables of sustainable farmers’ livelihood capital (Source: Authors’ elaboration).
3. Materials and Methods
3.1. Study Area
The Anning River basin is situated within the transition zone between the Sichuan Basin, Yunnan–Guizhou Plateau, and Qinghai–Tibet Plateau (101°51′–102°48′ E, 26°38′–28°53′ N) in southwestern China (Figure 2), featuring the second-largest plain in Sichuan Province [41]. It is predominantly mountainous, with altitudes varying from 531 to 5271 m, characterized by a north–south gradient and significant surface undulation. According to the ‘Territorial Spatial Planning of Anning River Basin (2022–2035)’, it covers 11 cities and counties: Renhe District, Miyi County, Yanbian County, Xichang City, Dechang County, Ningnan County, Huili City, Huidong City, Yanyuan County, Xide County, and Mianning County [41].
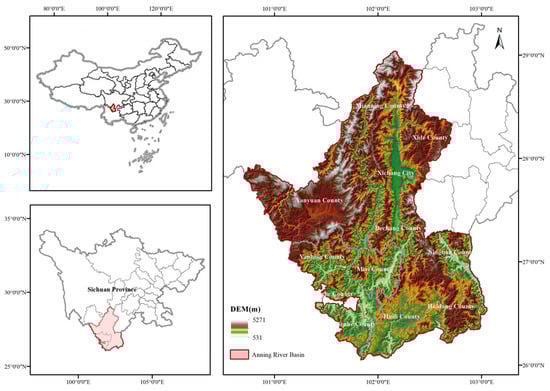
Figure 2.
Location map of the Anning River basin. (Source: Drawn by the authors.).
In March 2024, Sichuan Province released the ‘Comprehensive Land Consolidation Plan for the Anning River Basin in Sichuan Province (2022–2035)’, which aims to transform the Anning River basin into “the Second Granary of Tianfu” by implementing comprehensive land consolidation (ALC, RLC, and EPR), so as to ensure food security and promote the high-quality development of the Anning River basin. Currently, over 300 CLC projects have been completed in the Anning River basin, covering a total area of 1.8 million acres. More than 5100 km of new and renovated agricultural irrigation and drainage channels, along with over 4900 km of field roads, have been constructed. Additionally, 588 projects aimed at the adjustment of urban and rural construction land have been completed, yielding an excess of 59,000 acres in linkage indicators. Therefore, researching the impact of CLC on farmers’ livelihoods in the Anning River basin is both representative and advantageous for the successful implementation of these initiatives.
3.2. Data Source
The digital elevation model (DEM) was obtained from the Geospatial Data Cloud website (https://www.gscloud.cn/) (accessed on 10 January 2024) and has a spatial resolution of 30 m. Slope data were derived from the DEM, enabling the calculation of the average elevation and slope for each village through regional statistics [30]. Administrative boundary data for countries, provinces, and cities were sourced from the Ali Cloud Data Visualization Lab (https://datav.aliyun.com/portal) (accessed on 10 January 2024), while data for towns and villages were provided by local government authorities. Regarding the farmers’ livelihood data, our research team conducted a questionnaire survey in the study area in August 2024 through random sampling and face-to-face interviews. Our research team conducted a questionnaire survey in August 2024 using random sampling and face-to-face interviews. The questionnaire covered various aspects, including the demographics of farmers and their families, changes in farmers’ livelihood capital (natural, human, physical, financial, and social), and shifts in livelihood strategies before and after CLC. A total of 320 questionnaires were distributed, with 307 valid responses retained after excluding incomplete submissions, resulting in an effective response rate of 95.9%. Among the valid submissions, 165 were from regulated areas and 142 from unregulated areas. Based on terrain gradients, the survey consisted of 100 respondents from low-terrain areas, 106 from medium-terrain areas, and 101 from high-terrain areas. The study conducted reliability and validity tests on the scale’s data. The results indicated that Cronbach’s α coefficient was 0.555, the KMO statistic was 0.696, and the chi-square value for Bartlett’s test of sphericity was 317.325, with a significance level of 0.00. These findings suggest that the reliability and validity of the questionnaire are acceptable.
3.3. Terrain Gradient Division
Elevation and slope, as critical terrain factors, significantly influence regional land use and the effectiveness of CLC [42]. However, their effects are interdependent rather than independent. The terrain position index (TPI) is a measure that reflects elevation and slope, effectively encapsulating how these elements impact land use on a regional scale [31]. The formula is as follows:
is the terrain position index of the village; , is the average elevation and slope of the village; and , is the average elevation and slope of the Anning River basin [33]. The higher the elevation and the steeper the slope, the larger the terrain position index [42].
This paper categorizes the terrain gradient of the Anning River basin into six grades and three terrain regions based on elevation, slope, and the terrain position index (TPI), providing a terrain basis for the selection of sample villages. Elevation is divided into six grades with 600-meter intervals using the equal spacing method: (600 m, 1200 m], (1200 m, 1800 m], (1800 m, 2400 m], (2400 m, 3000 m], (3000 m, 3600 m], and (3600 m, 4200 m]. According to the critical slope grading method, the slope is categorized into six grades: (0°, 2°], (2°, 6°], (6°, 15°], (15°, 25°], (25°, 35°], and (35°, 45°]. The terrain position index is divided into six grades using the natural breakpoint method [31,42].
3.4. Calculation of the Livelihood Capital Index
Considering the inherent differences in data and the significance of various indicators, this paper employs a hybrid weighting method that combines the Analytic Hierarchy Process (AHP) and the Coefficient of Variation (COV) to assess livelihood capital indicators [35,43]. Subsequently, the comprehensive index method is utilized to calculate the livelihood capital indexes (LCIs) of farmers. The formulas are as follows:
, , , are, respectively, the coefficient of variation, standard deviation, arithmetic mean, and standardized value of the variable . , , are the weights calculated by COV, AHP, and weighted average, respectively. represents the livelihood capital index.
3.5. Difference-in-Differences Model (DID)
The difference-in-difference (DID) model is commonly employed to study the effects of policy interventions. Its basic logic involves dividing survey samples into a treatment group and a control group, measuring the changes in both groups before and after the policy, and then calculating the difference between these changes to reflect the net effect of the policy [30]. In this study, CLC is regarded as a policy, with the treatment group consisting of farmers who implemented CLC, while the control group comprises farmers who did not. Based on the implementation timeline, the samples can be divided into four groups, distinguished by adding two dummy variables and [38]. = 1 represents the farmers in a regulated area, = 0 represents the farmers in an unregulated area, = 0 corresponds to farmers before CLC, and = 1 corresponds to farmers after CLC. The DID model is constructed as follows:
is the explained variable, i represents the i farmer, t represents the t year, is the interaction term of and . , represent the implementation effect and time effect of CLC and is the net effect of CLC concerned by this study. is the coefficient to be estimated and is the random disturbance term.
3.6. Ordered Logistic Regression Model (OLR)
The ordered logistic regression model is suitable for regression problems involving ordered categorical data [38]. In this study, the farmers’ livelihood strategies are classified into five types based on the proportion of family labor input into agricultural work. The classification follows the sequence of livelihood non-agriculturalization and is suitable for ordered logistic regression analysis. This study utilizes the Stata 17.0 software, treating farmers’ livelihood strategies as the dependent variable, and land comprehensive consolidation and livelihood capital as control variables. It conducts ordered logistic regression analysis on the farmers’ livelihood data before (model 1) and after (model 2) CLC under different terrain gradients, aiming to explore the impact of CLC on farmers’ choices of livelihood strategies. The model formula is as follows:
is the latent variable of livelihood strategy , represents the probability of farmers’ livelihood transformation, is the explanatory variable, is the regression coefficient of each explanatory variable, and is a random disturbance term following a normal distribution. Before regression, multiple collinearity tests are conducted on the explanatory variables using Stata 17.0 to avoid inaccurate parameter estimation and affect the significance of the test variables [44]. When the variance inflation factor (VIF) is less than 10, it indicates that there is no collinearity among the explanatory variables, and regression analysis can be conducted [44]. After the analysis, the parallelism test of the independent variable coefficients is performed based on the model chi-square value. If the significance level of the chi-square value is greater than 0.05, the parallelism test is passed, and subsequent analysis can be carried out [45].
4. Results
4.1. Results of Terrain Gradient Division
The regional terrain gradients are categorized into three regions based on elevation, slope, and the terrain position index (TPI), as shown in Table 3 and Figure 3. It can be observed that the average elevation of most villages in the Anning River basin is between 1200 m and 3000 m, which corresponds to grades II, III, and IV, accounting for 28.89%, 39.84%, and 23.63%, respectively. The average slope of most villages ranges from 6° to 35°, corresponding to grades III, IV, and V and accounting for 15.8%, 58.43%, and 21.02%, respectively. The terrain potential index of villages in the Anning River basin ranges from 0.235 to 0.848. Specifically, 28.71% of the villages are located in low-terrain areas (grades I and II), with a terrain location index between 0.234 and 0.497, primarily situated along the main stream of the Anning River and in shallow hill regions, such as the Yanyuan Basin and the Heishui River valley. Additionally, 49.91% of the villages fall within medium-terrain areas (grades III and IV), exhibiting a terrain location index ranging from 0.497 to 0.626, predominantly found in the low mountain regions on both sides of the Anning River, deep hill areas, and the low mountain areas of the Yanyuan Basin. Lastly, 21.39% of the villages are situated in high-terrain areas (grades V and VI), mainly distributed along the upper and western banks of the Anning River and parts of the high-terrain area of Ningnan County and Dechang County, with a terrain position index between 0.626 and 0.848.
Table 3.
Terrain gradient classification of the Anning River basin (Source: Study findings).
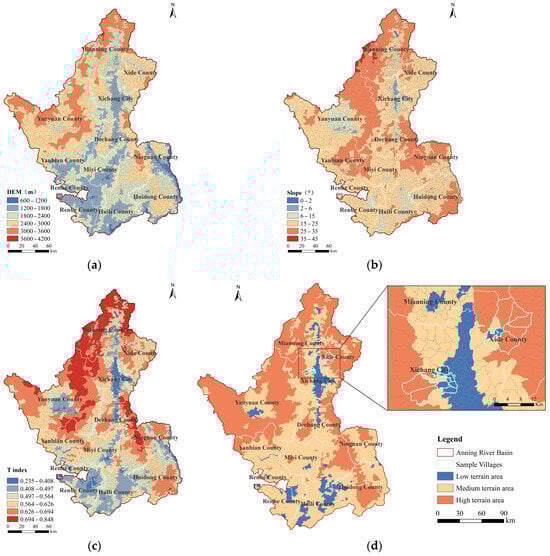
Figure 3.
This is a hierarchical spatial map of topographic factors such as elevation, slope, and terrain position index. (a) Terrain classification map of DEM; (b) terrain classification map of slope; (c) terrain classification map of terrain position index; (d) location map of sample villages with different terrain gradients (Source: Study findings).
The purpose of this research is to reveal the varying impacts of CLC on farmers’ livelihood across different terrain gradients. Accordingly, sample villages in low-terrain areas, medium-terrain areas, and high-terrain areas were selected based on the classification of terrain gradients. Meanwhile, the CLC projects in the sample villages were well implemented, incorporating at least two of the following three projects: Agricultural Land Consolidation (ALC), Rural Construction Land Consolidation (RLC), and Ecological Protection and Restoration (EPR). The implementation timeline was controlled between 2019 and 2023 to ensure the comparability and accuracy of the data. In summary, the villages involved in the Zichu Village Land Consolidation Project, Qiulin Village Land Consolidation Project, Si Azu Village Land Consolidation Project, and Hongmo Town Beautiful China Ecological Civilization Construction Project were selected as the sample villages (Figure 3).
4.2. Analysis of the Impact of CLC on Farmers’ Livelihood Capital
4.2.1. Change Characteristics of Livelihood Variables
The data regarding farmers’ livelihood capital before and after CLC across different terrain gradients are presented in Table 4. As land serves as the core resource for farmers’ livelihoods, the average cultivated land area for farmers in the low-terrain area decreased from 3367 m2 to 2533 m2, while the area of orchards decreased from 693 m2 to 567 m2. In the medium-terrain area, the average cultivated land area decreased from 5740 m2 to 4127 m2, while the area of orchards increased from 453 m2 to 1193 m2. In the high-terrain area, the average cultivated land area decreased from 5933 m2 to 3573 m2, and the area of orchards decreased from 880 m2 to 613 m2. This reflects that the medium-terrain area optimized its natural capital by improving cultivated land quality and enhancing orchard land value, while the low-terrain area experienced a reduction in cultivated land due to accelerated land transfers, and the high-terrain area faced shrinkage due to resettlement. There is a significant improvement in regional land quality, with vertical differentiation observed. The valley region has finer soil particles and ample nutrients and moisture, resulting in higher soil quality. In contrast, the soil in the high mountainous region is coarser, with nutrients eroded to the foot of the mountain, leading to poorer soil quality.
Table 4.
Farmers’ livelihood capitals before and after CLC under different terrain gradients (Source: Study findings).
The number of family laborers across the three areas showed little change, but the skill level of labor in the low-terrain area improved the most, highlighting the learning effects brought by the CLC projects. Physical capital exhibited significant spatial restructuring, with many relocated households among the sampled farmers in the low-terrain area, which reduced their distance from the township from 7.69 km to 1.76 km, indicating a marked improvement in house location. The housing quality in the high-terrain area also improved significantly, suggesting that CLC enhanced the living quality of farmers. In terms of financial capital, the annual household income is ranked as follows, high-terrain area < medium-terrain area < low-terrain area, while the annual agricultural income is ranked as follows, high-terrain area < low-terrain area < medium-terrain area. This indicates that farmers in the medium-terrain area are more proactive in agricultural production, with agricultural income holding significant importance, while farmers in the low-terrain area engage more in non-agricultural livelihood activities, resulting in an overall higher income. The income sources in three areas diversified, indicating that the CLC encouraged farmers to pursue varied livelihood activities. To sum up, except for the cultivated land area, orchard land area, and location of housing, the other variables of farmers’ livelihood capital showed improvement.
4.2.2. Impact Analysis of Comprehensive Land Consolidation
The farmers’ livelihood capital index (LCI) and the net effects of CLC across different terrain gradients is shown in Table 5. Farmers’ LCI increased from 0.432 to 0.492 in the low-terrain area, from 0.429 to 0.494 in the medium-terrain area, and from 0.390 to 0.423 in the high-terrain area. The net effects of CLC on the low-, medium-, and high-terrain areas were 0.037, 0.039, and 0.023, respectively, indicating that the positive net effects of CLC on farmers’ livelihood capital in the low- and medium-terrain areas are relatively significant, while the impact on the high-terrain area is smaller.
Table 5.
Farmers’ livelihood capital index and the net effects of CLC under different terrain gradients (Source: Study findings).
In terms of individual livelihood capitals (Figure 4), natural capital increased in the medium-terrain area, while the low- and high-terrain areas exhibited a tendency for natural capital outflow, primarily due to an increased willingness among some farmers to transfer land and the reversion of land to state ownership by relocated households. After CLC, the ranking of the material capital index was low-terrain area > medium-terrain area > high-terrain area, which is related to the spillover effects of urban infrastructure on farmers in the low-terrain area. The financial capital index was relatively high and showed significant growth, indicating that it is crucial for farmers’ livelihoods. The human capital and social capital of farmers in different terrain areas have both improved.
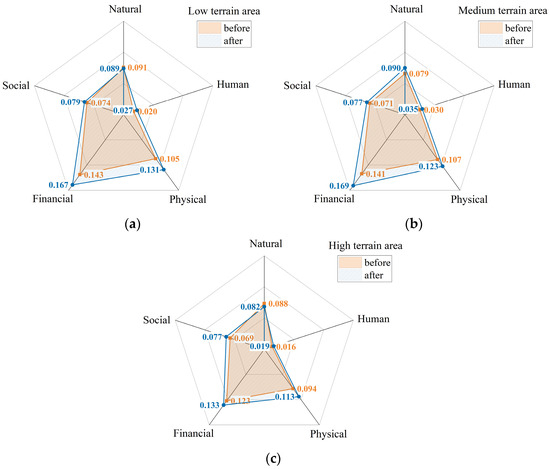
Figure 4.
This is a radar chart of farmers’ livelihood capital before and after comprehensive land consolidation under different terrain gradients. (a) Radar map of farmers’ livelihood capital under low-terrain gradients; (b) radar map of farmers’ livelihood capital under medium-terrain gradients; (c) radar map of farmers’ livelihood capital under high-terrain gradients (Source: Study findings).
The net effects of CLC on farmers’ livelihood capital (Figure 5) in the low-terrain area were primarily reflected in material and financial capital, while the net effects on natural and financial capital were more pronounced for farmers in the medium-terrain area. In the high-terrain area, the net effects were more significant for material and social capital, demonstrating that natural, material, and financial capital are essential aspects contributing to the improvement of farmers’ livelihood levels.
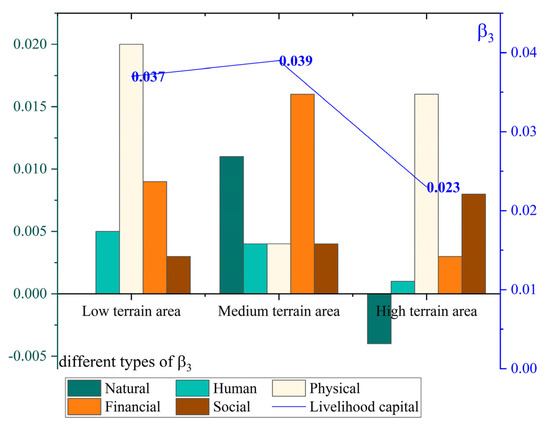
Figure 5.
Net effect of CLC (β3) with different terrain gradients. (Source: Study findings.).
4.3. Analysis of the Impact of CLC on Farmers’ Livelihood Strategies
4.3.1. Change Characteristics of Livelihood Strategies
The data on farmers’ livelihood strategies before and after CLC in different terrain gradients are shown in Table 6. It can be seen that before CLC, the main livelihood type of the total sample farmers was agricultural multi-employment type, accounting for 52.77%. These farmers primarily engaged in the cultivation of rice, corn, and grapes, with some family laborers working locally or migrating for employment during the agricultural off-season. After CLC, the proportion of agricultural multi-employment households decreased to 40.39%. The share of traditional agricultural households fell from 24.76% to 11.4%, whereas the proportion of non-agricultural multi-employment households increased from 21.82% to 37.13%. The number of modern agricultural households rose from 2 to 22, and non-agricultural households increased from 0 to 12. This shift indicates a transition from traditional agricultural types towards modern agricultural and agricultural multi-employment types, with agricultural multi-employment types primarily moving towards the non-agricultural multi-employment type. Overall, CLC has led to a trend towards diversification and non-agricultural livelihoods among households.
Table 6.
Farmers’ livelihood strategy before and after CLC under different terrain gradients (Source: Study findings).
From the perspective of different terrain gradients, the main livelihood type of farmers in the low-terrain area before CLC was the agricultural multi-employment type, accounting for 46.6%. After CLC, the agricultural multi-employment type and traditional agricultural type decreased, while the non-agricultural multi-employment type increased, with the overall change trend remaining consistent with that of the total sample. For farmers in the medium-terrain area, the main livelihood type was agricultural multi-employment type both before and after CLC, but the proportion decreased from 54.7% to 42.7%. Most traditional agricultural type farmers transformed into modern agricultural type, and agricultural multi-employment type farmers transformed into non-agricultural multi-employment type. For farmers in the high-terrain area, the main livelihood type was agricultural multi-employment type, but the proportion decreased from 57.4% to 45.5%. After CLC, the traditional agricultural type significantly decreased, while the non-agricultural multi-employment type significantly increased.
4.3.2. Analysis of Influencing Factors of Farmers’ Livelihood Strategies
This study used Stata 17.0 software to conduct an ordered logistic regression analysis of farmers’ livelihood data before (Model 1) and after (Model 2) CLC under different terrain gradients (Table 7). Model 1 reveals that the livelihood transitions of farmers in low-terrain areas are significantly influenced by labor skill levels, annual household income, borrowing channels, and friendliness with other farmers before CLC. In contrast, the livelihood transitions of farmers in medium-terrain areas are primarily affected by cultivated land area, annual household income, annual agricultural income, income channels, and land dispute situations. For farmers in high-terrain areas, significant influences come from irrigation water adequacy, annual household income, annual agricultural income, and income channels. Notably, cultivated land area, irrigation water adequacy, annual agricultural income, and friendliness with other farmers have a significant negative impact. This indicates that the more arable land and irrigation water farmers have, the more motivated they are to engage in agricultural production. Furthermore, better neighborly relations increase the likelihood of farmers choosing to stay and develop in their hometown rather than seeking employment or business opportunities elsewhere. Labor skill levels, annual household income, income channels, and land disputes have a significant positive impact on the diversification and non-farm activities of farmers’ livelihoods, suggesting that the more skills farmers possess, the greater the variety of livelihood options available to them. Additionally, with more income channels and higher annual household income, farmers are better equipped to engage in diversified production activities.
Table 7.
Results of ordered logistic regression model under different terrain gradients (Source: Study findings).
According to the results of Model 2, the direct impact of CLC on the livelihood transition of farmers in low-terrain areas is significant, while its effects in medium-terrain and high-terrain areas are not significant. From an indirect perspective, CLC has strengthened the significance of the negative impact of cultivated land area across all three regions, indicating the critical role that cultivated land plays in livelihood activities. If the cultivated land area increases and its quality improves, farmers can engage in larger-scale modern production. Conversely, a reduction in cultivated land area may drive farmers to seek non-farm livelihood activities such as business or labor outside. Furthermore, CLC has significantly enhanced the positive impact on the labor skill levels in low-terrain areas, indicating a substantial improvement in the skills of farmers, thereby facilitating greater livelihood diversification. It has also increased the positive impact of the number of household laborers in high-terrain areas. This is primarily due to the relocation of farmers and a reduction in agricultural land, allowing families with more labor to engage in local or external labor activities in addition to agricultural production. Additionally, CLC has reduced the positive impact of annual household income on livelihood transitions in low-terrain areas while increasing the negative impact of income channels, whereas its effects in medium-terrain areas and high-terrain areas remain relatively stable.
5. Discussion
Land is the most important production factor and source of livelihood for farmers, especially in the rural areas of the southwestern mountainous regions where alternative livelihood options are scarce [7]. CLC is expected to significantly impact farmers’ livelihoods. However, existing research has rarely considered the differential impacts of CLC across various terrain gradients. This study addresses this gap by analyzing the effects of CLC on farmers’ livelihoods from a theoretical perspective, taking into account the complex topography of the Anning River basin. By calculating the Livelihood Capital Index based on household livelihood data, we examine the changes in livelihood capital before and after CLC. The results indicate that CLC has both positive and negative impacts on farmers’ natural capital, while positively affecting human, material, financial, and social capital. This aligns with the findings of Zhang [7] and Xie [35]. However, the predecessors focused on the effects of agricultural land consolidation, whereas this study provides a comprehensive analysis of all elements involved in CLC. Across different terrain gradients, the changes in farmers’ livelihood capital and the net effects of CLC exhibit a trend of medium-terrain areas > low-terrain areas > high-terrain areas, which is consistent with Zhang’s conclusions regarding the income effects of agricultural land consolidation based on landform types [30]. This trend can primarily be attributed to the substantial landholdings of farmers in the medium-terrain areas, which, after participating in CLC, have led to large-scale cultivation, improved land use efficiency, and increased agricultural output, resulting in significant gains in natural and financial capital for these farmers.
In terms of farmers’ livelihood strategy, CLC has led to a general shift towards diversification and non-farm activities, aligning with the conclusions of Wu [46] that the construction of high-standard farmland promotes the transition of traditional smallholder livelihood strategies towards diversification and non-farm activities. However, changes in livelihood strategies across different terrain gradients exhibit variability. In the low-terrain areas, farmers are transitioning from traditional agricultural types and agricultural multi-employment types to non-agricultural multi-employment types and non-agricultural types. This shift is primarily due to the fact that many farmers in the low-terrain area have transferred their land, allowing them to engage in diverse livelihood activities, consistent with the findings of Han [47]. In medium-terrain areas, farmers are transitioning from traditional agricultural types to modern agricultural types, as CLC has resulted in enabling farmers to participate in village cooperatives for large-scale modern agricultural production. In high-terrain areas, the shift is mainly from traditional agricultural and agricultural multi-employment types to non-agricultural multi-employment types. This is because farmers in these areas have seen their farmland become state-owned after relocating, with family labor primarily engaged in local and external wage work and business activities, resulting in minimal agricultural production. Using the ordered logistic regression model, this study assesses the direct and indirect impacts of CLC on farmers’ livelihood strategies and identifies the livelihood factors influencing these strategies. This provides a scientific basis for the selection of livelihood strategies and promotes the sustainable development of farmers in mountainous areas.
However, this study has some limitations. First, CLC is a complex project that includes agricultural land consolidation, construction land consolidation, and rural ecological protection and restoration. The analysis of the impact of CLC on farmers’ livelihood capital and strategies is somewhat general and lacks in-depth research on the effects of different land consolidation projects on farmers’ livelihood, which is insufficient to establish an impact mechanism. Future research should explore the logical relationships among various CLC projects impacting on farmers’ livelihood capital and transitions, as well as conduct empirical studies to investigate the mechanisms. Second, the sample villages selected for the survey are limited in number and coverage. Although these villages were selected based on multiple criteria to ensure typicality and have passed reliability and validity tests, the results may not sufficiently reflect the overall impact of CLC across the entire Anning River basin. Future research should expand to include other project areas within the basin, broaden the scope of the investigation, and involve multiple rounds of long-term data collection from the same sample of households. This would help establish a sustainable monitoring mechanism for changes in household livelihoods, with the aim of guiding sustainable livelihood development for farmers.
6. Conclusions
In the context of developing the “Second Granary of Tianfu” in the Anning River basin, this study considers the complexity of the region’s topography by classifying it into terrain gradient zones based on elevation, slope, and terrain position index. It investigates typical villages across different terrain gradients to obtain multidimensional livelihood data and analyzes the impact of CLC on farmers’ livelihoods and the effects of terrain gradient, leading to the following conclusions: (1) CLC can effectively enhance farmers’ livelihood capital, demonstrating a trend of medium-terrain area > low-terrain area > high-terrain area. However, it has negative effects on the natural capital of certain farmers, primarily due to an increased willingness of some farmers to transfer land and the reclamation of land by the state from relocated households. (2) After CLC, the trend of farmers’ livelihood type transformation generally shifted from traditional agricultural types to modern agricultural types and agricultural multi-employment types, and from agricultural multi-employment types to non-agricultural multi-employment types. This indicates that CLC is driving an overall transition of farmers’ livelihood types towards diversification and non-agricultural activities. (3) CLC has a significant direct impact on the livelihood transition of farmers in low-terrain areas, while its effects in medium-terrain areas and high-terrain areas are not significant. From an indirect perspective, CLC significantly influences farmers’ livelihood transitions by affecting cultivated land area, irrigation water adequacy, labor skill levels, the value of production materials, annual household income, annual agricultural income, income channels, borrowing channels, and land disputes.
The study on the impact of CLC on farmers’ livelihoods in the Anning River basin has identified issues related to terrain constraints, resource limitations, natural capital loss, and variations in land quality. In response, differentiated policy measures for CLC have been proposed for high-, medium-, and low-terrain areas as follows.
For villages in high-terrain areas that are ecologically fragile and unsuitable for long-term habitation, priority should be given to disaster risk relocation, ecological relocation, and off-site relocation, along with rural construction land consolidation and community service center establishment. For villages suitable for development, soil improvement projects and ecological compensation for reforestation should be implemented to maximize ecological benefits.
In medium-terrain areas, where CLC significantly enhances farmers’ livelihood capital, further implementation is needed, including land leveling, irrigation systems, and field road construction to improve agricultural land quality and infrastructure. Local resources, such as ecological livestock farming and high-value cash crops, should be utilized to expand agricultural product distribution channels.
In low-terrain areas, where some villages have already established large-scale crop cultivation and cooperative organizations, those not yet implementing CLC should learn from these examples and enhance land use efficiency. This land can be transferred to agricultural companies or cooperatives for modern farming. Additionally, ecological protection of river systems should focus on vegetation measures for riverbank greening to reduce runoff and prevent soil and water loss.
Author Contributions
Conceptualization, R.W. and H.Y.; methodology, R.W. and B.Y.; software, R.W.; validation, D.Z. and Y.H.; formal analysis, R.W.; investigation, R.W., H.Y., D.Z. and Y.H.; resources, H.Y. and B.Y.; data curation, R.W. and H.Y.; writing—original draft preparation, R.W.; writing—review and editing, R.W. and H.Y.; visualization, R.W. and D.Z.; supervision, B.Y.; project administration, H.Y. and B.Y.; funding acquisition, H.Y. All authors have read and agreed to the published version of the manuscript.
Funding
This research was funded by the National Natural Sciences Foundation of China (Grant Number: 41671529) and Research Projects of Department of Natural Resources of Sichuan Province (New Think Tank Research Projects) (Grant Number: KJ-2024-021).
Data Availability Statement
The data presented in this study involved the personal and family information of farmers. Although the data was collected anonymously, the research subjects were guaranteed to keep the data confidential and not to be shared.
Conflicts of Interest
The authors declare no conflicts of interest.
References
- Long, H.; Tu, S. Land use transition and rural vitalization. China Land Sci. 2018, 32, 1–6. [Google Scholar]
- Tunali, S.P.; Dagdelen, N. Comparison of different models for land consolidation projects: Aydin Yenipazar Plain. Land Use Policy 2023, 127, 106590. [Google Scholar] [CrossRef]
- Gorgan, M.; Bavorova, M. How to increase landowners’ participation in land consolidation: Evidence from North Macedonia. Land Use Policy 2022, 123, 106424. [Google Scholar] [CrossRef]
- Aslan, S.T.A. Evaluation of land consolidation projects with parcel shape and dispersion. Land Use Policy 2021, 105, 105401. [Google Scholar]
- Stanczuk-Galwiaczek, M. Analysis of changes in spatial structure of rural areas in Poland resulting from land consolidation—A case study. GIS Odyssey 2016, 2016, 235–245. [Google Scholar]
- Lazic, J.; Marinkovic, G.; Borisov, M.; Trifkovic, M.; Grgic, I. Effects and profitability of land consolidation projects: Case study—The Republic of Serbia. Teh. Vjesn.-Tech. Gaz. 2020, 27, 1330–1336. [Google Scholar]
- Zhang, S.; Zheng, D.; Jiang, J. Integrated features and benefits of livelihood capital of farmers after land transfer based on livelihood transformation. Trans. Chin. Soc. Agric. Eng. 2018, 34, 274–281. [Google Scholar]
- Luo, W.; Timothy, D.J. An assessment of farmers’ satisfaction with land consolidation performance in China. Land Use Policy 2017, 61, 501–510. [Google Scholar] [CrossRef]
- Jin, X.; Luo, X.; Zhou, Y. Basic logic, key issues and main relations of comprehensive land consolidation. China Land Sci. 2022, 36, 1–12. [Google Scholar]
- Wu, S.; Ye, Y.; Lin, Y. Experience and enlightenment of multifunctional land consolidation in Germany, Japan and Taiwan in China. J. Huazhong Agric. Univ. (Soc. Sci. Ed.) 2019, 3, 140–148, 165–166. [Google Scholar]
- Lin, Y.; Yang, R.; Ge, Y. Internal logic and transmission mechanism of rural comprehensive land consolidation for rural revitalization. Planners 2023, 39, 12–18. [Google Scholar]
- Long, H.; Zhang, Y.; Tu, S. Land consolidation and rural vitalization. Acta Geogr. Sin. 2018, 73, 1837–1849. [Google Scholar]
- Sun, B.; Liu, Q.; Wang, C.; Wen, Y. Review on household livelihood in China. For. Econ. 2016, 38, 49–53. [Google Scholar]
- Deng, Y.; Guo, Y.; Zhu, J. Land transfer, increase of farmers’ income and income inequality. Rural Econ. 2021, 06, 33–40. [Google Scholar]
- Cui, M.; Xia, X. Research on the influence of land consolidation on farmers’ income gap. J. Agrotech. Econ. 2024, 8, 20–34. [Google Scholar]
- Chambers, R.; Gordon, C. Sustainable Rural Livelihoods: Practical Concepts for the 21st Century; Institute of Development Studies: Brighton, UK, 1992. [Google Scholar]
- Department for International Development (DFID (UK)). Sustainable Livelihoods Guidance Sheets; Department for International Development: London, UK, 1999.
- He, R.; Liu, S.; Chen, G.; Xie, F.; Yang, X.; Liang, L. Research progress and tendency of sustainable livelihoods for peasant household in china. Prog. Geogr. 2013, 32, 657–670. [Google Scholar]
- Ellis, F.; Bahiigwa, G. Livelihoods and rural poverty reduction in Uganda. World Dev. 2003, 31, 997–1013. [Google Scholar] [CrossRef]
- Guo, A.; Wei, Y.; Zhong, F.; Wang, P. How do climate change perception and value cognition affect farmers’ sustainable livelihood capacity? An analysis based on an improved DFID sustainable livelihood framework. Sustain. Prod. Consum. 2022, 33, 636–650. [Google Scholar] [CrossRef]
- Zeweld, W.; Van Huylenbroeck, G.; Tesfay, G.; Azadi, H.; Speelman, S. Sustainable agricultural practices, environmental risk mitigation and livelihood improvements: Empirical evidence from Northern Ethiopia. Land Use Policy 2020, 95, 103799. [Google Scholar] [CrossRef]
- Biggs, E.M.; Bruce, E.; Boruff, B.; Duncan, J.M.A.; Horsley, J.; Pauli, N.; McNeill, K.; Neef, A.; Van Ogtrop, F.; Curnow, J.; et al. Sustainable development and the water-energy-food nexus: A perspective on livelihoods. Environ. Sci. Policy 2015, 54, 389–397. [Google Scholar] [CrossRef]
- Wang, W.; Lan, Y.; Wang, X. Impact of livelihood capital endowment on poverty alleviation of households under rural land consolidation. Land Use Policy 2021, 109, 105608. [Google Scholar] [CrossRef]
- Natarajan, N.; Newsham, A.; Rigg, J.; Suhardiman, D. A sustainable livelihoods framework for the 21st century. World Dev. 2022, 155, 105898. [Google Scholar] [CrossRef]
- Habyarimana, J.B.; Nkunzimana, T. Policy reforms and rural livelihoods sustainability: Challenges and opportunities empirical evidence from the adoption of the land use consolidation (LUC) policy in Rwanda. Afr. Dev. Rev. 2017, 29, 96–108. [Google Scholar] [CrossRef]
- Zhang, D.; Wang, W.; Zhou, W.; Zhang, X.; Zuo, J. The effect on poverty alleviation and income increase of rural land consolidation in different models: A China study. Land Use Policy 2020, 99, 104989. [Google Scholar] [CrossRef]
- del Giorgio, O.; Robinson, B.E.; de Waroux, Y.l.P. Impacts of agricultural commodity frontier expansion on smallholder livelihoods: An assessment through the lens of access to land and resources in the Argentine Chaco. J. Rural Stud. 2022, 93, 67–80. [Google Scholar] [CrossRef]
- Studies, L.T. The Design of Land Consolidation Pilot Projects in Central and Eastern Europe; FAO Land Tenure Studies: Roma, Italy, 2003; pp. 1–55. [Google Scholar]
- Li, H.; Jin, X.; McCormick, B.P.; Tittonell, P.; Liu, J.; Han, B.; Sun, R.; Zhou, Y. Analysis of the contribution of land consolidation to sustainable poverty alleviation under various natural conditions. Land Use Policy 2023, 133, 106871. [Google Scholar] [CrossRef]
- Zhang, C.; Yang, G. How can rural land consolidation increase farmers’ income: Heterogeneity analysis based on consolidation modes and geomorphic types. J. Nat. Resour. 2021, 36, 3114–3130. [Google Scholar] [CrossRef]
- Yang, L.; He-Yang, Y.; Tang, H.; Chen, C.; He, K. Terrain gradient effect and functional zoning of land use change in the Red River Basin of Yunnan Province. J. Yunnan Univ. Nat. Sci. 2024, 46, 276–287. [Google Scholar]
- Cheng, J.; Wang, P.; Chen, H.; Han, Y. Spatiotemporal evolution of habitat quality in the Weihe river basin and its topographic gradient effects and influencing factors. Arid. Land Geogr. 2023, 46, 481–491. [Google Scholar]
- Yuan, X.; An, J.; Yang, Y.; Ma, C.; Wang, X. Potential and development paths of rural revitalization in Qinling-Daba mountains, China under different terrain gradients. J. Earth Sci. Environ. 2024, 46, 1–13. [Google Scholar]
- Liu, Y. Scientifically promoting the strategy of reclamation and readjustment of rural land in China. China Land Sci. 2011, 24, 3–8. [Google Scholar]
- Xie, J.; Yang, G.; Xu, Y.; Wang, G. Influence mechanism and empirical analysis of rural land consolidation on the income and welfare of rural households. J. Agrotech. Econ. 2020, 12, 38–54. [Google Scholar]
- Wu, J.; Wang, X.; Xiong, G. Impacts of farmland consolidation on farmers’ livelihood strategies based on sustainable livelihoods framework. Bull. Soil Water Conserv. 2020, 40, 269–284. [Google Scholar]
- Su, F.; Xu, Z.; Shang, H. An overview of sustainable livelihoods approach. Adv. Earth Sci. 2009, 24, 61–69. [Google Scholar]
- Liu, C.; Zhao, W. The influence of rural land consolidation on households’ livelihood strategies based on PSM-Did method. J. Nat. Resour. 2018, 33, 1613–1626. [Google Scholar]
- Xie, J.; Yang, G.; Xu, Y. The impact of different Rural Land Consolidation modes on rural households’ livelihood strategies: Examples from some counties and cities from the Jiangshan Plain and mountainous areas in Hubei Province. Chin. Rural. Econ. 2018, 11, 96–111. [Google Scholar]
- Xu, Y. Impacts of Rural Land Consolidation on Farmers’ Livelihood: A Case Study of Tianmen, Qianjiang and Enshi in Hubei Province. Master’s Thesis, Huazhong Agricultural University, Wuhan, China, 2018. [Google Scholar]
- Chen, L.; Wang, C. Characteristics and driving factors of non-grain production of cultivated land in Anning river basin of Sichuan province. Chin. J. Soil Sci. 2024, 55, 331–340. [Google Scholar]
- An, B.; Xiao, W.; Cui, X. Topographic gradient effect of land use pattern in Hanjiang river ecological economic belt. Res. Soil Water Conserv. 2024, 31, 288–297, 307. [Google Scholar]
- Ding, J.; Zhu, Y.; Zhang, M.; Da, R.; Wu, J.; Yu, S. Comprehensive benefit evaluation of land consolidation based on perspective of production, living and ecology. Yellow River 2020, 42, 86–91. [Google Scholar]
- Wang, W.; Liu, Z. Differences in farming households’ cognition of ownership adjustment benefits in rural land consolidation and causes. Resour. Sci. 2019, 41, 1329–1338. [Google Scholar]
- Li, P.; Liao, Y.; Zhang, Y.; Luo, Y. An analysis of people’s satisfaction degrees and influencing factors in treatment of empty houses in rural areas: A case study of Xiangyin county in Hunan province. J. Yichun Univ. 2022, 44, 38–42. [Google Scholar]
- Wu, S.; Zhu, H.; Lu, X. Impact of high-standard farmland construction on farmers’ livelihood strategies and its benefits. Agric. Econ. Manag. 2024, 06, 104–115. [Google Scholar]
- Han, W.; Zhang, Z. The impact of farmland transfer on diversified livelihood strategies of farmers: An empirical analysis based on the national household survey. Sci. Technol. Manag. Land Resour. 2024, 41, 75–89. [Google Scholar]
Disclaimer/Publisher’s Note: The statements, opinions and data contained in all publications are solely those of the individual author(s) and contributor(s) and not of MDPI and/or the editor(s). MDPI and/or the editor(s) disclaim responsibility for any injury to people or property resulting from any ideas, methods, instructions or products referred to in the content. |
© 2025 by the authors. Licensee MDPI, Basel, Switzerland. This article is an open access article distributed under the terms and conditions of the Creative Commons Attribution (CC BY) license (https://creativecommons.org/licenses/by/4.0/).