In order to study the phenomenon of land degradation and desertification in Morocco, we worked on eight homogeneous zones (
Figure 2) identified and delimited within the framework of the PANLCD 2013 with regard to sensitivity to desertification. In fact, the delimitation of these zones was based on 3 main criteria according to [
9], which are relief, climate, and soil capital.
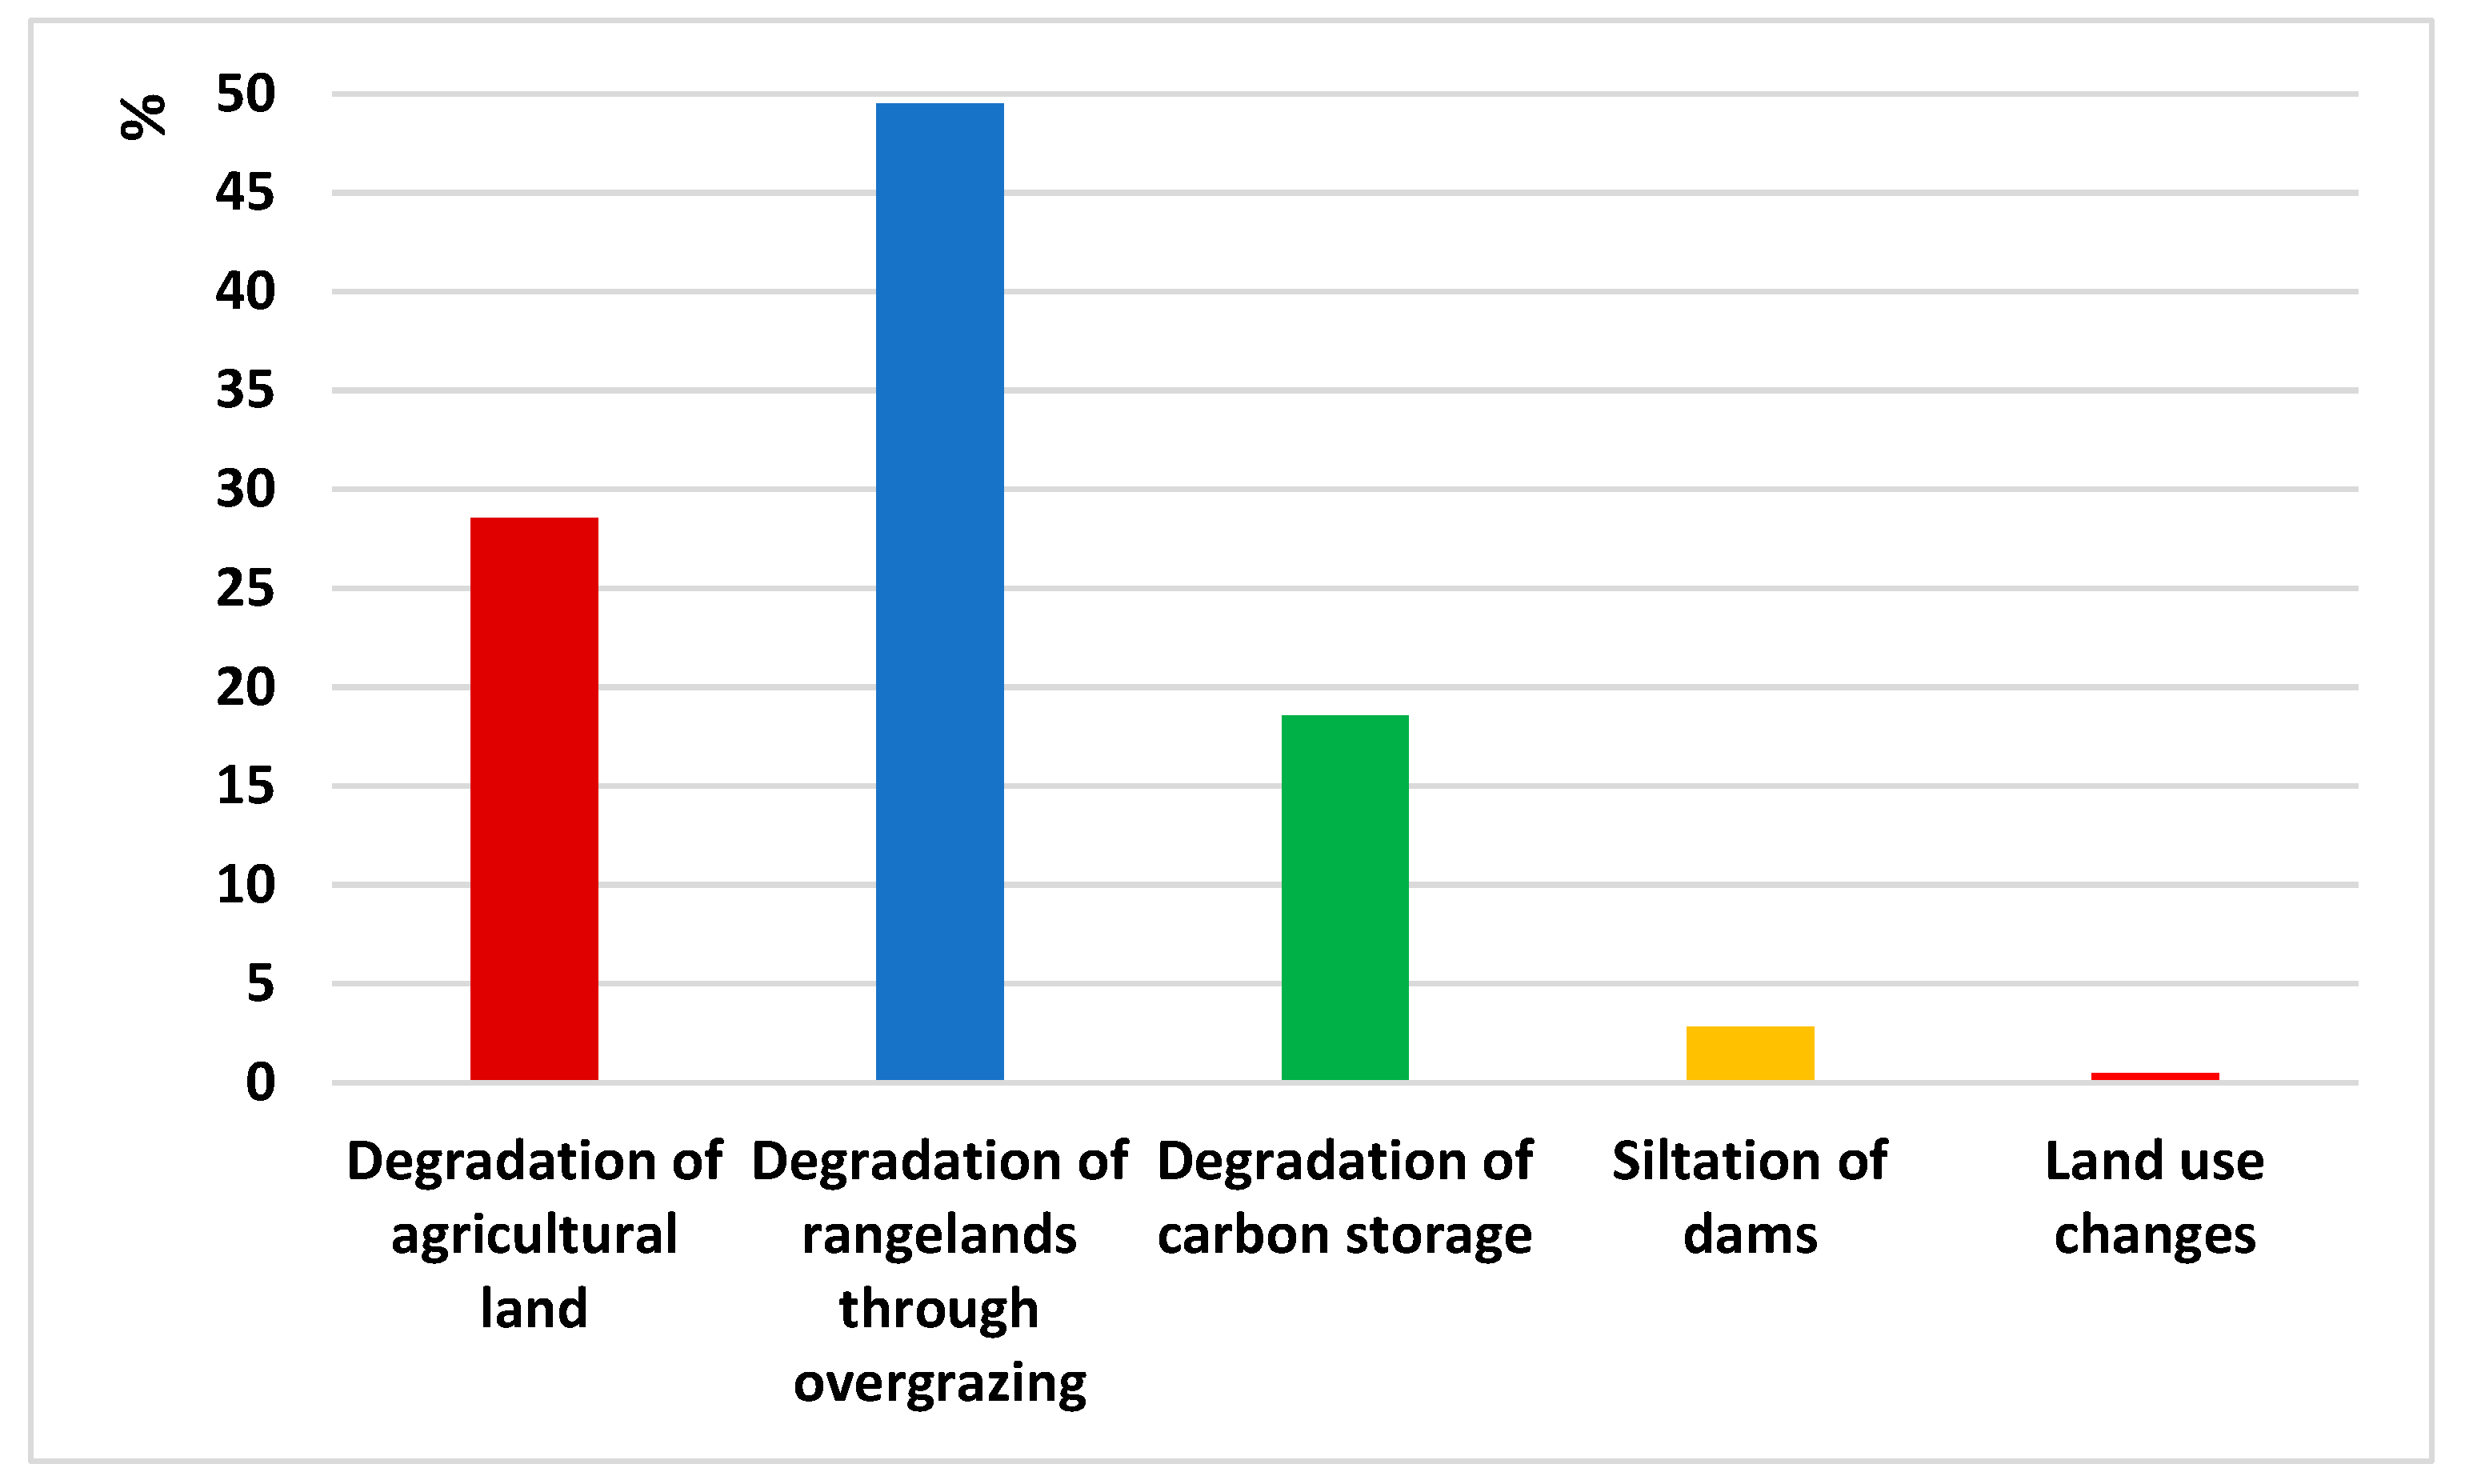
To estimate the total economic cost of desertification in Morocco in 2020, we proceeded to monetize the impacts of desertification. The methodological approach adopted in our study does not cover all the cases likely to occur in reality but focuses on the most frequently encountered and most important cases. We have used a zonal approach to desertification sensitivity to calculate the costs of the following types of degradation: degradation of agricultural land by water and wind erosion and salinization, followed by overgrazing of rangelands, silting of dams, loss of carbon storage, and changes in land use.
To do this, our methodology is divided into 2 main stages: firstly, we quantified the various impacts of degradation based on InVEST, the PANLCD 2013 report, and secondly, we monetized these impacts using the various methods for assessing the economic cost of degradation, the totals of which are the total economic cost of desertification in Morocco in 2020.
3.2.1. Quantifying the Impacts of Desertification
A. Degradation of agricultural land
A-1 erosion
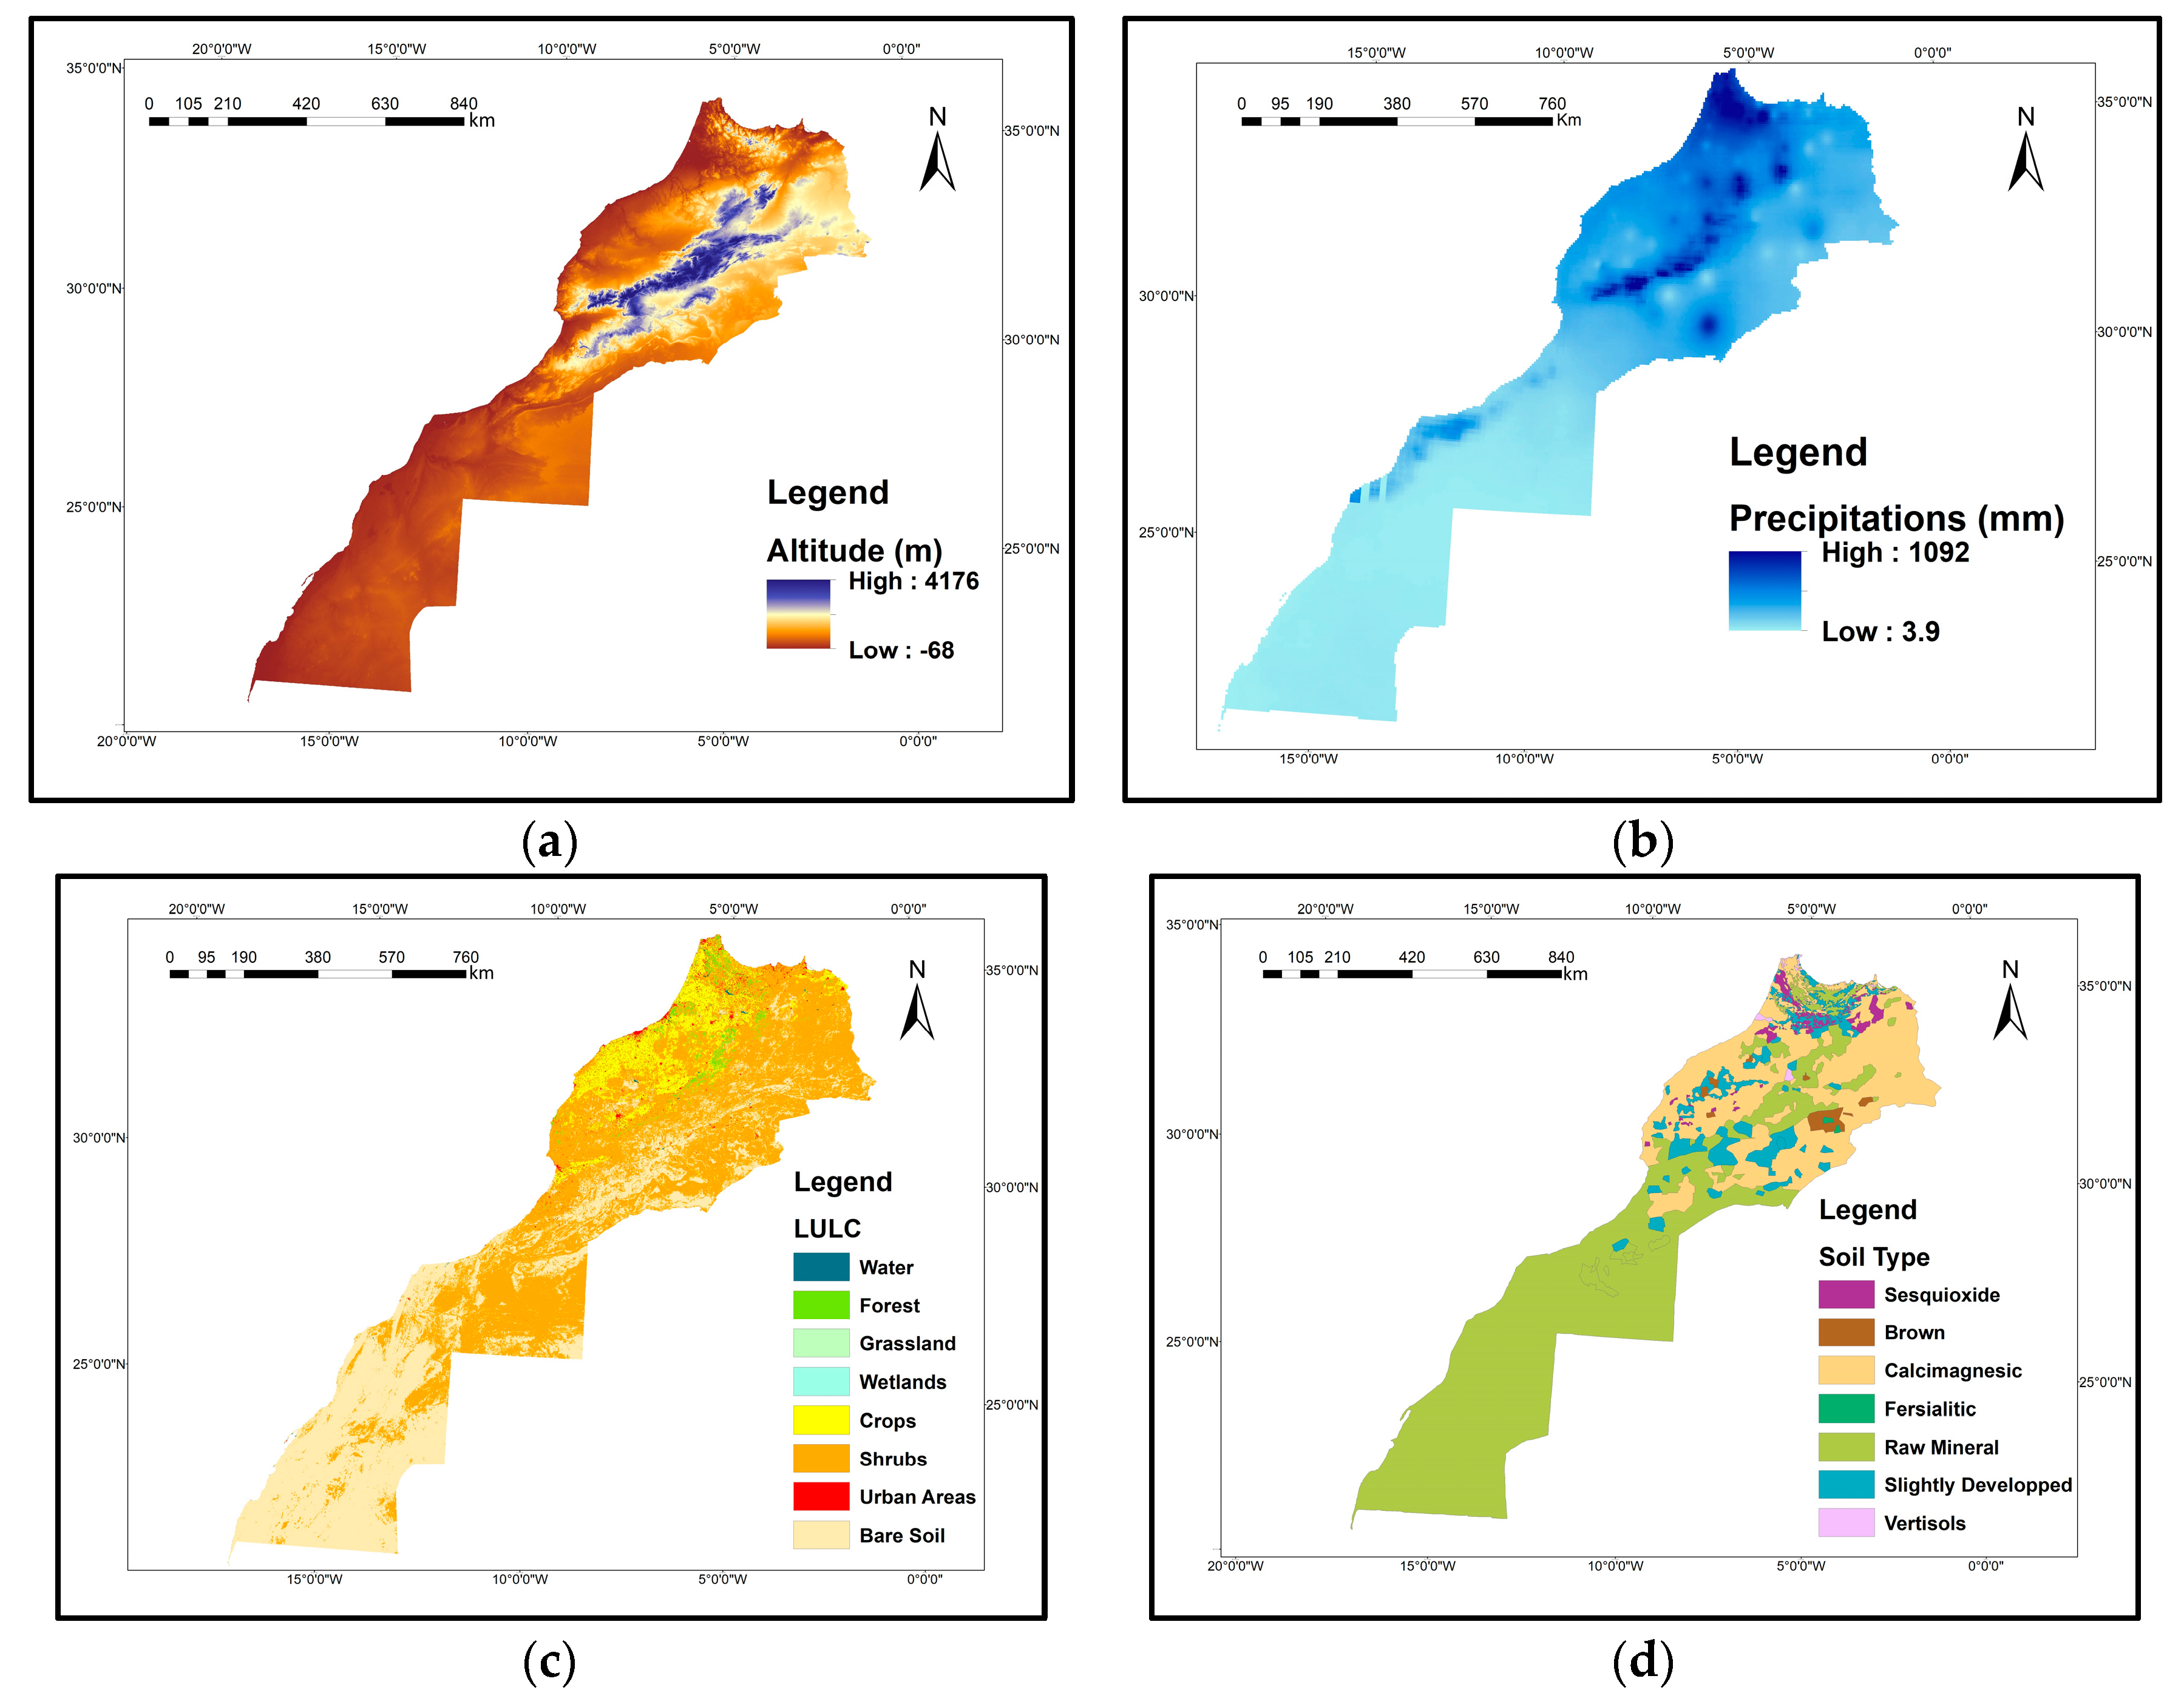
In order to assess the extent of water erosion-related land degradation in Morocco, we used the Sediment Delivery Ratio (SDR) model of the InVEST tool, which uses the universal soil loss equation of [
27]: USLE = R × K × LS × C × P to estimate the potential soil loss for each pixel within the country.
The inputs to the SDR model are as follows:
Digital terrain model raster (
Figure 1a);
Biophysical table (
Table 1) with two factors (—Usle_c: cover management factor—Usle_p: supporting practices factor).
After running the SDR model, we obtained the total amount of potential soil loss due to water erosion in Morocco, then mapped this information by water erosive state, which according to [
30] are grouped into 4 states: very low (<5 t/ha/yr), low (5–10 t/ha/yr), medium (10–20 t/ha/yr), and high (≥20 t/ha/yr). As the high level of degradation was irrecoverable, it was not included in the analysis. This map of erosive water conditions was then superimposed on the land use map to determine the surface area of agricultural land affected by light (very low, low) and moderate erosion.
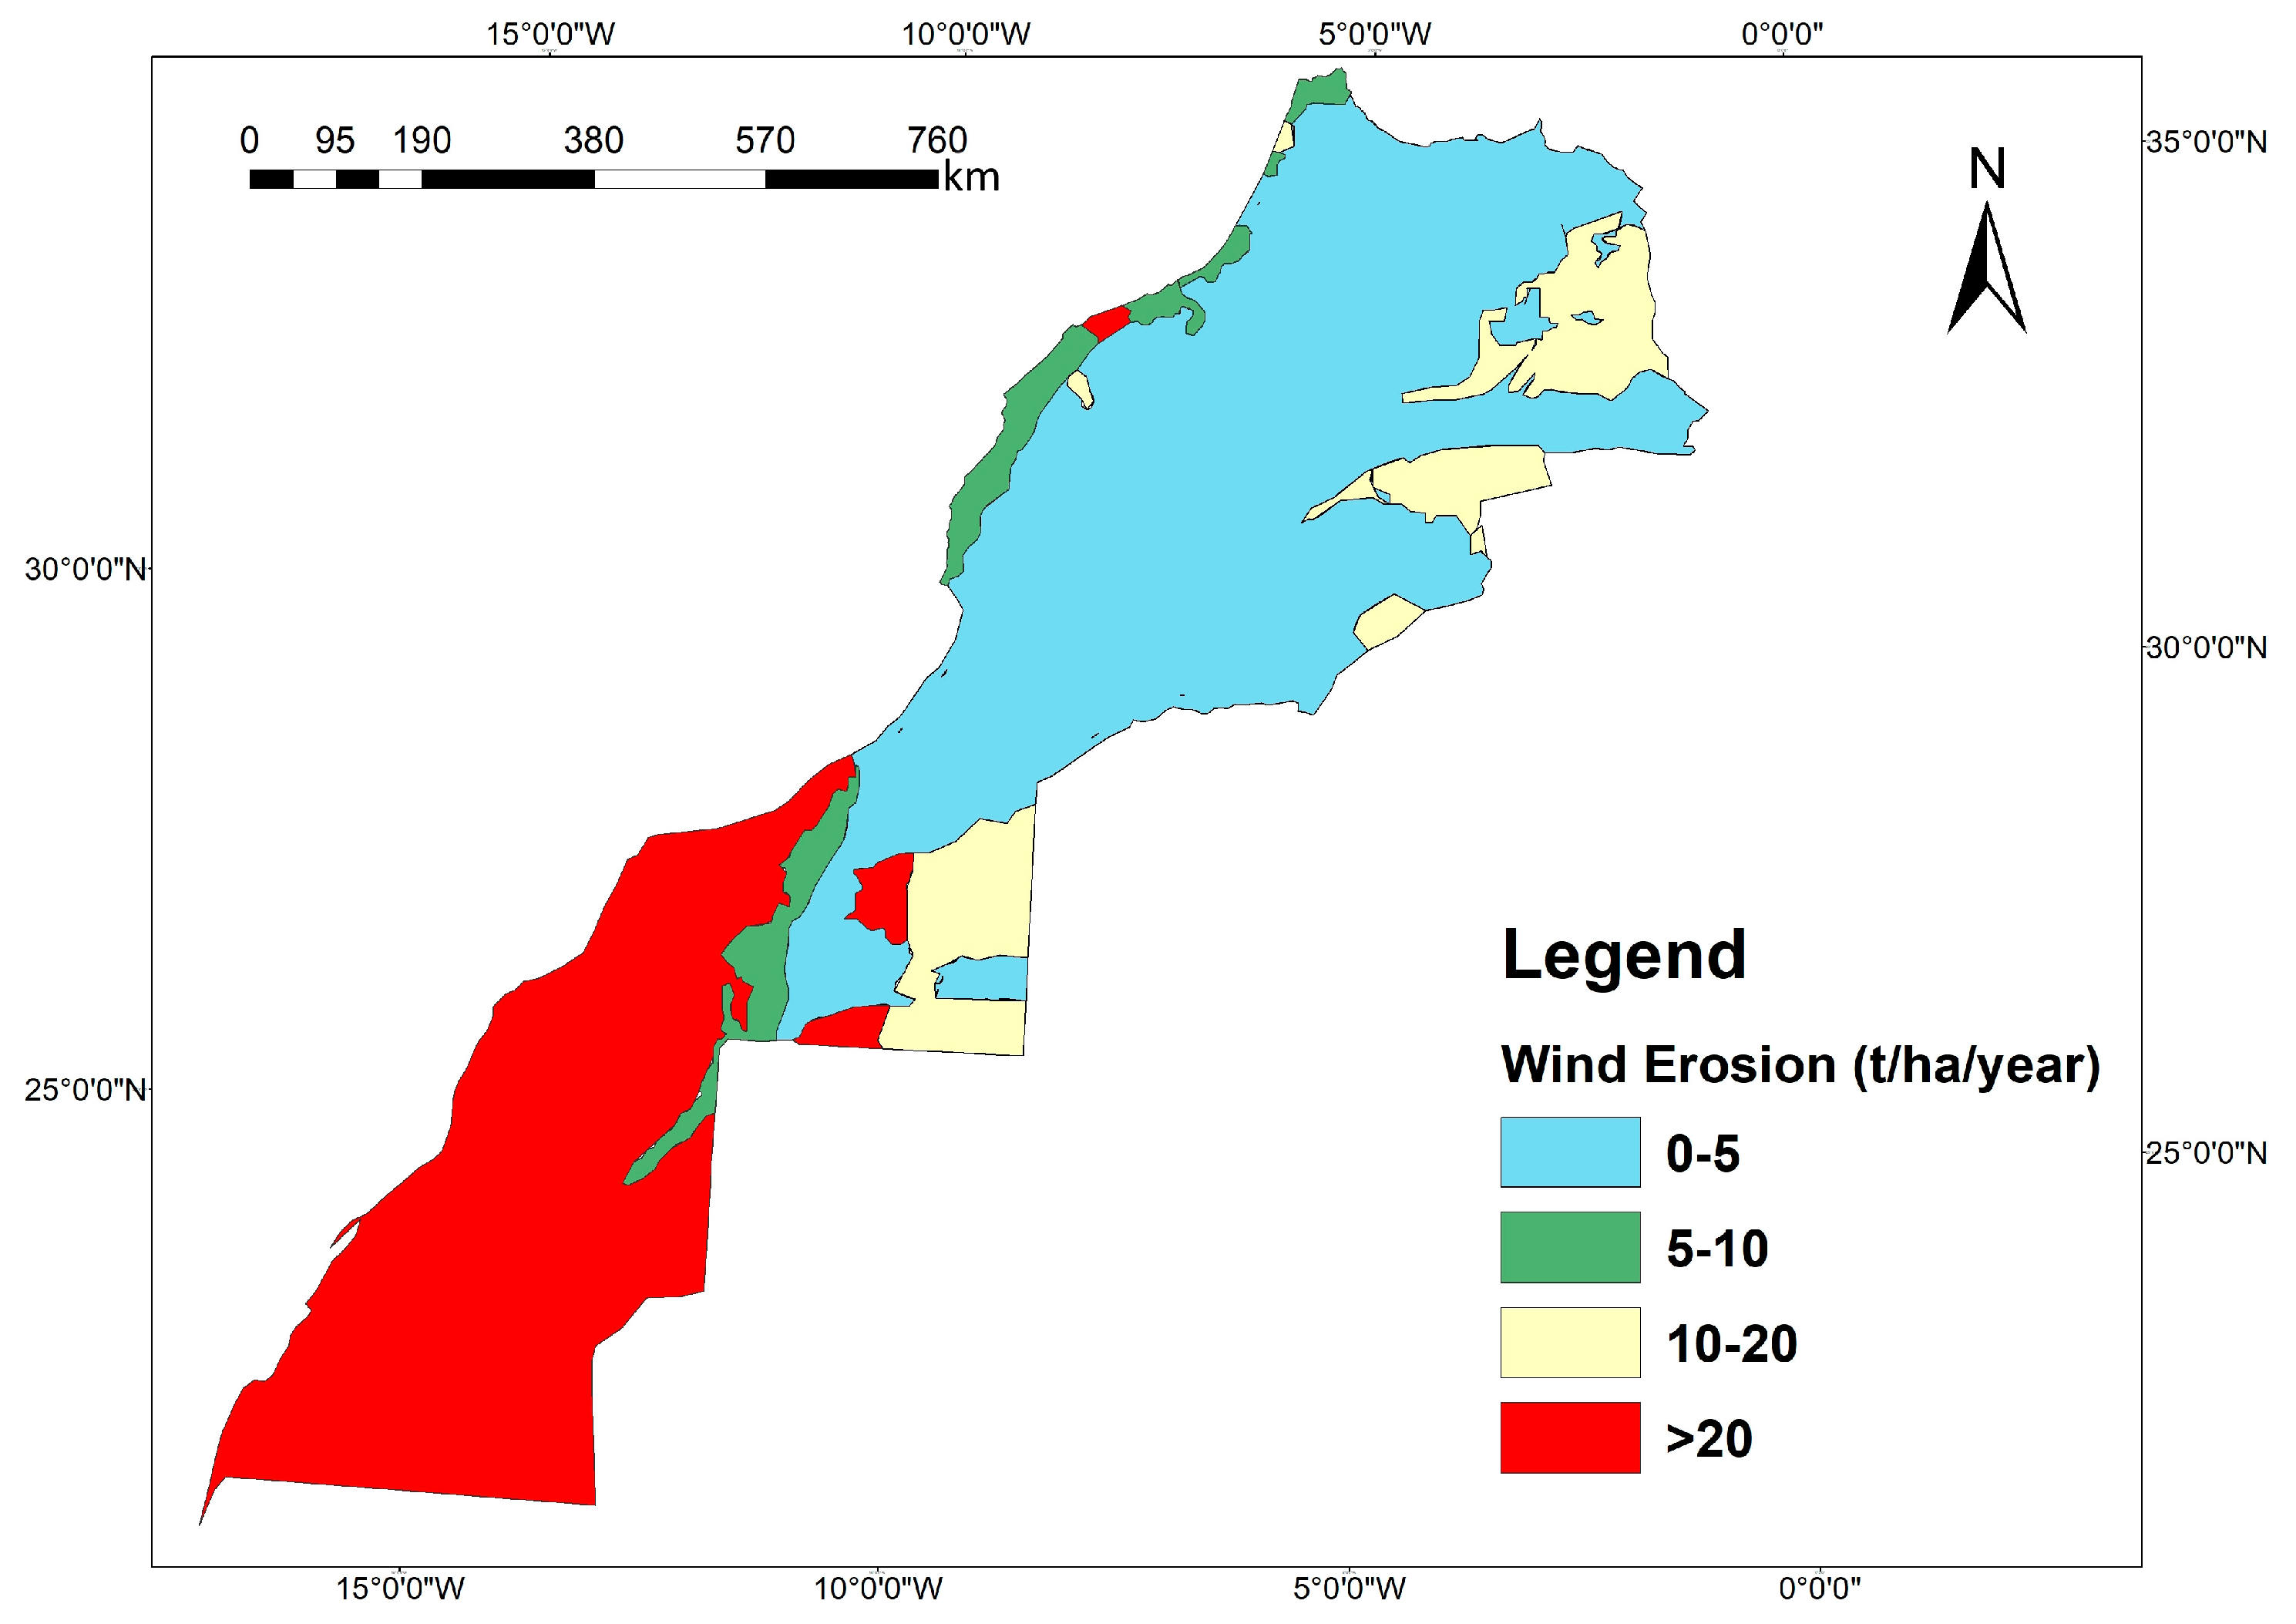
A-2 Wind erosion
To measure the extent of land degradation linked to wind erosion, we used the map (
Figure 3) drawn up as part of PANLCD 2013. Studying this map enabled us to calculate the surface area affected by each erosive condition, which are 35.23 million hectares for very low erosion, and 3.37, 24.17, and 7.24 million hectares of affected surface area for low, medium, and high erosion, respectively.
A-3 Salinization
In order to quantify salinization-related degradation, we used the percentage of soil area degraded by salinization, as calculated within the framework of the PANLCD and listed in
Table 2. We then calculated the area of soil affected by salinization for each homogeneous zone.
B. Overgrazing of rangelands
To quantify the degradation of rangelands, a two-step method was used.
Firstly, we calculated the overall forage production of natural rangelands (forest, alfa grass cover, and productive rangelands) for each homogeneous zone. Based on the areas drawn from the land use map (
Figure 3) and specific data from [
31,
32], the estimate of productive rangelands was set at 12.5 forage units/ha. The needs of livestock satisfied by stabling, representing 40% of their total consumption, were taken into account [
6].
The results were calculated from data provided by the HCP in several reports [
32,
33,
34,
35] in Livestock Units (LU) according to the ratios of [
6], and forage requirements in forage units per LU were set at 1200 FU/ha. Overconsumption was finally calculated by subtracting local production from the estimated offtake for each zone.
C. Siltation of dams
To quantify ex situ land degradation resulting in dam silting, we initially calculated the amount of sediment exported (in tons per year) by each major Moroccan watershed, using the InVEST (SDR) model and the same parameters as those employed to quantify water erosion (in situ), in addition to shapefiles representing Moroccan watersheds (
Figure 4) and then identified the main dams located downstream of each watershed. To quantify dam siltation by homogeneous zone, the watershed map was superimposed on the homogeneous zone map.
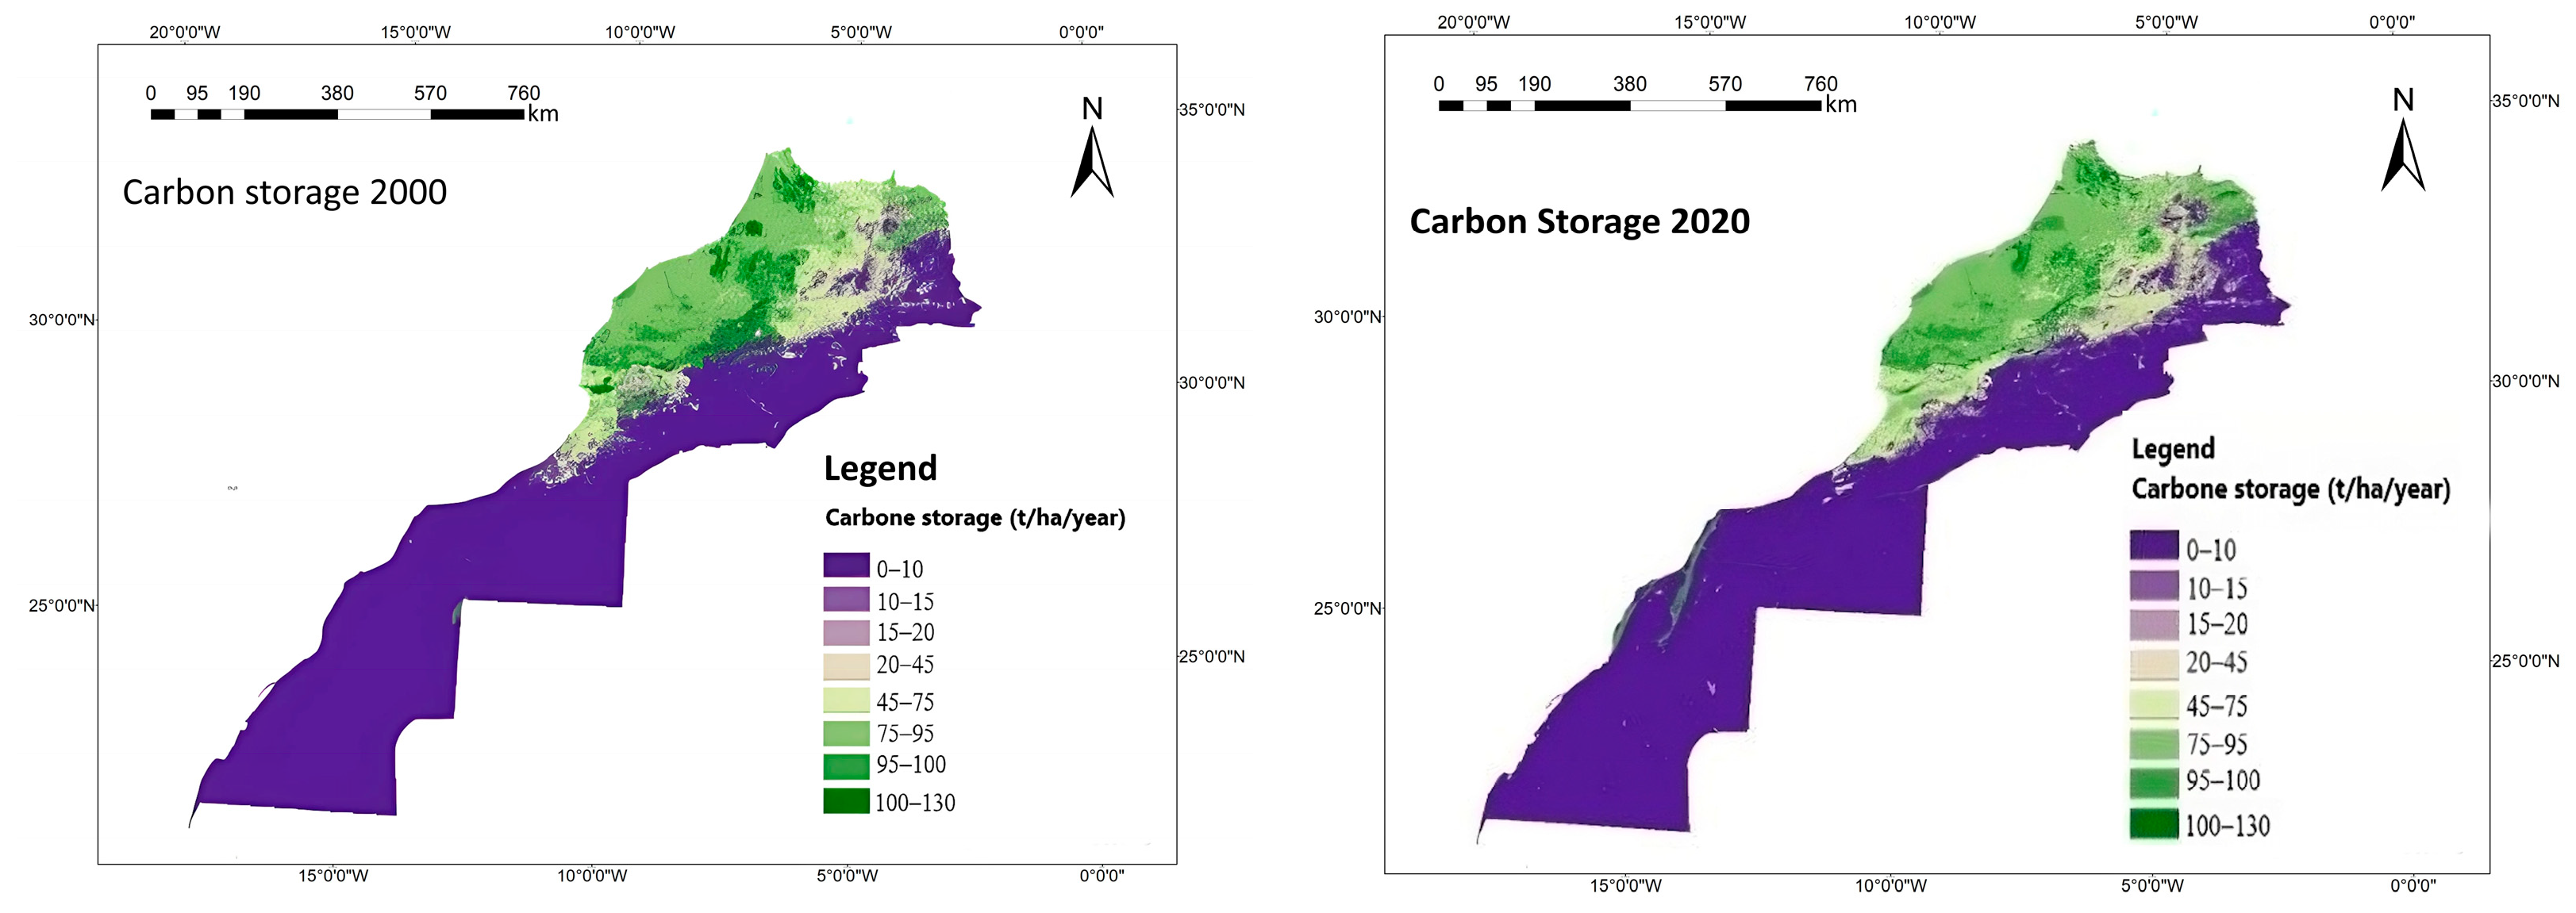
D. Loss of carbon storage
In order to quantify the carbon storage lost annually, we used InVEST’s Carbon Storage and Sequestration model, applied between 2000 and 2020. We then calculated the difference in the quantity of carbon between these two dates to determine the quantity of degraded carbon storage in Morocco, and finally to identify its annual loss in Morocco. To do this, we need two inputs: the land cover rasters for the years 2000 and 2020 (See
Supplementary Materials Figures S3 and S4), which will be drawn up on the basis of the CAS EARTH [
37] product at 30m resolution, using pixel-based image classification and object-based image classification, and offering 10 classes, 8 of which are suitable for Morocco, namely crop, forest, grassland, shrub vegetation, wetland, water body, urban area, and bare soil. We also use a biophysical table (
Table 3) comprising above-ground biomass carbon density, below-ground biomass, soil carbon, and dead matter carbon.
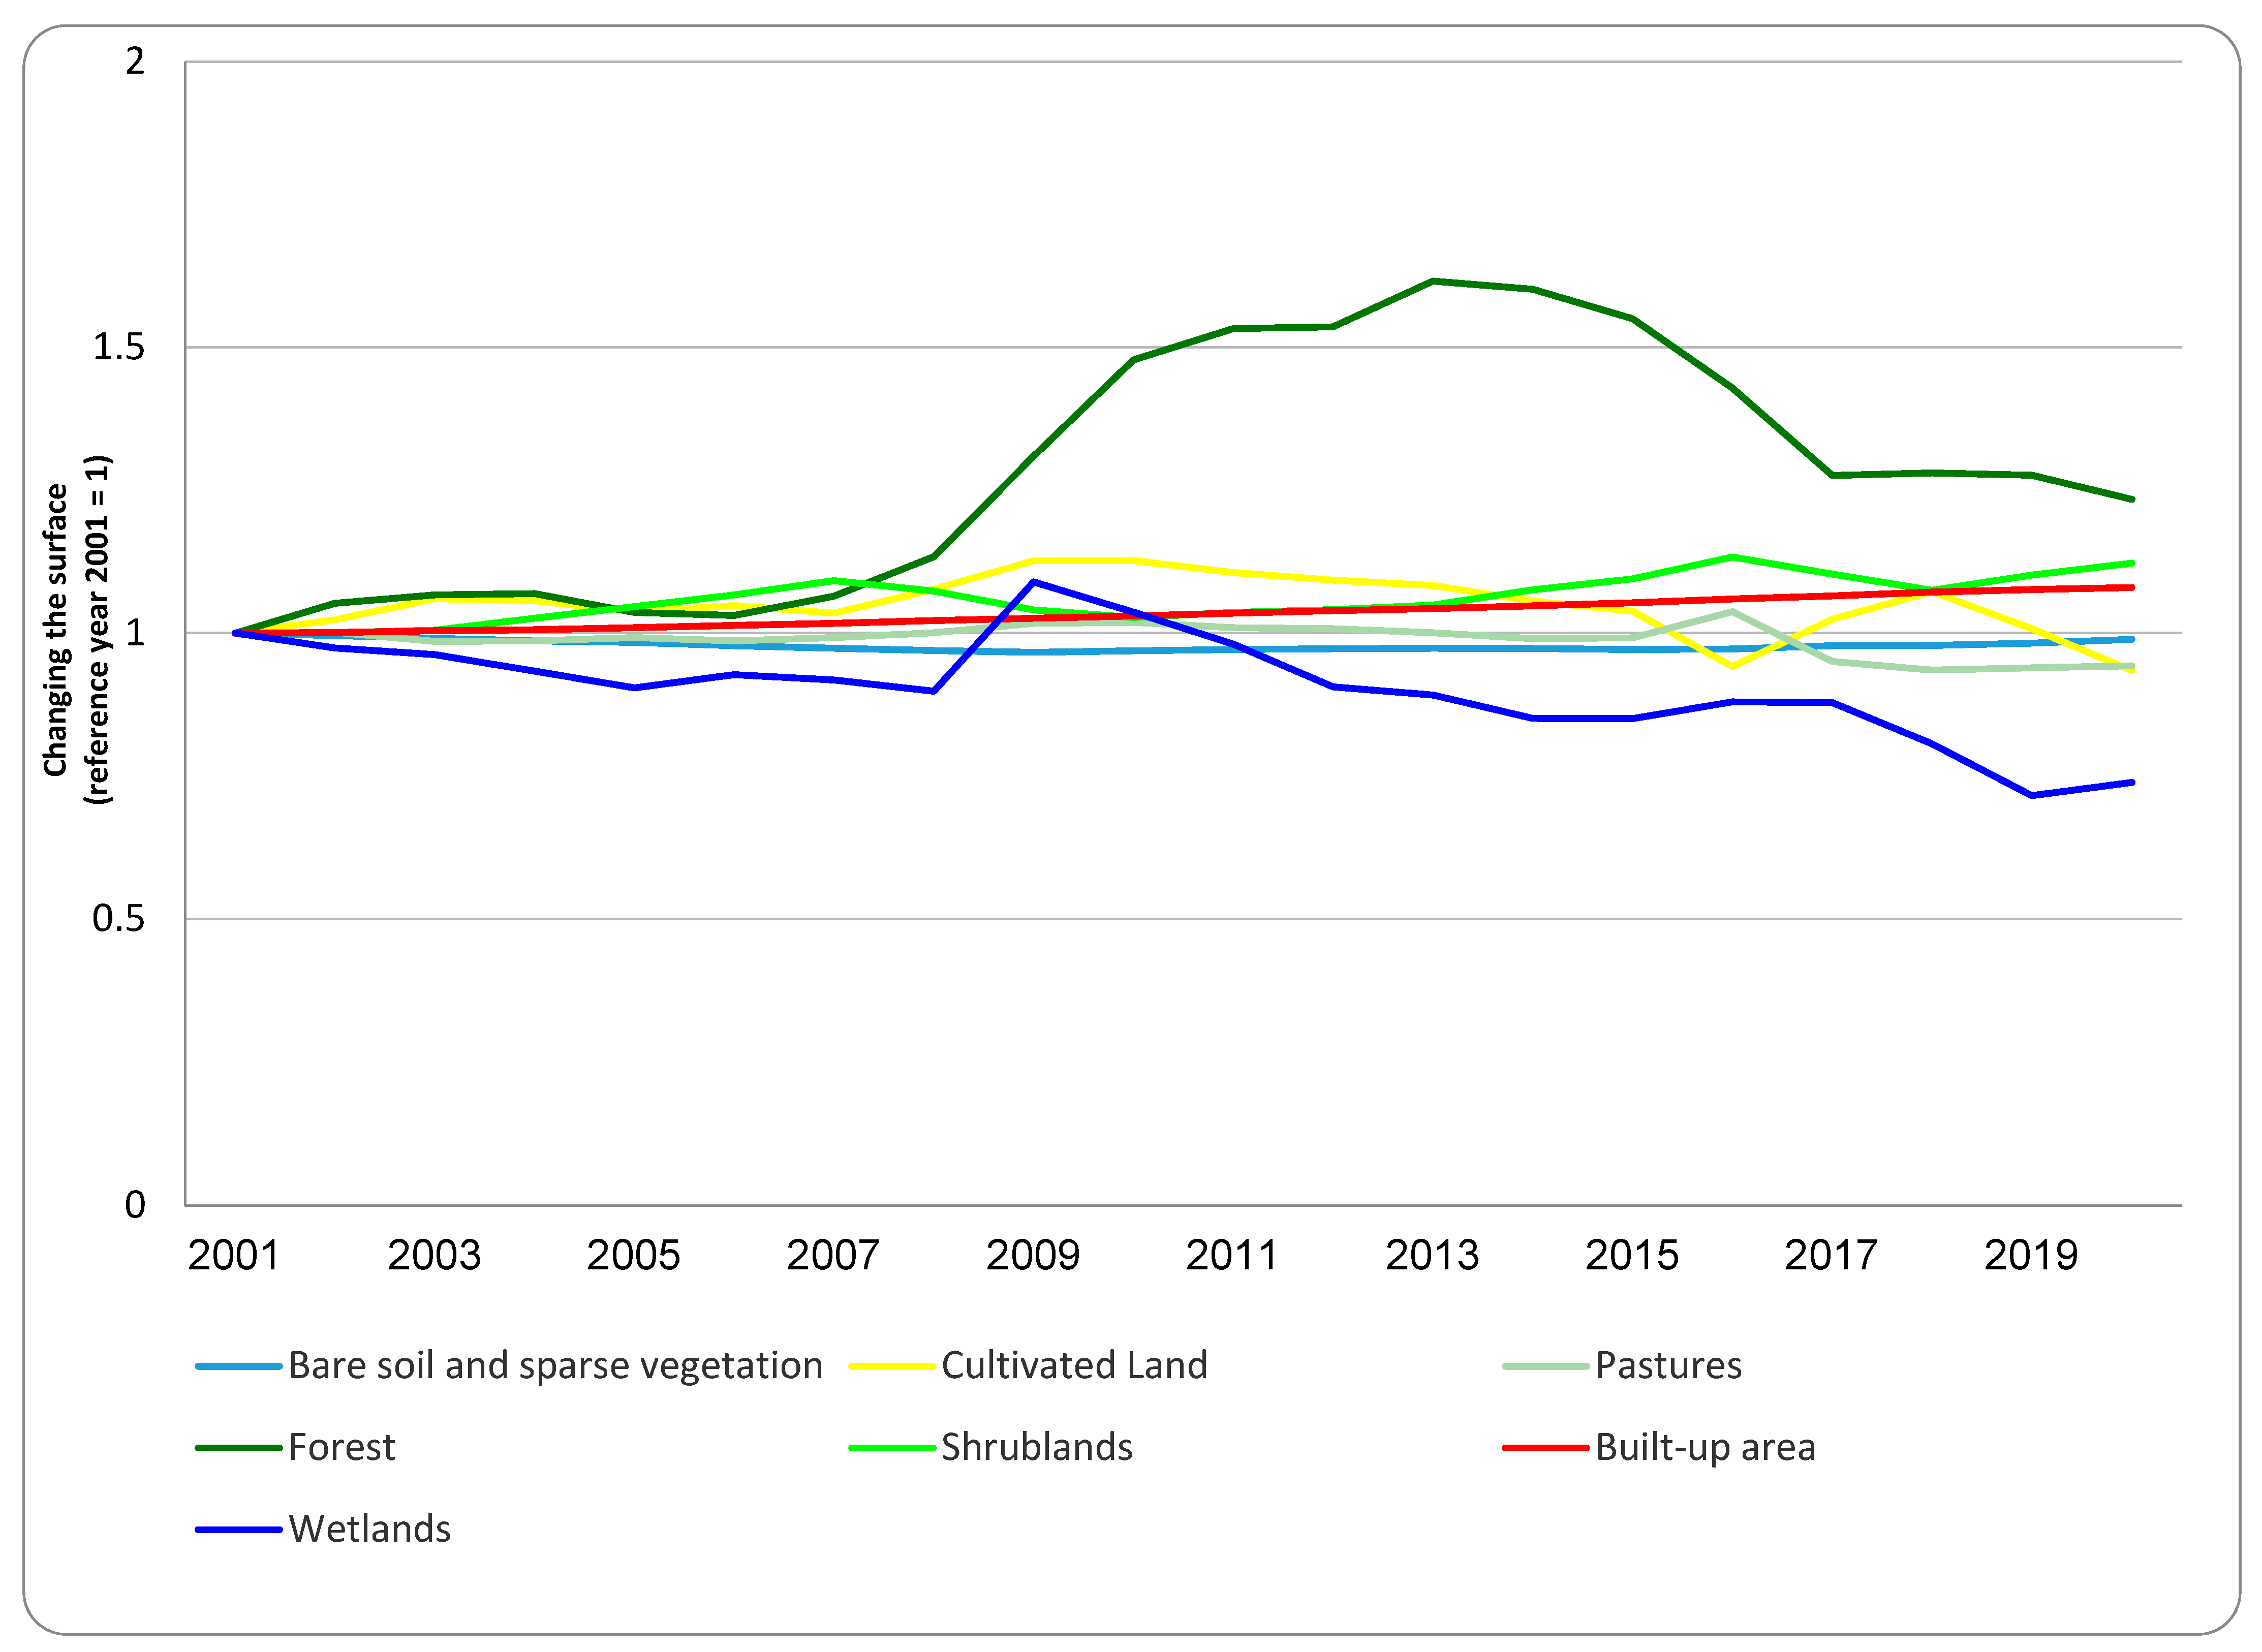
E. Land use trends
In order to understand the evolution of land use, we used the MCD12Q1.061 MODIS product, which offers 500m resolution with an IGBP classification of 17 classes according to [
38], of which only 14 are available in Morocco. Our study was based on multi-date mapping between 2001 and 2020, with change analysis carried out using the Google Earth Engine, which enabled us to obtain the change matrix for transitions between the main land uses, which we will reduce to 7 classes (
Table 4). In order to attenuate the annual variations recorded due to climatic conditions, notably precipitation, we calculated a five-year moving average of the changes over a 16-year period from 2005 to 2020. Based on the moving averages, we calculated the average annual change for each land use class.
3.2.2. Estimating the Economic Cost of Degradation
A. Degradation of agricultural land
A-1 Erosion
The economic cost of agricultural land erosion due to water and wind erosion in 2020 was estimated on the basis of the loss in value of agricultural production caused by a fall in productivity. For each homogeneous zone, we used four cropping systems: cereal, legume, sugar, and oilseed, based on [
32] data by province. We then calculated a weighted average of prices in USD per quintal: 27.83 for cereals, 89.36 for pulses, 72.66 for oilseeds, and 13.38 for sugars to estimate cereal productivity in each homogeneous zone.
In short, the economic cost of lost productivity is calculated by multiplying lost agricultural production (PAP) by the price of cereals in 2020. This estimate was made for each homogeneous zone using the following formula: PAP (homogeneous zone) = lost agricultural productivity × area of land affected by different erosive conditions
A-2 Salinization
To calculate the cost of salinization-induced land degradation, we multiplied the affected land area for each homogeneous zone by 390.5 USD/ha, which is the economic cost induced by losses in agricultural productivity due to salinization according to [
12]
B. Overgrazing of rangelands
The cost associated with rangeland degradation is equivalent to the quantity of forage units over-consumed, multiplied by the unit price of a forage unit. Each forage unit represents one kilogram of barley. According to [
32], the unit price of a kilogram of barley is between USD 0.26 and 0.83.
C. Siltation of dams
To calculate the cost of land degradation ex situ, we first transformed the quantity of sediment exported from the t into m
3, knowing that the weight by volume of dam silt is 1.8 t/m
3 [
39], then used the replacement cost method. This approach was supported by reference to the cost of developing water resources, assessed on the basis of the cost of mobilizing water from another dam intended to replace the lost storage capacity, which consisted of multiplying this quantity by the average cost of developing the mobilized water, varying between 0.21 and 0.63 USD/m
3 according to data from [
40].
D. Loss of carbon storage
In order to estimate the economic cost of the loss of carbon storage, our analysis is based on the social valuation of a ton of sequestered carbon, representing the social damage avoided by preventing the release of CO
2. According to [
12], the social price of carbon ranges from USD 40 to 80. To monetize the quantity of degraded carbon obtained by the InVEST model, we multiply this quantity by the extreme values of this range, then average the two.
E. Land use trends
To estimate the cost of the average annual change in land use on the total economic value (
Table 5), 4 classes will be retained for reasons of significant importance.


