

Dynamic Assessment of Population Exposure to Urban Flooding Considering Building Characteristics


Abstract
1. Introduction
2. Study Area and Data
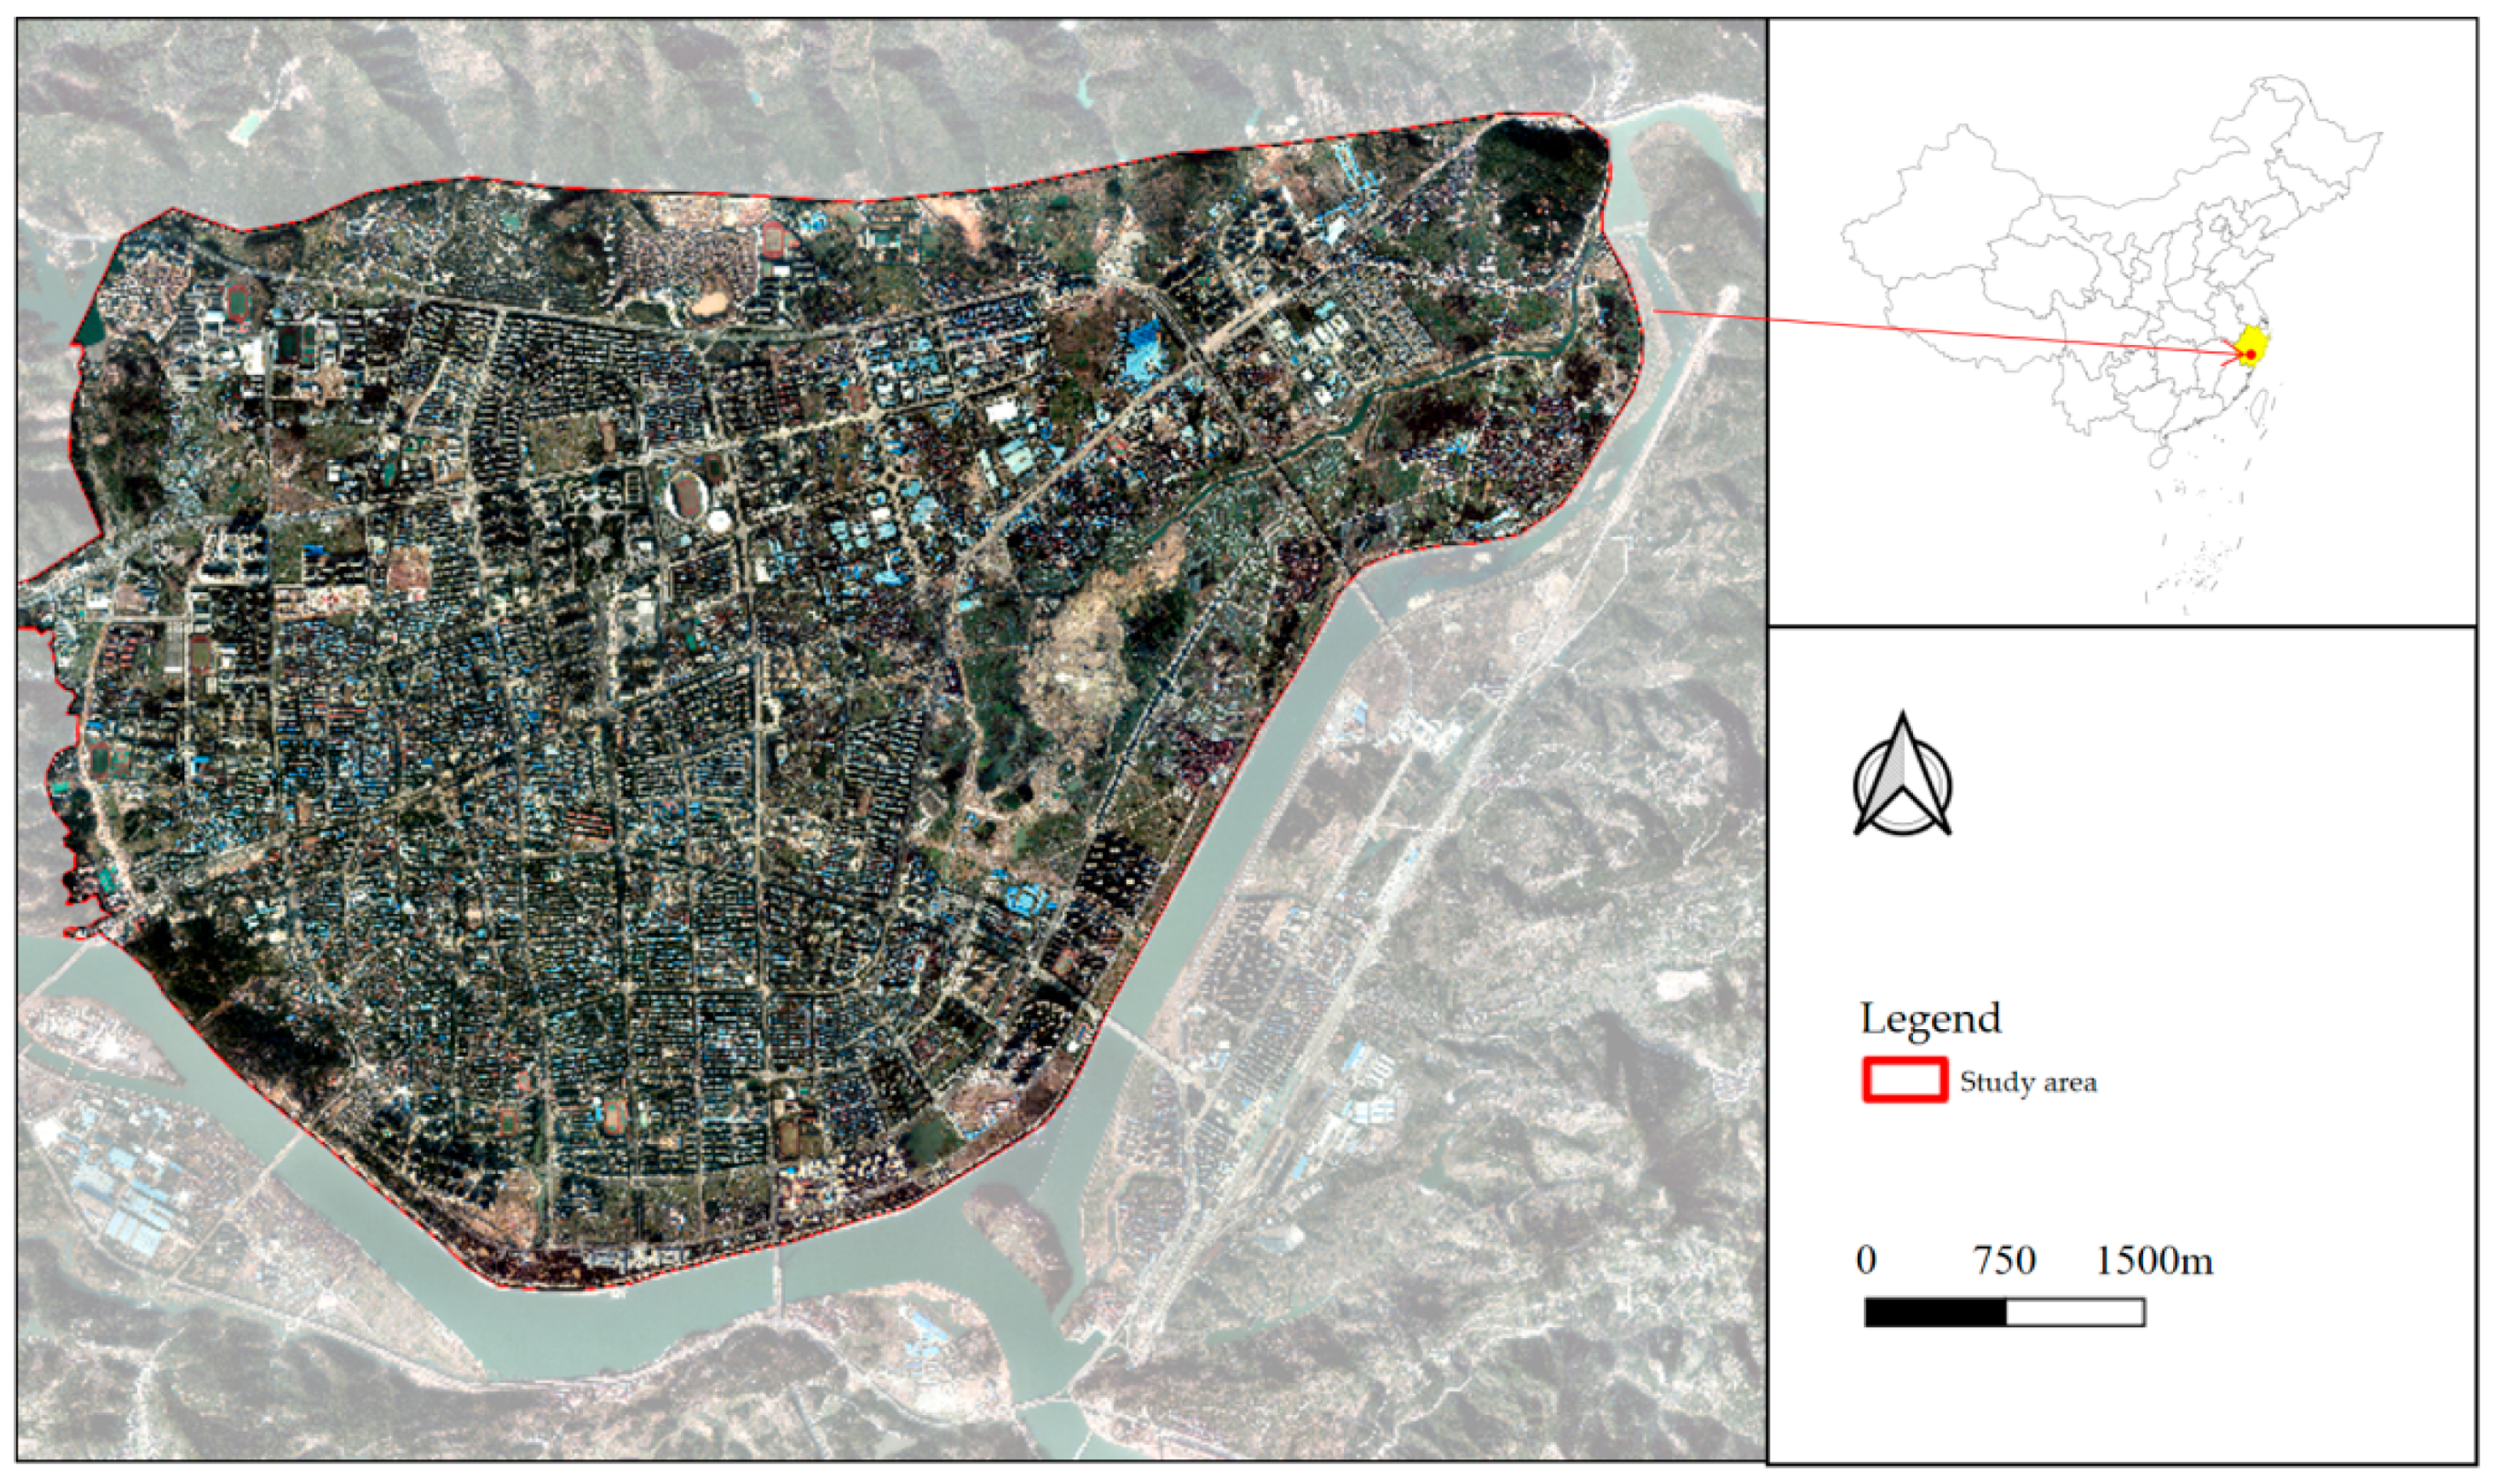
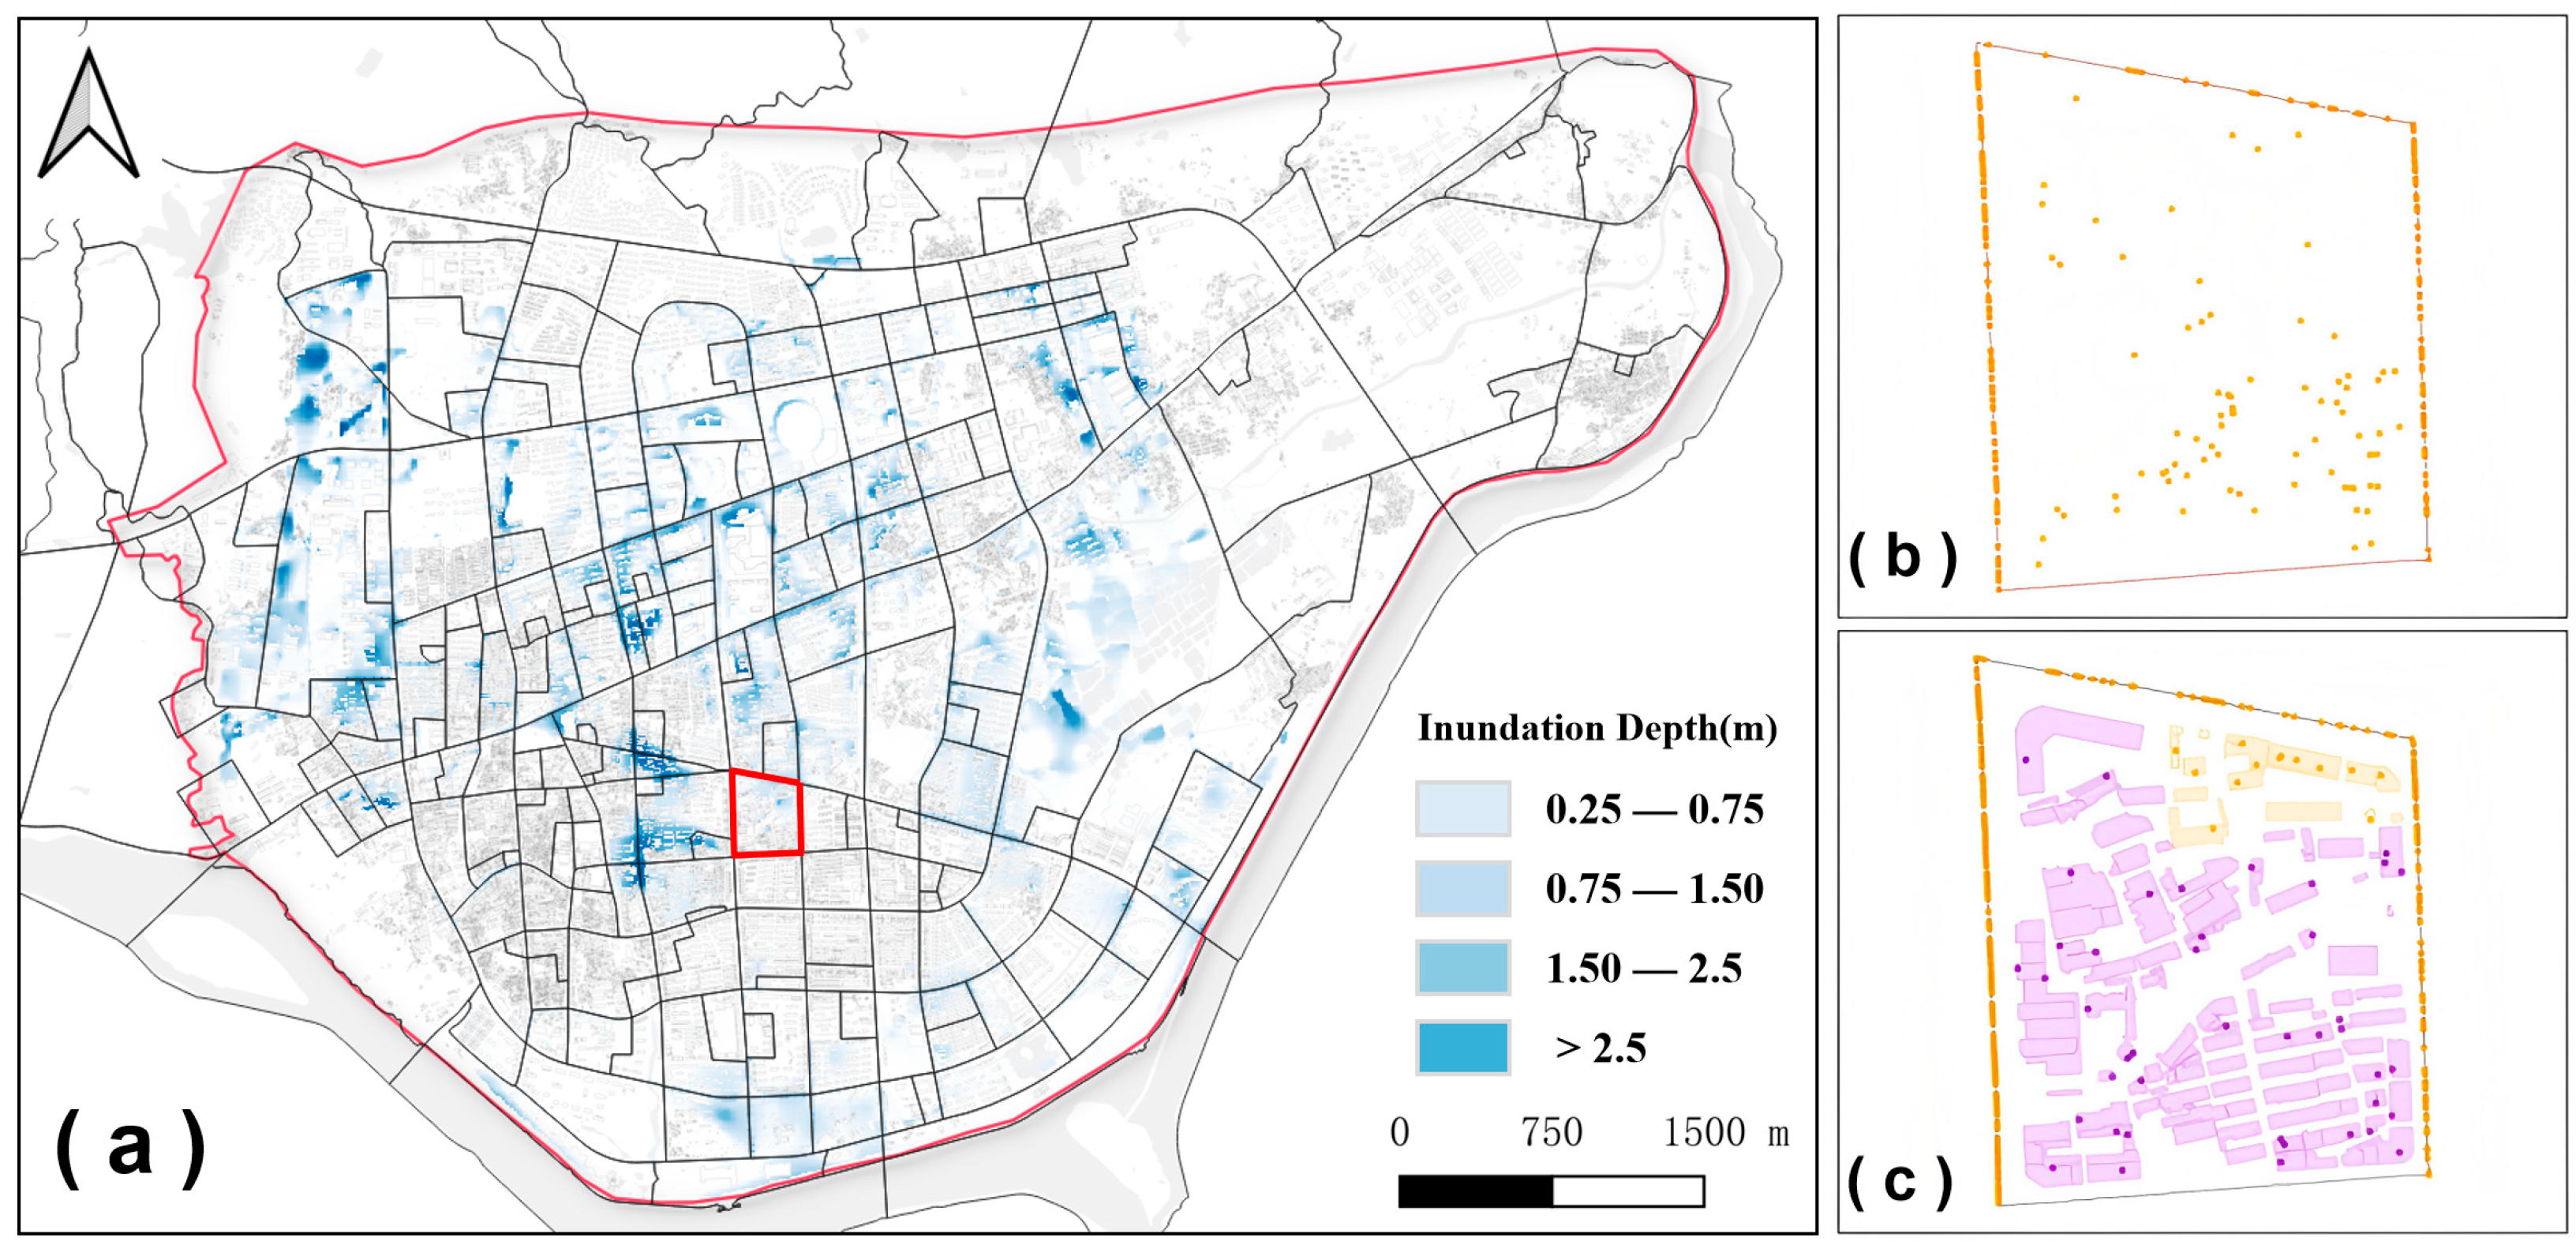
2.1. Study Area
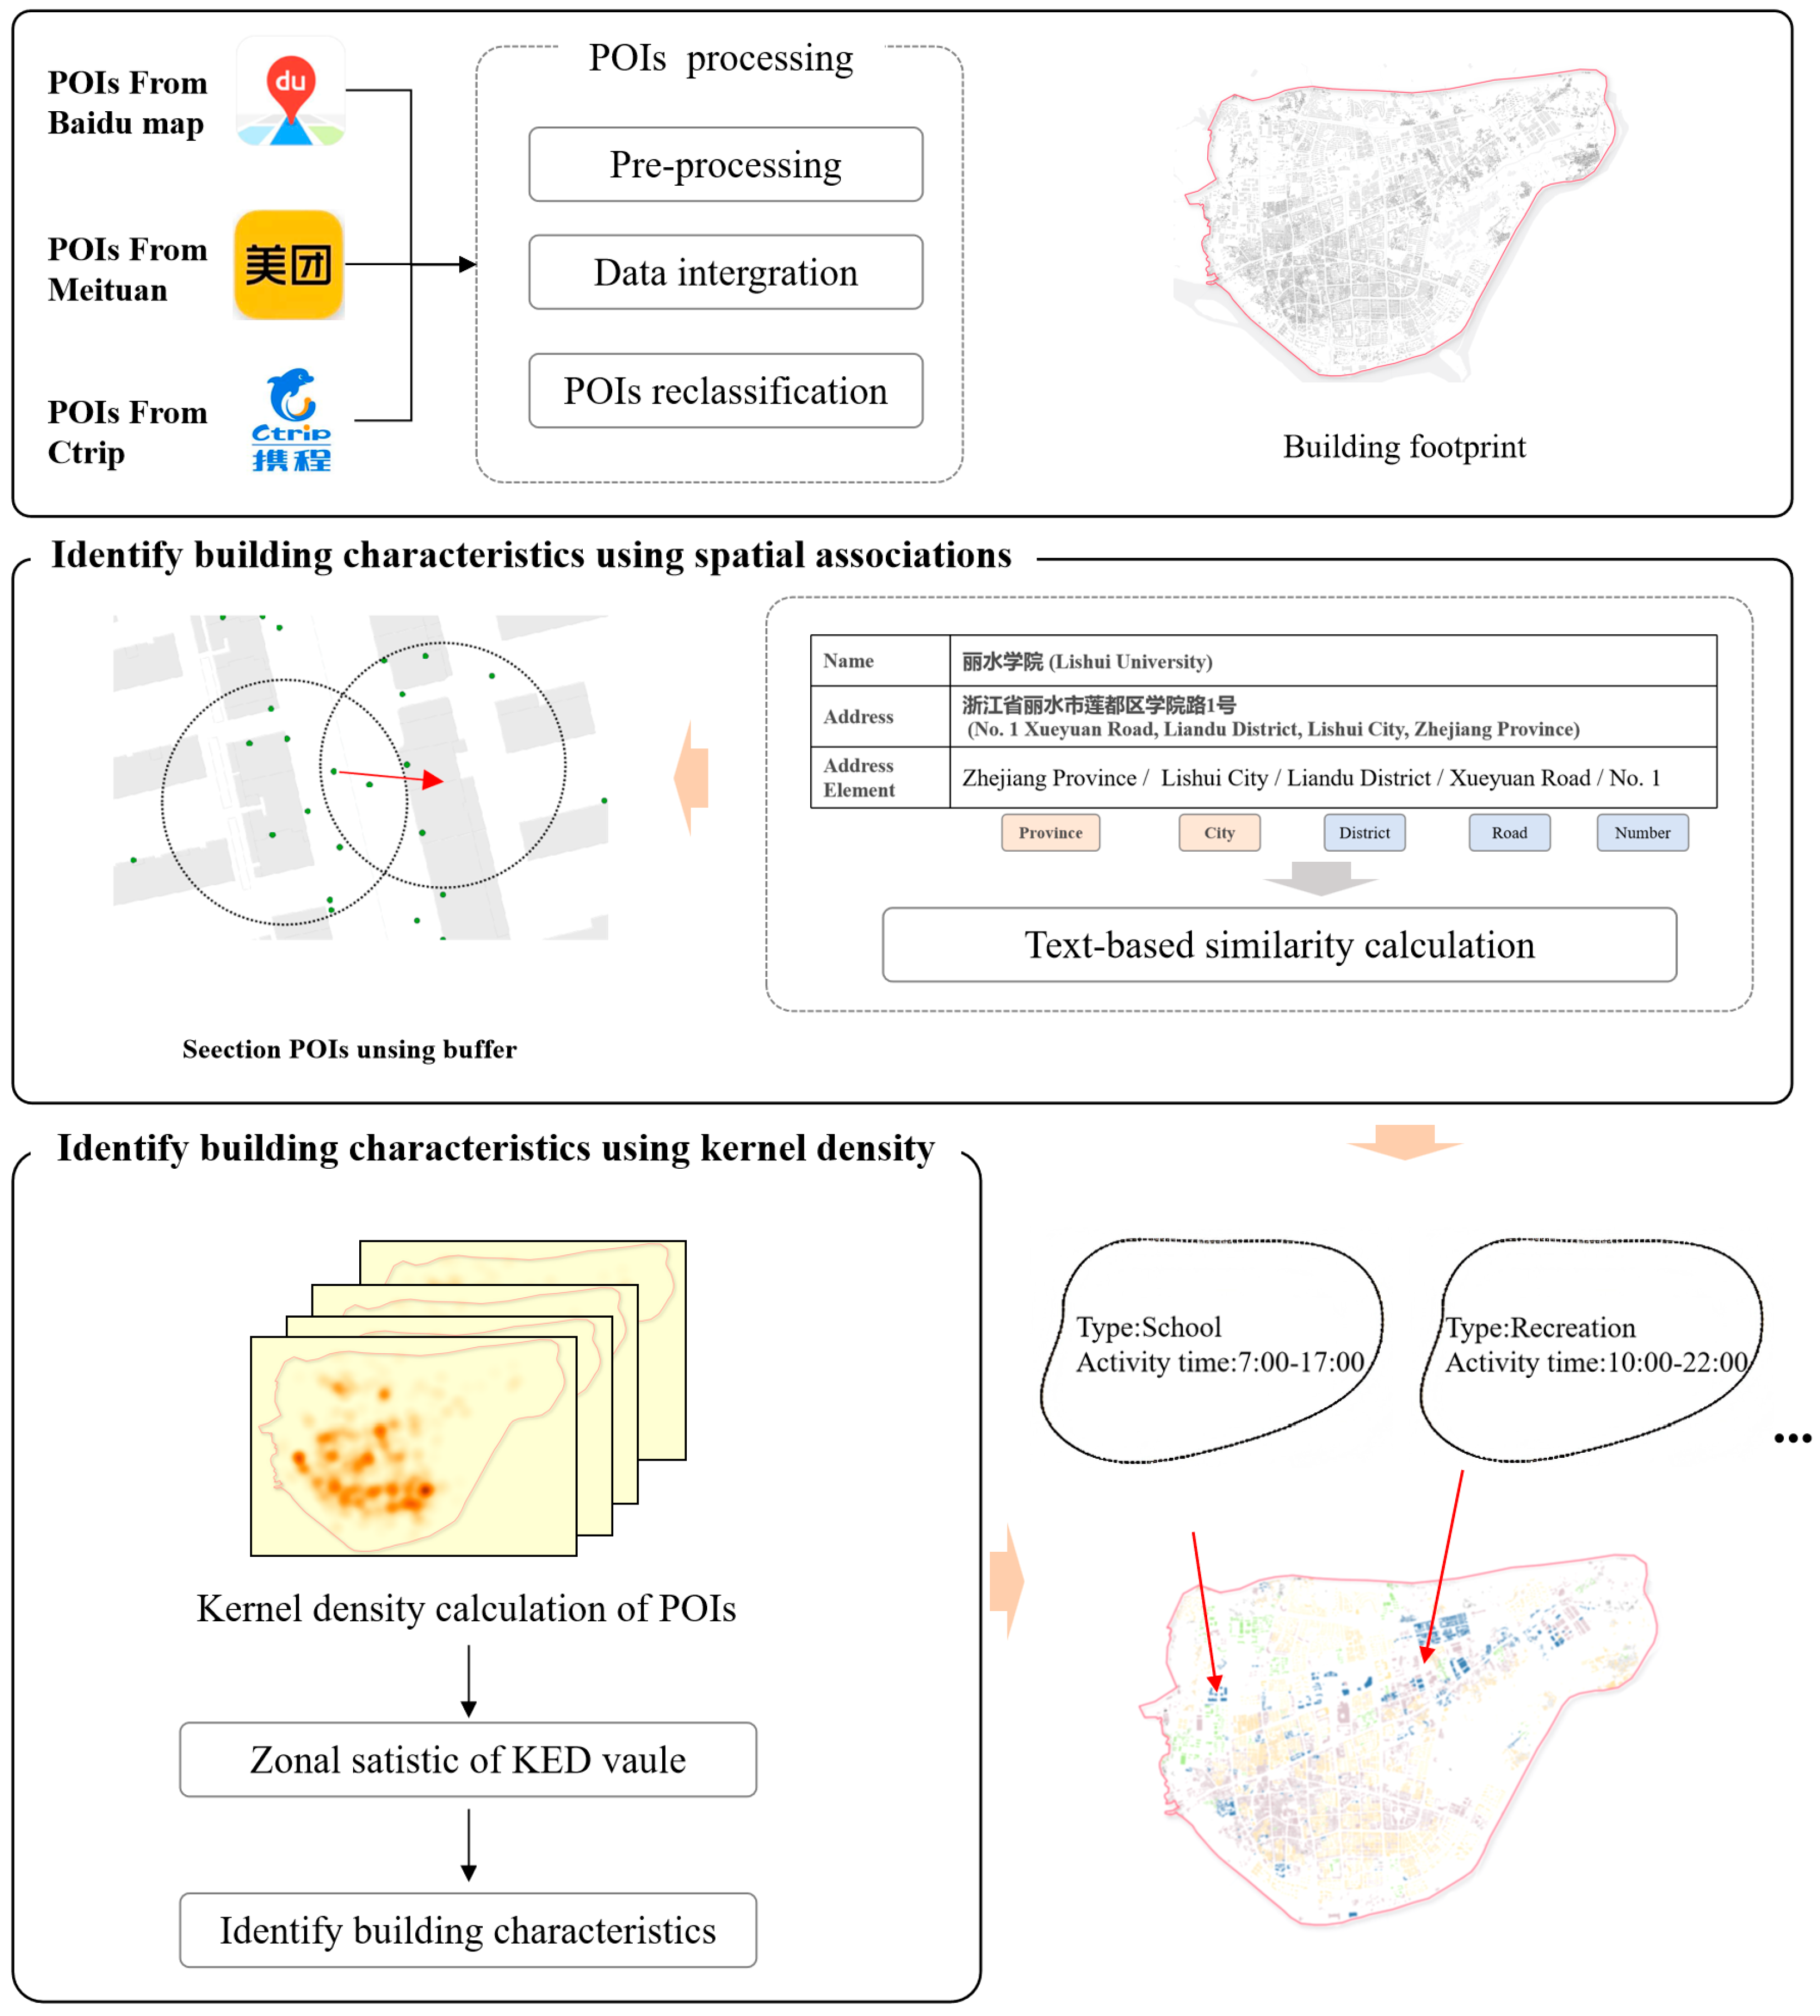
2.2. Data Sources
3. Methodology
3.1. Urban Environment Modeling at Building Scale
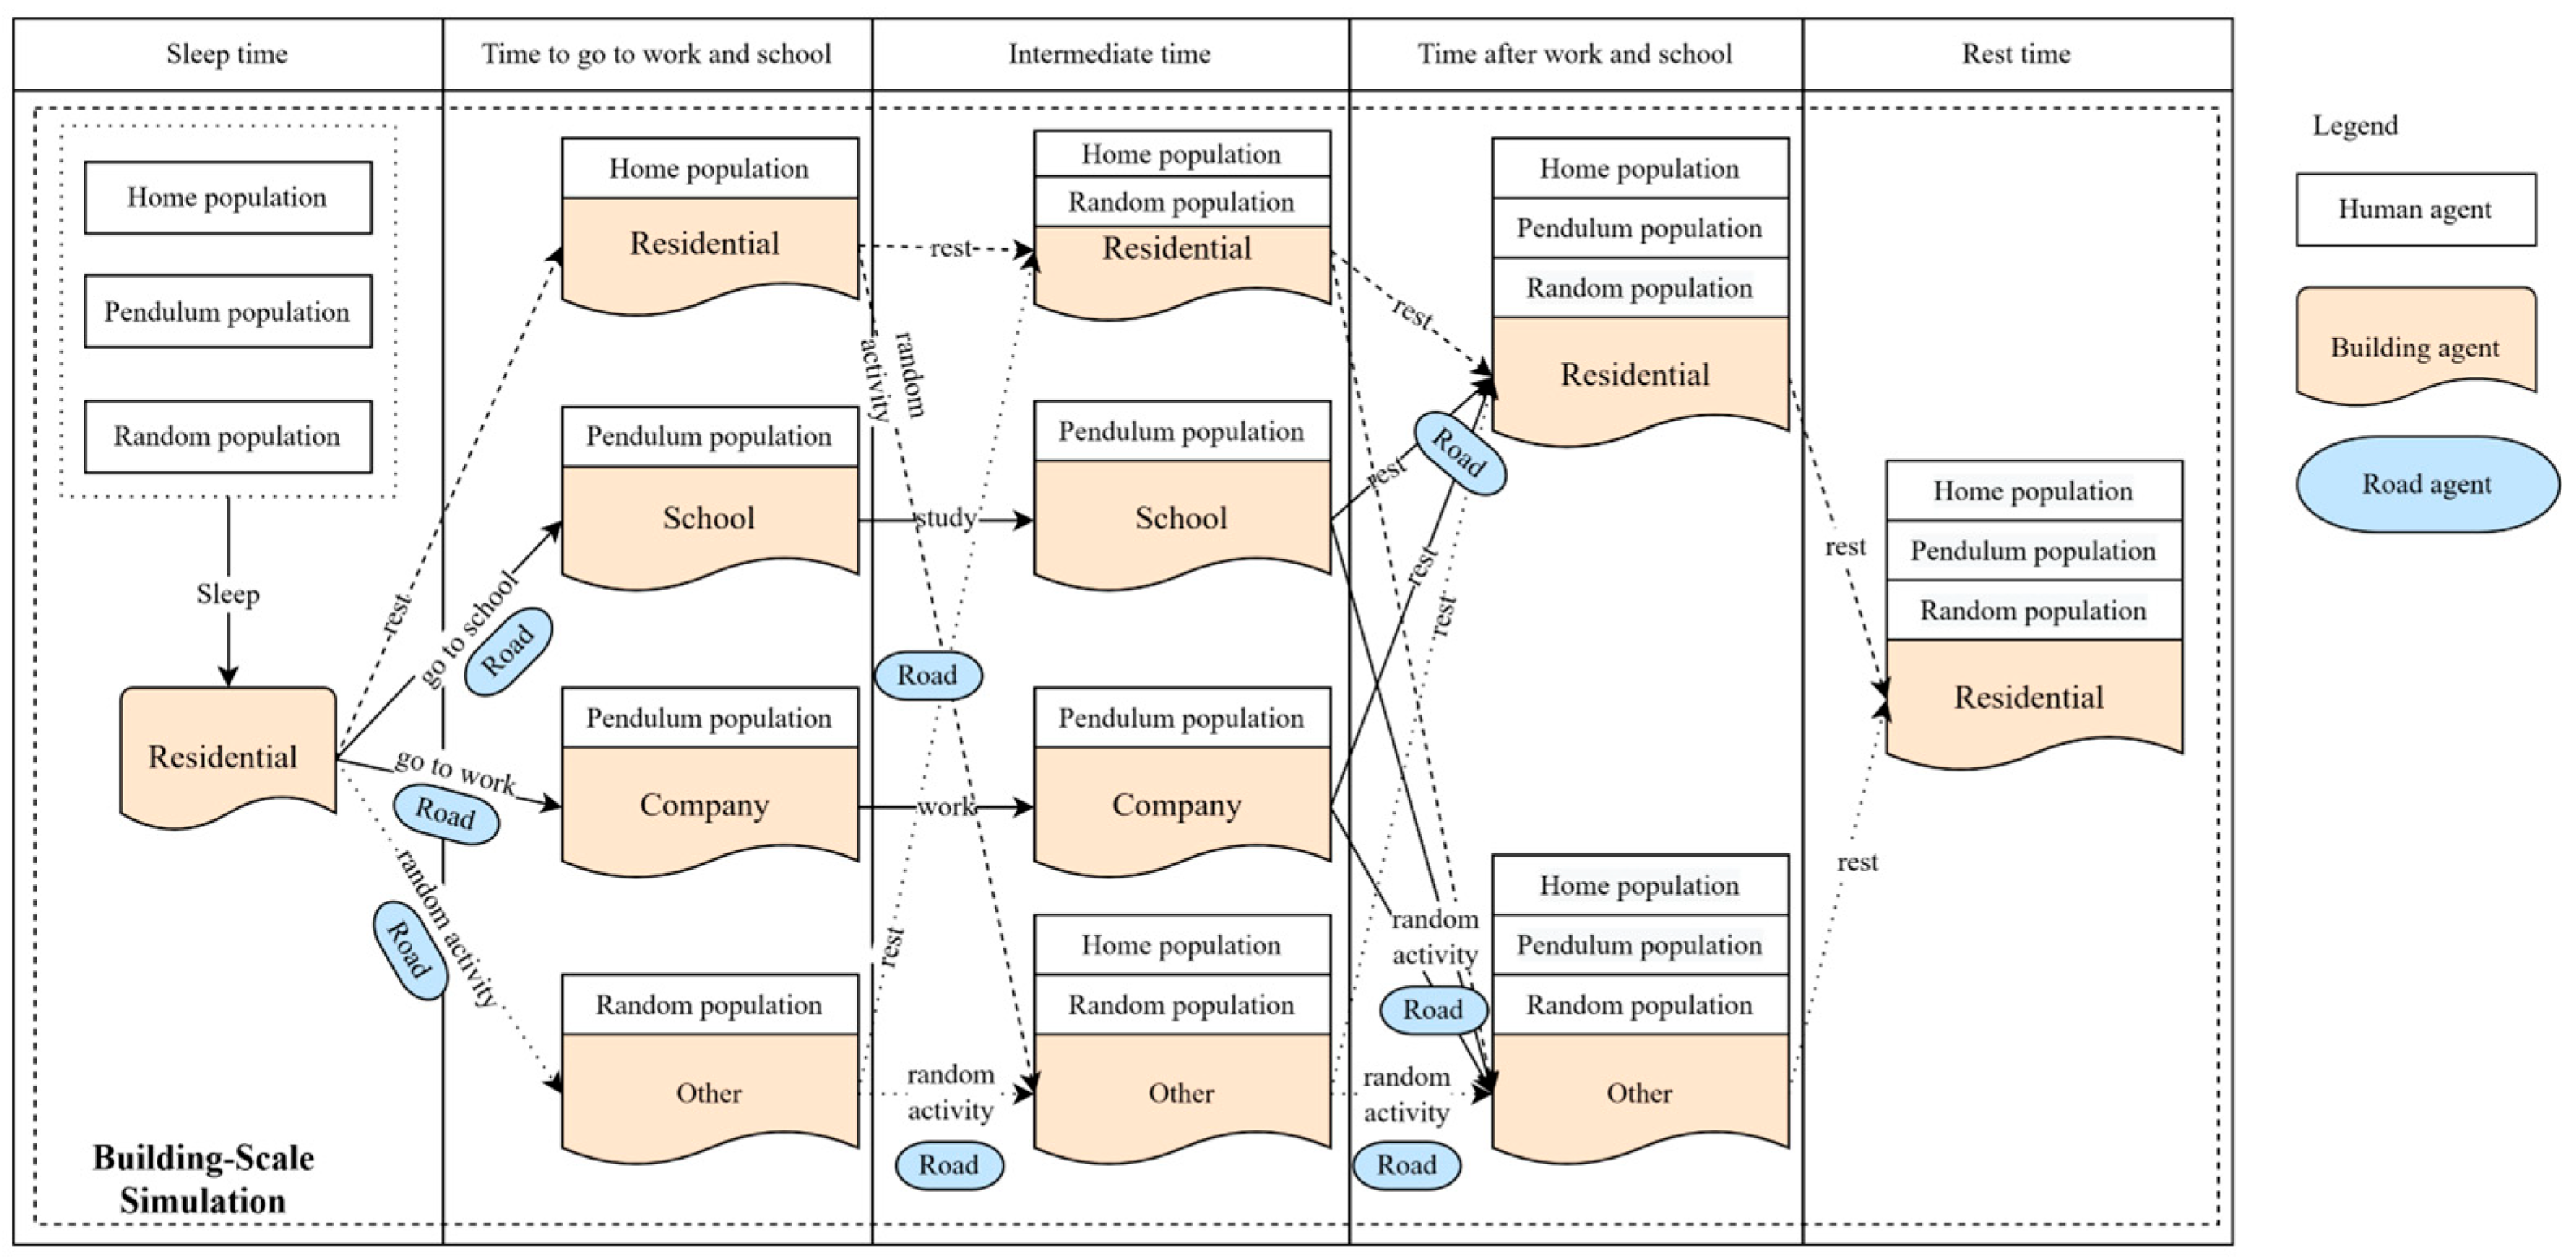
3.2. Agent-Based Modeling of Human Activity
3.3. Dynamic Exposure Assessment Based on Scenarios
4. Results
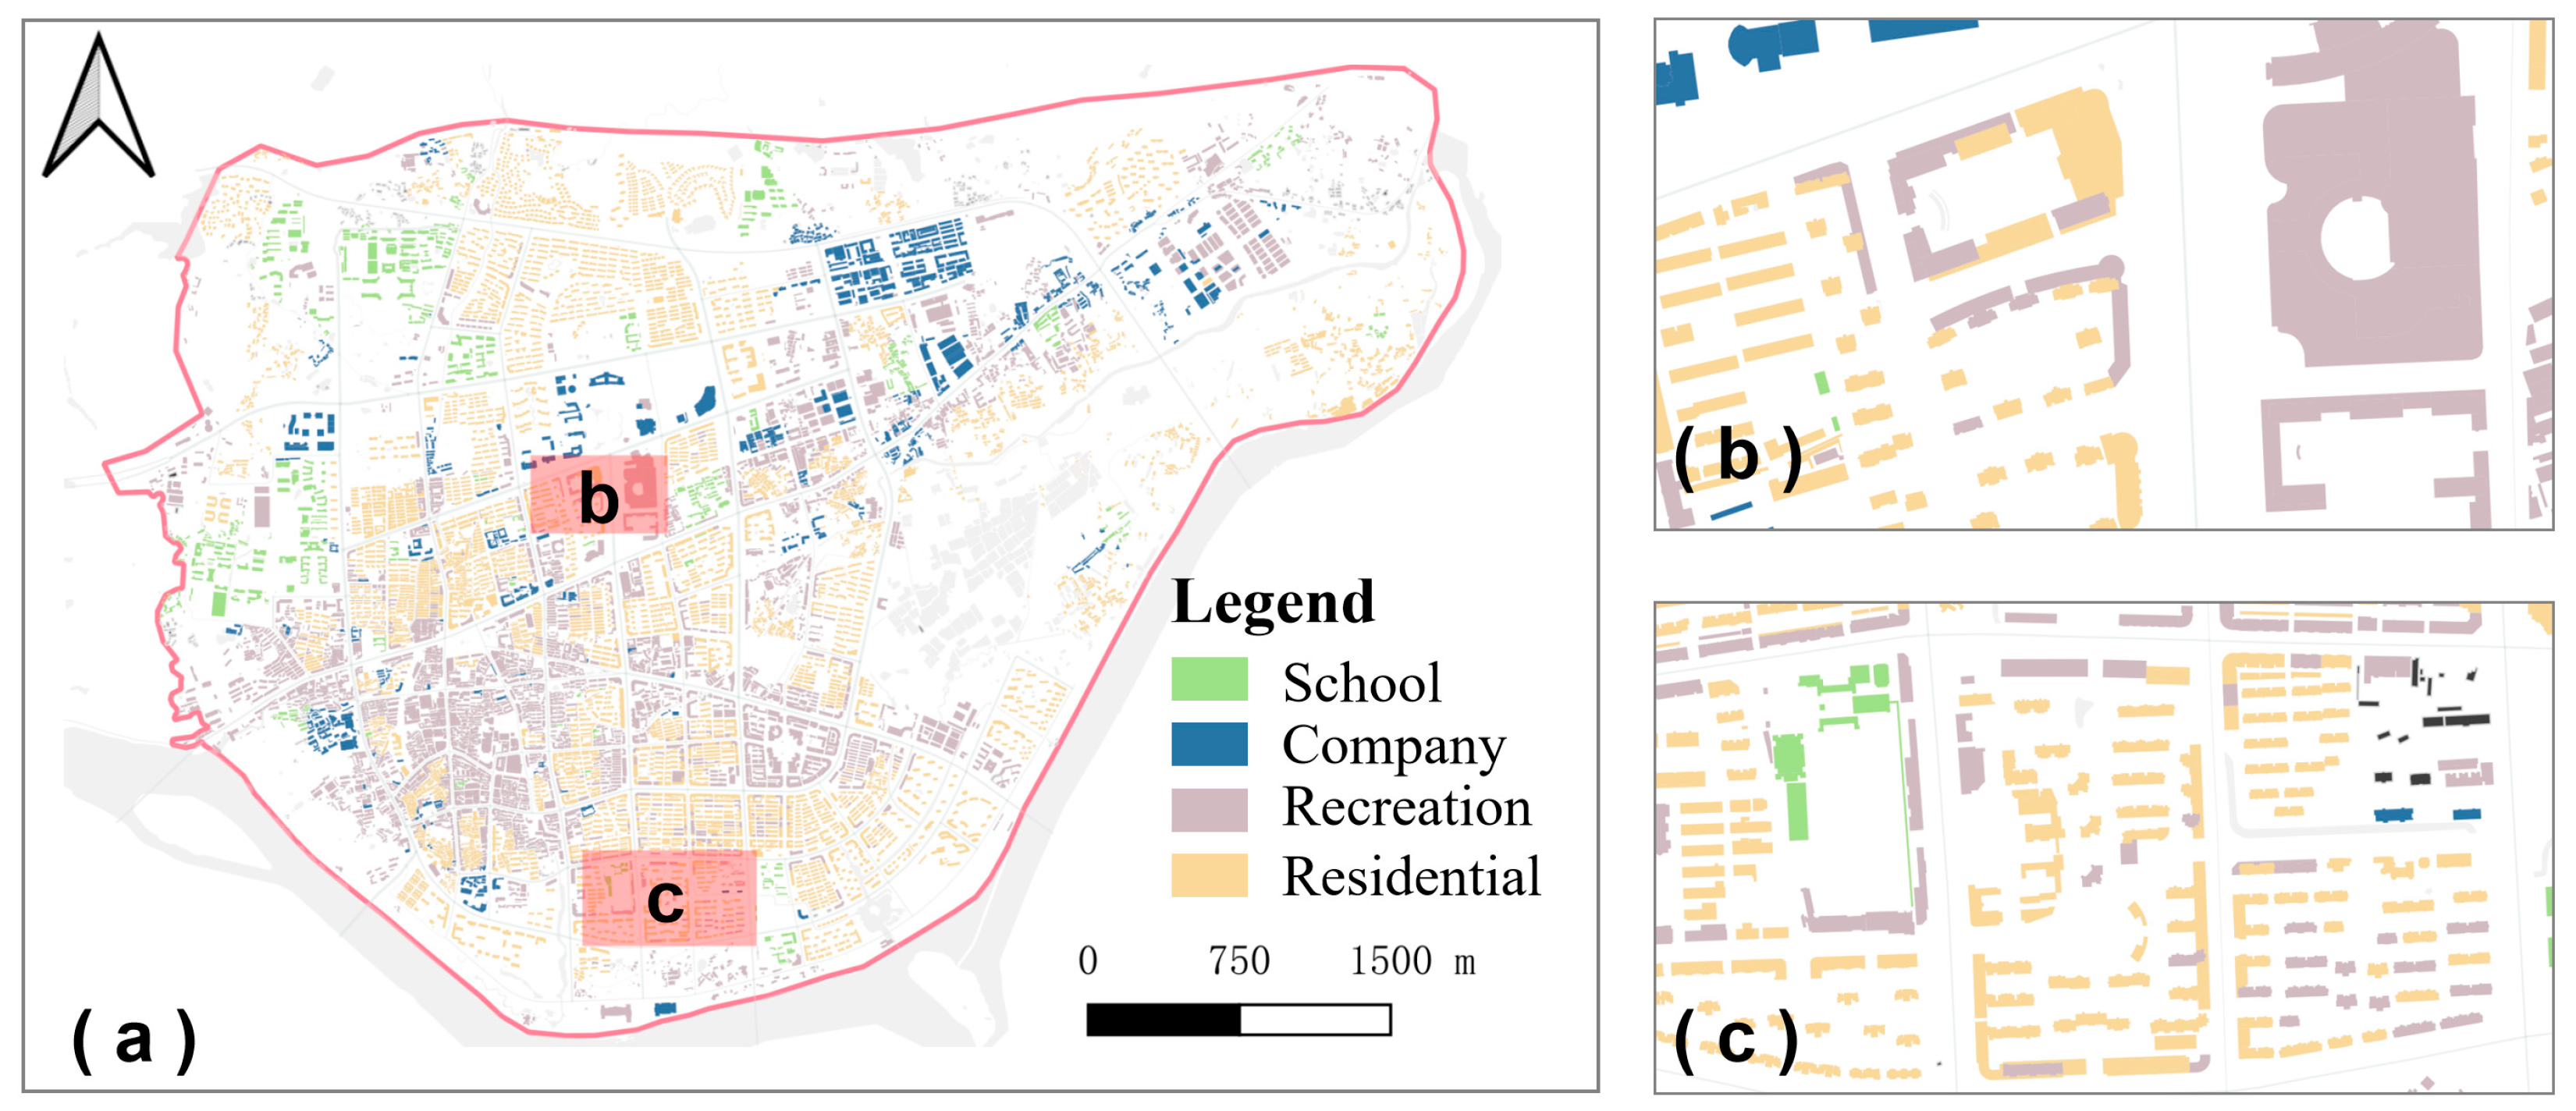
4.1. Urban Environment Modeling Based on Multi-Source Data
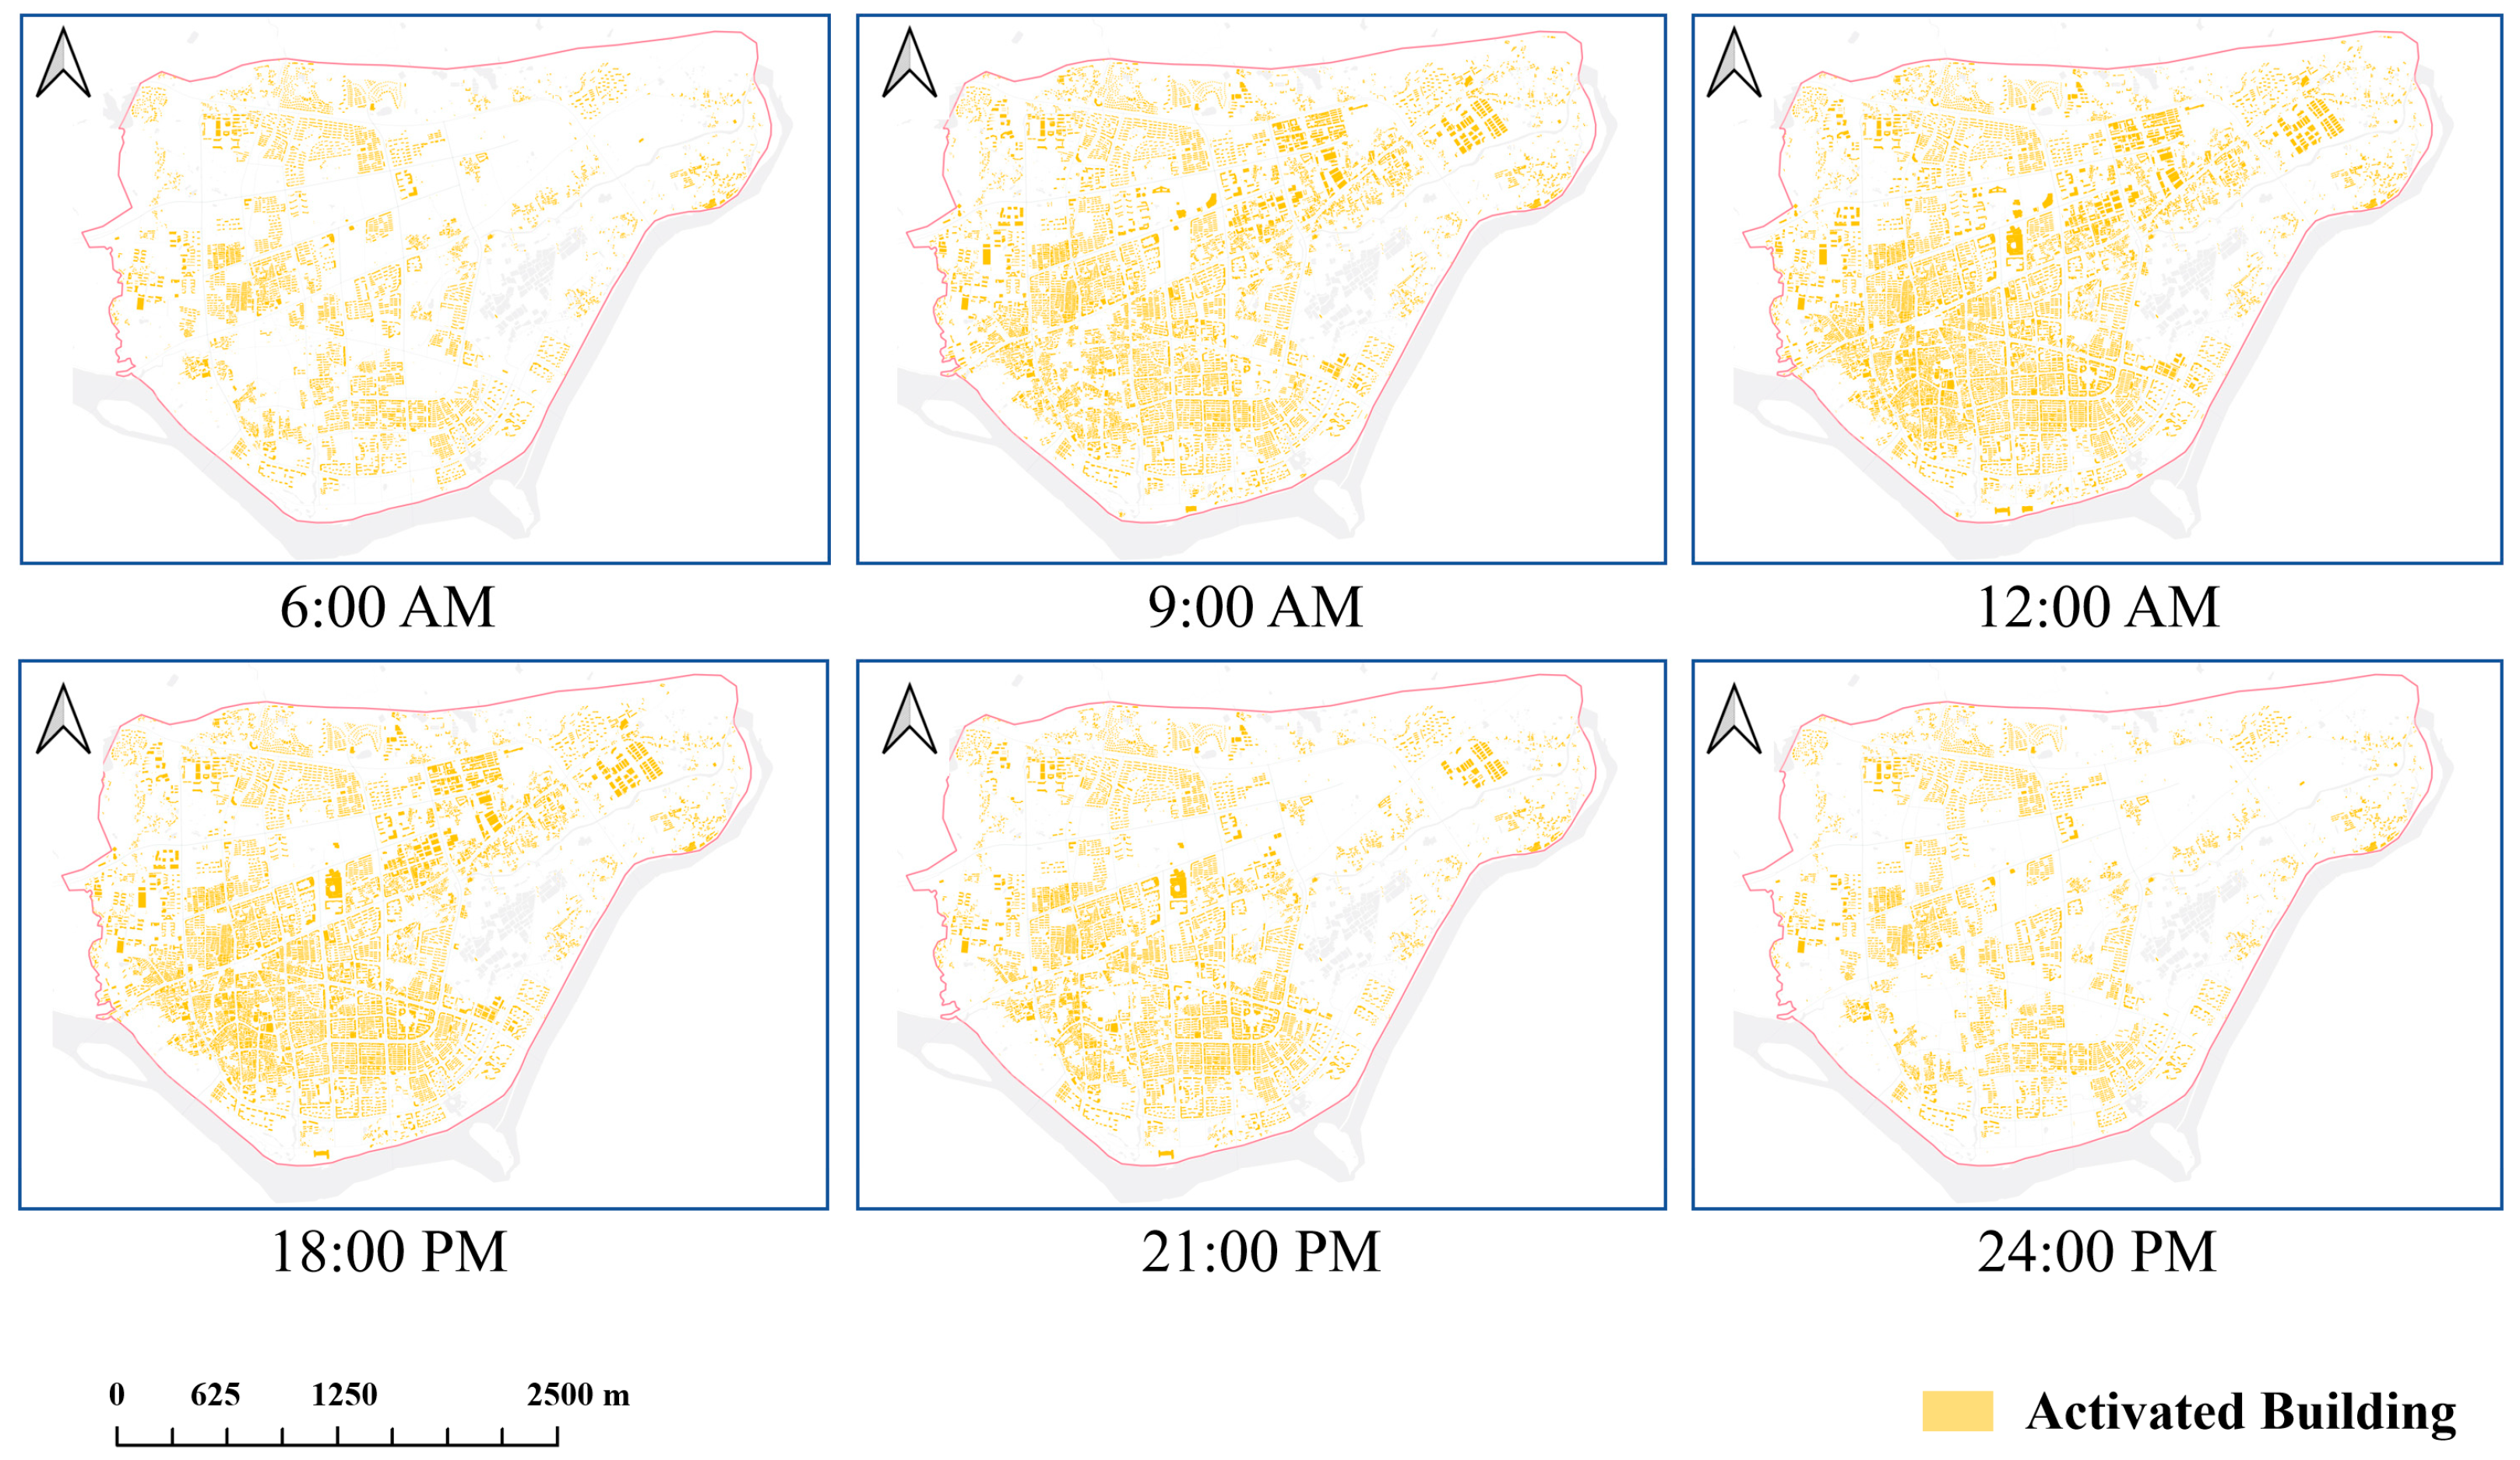
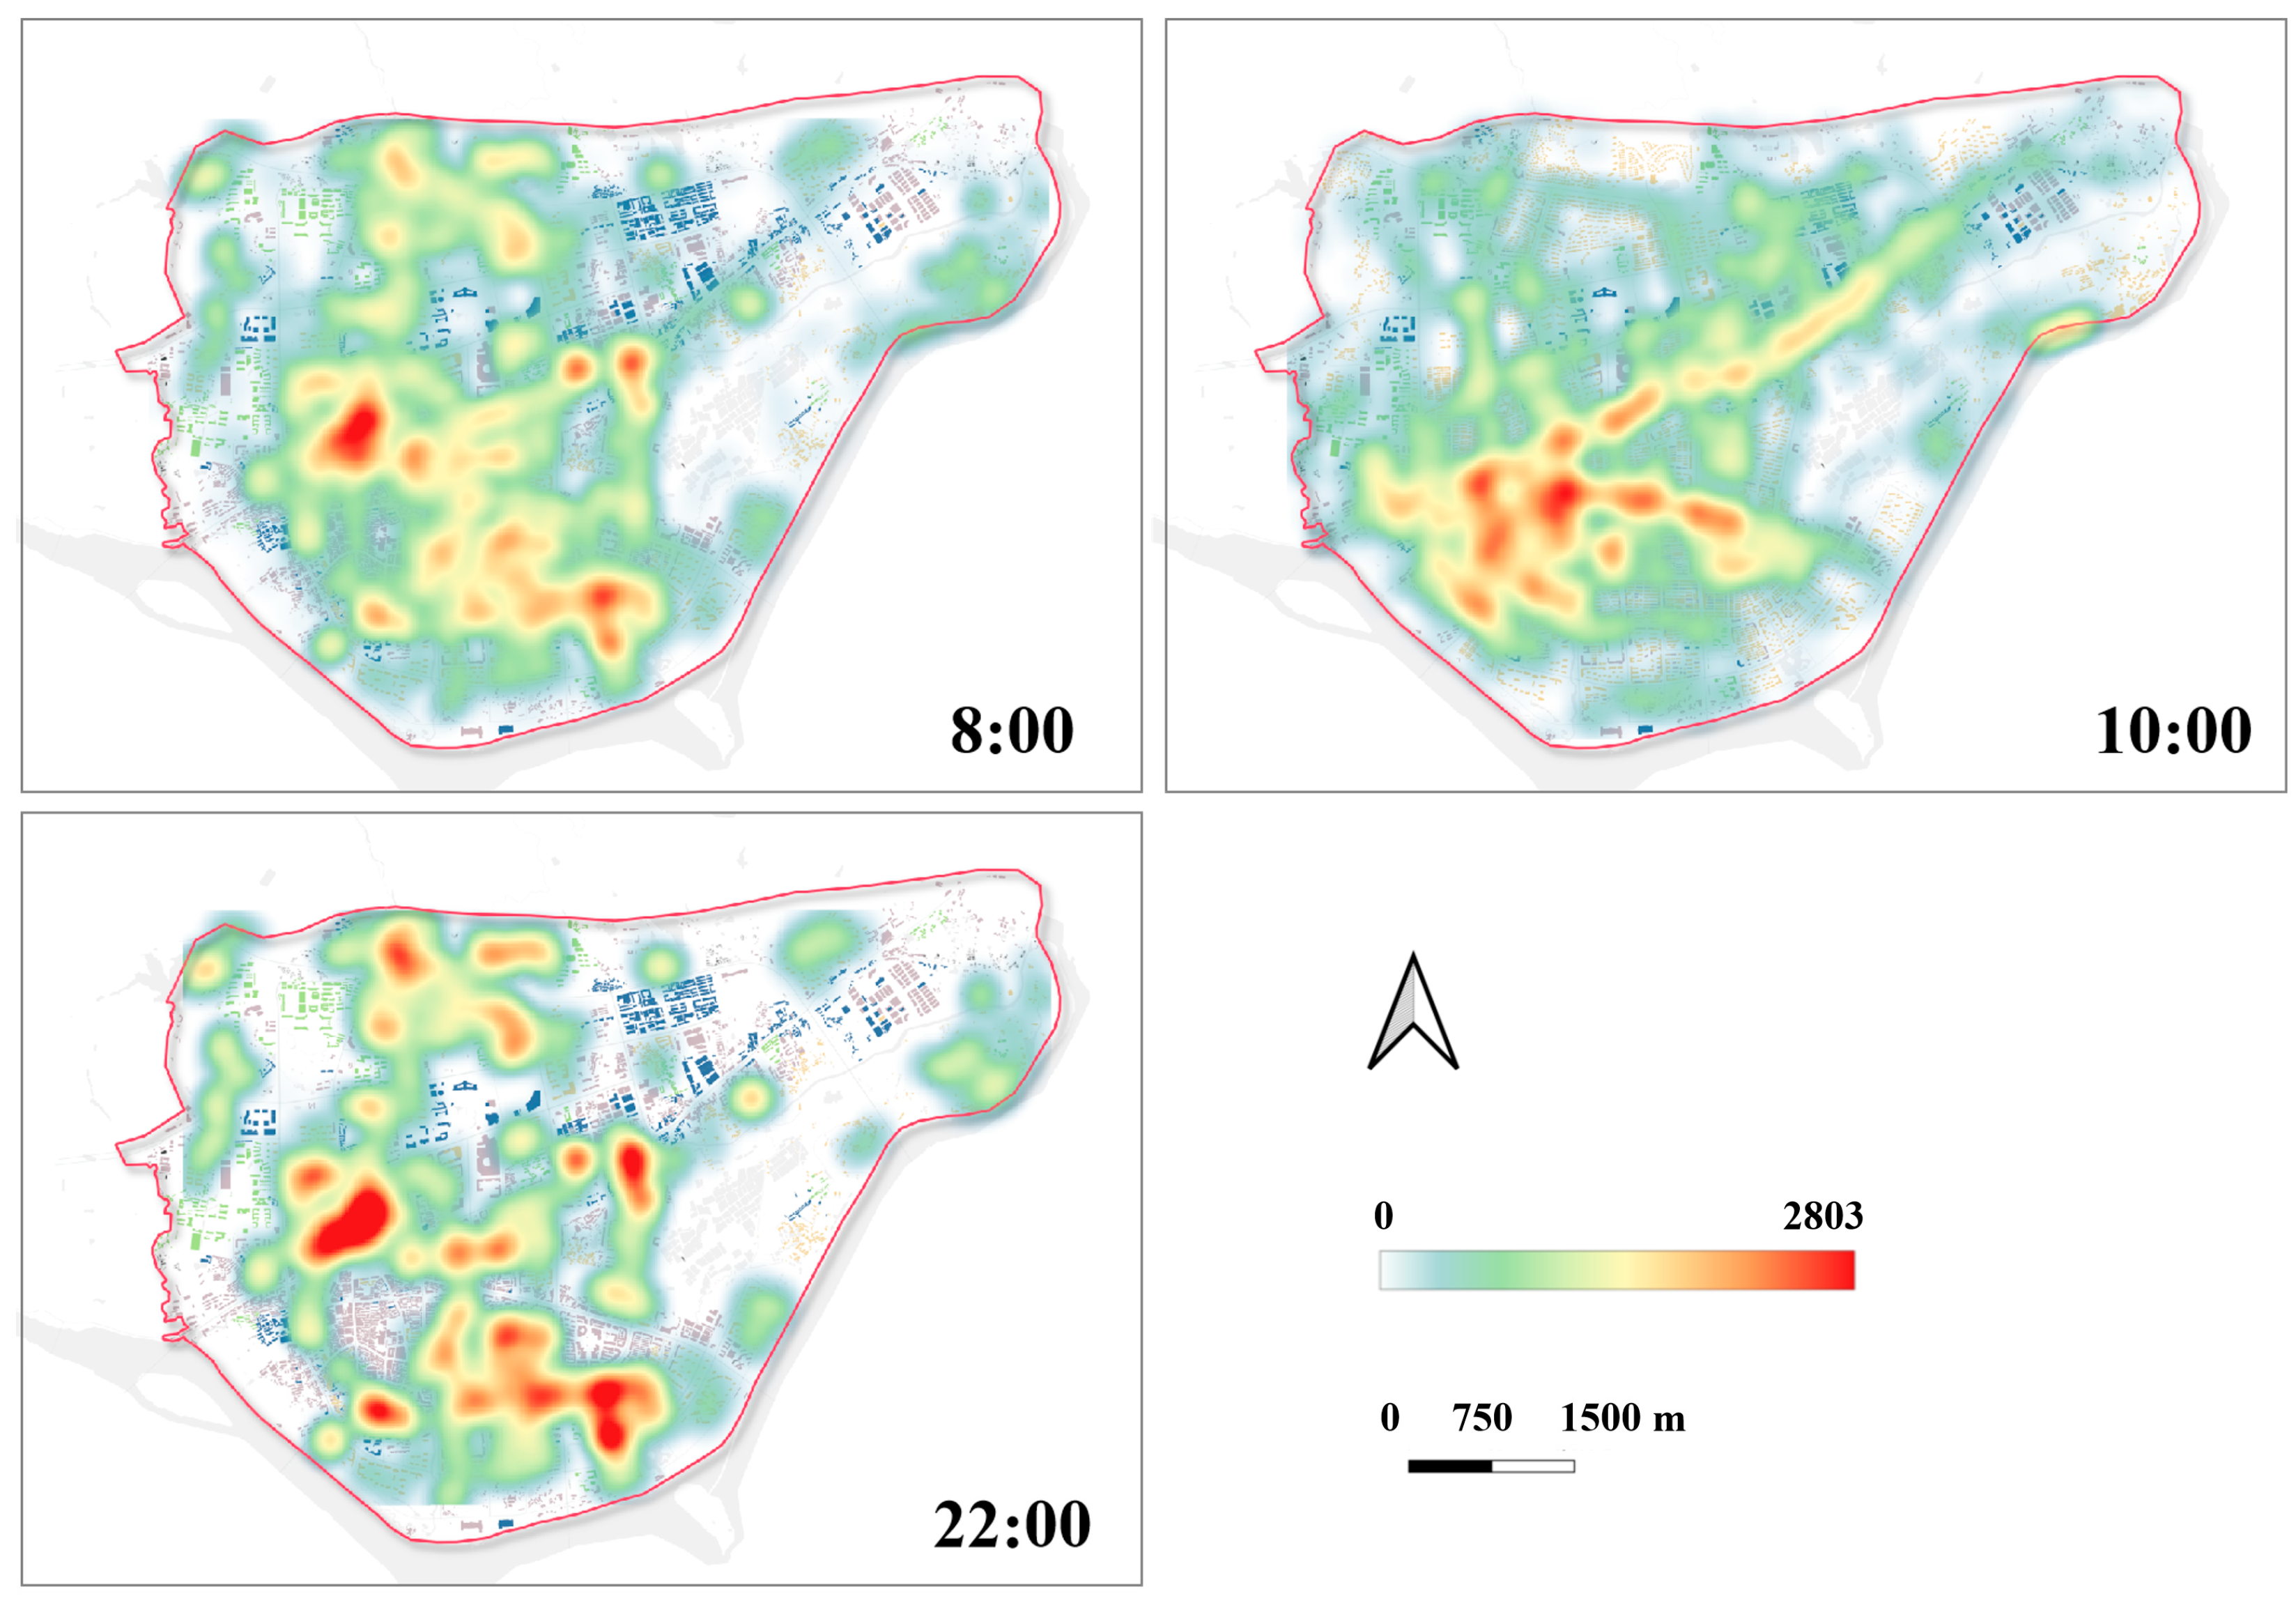
4.2. Dynamic Simulation of Population Distribution
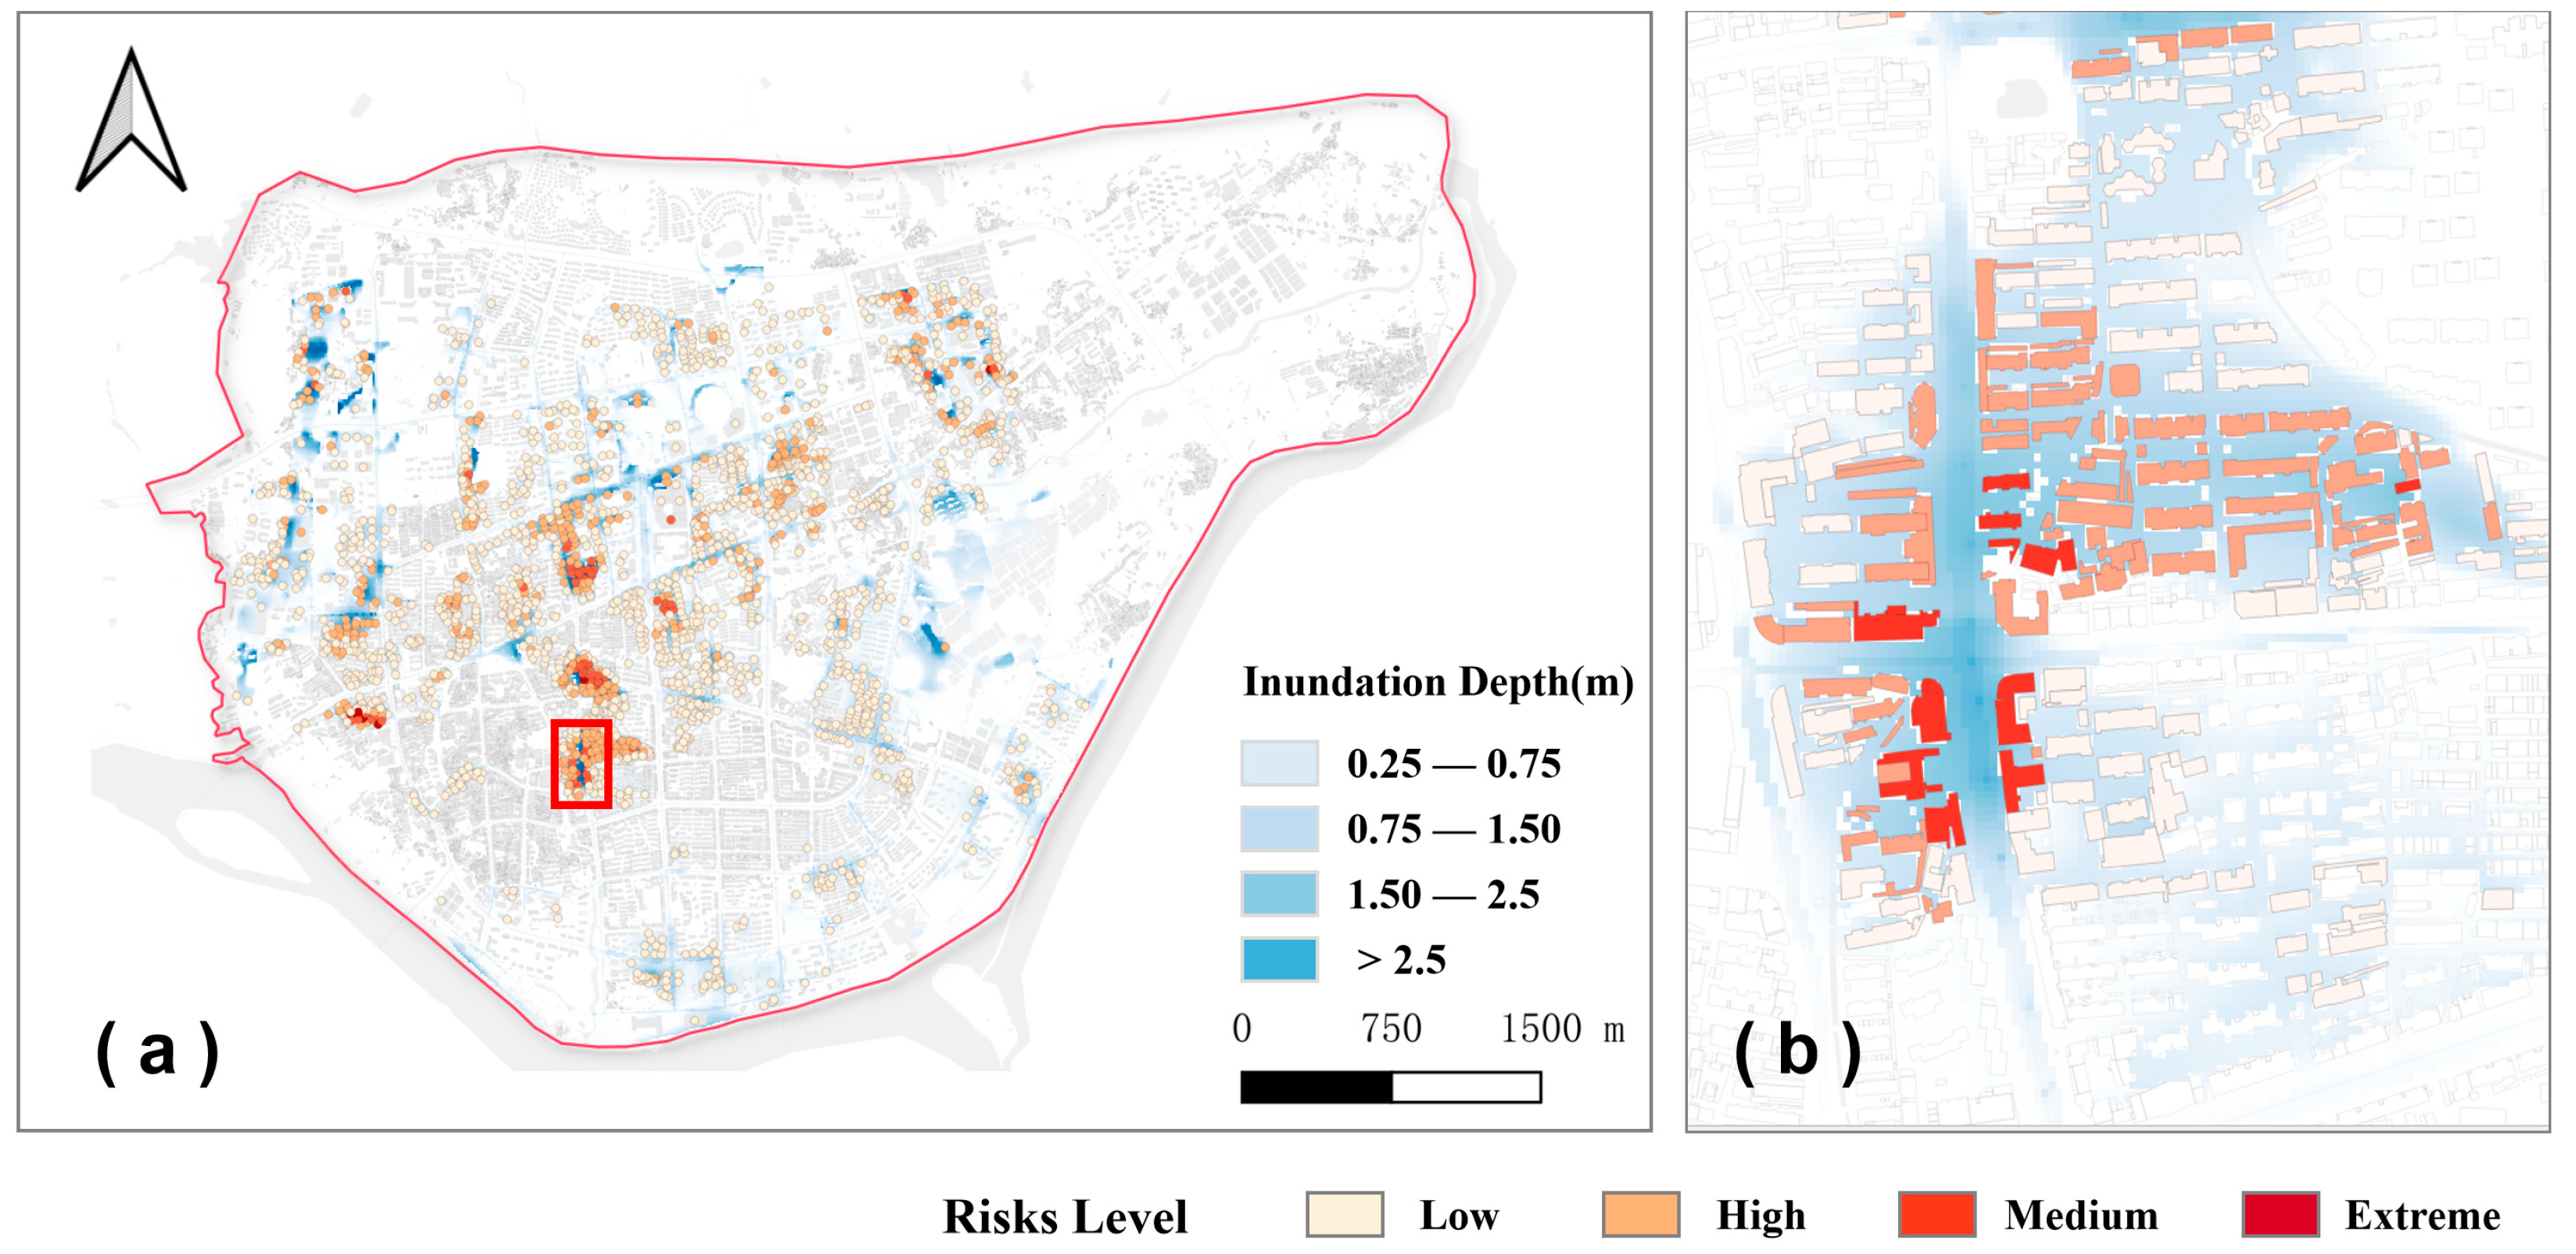
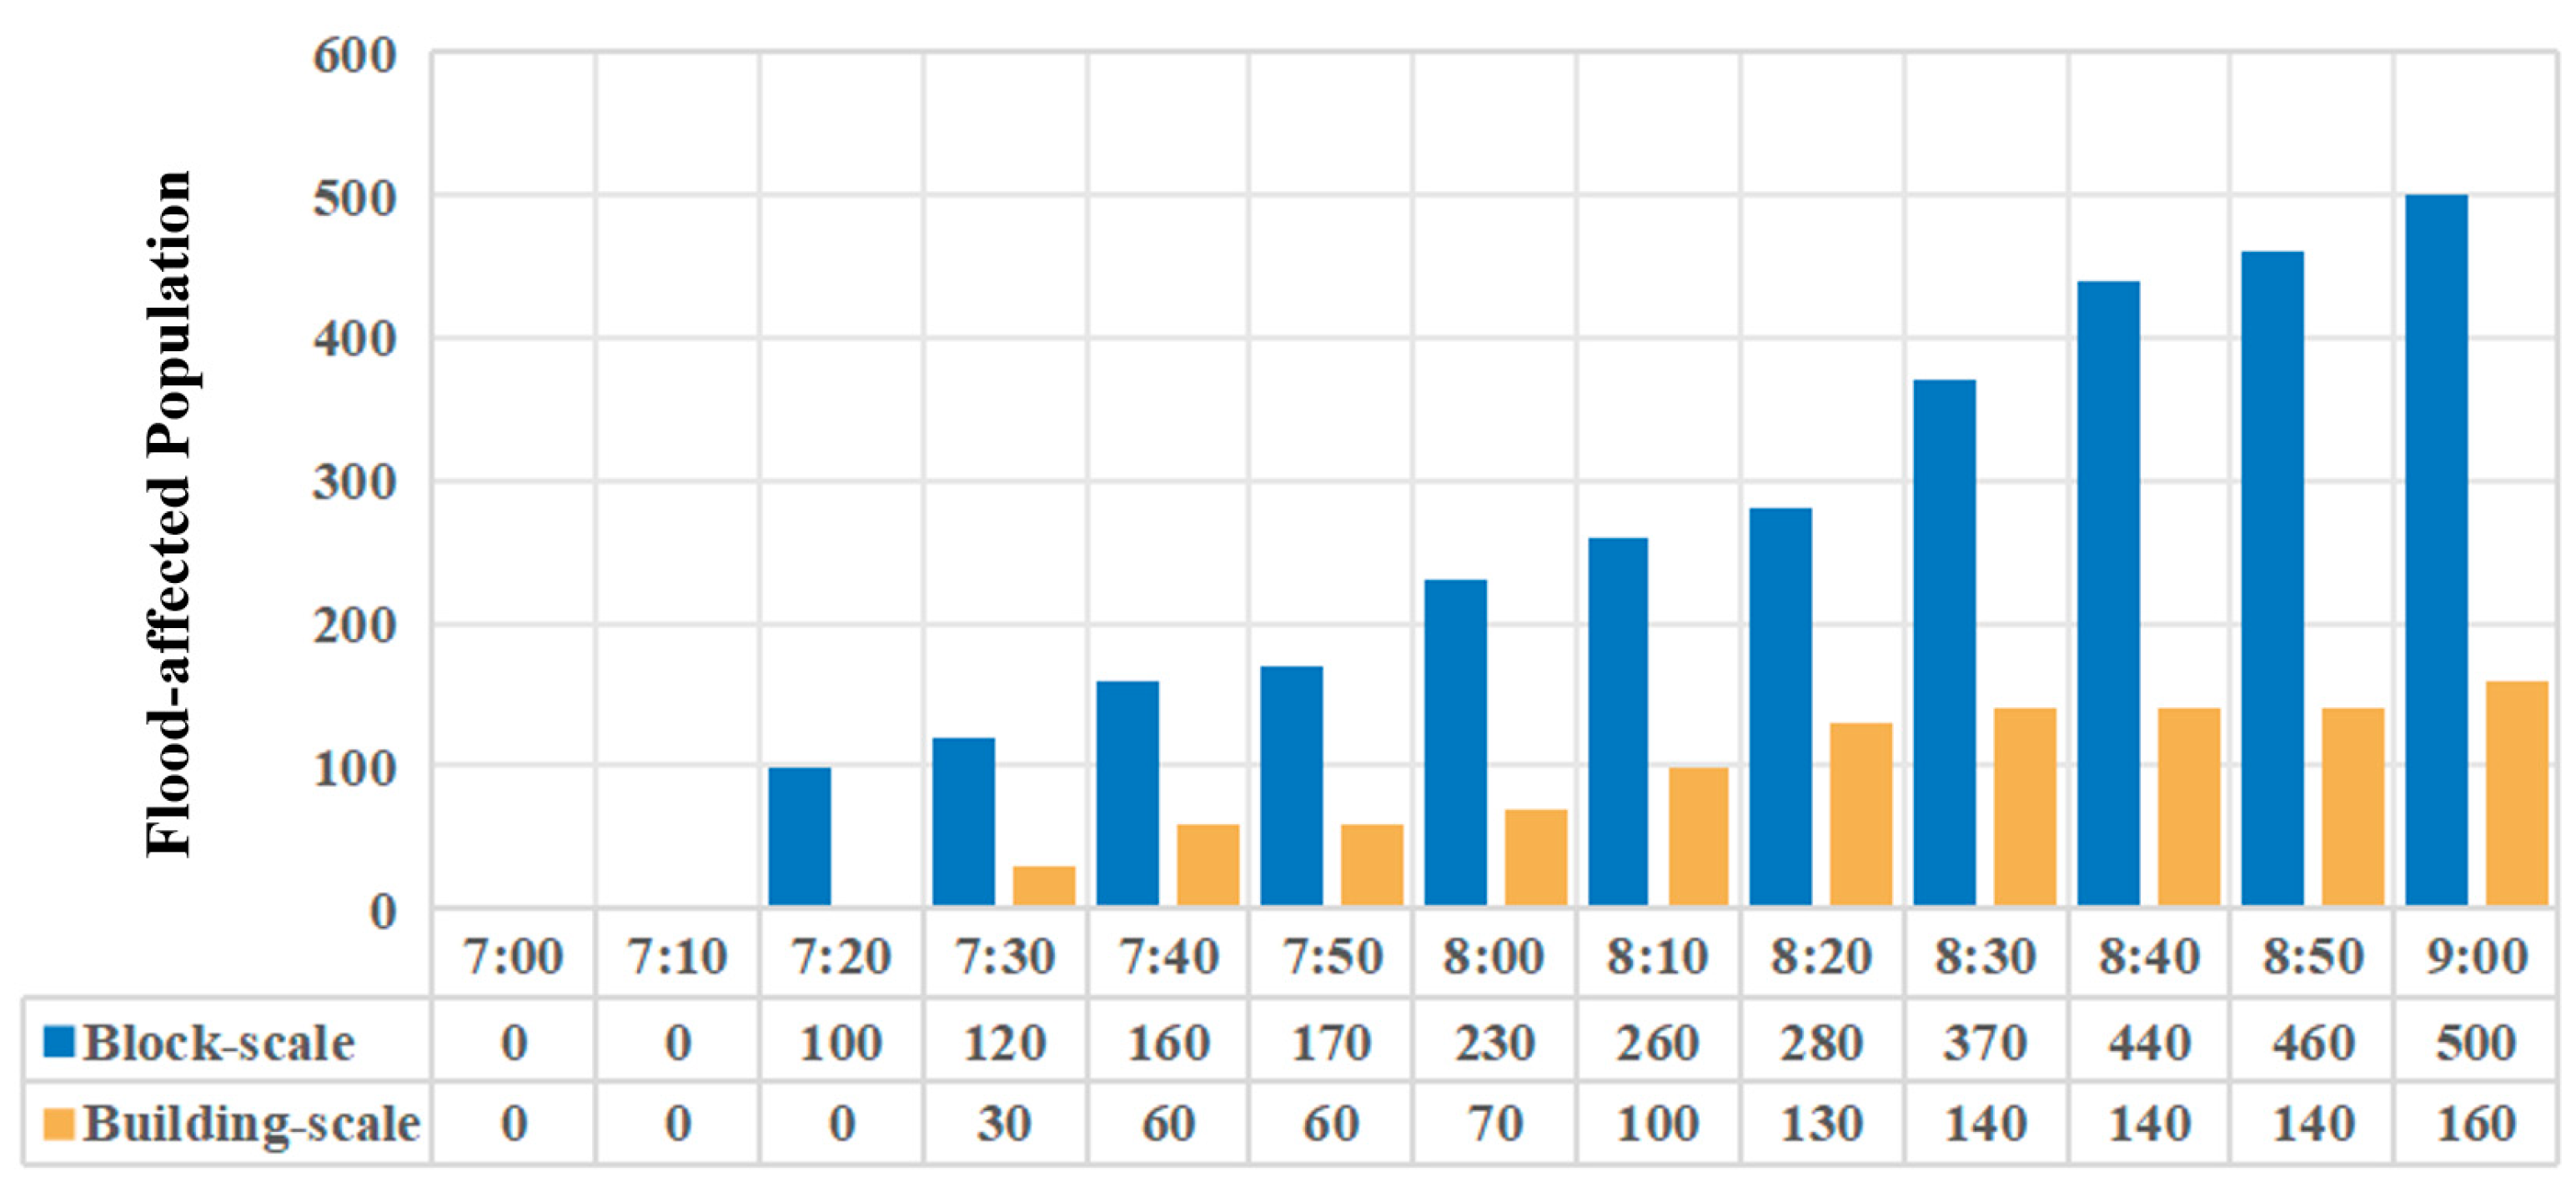
4.3. Results of Dynamic Exposure Assessment
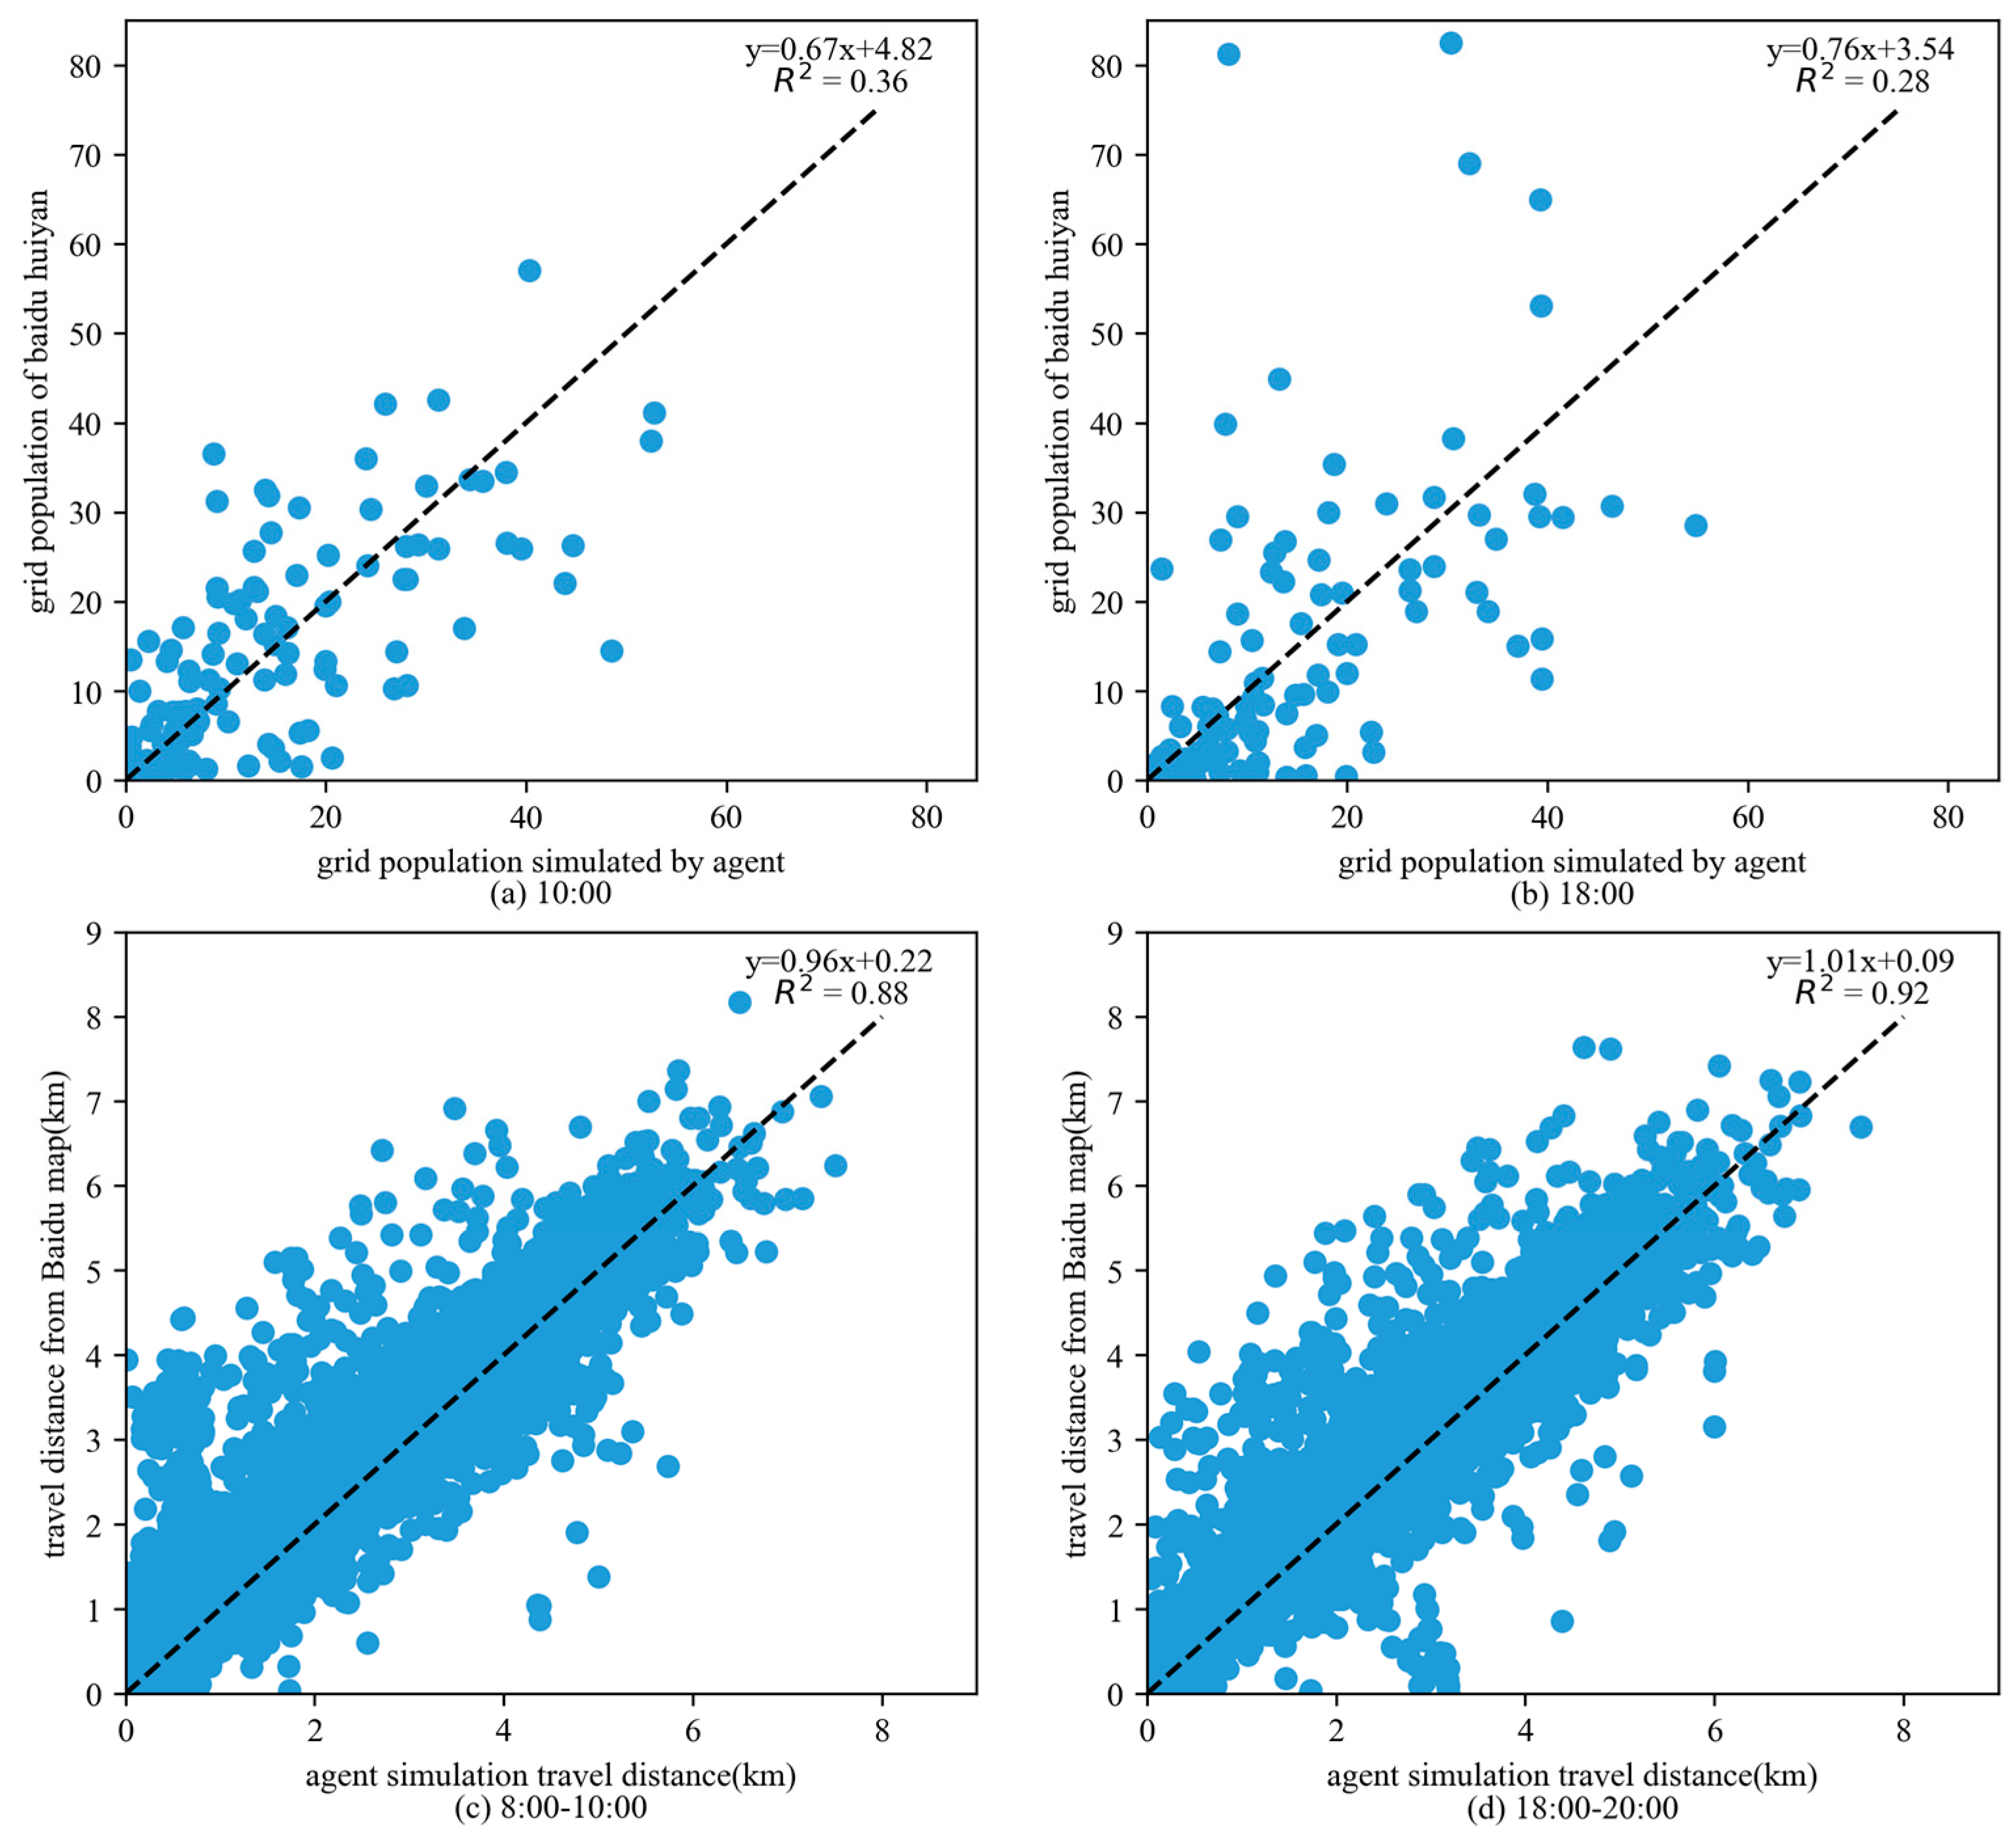
4.4. Comparison with Block-Scale Simulations
5. Conclusions
Author Contributions
Funding
Data Availability Statement
Conflicts of Interest
References
- Slater, L.; Villarini, G.; Archfield, S.; Faulkner, D.; Lamb, R.; Khouakhi, A.; Yin, J. Global Changes in 20-Year, 50-Year, and 100-Year River Floods. Geophys. Res. Lett. 2021, 48, e2020GL091824. [Google Scholar] [CrossRef]
- Zhang, W.; Villarini, G.; Vecchi, G.A.; Smith, J.A. Urbanization Exacerbated the Rainfall and Flooding Caused by Hurricane Harvey in Houston. Nature 2018, 563, 384–388. [Google Scholar] [CrossRef] [PubMed]
- Hallegatte, S.; Green, C.; Nicholls, R.J.; Corfee-Morlot, J. Future Flood Losses in Major Coastal Cities. Nat. Clim. Change 2013, 3, 802–806. [Google Scholar] [CrossRef]
- Batalini De Macedo, M.; Nóbrega Gomes Júnior, M.; Pereira De Oliveira, T.R.; Giacomoni, M.H.; Imani, M.; Zhang, K.; Ambrogi Ferreira Do Lago, C.; Mendiondo, E.M. Low Impact Development Practices in the Context of United Nations Sustainable Development Goals: A New Concept, Lessons Learned and Challenges. Crit. Rev. Environ. Sci. Technol. 2022, 52, 2538–2581. [Google Scholar] [CrossRef]
- Liu, J.; Niyogi, D. Meta-Analysis of Urbanization Impact on Rainfall Modification. Sci. Rep. 2019, 9, 7301. [Google Scholar] [CrossRef]
- Dubbelboer, J.; Nikolic, J.; Jenkins, K.; Hall, J. An Agent-Based Model of Flood Risk and Insurance. J. Artif. Soc. Soc. Simul. 2016, 20, 1258–1278. [Google Scholar] [CrossRef]
- Song, C.; Qu, Z.; Blumm, N.; Barabási, A.-L. Limits of Predictability in Human Mobility. Science 2010, 327, 1018–1021. [Google Scholar] [CrossRef]
- Sivapalan, M.; Savenije, H.H.G.; Blöschl, G. Socio-hydrology: A New Science of People and Water. Hydrol. Process. 2012, 26, 1270–1276. [Google Scholar] [CrossRef]
- Dawson, R.J.; Peppe, R.; Wang, M. An Agent-Based Model for Risk-Based Flood Incident Management. Nat. Hazards 2011, 59, 167–189. [Google Scholar] [CrossRef]
- Alghais, N.; Pullar, D. Modelling Future Impacts of Urban Development in Kuwait with the Use of ABM and GIS. Trans. GIS 2018, 22, 20–42. [Google Scholar] [CrossRef]
- Long, Y.; Shen, Z. Disaggregating Heterogeneous Agent Attributes and Location. Comput. Environ. Urban Syst. 2013, 42, 14–25. [Google Scholar] [CrossRef]
- Crooks, A.; Castle, C.; Batty, M. Key Challenges in Agent-Based Modelling for Geo-Spatial Simulation. Comput. Environ. Urban Syst. 2008, 32, 417–430. [Google Scholar] [CrossRef]
- Zhuo, L.; Han, D. Agent-Based Modelling and Flood Risk Management: A Compendious Literature Review. J. Hydrol. 2020, 591, 125600. [Google Scholar] [CrossRef]
- Zhu, X.; Dai, Q.; Han, D.; Zhuo, L.; Zhu, S.; Zhang, S. Modeling the High-Resolution Dynamic Exposure to Flooding in a City Region. Hydrol. Earth Syst. Sci. 2019, 23, 3353–3372. [Google Scholar] [CrossRef]
- O’Shea, T.; Bates, P.; Neal, J. Testing the Impact of Direct and Indirect Flood Warnings on Population Behaviour Using an Agent-Based Model. Nat. Hazards Earth Syst. Sci. 2020, 20, 2281–2305. [Google Scholar] [CrossRef]
- Elshafei, Y.; Sivapalan, M.; Tonts, M.; Hipsey, M.R. A Prototype Framework for Models of Socio-Hydrology: Identification of Key Feedback Loops and Parameterisation Approach. Hydrol. Earth Syst. Sci. 2014, 18, 2141–2166. [Google Scholar] [CrossRef]
- Pezanowski, S.; MacEachren, A.M.; Savelyev, A.; Robinson, A.C. SensePlace3: A Geovisual Framework to Analyze Place–Time–Attribute Information in Social Media. Cartogr. Geogr. Inf. Sci. 2018, 45, 420–437. [Google Scholar] [CrossRef]
- Iliadis, C.; Galiatsatou, P.; Glenis, V.; Prinos, P.; Kilsby, C. Urban Flood Modelling under Extreme Rainfall Conditions for Building-Level Flood Exposure Analysis. Hydrology 2023, 10, 172. [Google Scholar] [CrossRef]
- de Ruig, L.T.; Haer, T.; de Moel, H.; Botzen, W.J.W.; Aerts, J.C.J.H. A Micro-Scale Cost-Benefit Analysis of Building-Level Flood Risk Adaptation Measures in Los Angeles. Water Resour. Econ. 2019, 32, 100147. [Google Scholar] [CrossRef]
- Zhu, S.; Dai, Q.; Zhao, B.; Shao, J. Assessment of Population Exposure to Urban Flood at the Building Scale. Water 2020, 12, 3253. [Google Scholar] [CrossRef]
- Hossain, M.K.; Meng, Q. A Fine-Scale Spatial Analytics of the Assessment and Mapping of Buildings and Population at Different Risk Levels of Urban Flood. Land Use Policy 2020, 99, 104829. [Google Scholar] [CrossRef]
- Goodchild, M.F. Scale in GIS: An Overview. Geomorphology 2011, 130, 5–9. [Google Scholar] [CrossRef]
- Niu, N.; Liu, X.; Jin, H.; Ye, X.; Liu, Y.; Li, X.; Chen, Y.; Li, S. Integrating Multi-Source Big Data to Infer Building Functions. Int. J. Geogr. Inf. Sci. 2017, 31, 1871–1890. [Google Scholar] [CrossRef]
- Du, E.; Cai, X.; Sun, Z.; Minsker, B. Exploring the Role of Social Media and Individual Behaviors in Flood Evacuation Processes: An Agent-Based Modeling Approach: OPINION DYNAMICS WITH SOCIAL MEDIA. Water Resour. Res. 2017, 53, 9164–9180. [Google Scholar] [CrossRef]
- Huang, Q.; Cervone, G.; Zhang, G. A Cloud-Enabled Automatic Disaster Analysis System of Multi-Sourced Data Streams: An Example Synthesizing Social Media, Remote Sensing and Wikipedia Data. Comput. Environ. Urban Syst. 2017, 66, 23–37. [Google Scholar] [CrossRef]
- Wang, Y.; Chen, A.S.; Fu, G.; Djordjević, S.; Zhang, C.; Savić, D.A. An Integrated Framework for High-Resolution Urban Flood Modelling Considering Multiple Information Sources and Urban Features. Environ. Model. Softw. 2018, 107, 85–95. [Google Scholar] [CrossRef]
- Baranowski, D.B.; Flatau, M.K.; Flatau, P.J.; Karnawati, D.; Barabasz, K.; Labuz, M.; Latos, B.; Schmidt, J.M.; Paski, J.A.I. Marzuki Social-Media and Newspaper Reports Reveal Large-Scale Meteorological Drivers of Floods on Sumatra. Nat. Commun. 2020, 11, 2503. [Google Scholar] [CrossRef]
- Zhou, M.; Li, J.; Basu, R.; Ferreira, J. Creating Spatially-Detailed Heterogeneous Synthetic Populations for Agent-Based Microsimulation. Comput. Environ. Urban Syst. 2022, 91, 101717. [Google Scholar] [CrossRef]
- Liu, Y.; Liu, X.; Gao, S.; Gong, L.; Kang, C.; Zhi, Y.; Chi, G.; Shi, L. Social Sensing: A New Approach to Understanding Our Socioeconomic Environments. Ann. Assoc. Am. Geogr. 2015, 105, 512–530. [Google Scholar] [CrossRef]
- Dai, Q.; Zhu, X.; Zhuo, L.; Han, D.; Liu, Z.; Zhang, S. A Hazard-Human Coupled Model (HazardCM) to Assess City Dynamic Exposure to Rainfall-Triggered Natural Hazards. Environ. Model. Softw. 2020, 127, 104684. [Google Scholar] [CrossRef]
- Yu, C.; Ren, F.; Du, Q.; Zhao, Z.; Nie, K. Web Map-Based POI Visualization for Spatial Decision Support. Cartogr. Geogr. Inf. Sci. 2013, 40, 172–182. [Google Scholar] [CrossRef]
- Gao, S.; Janowicz, K.; Couclelis, H. Extracting Urban Functional Regions from Points of Interest and Human Activities on Location-Based Social Networks. Trans. GIS 2017, 21, 446–467. [Google Scholar] [CrossRef]
- Liu, X.; Niu, N.; Liu, X.; Jin, H.; Ou, J.; Jiao, L.; Liu, Y. Characterizing Mixed-Use Buildings Based on Multi-Source Big Data. Int. J. Geogr. Inf. Sci. 2018, 32, 738–756. [Google Scholar] [CrossRef]
- Hu, S.; He, Z.; Wu, L.; Yin, L.; Xu, Y.; Cui, H. A Framework for Extracting Urban Functional Regions Based on Multiprototype Word Embeddings Using Points-of-Interest Data. Comput. Environ. Urban Syst. 2020, 80, 101442. [Google Scholar] [CrossRef]
- Chen, W.; Zhou, Y.; Wu, Q.; Chen, G.; Huang, X.; Yu, B. Urban Building Type Mapping Using Geospatial Data: A Case Study of Beijing, China. Remote Sens. 2020, 12, 2805. [Google Scholar] [CrossRef]
- Psyllidis, A.; Gao, S.; Hu, Y.; Kim, E.-K.; McKenzie, G.; Purves, R.; Yuan, M.; Andris, C. Points of Interest (POI): A Commentary on the State of the Art, Challenges, and Prospects for the Future. Comput. Urban Sci. 2022, 2, 20. [Google Scholar] [CrossRef]
- Lin, A.; Sun, X.; Wu, H.; Luo, W.; Wang, D.; Zhong, D.; Wang, Z.; Zhao, L.; Zhu, J. Identifying Urban Building Function by Integrating Remote Sensing Imagery and POI Data. IEEE J. Sel. Top. Appl. Earth Obs. Remote Sens. 2021, 14, 8864–8875. [Google Scholar] [CrossRef]
- House-Peters, L.A.; Chang, H. Urban Water Demand Modeling: Review of Concepts, Methods, and Organizing Principles. Water Resour. Res. 2011, 47, 2010WR009624. [Google Scholar] [CrossRef]
- Chapizanis, D.; Karakitsios, S.; Gotti, A.; Sarigiannis, D.A. Assessing Personal Exposure Using Agent Based Modelling Informed by Sensors Technology. Environ. Res. 2021, 192, 110141. [Google Scholar] [CrossRef]
- Taillandier, P.; Gaudou, B.; Grignard, A.; Huynh, Q.-N.; Marilleau, N.; Caillou, P.; Philippon, D.; Drogoul, A. Building, Composing and Experimenting Complex Spatial Models with the GAMA Platform. GeoInformatica 2019, 23, 299–322. [Google Scholar] [CrossRef]
- Zhu, J.; Dai, Q.; Deng, Y.; Zhang, A.; Zhang, Y.; Zhang, S. Indirect Damage of Urban Flooding: Investigation of Flood-Induced Traffic Congestion Using Dynamic Modeling. Water 2018, 10, 622. [Google Scholar] [CrossRef]
- Zhao, X.; Zhou, Y.; Chen, W.; Li, X.; Li, X.; Li, D. Mapping Hourly Population Dynamics Using Remotely Sensed and Geospatial Data: A Case Study in Beijing, China. GIScience Remote Sens. 2021, 58, 717–732. [Google Scholar] [CrossRef]
- Ye, P.; Ye, Z.; Xia, J.; Zhong, L.; Zhang, M.; Lv, L.; Tu, W.; Yue, Y.; Li, Q. National-Scale 1-Km Maps of Hospital Travel Time and Hospital Accessibility in China. Sci. Data 2024, 11, 1130. [Google Scholar] [CrossRef] [PubMed]


Disclaimer/Publisher’s Note: The statements, opinions and data contained in all publications are solely those of the individual author(s) and contributor(s) and not of MDPI and/or the editor(s). MDPI and/or the editor(s) disclaim responsibility for any injury to people or property resulting from any ideas, methods, instructions or products referred to in the content. |
© 2025 by the authors. Licensee MDPI, Basel, Switzerland. This article is an open access article distributed under the terms and conditions of the Creative Commons Attribution (CC BY) license (https://creativecommons.org/licenses/by/4.0/).
Share and Cite
Zhu, S.; Yang, X.; Yang, J.; Zhang, J.; Dai, Q.; Liu, Z. Dynamic Assessment of Population Exposure to Urban Flooding Considering Building Characteristics. Land 2025, 14, 832. https://doi.org/10.3390/land14040832
Zhu S, Yang X, Yang J, Zhang J, Dai Q, Liu Z. Dynamic Assessment of Population Exposure to Urban Flooding Considering Building Characteristics. Land. 2025; 14(4):832. https://doi.org/10.3390/land14040832
Chicago/Turabian StyleZhu, Shaonan, Xin Yang, Jiabao Yang, Jun Zhang, Qiang Dai, and Zhenzhen Liu. 2025. "Dynamic Assessment of Population Exposure to Urban Flooding Considering Building Characteristics" Land 14, no. 4: 832. https://doi.org/10.3390/land14040832
APA StyleZhu, S., Yang, X., Yang, J., Zhang, J., Dai, Q., & Liu, Z. (2025). Dynamic Assessment of Population Exposure to Urban Flooding Considering Building Characteristics. Land, 14(4), 832. https://doi.org/10.3390/land14040832