
An Integrated Trivariate-Dimensional Statistical and Hydrodynamic Modeling Method for Compound Flood Hazard Assessment in a Coastal City


Abstract
1. Introduction
2. Materials and Methods
2.1. Study Area and Data Sources
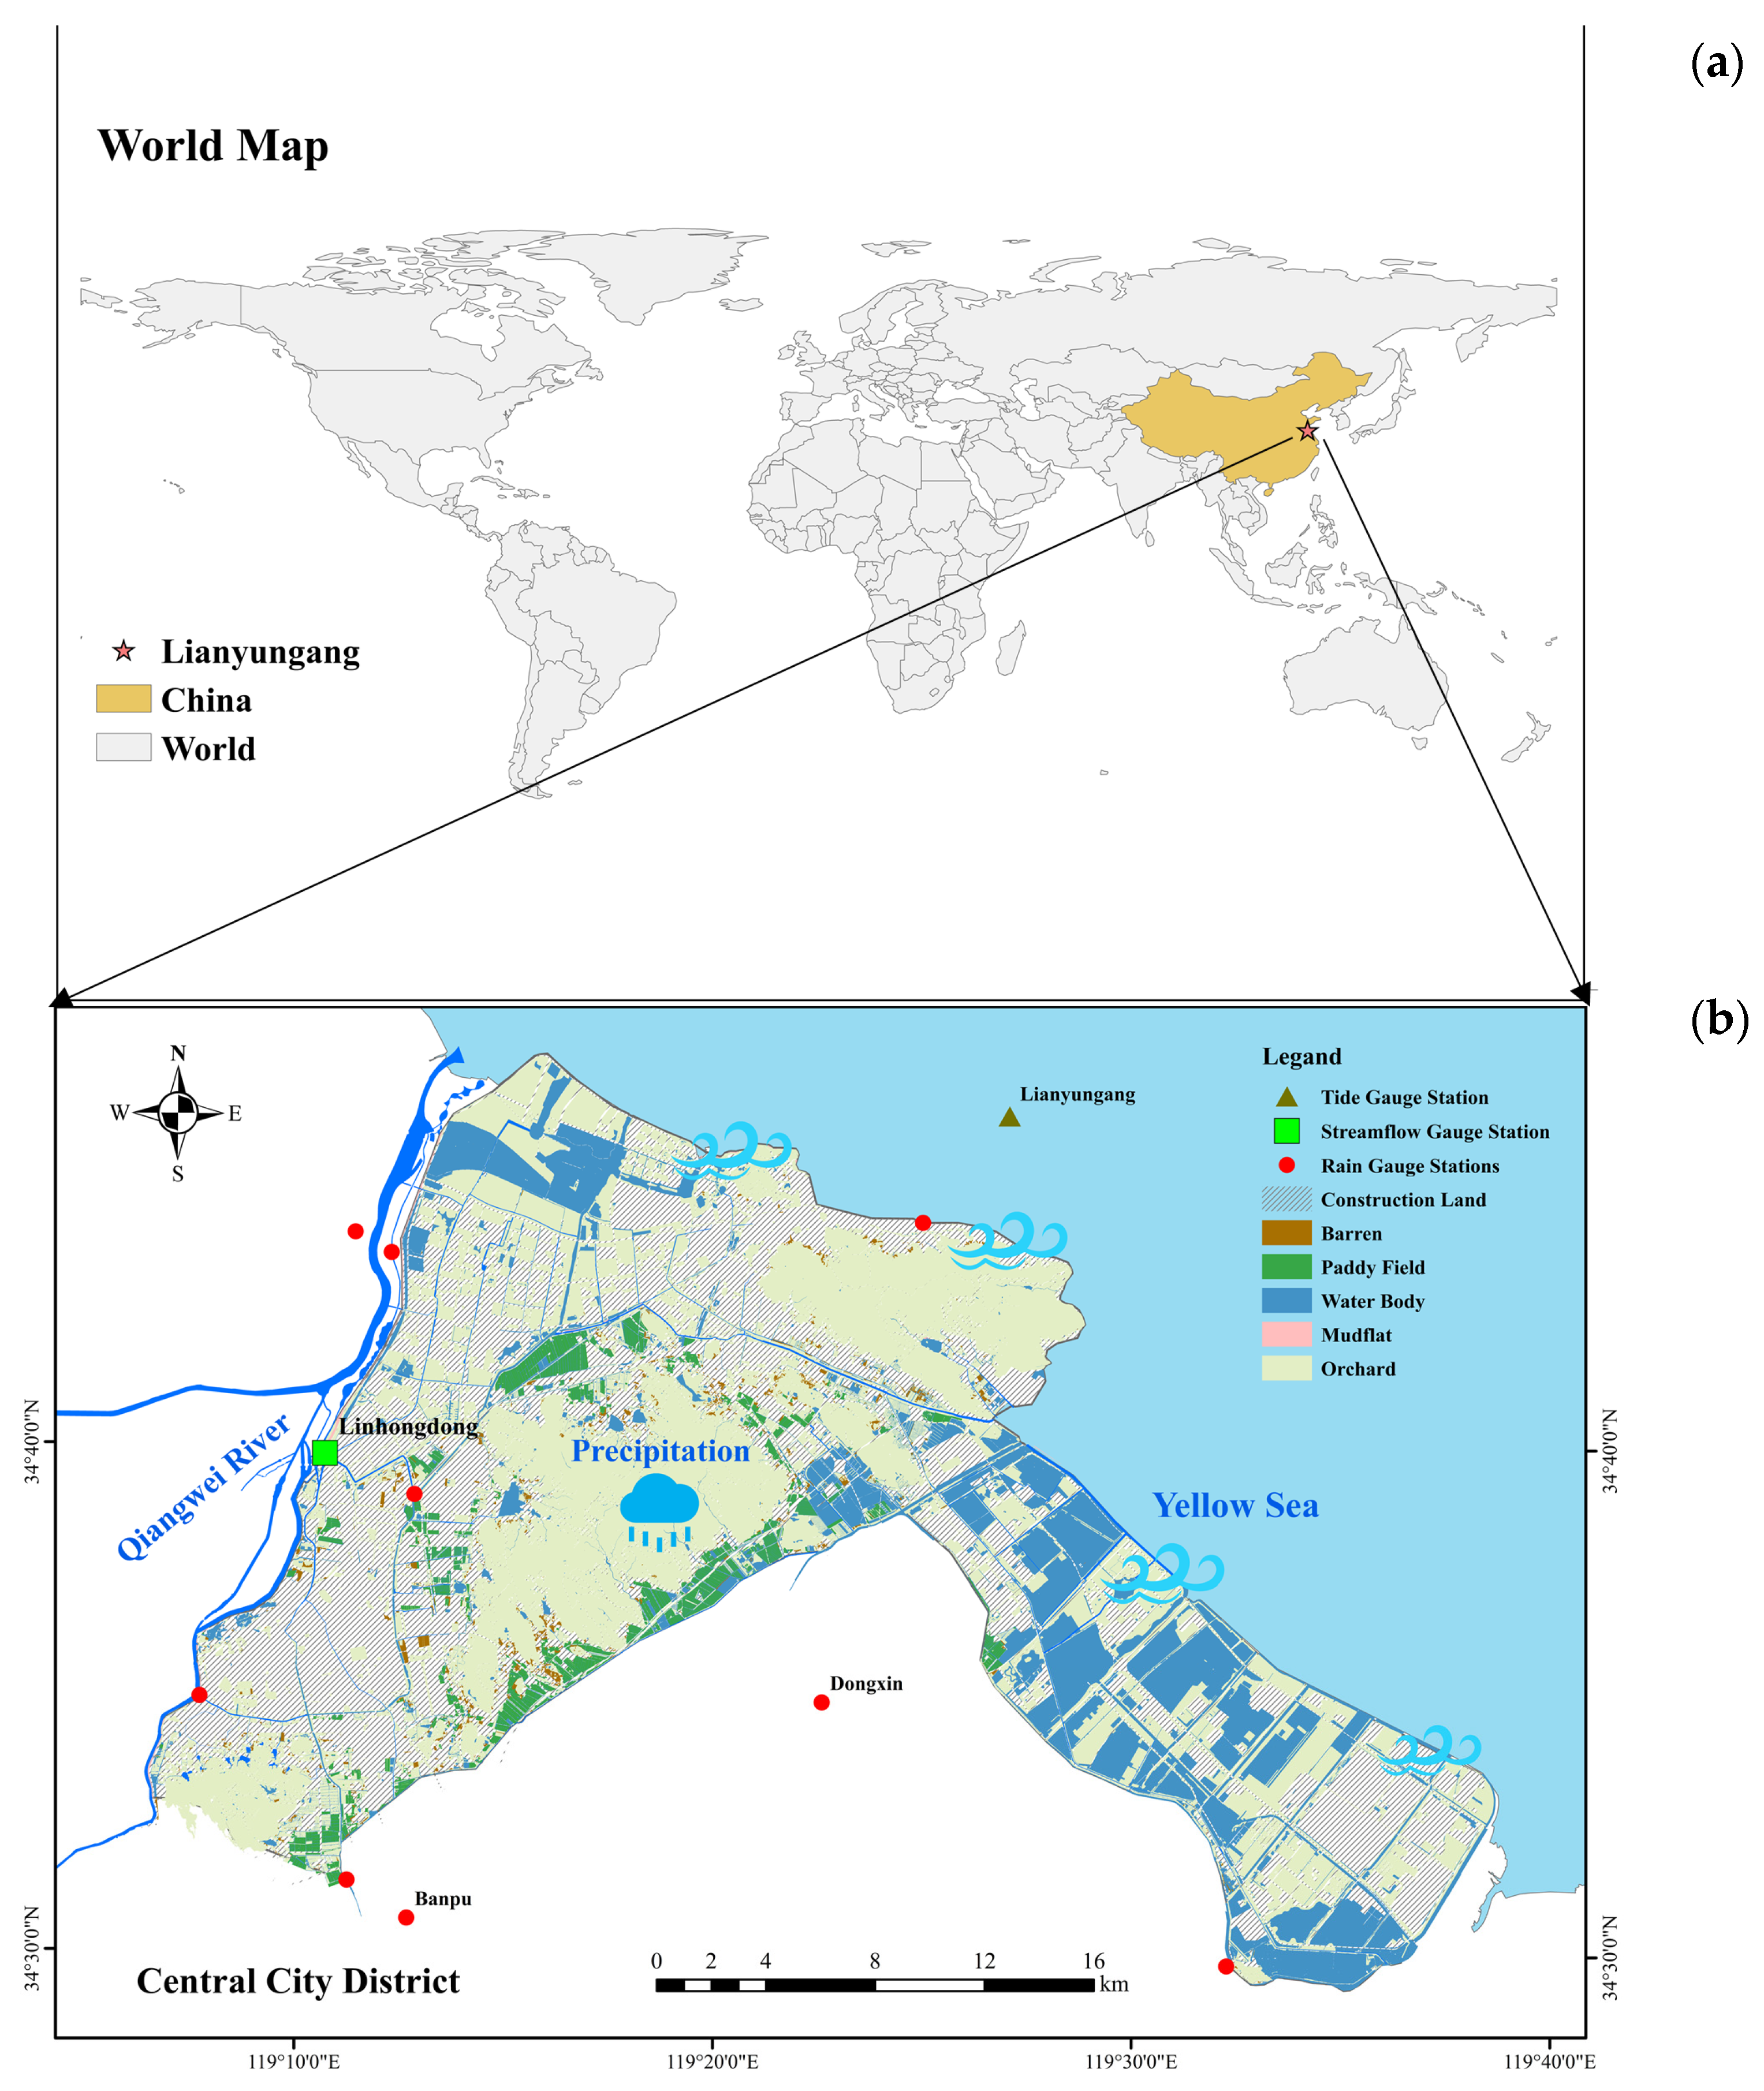
2.1.1. Study Area
2.1.2. Data Sources
2.1.3. Extraction of Flood Characteristics
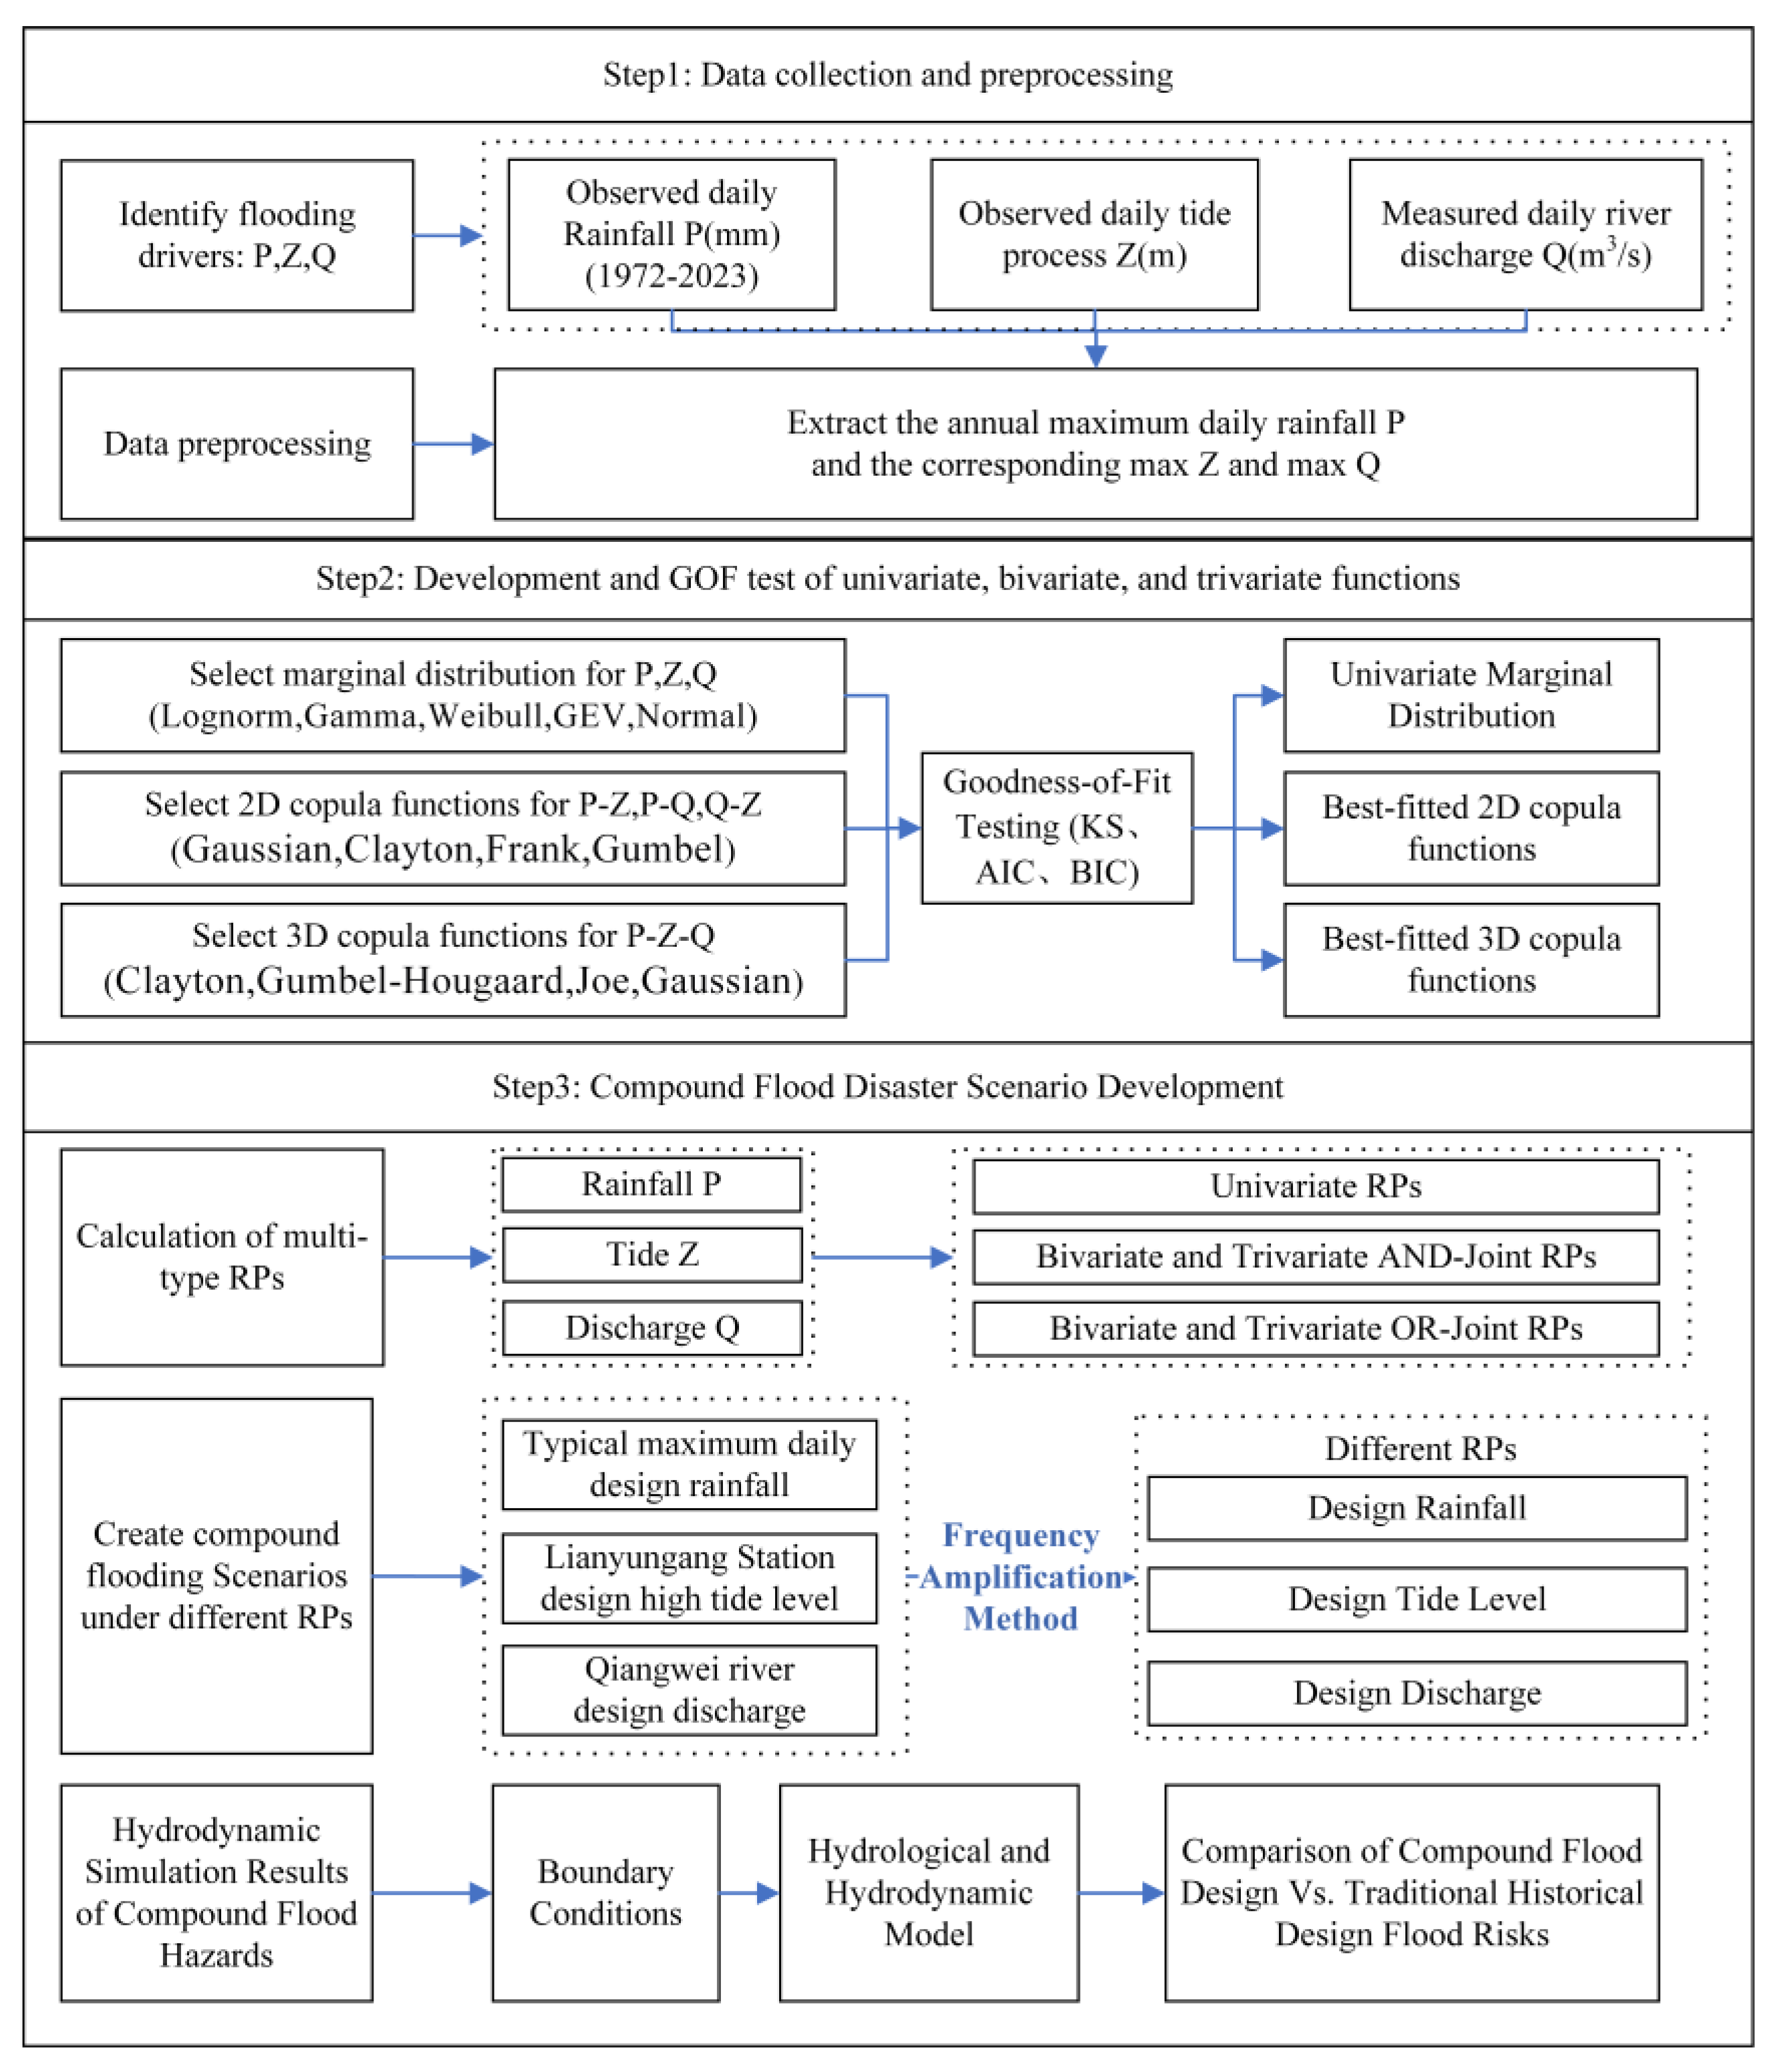
2.2. Methodology
2.2.1. Statistical Model
- 1.
- Marginal Distribution Functions
- 2.
- Copula Functions
- 3.
- Goodness-of-Fit Testing
2.2.2. Joint Probability Distribution and Return Periods
2.2.3. Hydrodynamic Model Setup
Hydrological Model
1D River Network Hydrodynamic Model
1D Pipe Network Model
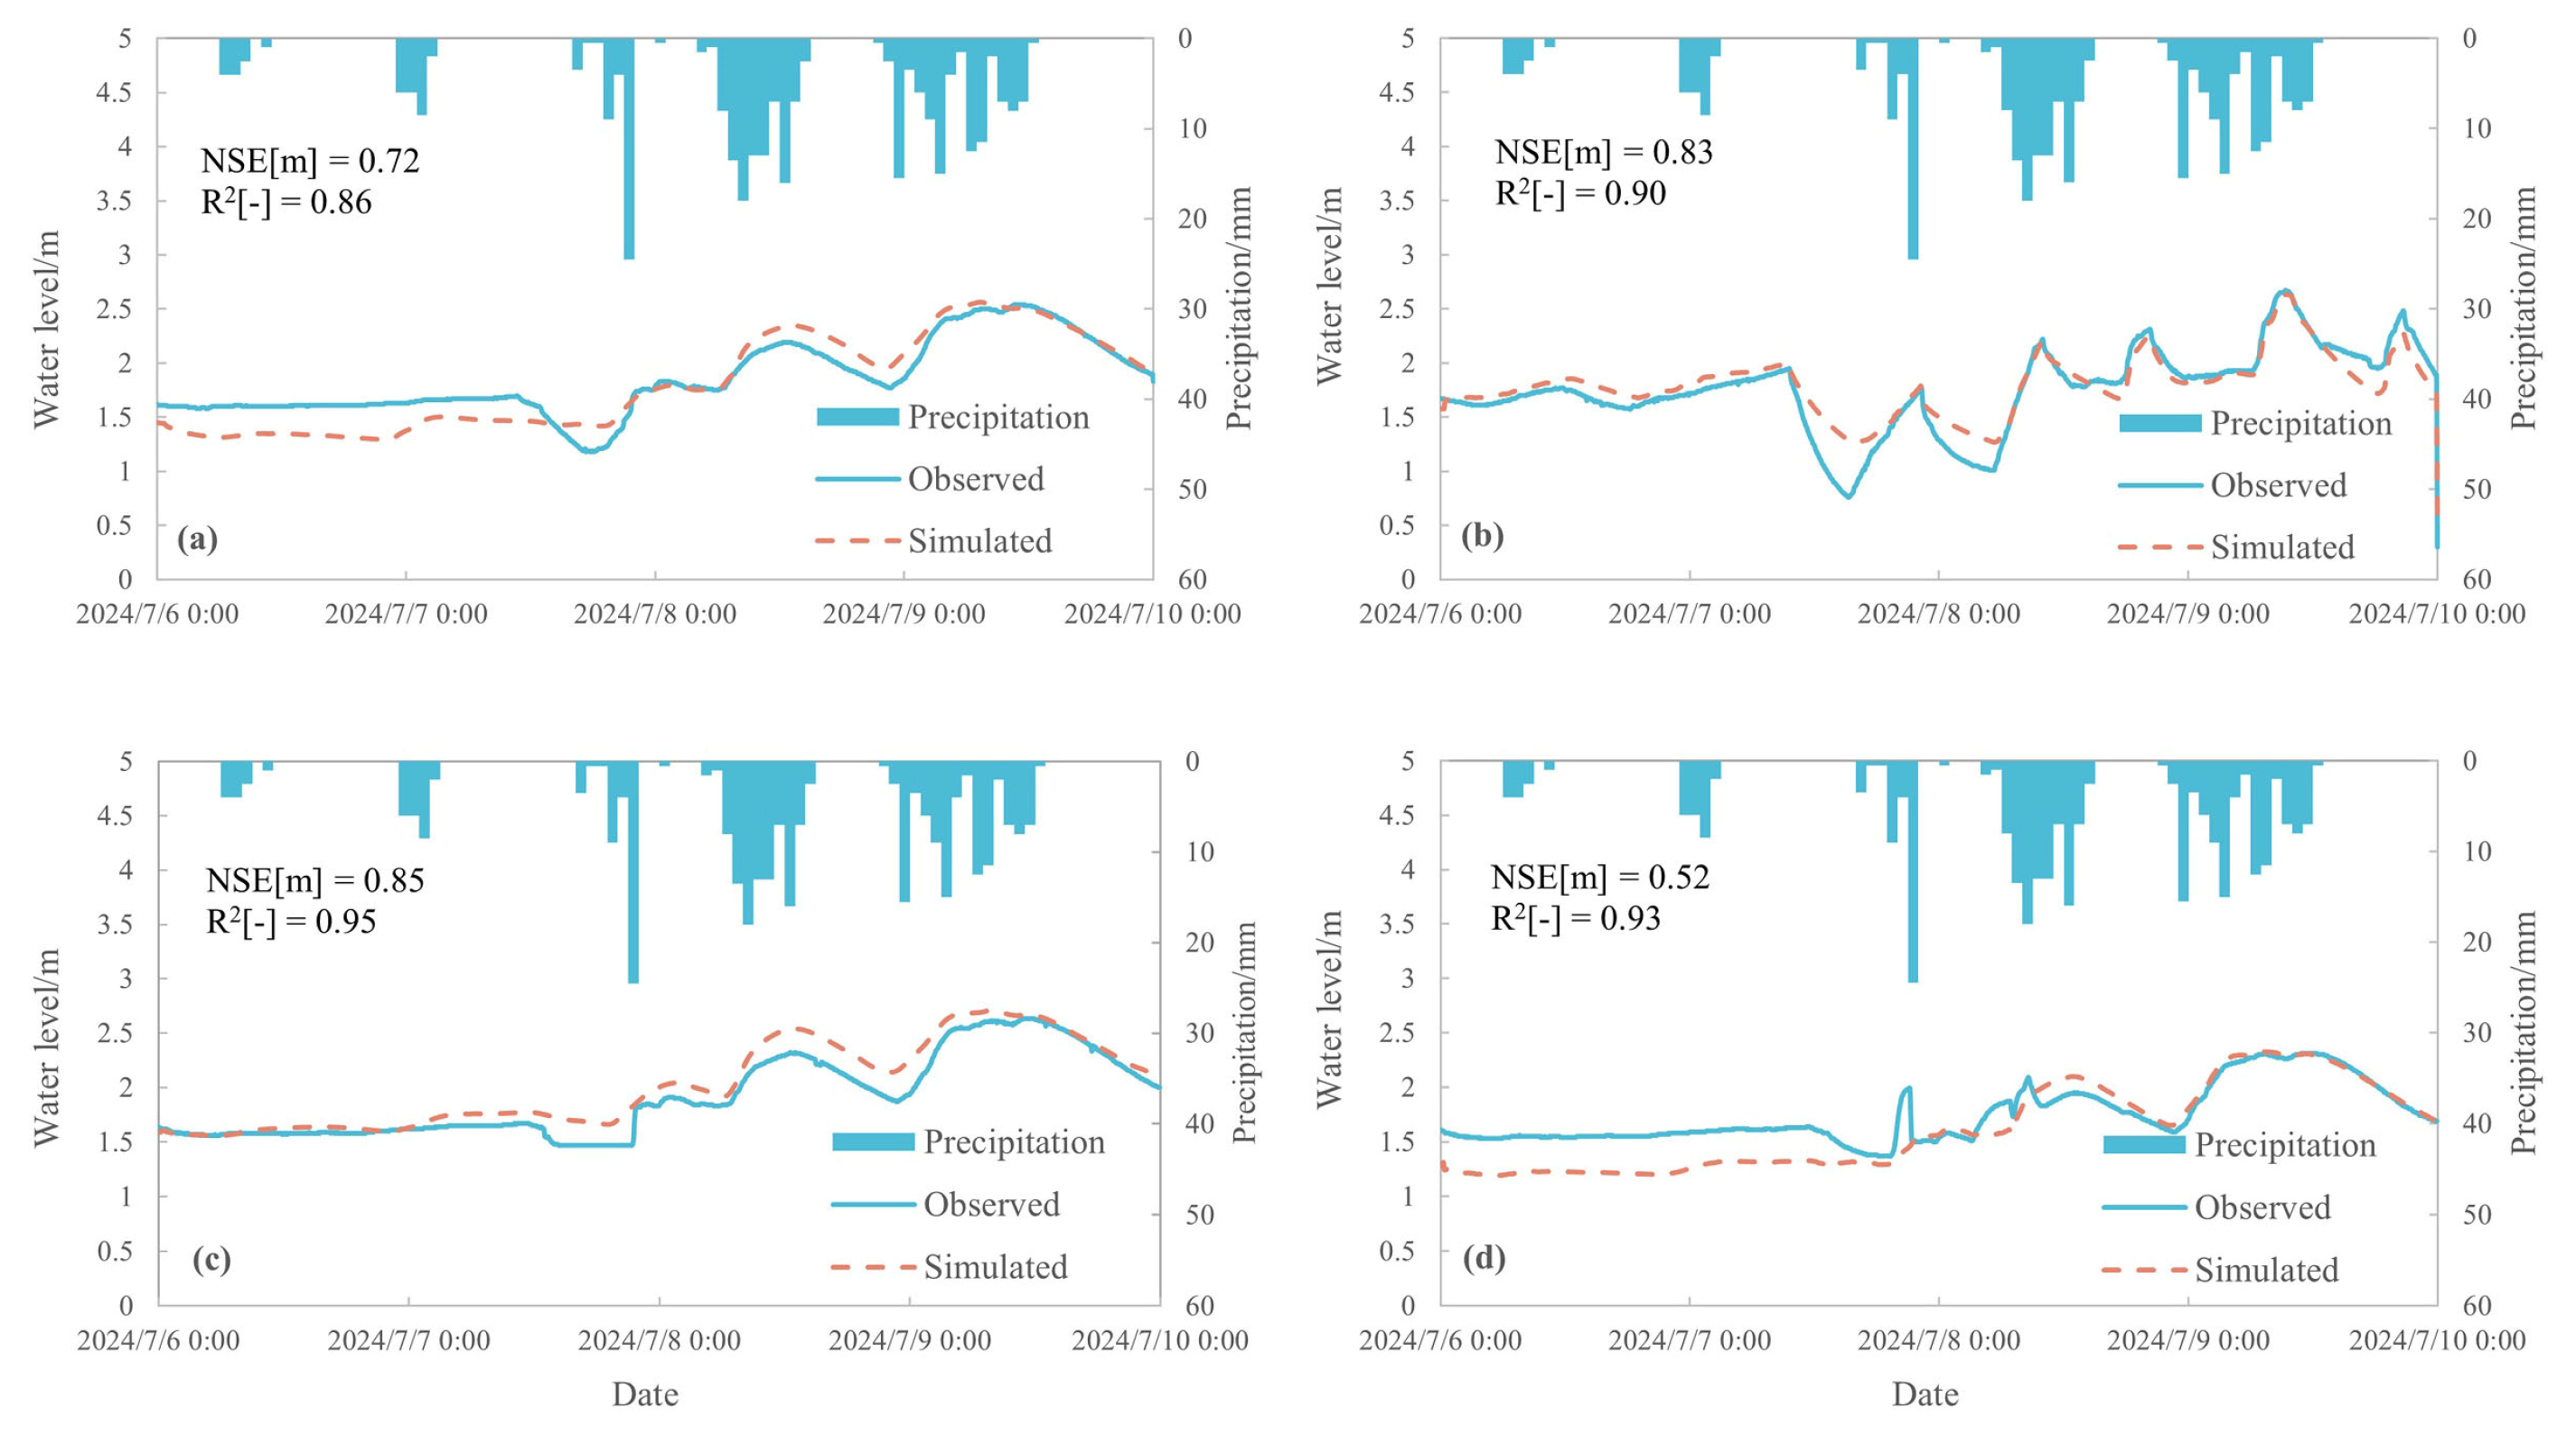
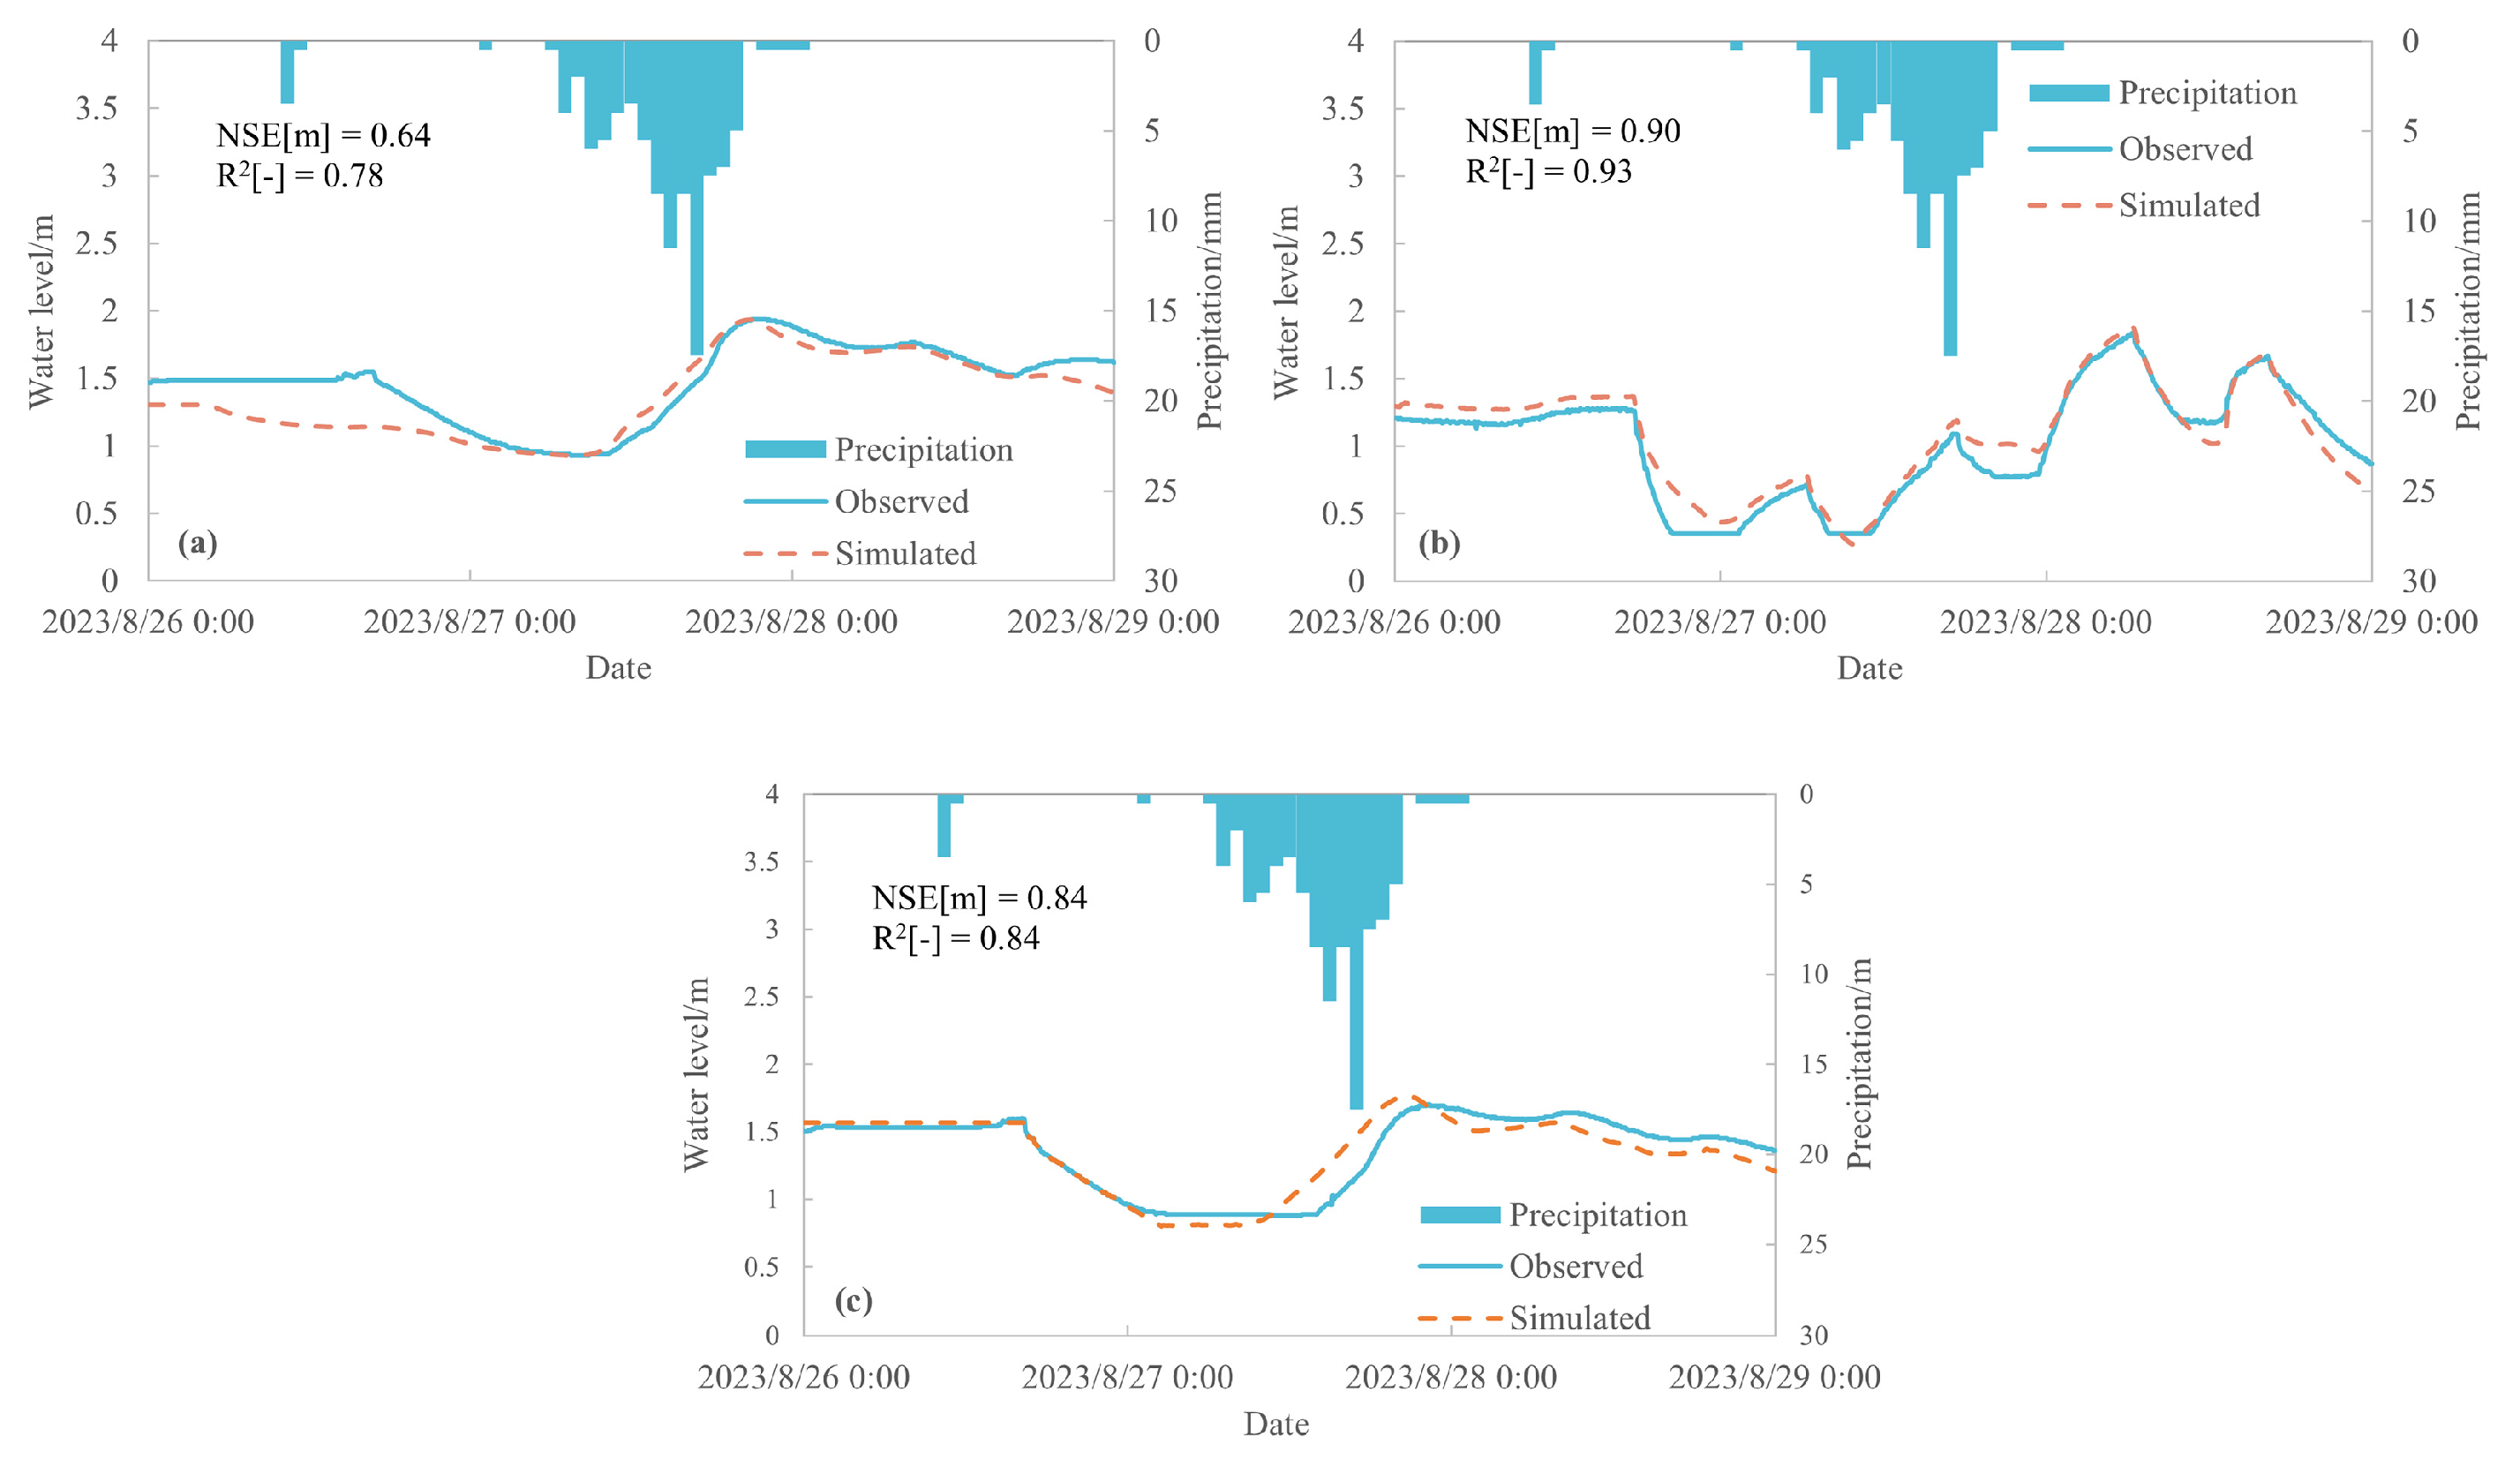
2.2.4. Model Calibration
2.2.5. Integration of Statistical and Hydrodynamic Model
2.2.6. Steps of Amplification Flood Hazard Assessment Caused by Precipitation, River Discharge and Total Water Level
3. Results
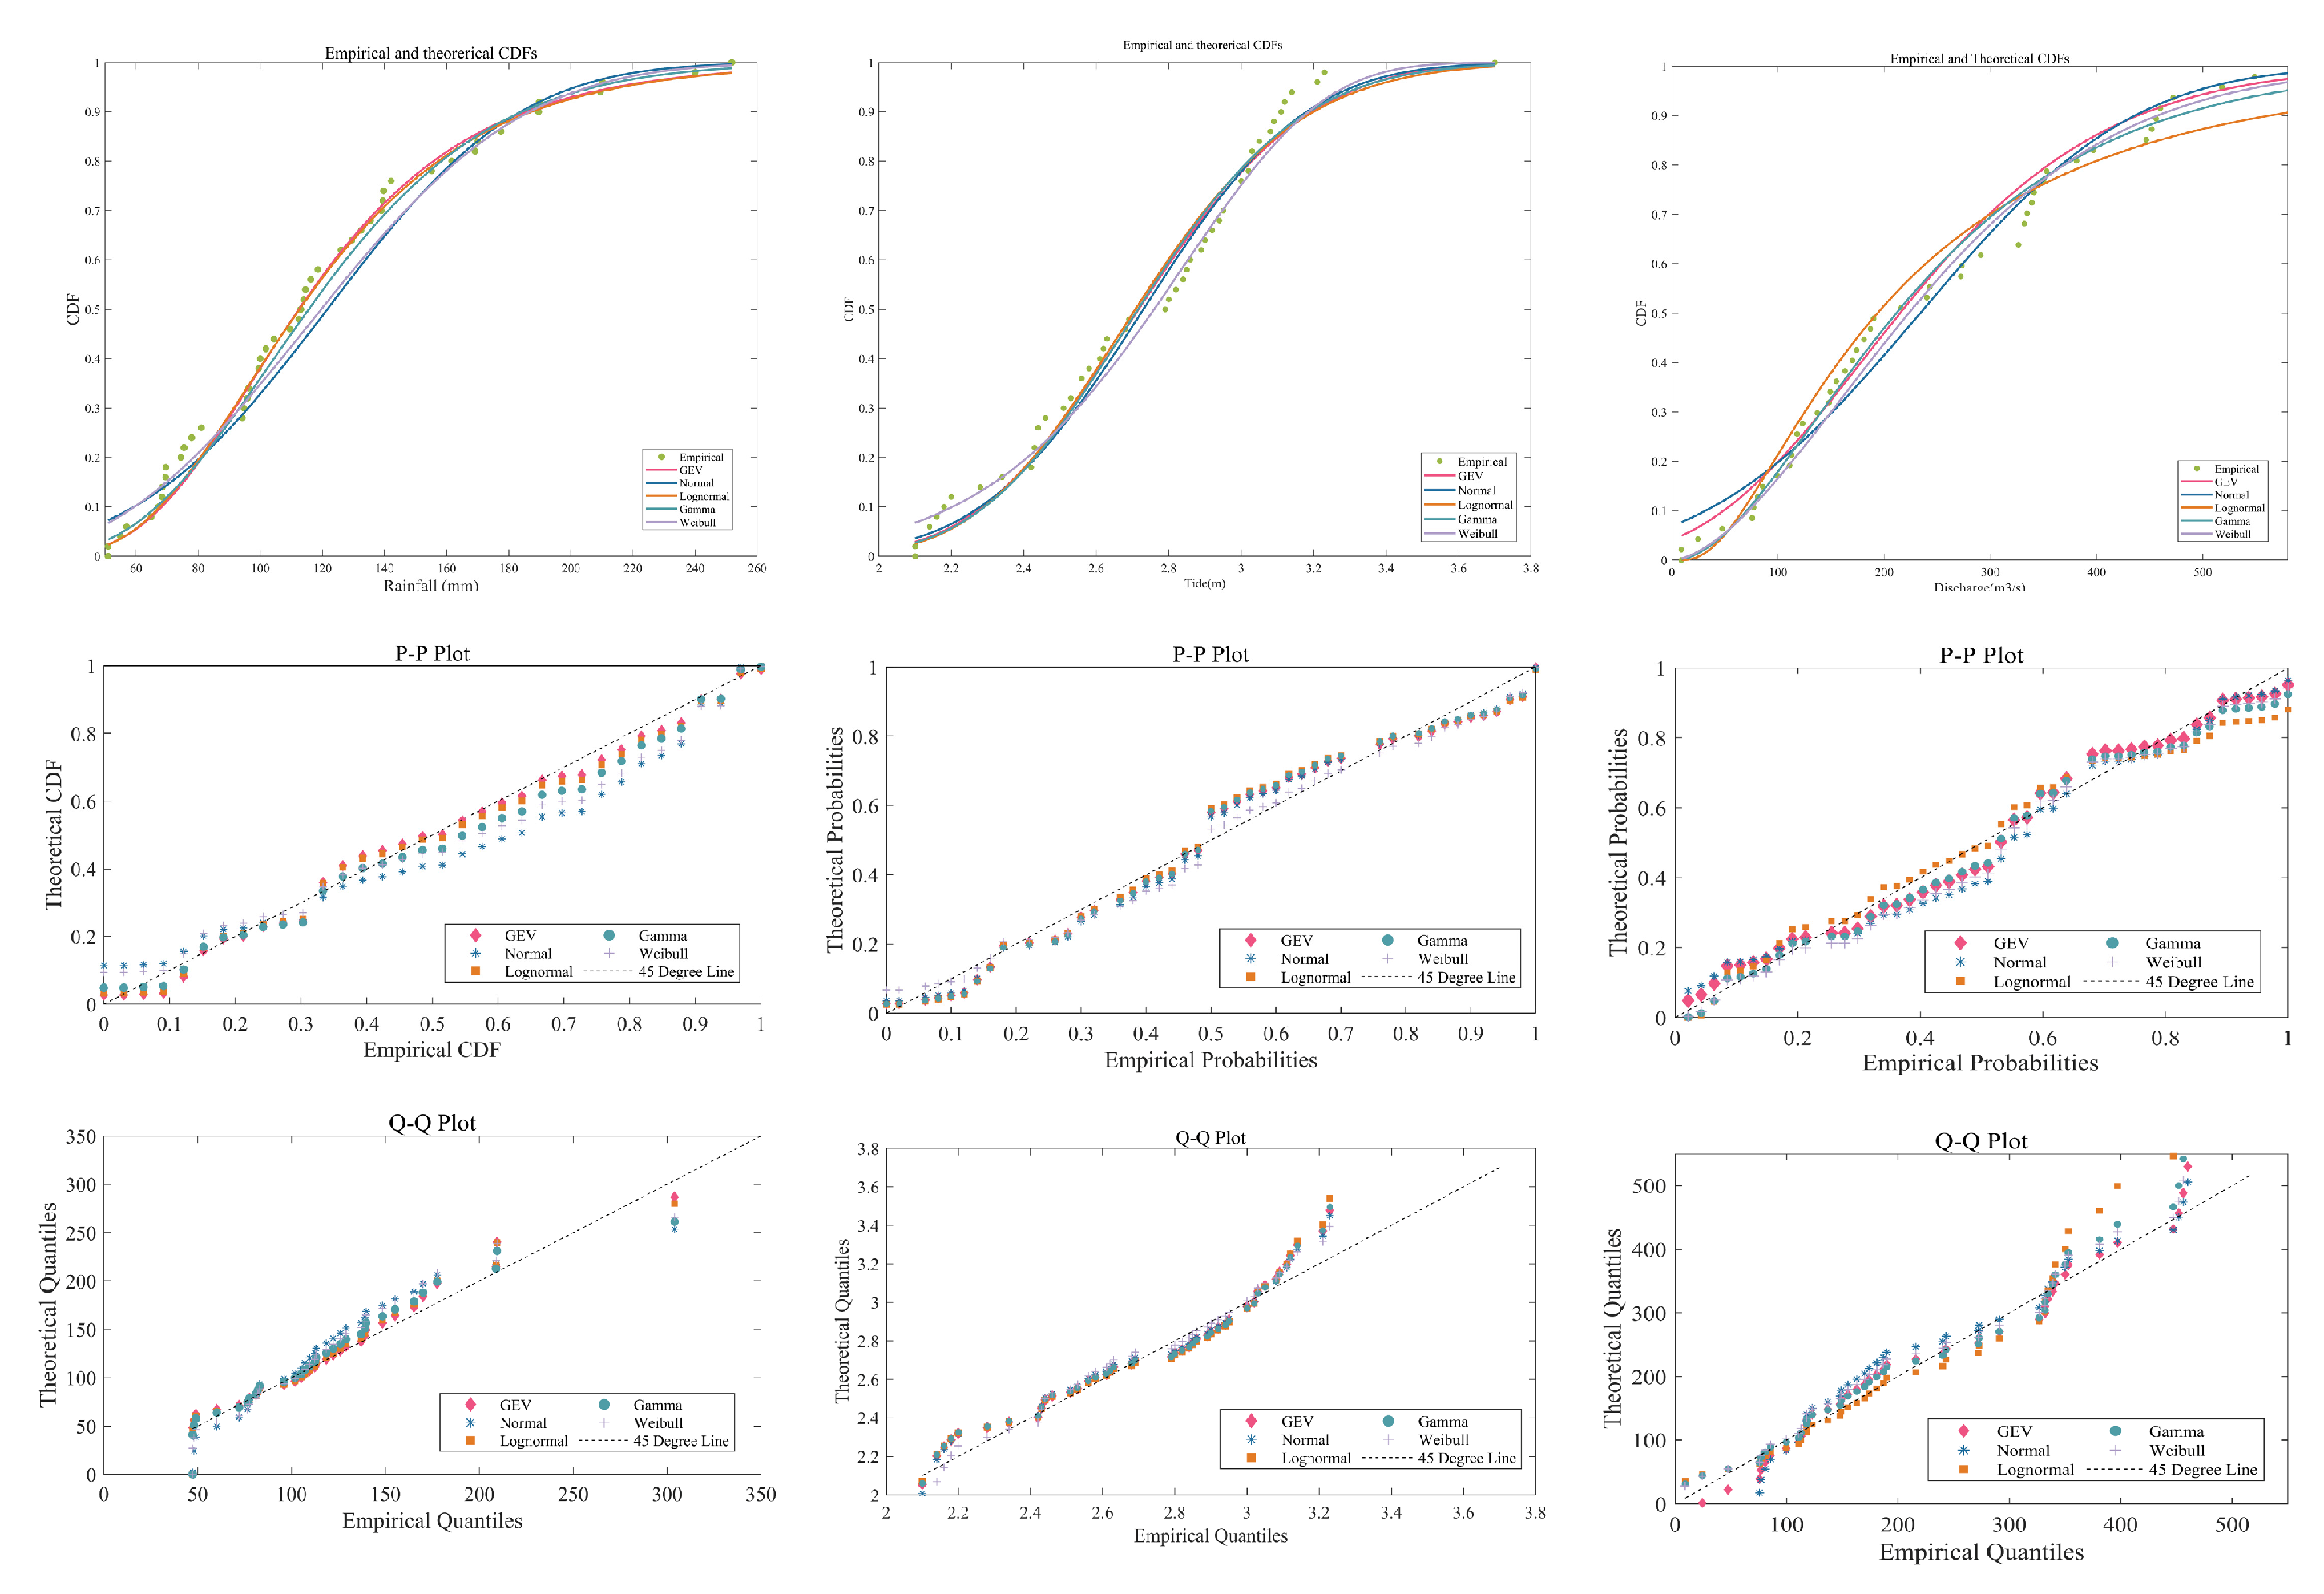
3.1. Performance of Marginal Distributions
3.2. Copula Function in Bivariate Modeling and Estimation of Dependency Parameters
3.3. Optimal Trivariate Copula Joint Modelling
3.4. Return Periods of Univariate and Trivariate Flood Characteristics
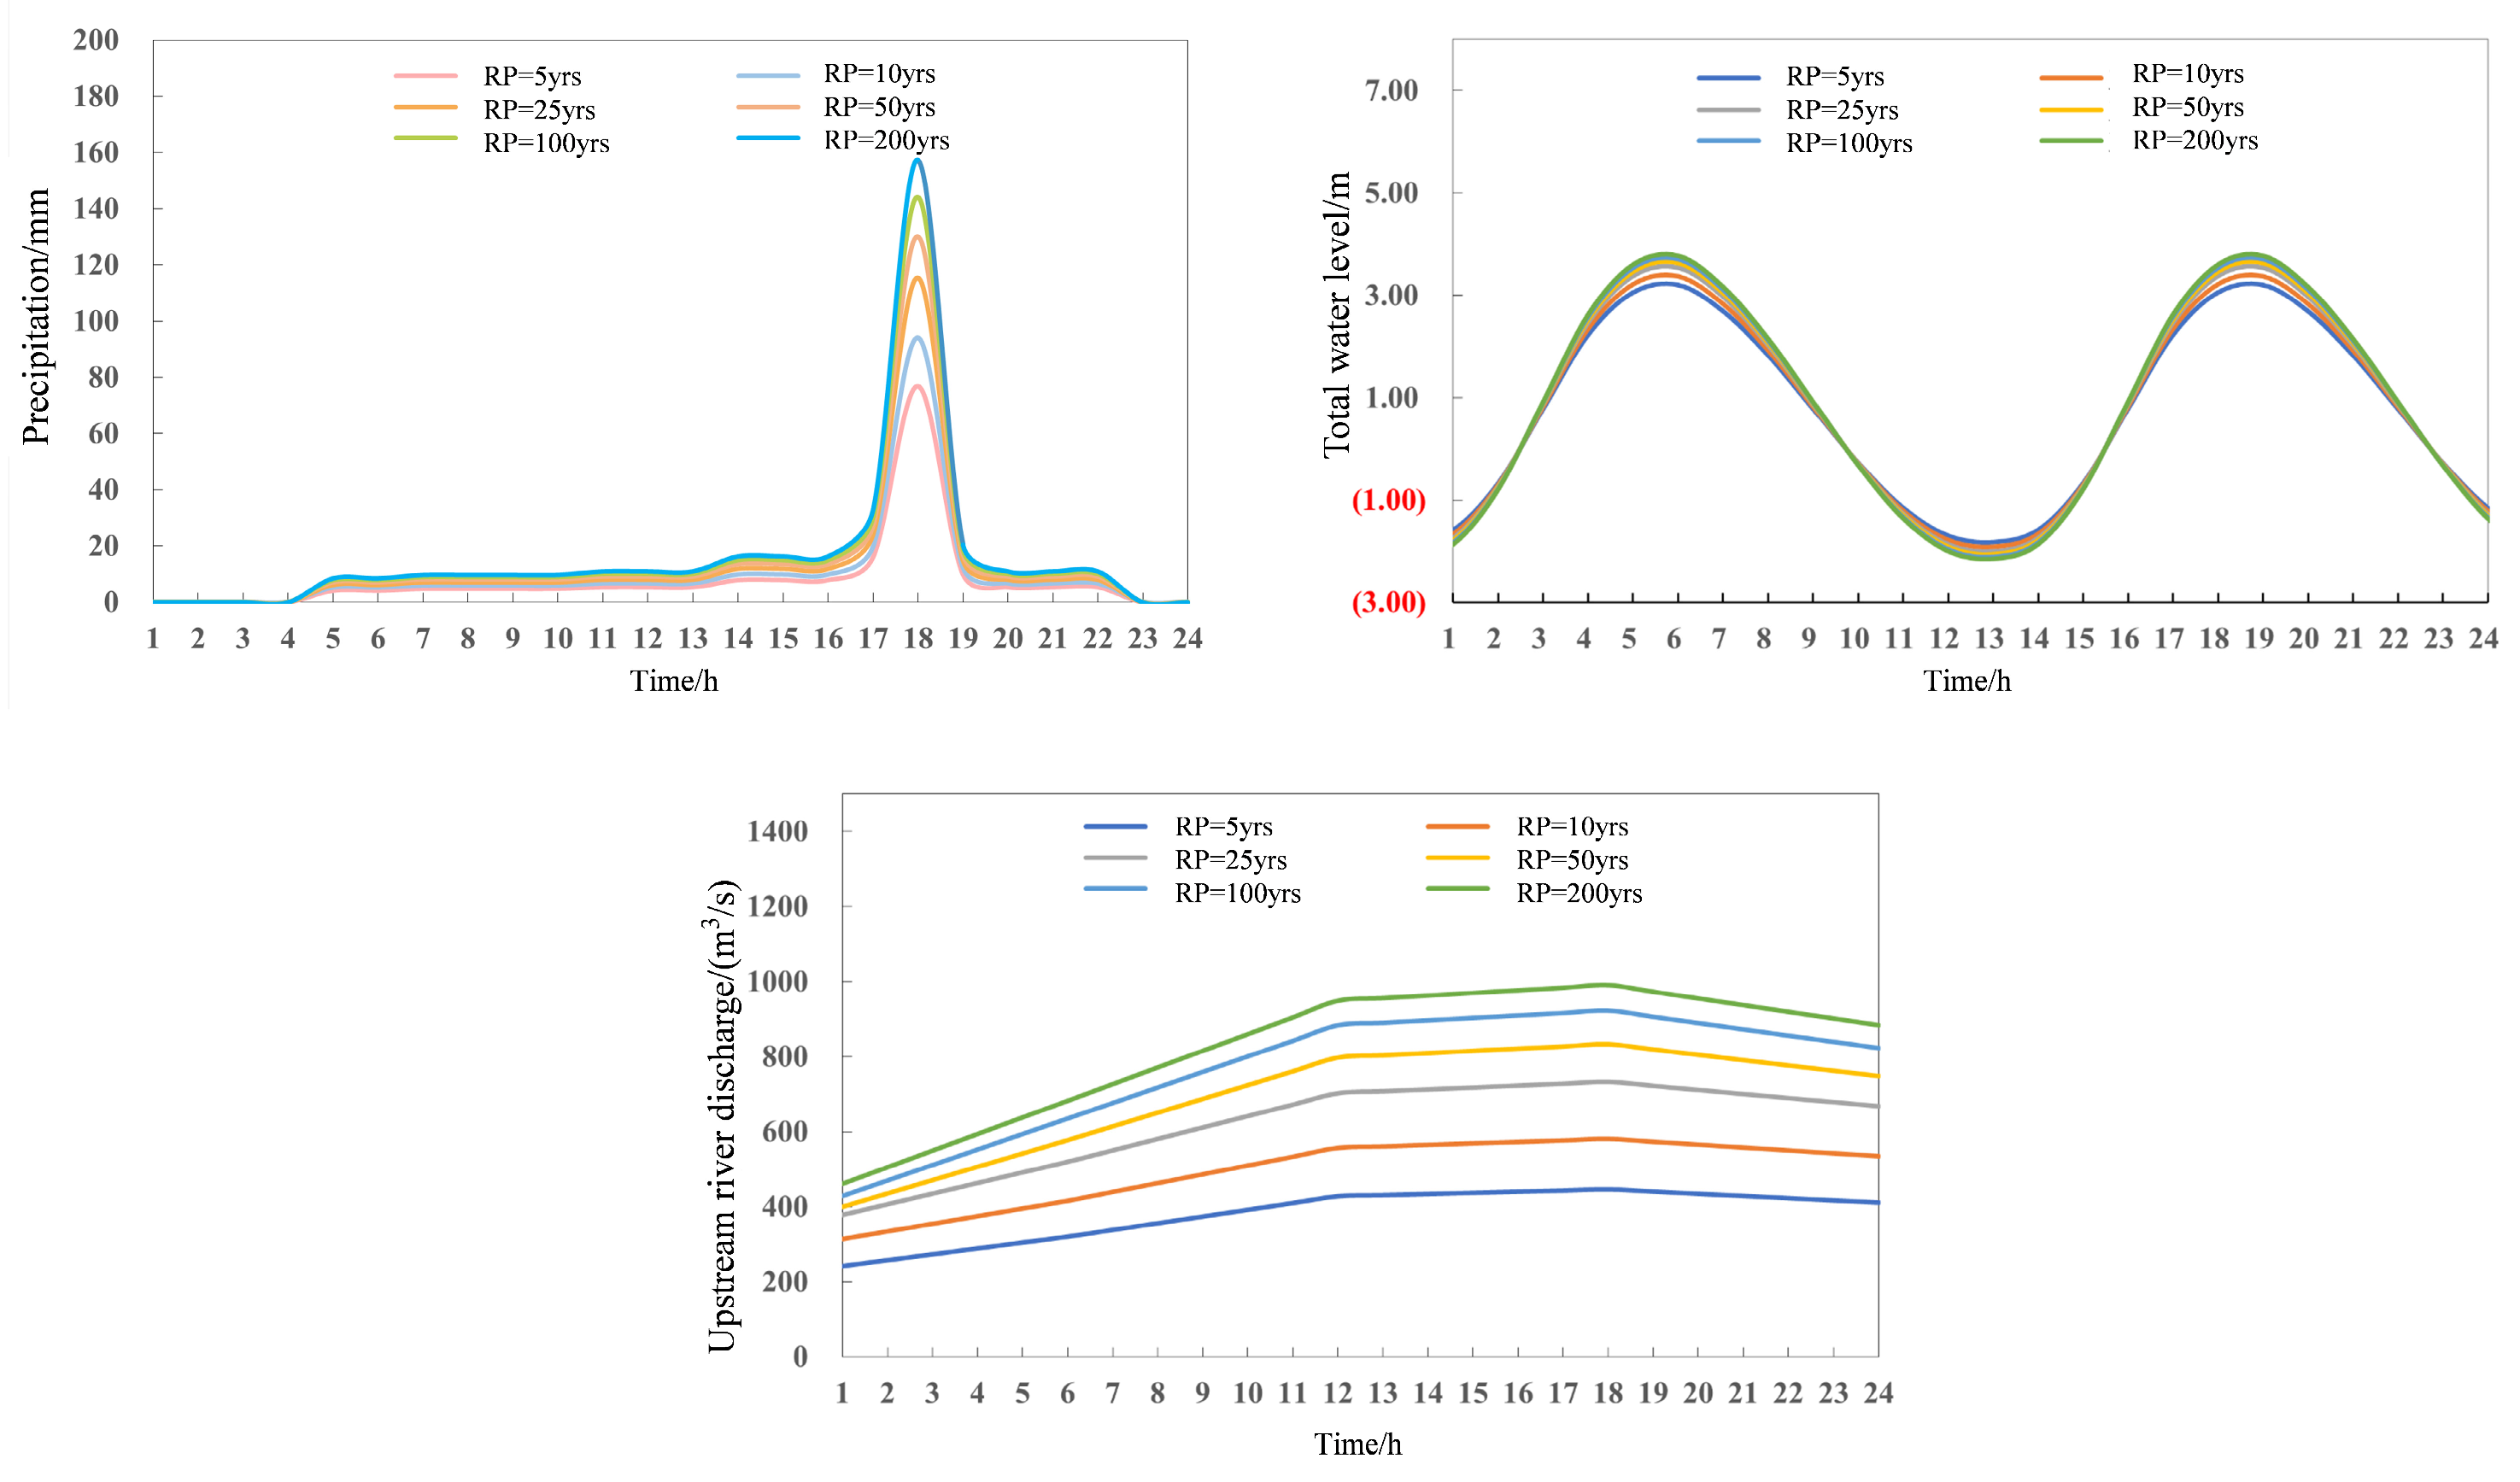
3.5. Compound Flood Value Estimation
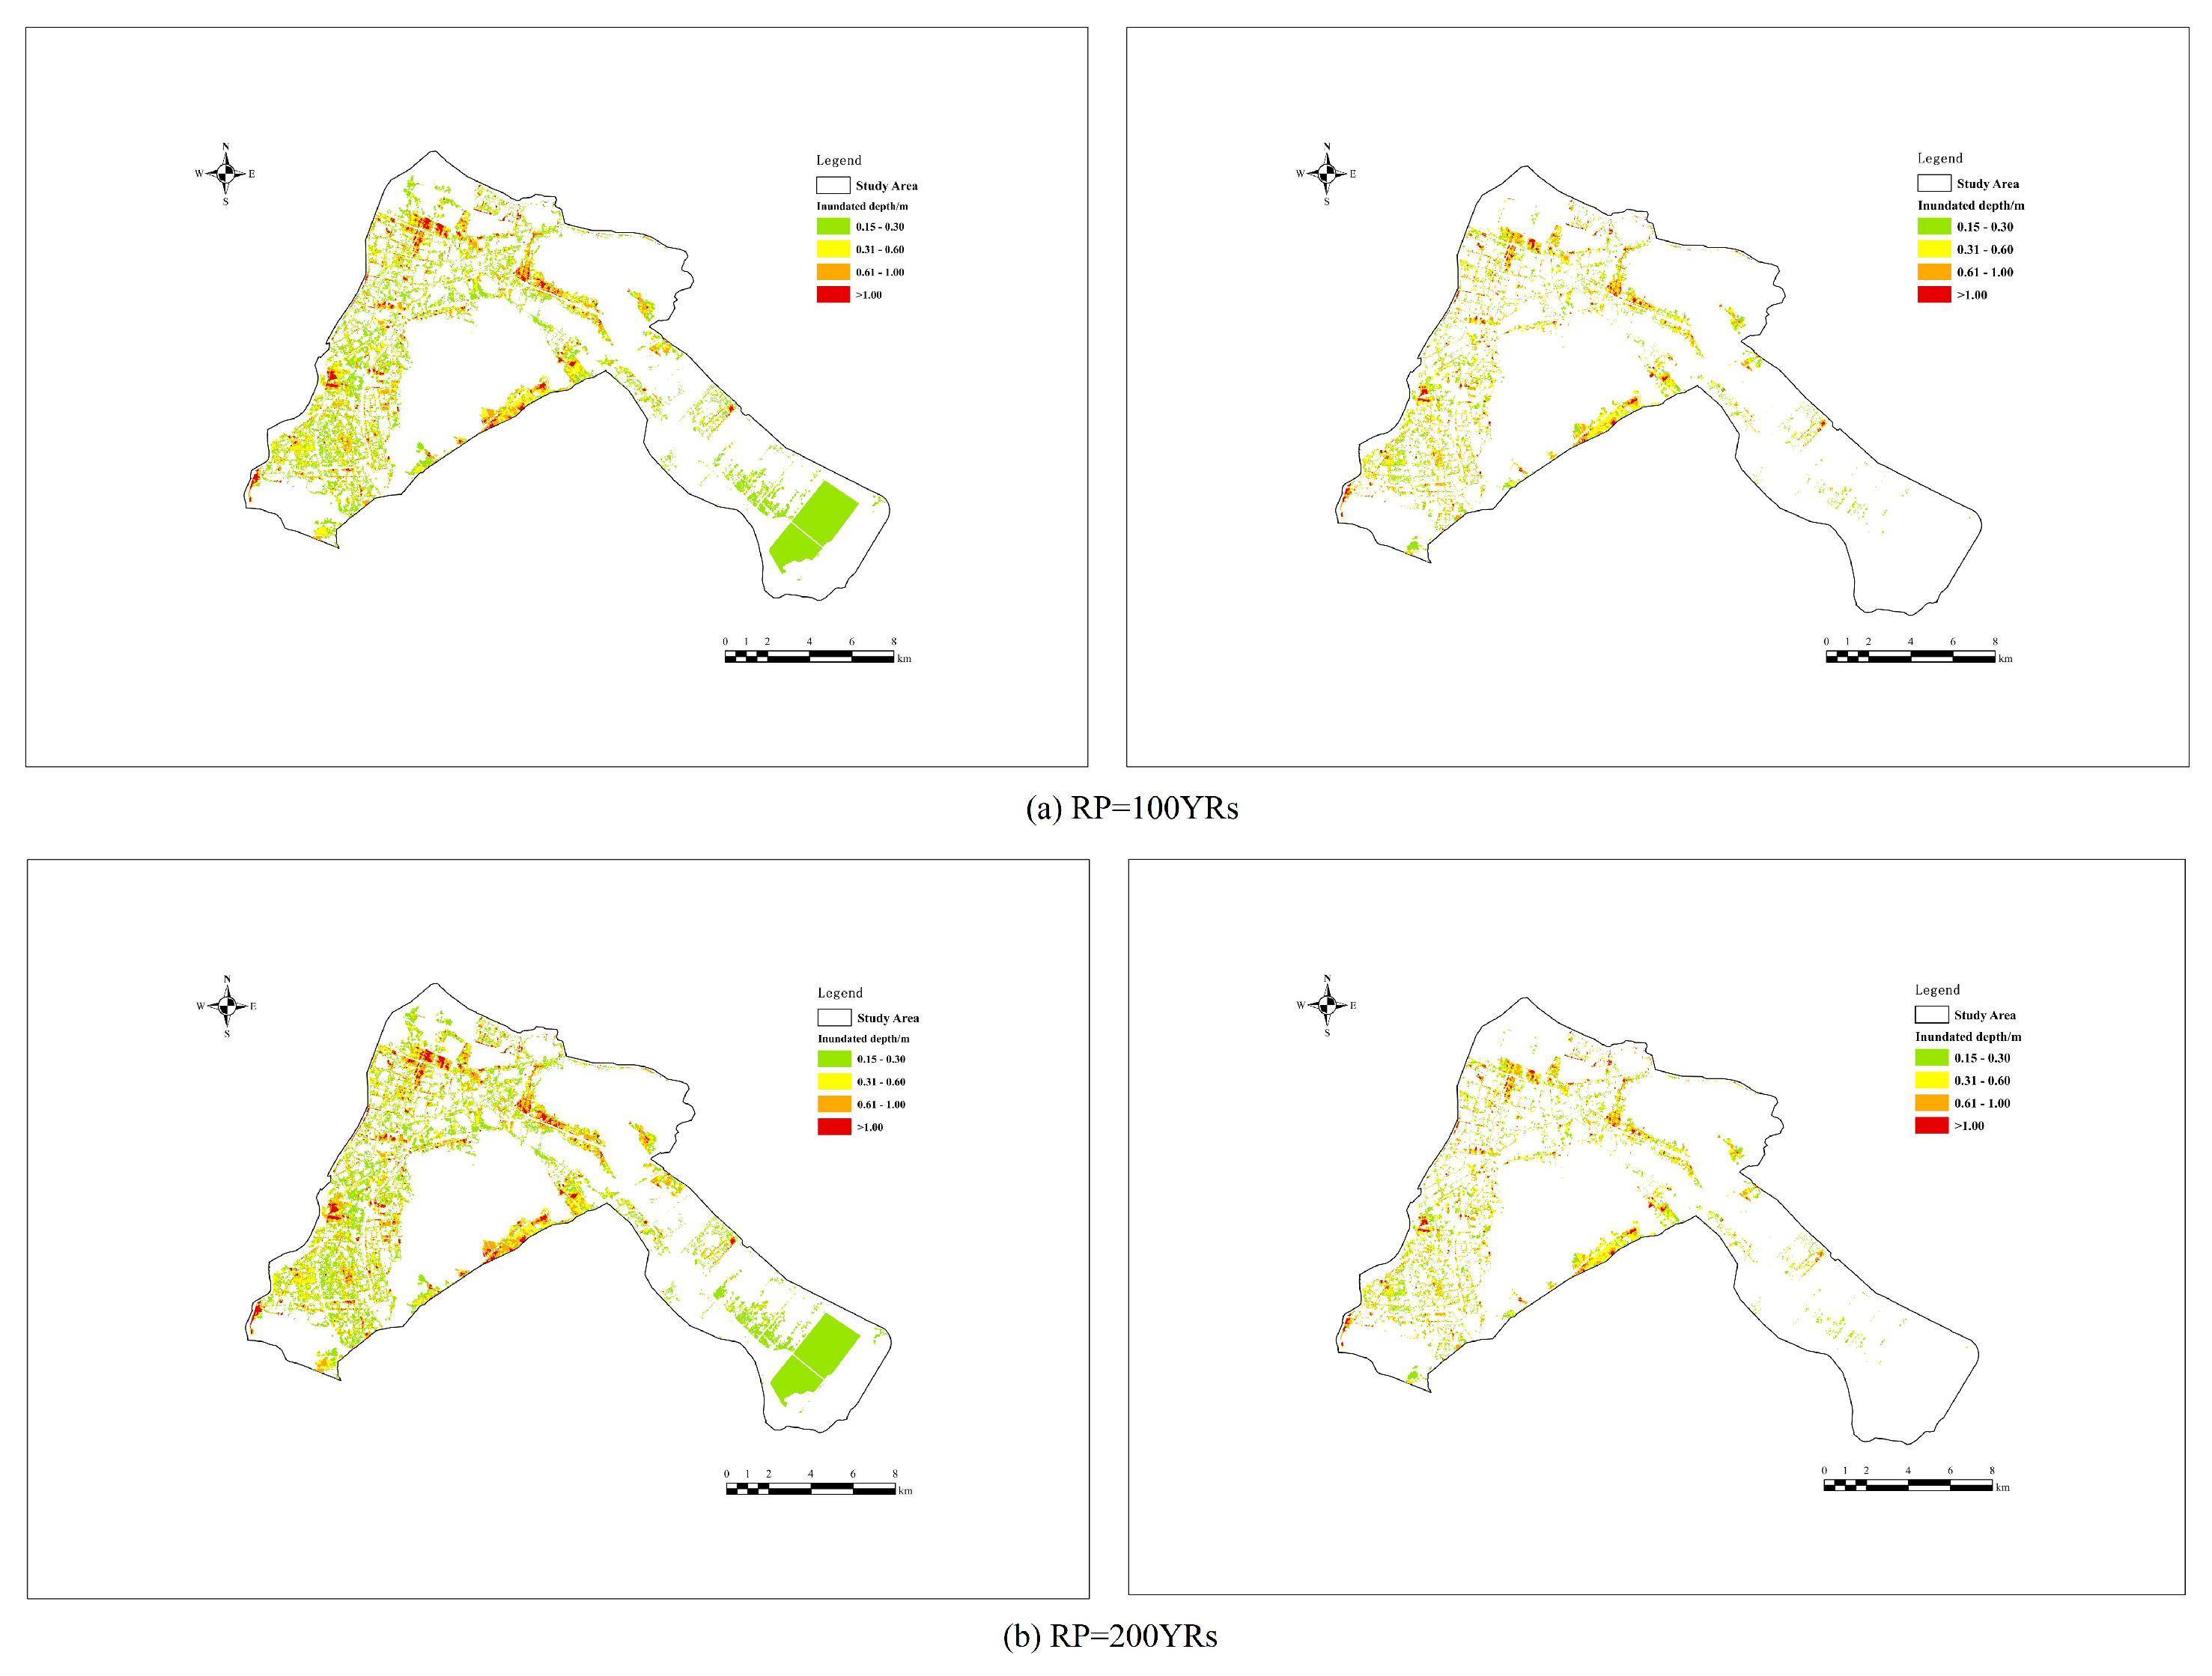
3.6. Compound Flooding Assessment
- 1.
- Classification of flood hazard
- 2.
- Quantification of the compound flood hazard
- 3.
- Calculation and assessment of amplification flood hazard
4. Discussions
4.1. Advancements in the Results
4.2. Amplification of Flood Hazards
5. Conclusions
- Copula Modeling and Optimal Distribution Functions: The Gamma distribution was found to best represent precipitation data, the Weibull distribution for tidal data, and the GEV distribution for discharge data. These distributions were selected based on their performance in goodness-of-fit tests, including the K-S test, AIC, and BIC. For bivariate joint distributions, the Clayton Copula was identified as the best fit for precipitation and total water levels, while the Gaussian Copula was preferred for total water levels and river discharge. The Frank Copula was the best fit for the joint distribution of precipitation and river discharge. In trivariate modeling, the Gumbel-Hougaard Copula was shown to be the best model, which captured the joint distribution of three flood drivers.
- Return Periods and Design Values: The return periods calculated for each flood driver and, in combination, show the increased frequency of compound flood events under “OR” conditions when compared to “AND” conditions. The design values derived from the trivariate copula functions provided a more conservative estimate of flood hazard, which is crucial for enhancing the safety margin in engineering design against extreme flood events.
- Compound Flooding Scenario Benefits: According to the simulation results obtained from the built hydrodynamic models, the proposed compound flooding design offered a comprehensive analysis of the flooding effects, particularly in high-hazard areas during medium to high return periods. Future flood hazard assessments and the development of flood mitigation plans should utilize the compound flooding design approach more. Future studies and practice should examine and optimize compound flooding design approaches to increase coastal communities’ resilience and adaptive capacity against compound flooding disasters.
- Amplification of Flood Hazards: A linear regression analysis tailored to various hazard levels was proposed to examine the amplification patterns of precipitation, river discharge, and total water level. The analysis indicated that the weight of these factors varies across hazard levels. At the medium-hazard level, the water level amplification ratio carried the highest weight, indicating that the impact of water level increases was most pronounced in the inundation of coastal areas classified as medium hazard.
Author Contributions
Funding
Data Availability Statement
Acknowledgments
Conflicts of Interest
References
- Vousdoukas, M.I.; Mentaschi, L.; Voukouvalas, E.; Bianchi, A.; Dottori, F.; Feyen, L. Climatic and socioeconomic controls of future coastal flood risk in Europe. Nat. Clim. Change 2018, 8, 776–780. [Google Scholar]
- Su, C.-W.; Song, Y.; Umar, M. Financial aspects of marine economic growth: From the perspective of coastal provinces and regions in China. Ocean. Coast. Manag. 2021, 204, 105550. [Google Scholar]
- Athanasiou, P.; van Dongeren, A.; Pronk, M.; Giardino, A.; Vousdoukas, M.; Ranasinghe, R. Global Coastal Characteristics (GCC): A global dataset of geophysical, hydrodynamic, and socioeconomic coastal indicators. Earth Syst. Sci. Data 2024, 16, 3433–3452. [Google Scholar]
- Lincke, D.; Hinkel, J. Coastal Migration due to 21st Century Sea-Level Rise. Earth’s Future 2021, 9, e2020EF001965. [Google Scholar]
- Diermanse, F.; Roscoe, K.; Ormondt, M.; Leijnse, T.; Winter, G.; Athanasiou, P. Probabilistic compound flood hazard analysis for coastal risk assessment: A case study in Charleston, South Carolina. Shore Beach 2023, 91, 9–18. [Google Scholar]
- Leijnse, T.; Goede, R.; Ormondt, M.; Lemans, M.; Hegnauer, M.; Eilander, D.; Kleermaeker, S.; Morales, Y.; Maguire, S. Developing Large Scale and Fast Compound Flood Models for Australian Coastlines. In Proceedings of the 37th Conference on Coastal Engineering, Sydney, Australia, 4–9 December 2022; p. 49. [Google Scholar]
- Aziz, F.; Wang, X.; Mahmood, M.Q.; Awais, M.; Trenouth, B. Coastal urban flood risk management: Challenges and opportunities—A systematic review. J. Hydrol. 2024, 645, 132271. [Google Scholar]
- Xu, H.; Zhang, X.; Guan, X.; Wang, T.; Ma, C.; Yan, D. Amplification of Flood Risks by the Compound Effects of Precipitation and Storm Tides Under the Nonstationary Scenario in the Coastal City of Haikou, China. Int. J. Disaster Risk Sci. 2022, 13, 602–620. [Google Scholar]
- Latif, S.; Simonovic, S.P. Compounding joint impact of rainfall, storm surge and river discharge on coastal flood risk: An approach based on 3D fully nested Archimedean copulas. Environ. Earth Sci. 2023, 82, 63. [Google Scholar]
- Comer, J.; Olbert, A.I.; Nash, S.; Hartnett, M. Development of high-resolution multi-scale modelling system for simulation of coastal-fluvial urban flooding. Nat. Hazards Earth Syst. Sci. 2017, 17, 205–224. [Google Scholar]
- Olbert, A.I.; Comer, J.; Nash, S.; Hartnett, M. High-resolution multi-scale modelling of coastal flooding due to tides, storm surges and rivers inflows. A Cork City example. Coast. Eng. 2017, 121, 278–296. [Google Scholar]
- Lin, Q.; Shi, L.; Liang, B.; Wu, G.; Wang, Z.; Zhang, X.; Wu, Y. Characterizing interactive compound flood drivers in the Pearl River Estuary: A case study of Typhoon Hato (2017). J. Hydrol. 2024, 645, 132270. [Google Scholar]
- Tilloy, A.; Malamud, B.D.; Winter, H.; Joly-Laugel, A. A review of quantification methodologies for multi-hazard interrelationships. Earth-Sci. Rev. 2019, 196, 102881. [Google Scholar]
- Tilloy, A.; Malamud, B.D.; Winter, H.; Joly-Laugel, A. Evaluating the efficacy of bivariate extreme modelling approaches for multi-hazard scenarios. Nat. Hazards Earth Syst. Sci. 2020, 20, 2091–2117. [Google Scholar]
- Archer, L.; Neal, J.; Bates, P.; Lord, N.; Hawker, L.; Collings, T.; Quinn, N.; Sear, D. Population exposure to flooding in Small Island Developing States under climate change. Environ. Res. Lett. 2024, 19, 124020. [Google Scholar]
- John, A.; Bhagyanathan, A.; Parvin Cm, K. Framework for urban flood risk assessment—A hydrological modelling approach: The case of Nilambur, Kerala. Int. Plan. Stud. 2024, 29, 342–365. [Google Scholar]
- Cánovas-García, F.; Vargas Molina, J. An exploration of exposure to river flood risk in Spain using the National Floodplain Mapping System. Geomat. Nat. Hazards Risk 2025, 16, 2421405. [Google Scholar] [CrossRef]
- Zscheischler, J.; Westra, S.; van den Hurk, B.J.J.M.; Seneviratne, S.I.; Ward, P.J.; Pitman, A.; AghaKouchak, A.; Bresch, D.N.; Leonard, M.; Wahl, T.; et al. Future climate risk from compound events. Nat. Clim. Change 2018, 8, 469–477. [Google Scholar]
- Bevacqua, E.; Vousdoukas, M.I.; Shepherd, T.G.; Vrac, M. Brief communication: The role of using precipitation or river discharge data when assessing global coastal compound flooding. Nat. Hazards Earth Syst. Sci. 2020, 20, 1765–1782. [Google Scholar]
- Wahl, T.; Jain, S.; Bender, J.; Meyers, S.D.; Luther, M.E. Increasing risk of compound flooding from storm surge and rainfall for major US cities. Nat. Clim. Change 2015, 5, 1093–1097. [Google Scholar]
- Xu, H.; Xu, K.; Bin, L.; Lian, J.; Ma, C. Joint Risk of Rainfall and Storm Surges during Typhoons in a Coastal City of Haidian Island, China. Int. J. Environ. Res. Public Health 2018, 15, 1377. [Google Scholar] [CrossRef]
- Ward, P.J.; Couasnon, A.; Eilander, D.; Haigh, I.D.; Hendry, A.; Muis, S.; Veldkamp, T.I.E.; Winsemius, H.C.; Wahl, T. Dependence between high sea-level and high river discharge increases flood hazard in global deltas and estuaries. Environ. Res. Lett. 2018, 13, 084012. [Google Scholar] [CrossRef]
- Inamdeen, F.; Larson, M. Compound effects of sea level and flow on river-induced flooding in coastal areas of southern Sweden. J. Hydrol. Reg. Stud. 2024, 56, 102032. [Google Scholar] [CrossRef]
- Wang, Z.; Chen, Y.; Zeng, Z.; Li, R.; Li, Z.; Li, X.; Lai, C. Compound effects in complex estuary-ocean interaction region under various combination patterns of storm surge and fluvial floods. Urban Clim. 2024, 58, 102186. [Google Scholar] [CrossRef]
- Bevacqua, E.; De Michele, C.; Manning, C.; Couasnon, A.; Ribeiro, A.F.S.; Ramos, A.M.; Vignotto, E.; Bastos, A.; Blesić, S.; Durante, F.; et al. Guidelines for Studying Diverse Types of Compound Weather and Climate Events. Earth’s Future 2021, 9, e2021EF002340. [Google Scholar] [CrossRef]
- Latif, M.; Firuza, M. Parametric Vine Copula Construction for Flood Analysis for Kelantan River Basin in Malaysia. Civ. Eng. J. 2020, 6, 1470–1491. [Google Scholar] [CrossRef]
- Fang, J.Y.; Yin, J.; Shi, X.W.; Fang, J.; Du, S.Q.; Liu, M. A review of compound flood hazard research in coastal areas. Adv. Clim. Change Res. 2021, 17, 317–328. [Google Scholar]
- Couasnon, A.; Sebastian, A.; Morales-Nápoles, O. A Copula-Based Bayesian Network for Modeling Compound Flood Hazard from Riverine and Coastal Interactions at the Catchment Scale: An Application to the Houston Ship Channel, Texas. Water 2018, 10, 1190. [Google Scholar] [CrossRef]
- Bass, B.; Bedient, P. Surrogate modeling of joint flood risk across coastal watersheds. J. Hydrol. 2018, 558, 159–173. [Google Scholar] [CrossRef]
- Santiago-Collazo, F.L.; Bilskie, M.V.; Bacopoulos, P.; Hagen, S.C. Compound Inundation Modeling of a 1-D Idealized Coastal Watershed Using a Reduced-Physics Approach. Water Resour. Res. 2024, 60, e2023WR035718. [Google Scholar] [CrossRef]
- Muñoz, D.F.; Moftakhari, H.; Moradkhani, H. Compound Effects of Flood Drivers and Wetland Elevation Correction on Coastal Flood Hazard Assessment. Water Resour. Res. 2020, 56, e2020WR027544. [Google Scholar] [CrossRef]
- Serafin, K.A.; Ruggiero, P.; Parker, K.; Hill, D.F. What’s streamflow got to do with it? A probabilistic simulation of the competing oceanographic and fluvial processes driving extreme along-river water levels. Nat. Hazards Earth Syst. Sci. 2019, 19, 1415–1431. [Google Scholar] [CrossRef]
- Liu, B.; Xu, S.; Yin, K. Spatial inhomogeneity analyses of extreme sea levels along Lianyungang coast based on numerical simulation and Monte Carlo model. Reg. Stud. Mar. Sci. 2024, 79, 103856. [Google Scholar] [CrossRef]
- Xu, H.; Xu, K.; Lian, J.; Ma, C. Compound effects of rainfall and storm tides on coastal flooding risk. Stoch. Environ. Res. Risk Assess. 2019, 33, 1249–1261. [Google Scholar] [CrossRef]
- Akaike, H. A new look at the statistical model identification. IEEE Trans. Autom. Control 1974, 19, 716–723. [Google Scholar] [CrossRef]
- Schwarz, G. Estimating the Dimension of a Model. Ann. Stat. 1978, 6, 461–464. [Google Scholar] [CrossRef]
- Chu, H.-J.; Lin, Y.-P.; Huang, C.-W.; Hsu, C.-Y.; Chen, H.-Y. Modelling the hydrologic effects of dynamic land-use change using a distributed hydrologic model and a spatial land-use allocation model. Hydrol. Process. 2010, 24, 2538–2554. [Google Scholar] [CrossRef]
- Dwarakish, G.S.; Ganasri, B.P. Impact of land use change on hydrological systems: A review of current modeling approaches. Cogent Geosci. 2015, 1, 1115691. [Google Scholar] [CrossRef]
- Sun, Y.; Liu, C.; Du, X.; Yang, F.; Yao, Y.; Soomro, S.-E.-H.; Hu, C. Urban storm flood simulation using improved SWMM based on K-means clustering of parameter samples. J. Flood Risk Manag. 2022, 15, e12826. [Google Scholar] [CrossRef]
- Zhu, W.; Cao, Z.; Kawaike, K.; Luo, P.; Yamanoi, K.; Koshiba, T. A novel urban flood risk assessment framework based on refined numerical simulation technology. J. Hydrol. 2024, 645, 132152. [Google Scholar] [CrossRef]
- Gallien, T.W.; Kalligeris, N.; Delisle, M.-P.C.; Tang, B.-X.; Lucey, J.T.D.; Winters, M.A. Coastal Flood Modeling Challenges in Defended Urban Backshores. Geosciences 2018, 8, 450. [Google Scholar] [CrossRef]
- Cai, H.; Yang, Q.; Zhang, Z.; Guo, X.; Liu, F.; Ou, S. Impact of River-Tide Dynamics on the Temporal-Spatial Distribution of Residual Water Level in the Pearl River Channel Networks. Estuaries Coasts 2018, 41, 1885–1903. [Google Scholar] [CrossRef]
- Williams, L.L.; Lück-Vogel, M. Comparative assessment of the GIS based bathtub model and an enhanced bathtub model for coastal inundation. J. Coast. Conserv. 2020, 24, 23. [Google Scholar] [CrossRef]
- Kouakou, M.; Tiémélé, J.A.; Djagoua, É.; Gnandi, K. Assessing potential coastal flood exposure along the Port-Bouët Bay in Côte d’Ivoire using the enhanced bathtub model. Environ. Res. Commun. 2023, 5, 105001. [Google Scholar] [CrossRef]


| Station Name | Station ID | Data Availability | Objective | Location |
|---|---|---|---|---|
| Lianyungang | 51301300 | 1972 to present | Statistical Analysis Boundary Condition | 119°27′00″ E, 34°46′29″ N |
| Xilian Island | 51321950 | 1972 to present | Statistical Analysis Boundary Condition | 119°26′10″ E, 34°46′49″ N |
| Linhong | 51113800 | 1972 to present | Statistical Analysis Boundary Condition | 119°12′11″ E, 34°43′50″ N |
| Dongxin | 51127250 | 1972 to present | Statistical Analysis Boundary Condition | 119°22′55″ E, 35°32′50″ N |
| Banpu | 511E2503 | 1972 to present | Statistical Analysis Boundary Condition | 119°14′35″ E, 34°27′54″ N |
| Linhongdong | - | 1972 to present | Statistical Analysis Boundary Condition | 119°09′ E, 34°37′ N |
| Riverside Park | 2023 to 2024 | Calibration | 119°12′32″ E, 34°35′38″ N | |
| Phoenix Mouth | 2023 to 2024 | Calibration | 119°22′48″ E, 34°38′00″ N | |
| Yudai River | 2023 to 2024 | Calibration | 119°10′19″ E, 34°34′39″ N | |
| Longwei River | 2023 to 2024 | Calibration | 119°10′12″ E, 34°36′54″ N | |
| Dapu Branch River | 2023 to 2024 | Calibration | 119°12′41″ E, 34°39′01″ N |
| Item | Maximum Daily Rainfall (mm) | Highest Total Water Level (m) | Maximum River Discharge (m3/s) |
|---|---|---|---|
| Minimum | 2.100 | −0.047 | 8.970 |
| Maximum | 3.700 | 1.940 | 5910.000 |
| Range | 1.600 | 1.987 | 5901.030 |
| First Quartile | 2.430 | 0.188 | 127.500 |
| Median | 2.790 | 0.302 | 184.000 |
| Third Quartile | 3.120 | 0.424 | 240.500 |
| Mean | 2.790 | 0.303 | 1871.063 |
| Variance | 0.070 | 0.001 | 3,072,726.000 |
| Standard Deviation | 0.260 | 0.032 | 1752.341 |
| Standard Error of the Mean | 0.026 | 0.003 | 58.740 |
| Standard Error of the Variance | 0.001 | 0.0001 | 9317.000 |
| Correlation Coefficient Type | Annual Maximum Daily Precipitation—Maximum Water Level (±4 days) | Annual Maximum Daily Precipitation—Maximum River Discharge (±4 days) | Maximum Total Water Level—Maximum River Discharge (±4 days) |
|---|---|---|---|
| Pearson | 0.41 | 0.36 | 0.07 |
| Kendall | 0.29 | 0.23 | −0.04 |
| Spearman | 0.42 | 0.36 | −0.07 |
| (a) Maximum Daily Precipitation | |||
| Marginal Distribution | K-S | AIC | BIC |
| Lognormal | 0.0673 | 524.8844 | 528.7084 |
| Gamma | 0.0661 | 525.6700 | 529.4940 |
| Weibull | 0.0917 | 530.0721 | 533.8961 |
| GEV | 0.0713 | 527.4774 | 533.2135 |
| Normal | 0.1051 | 533.1909 | 537.0149 |
| (b) Maximum Total Water Level | |||
| Marginal Distribution | K-S | AIC | BIC |
| Lognormal | 0.110 | 40.8555 | 44.6795 |
| Gamma | 0.1038 | 40.4649 | 44.2890 |
| Weibull | 0.0701 | 43.7835 | 47.6076 |
| GEV | 0.0993 | 42.4552 | 48.1913 |
| Normal | 0.0873 | 40.3883 | 44.2123 |
| (c) Maximum River Discharge | |||
| Marginal Distribution | K-S | AIC | BIC |
| Lognormal | 0.1178 | 614.1941 | 617.8944 |
| Gamma | 0.1223 | 603.7056 | 607.4059 |
| Weibull | 0.1134 | 601.3576 | 605.0579 |
| GEV | 0.1133 | 649.8128 | 655.5489 |
| Normal | 0.1295 | 651.0001 | 654.8242 |
| (a) P-Z | ||||
| Copula | AIC | BIC | Sn (N = 1000) | |
| Gaussian | −7.5330 | −4.9278 | 0.4311 | 7.3130 |
| Clayton | −8.2468 | −5.6416 | 0.7999 | 4.1063 |
| Frank | −6.6947 | −4.0896 | 2.5481 | 4.8262 |
| Gumbel | −1.7312 | 0.8740 | 0.1959 | 5.9759 |
| (b) Z-Q | ||||
| Marginal Distribution | K-S | AIC | BIC | |
| Gaussian | 1.9989 | 4.6041 | 0.0048 | |
| Clayton | 2.0000 | 4.6052 | 1.8649 × 10⁻⁸ | |
| Frank | 4.6052 | 4.6052 | 3.0381 × 10⁻⁸ | |
| Gumbel | 4.6052 | 4.6052 | 1.0000 | |
| (c) P-Q | ||||
| Marginal Distribution | K-S | AIC | BIC | |
| Gaussian | −4.3445 | −1.7393 | 0.3427 | |
| Clayton | −1.6085 | 0.9967 | 0.4368 | |
| Frank | −4.7319 | −2.1268 | 2.0608 | |
| Gumbel | −3.4514 | −0.8462 | 1.2389 | |
| Copula Category | Copula Function | θ | AIC | BIC | N = 1000 | |
|---|---|---|---|---|---|---|
| Sn | p-Value | |||||
| Archimedean | Clayton | 12.627 | −25,529.233 | −25,527.321 | 3.362 | 0.0 |
| Gumbel-Hougaard | 1.173 | 368.126 | 370.038 | 0.001 | 0.425 | |
| Joe | 1.500 | 2,000,002 | 2,000,004 | 0.265 | 0.023 | |
| Elliptical | Gaussian | 0.337, 0.432, 0.002 | 410.637 | 416.373 | 0.001 | 0.407 |
| RPs (Years) | Annual Max Precipitation (mm) | Annual Max Total Water Level (m) | (Years) | (Years) |
|---|---|---|---|---|
| 5 | 158.32 | 3.05 | 2.96 | 16.09 |
| 10 | 184.28 | 3.19 | 5.46 | 60.05 |
| 25 | 207.68 | 3.29 | 10.46 | 231.65 |
| 50 | 236.18 | 3.39 | 25.42 | 1407.70 |
| 100 | 256.48 | 3.46 | 50.43 | 5595.00 |
| 200 | 275.98 | 3.52 | 100.72 | 22,432.00 |
| 500 | 300.83 | 3.59 | 249.86 | 138,470.00 |
| 1000 | 319.05 | 3.63 | 500.65 | 556,470.00 |
| RPs (Years) | Annual Max P (mm) | Annual Max Z (m) | Annual Max Q (m3/s) | GH (Years) | (Years) | (Years) | (Years) |
|---|---|---|---|---|---|---|---|
| 5 | 158.32 | 3.05 | 354.60 | 2.30 | 25.54 | 2.30 | 22.64 |
| 10 | 184.28 | 3.19 | 438.80 | 4.24 | 62.70 | 4.11 | 73.04 |
| 25 | 207.68 | 3.29 | 513.87 | 8.16 | 137.56 | 7.67 | 233.40 |
| 50 | 236.18 | 3.39 | 603.39 | 19.88 | 361.10 | 18.12 | 1103.30 |
| 100 | 256.48 | 3.46 | 665.24 | 39.48 | 734.16 | 35.34 | 3730.17 |
| 200 | 275.98 | 3.52 | 722.74 | 78.82 | 1482.91 | 69.60 | 13,422.84 |
| 500 | 300.83 | 3.59 | 792.76 | 195.93 | 3711.86 | 170.85 | 85,061.96 |
| 1000 | 319.05 | 3.63 | 841.60 | 392.27 | 7448.61 | 339.78 | 49,1650.97 |
| RPs (Years) | 5 | 10 | 25 | 50 | 100 | 200 |
|---|---|---|---|---|---|---|
| Max precipitation (mm) | 186.84 | 228.61 | 280.28 | 316.92 | 350.57 | 382.86 |
| Max Total Water Level (m) | 3.20 | 3.37 | 3.53 | 3.63 | 3.71 | 3.77 |
| Max River Discharge (m3/s) | 447.20 | 580.33 | 733.90 | 833.91 | 922.24 | 991.16 |
| Scenarios | Inundated Depth/m | Inundated Area/km2 | |||||
|---|---|---|---|---|---|---|---|
| 5a | 10a | 25a | 50a | 100a | 200a | ||
| Compound Flooding scenario | 0.15~0.30 | 16.30 | 20.67 | 24.50 | 25.78 | 27.92 | 30.43 |
| 0.30~0.60 | 13.19 | 18.71 | 26.93 | 33.28 | 37.07 | 39.72 | |
| 0.60~1.0 | 4.38 | 7.56 | 11.98 | 16.30 | 20.42 | 25.11 | |
| >1.0 | 1.01 | 2.21 | 4.19 | 6.29 | 8.11 | 9.81 | |
| Total Area/km2 | 34.87 | 50.57 | 67.60 | 81.65 | 93.52 | 105.06 | |
| Univatiare Frequency scenario | 0.15~0.30 | 14.18 | 16.47 | 19.82 | 22.35 | 24.61 | 24.55 |
| 0.30~0.60 | 11.18 | 13.27 | 18.72 | 25.01 | 27.98 | 26.80 | |
| 0.60~1.0 | 3.66 | 4.53 | 6.69 | 10.27 | 12.94 | 11.92 | |
| >1.0 | 0.84 | 1.07 | 1.92 | 3.43 | 4.67 | 4.21 | |
| Total Area/km2 | 29.86 | 35.34 | 47.16 | 61.06 | 70.19 | 67.48 | |
Disclaimer/Publisher’s Note: The statements, opinions and data contained in all publications are solely those of the individual author(s) and contributor(s) and not of MDPI and/or the editor(s). MDPI and/or the editor(s) disclaim responsibility for any injury to people or property resulting from any ideas, methods, instructions or products referred to in the content. |
© 2025 by the authors. Licensee MDPI, Basel, Switzerland. This article is an open access article distributed under the terms and conditions of the Creative Commons Attribution (CC BY) license (https://creativecommons.org/licenses/by/4.0/).
Share and Cite
Wang, W.; Wu, J.; Simonovic, S.P.; Fan, Z. An Integrated Trivariate-Dimensional Statistical and Hydrodynamic Modeling Method for Compound Flood Hazard Assessment in a Coastal City. Land 2025, 14, 816. https://doi.org/10.3390/land14040816
Wang W, Wu J, Simonovic SP, Fan Z. An Integrated Trivariate-Dimensional Statistical and Hydrodynamic Modeling Method for Compound Flood Hazard Assessment in a Coastal City. Land. 2025; 14(4):816. https://doi.org/10.3390/land14040816
Chicago/Turabian StyleWang, Wei, Jingxiu Wu, Slobodan P. Simonovic, and Ziwu Fan. 2025. "An Integrated Trivariate-Dimensional Statistical and Hydrodynamic Modeling Method for Compound Flood Hazard Assessment in a Coastal City" Land 14, no. 4: 816. https://doi.org/10.3390/land14040816
APA StyleWang, W., Wu, J., Simonovic, S. P., & Fan, Z. (2025). An Integrated Trivariate-Dimensional Statistical and Hydrodynamic Modeling Method for Compound Flood Hazard Assessment in a Coastal City. Land, 14(4), 816. https://doi.org/10.3390/land14040816