
Research on Spatial Coupling Coordination of Population Shrinkage and Land Use Efficiency from the Human–Land Relationship Perspective: Case Study of Zhejiang Province, China


Abstract
1. Introduction
- (1)
- Explore the coupling coordination relationship between shrinkage and LUE and illustrate its spatial heterogeneity.
- (2)
- Illustrate the actual distribution of human–land coupling coordination, reveal the unbalanced spatial pattern, and analyze the reasons of the difference match types.
- (3)
- Propose adjustment strategies for resource allocation and provide scientific basis for the future adaptive planning.
2. Methods and Materials
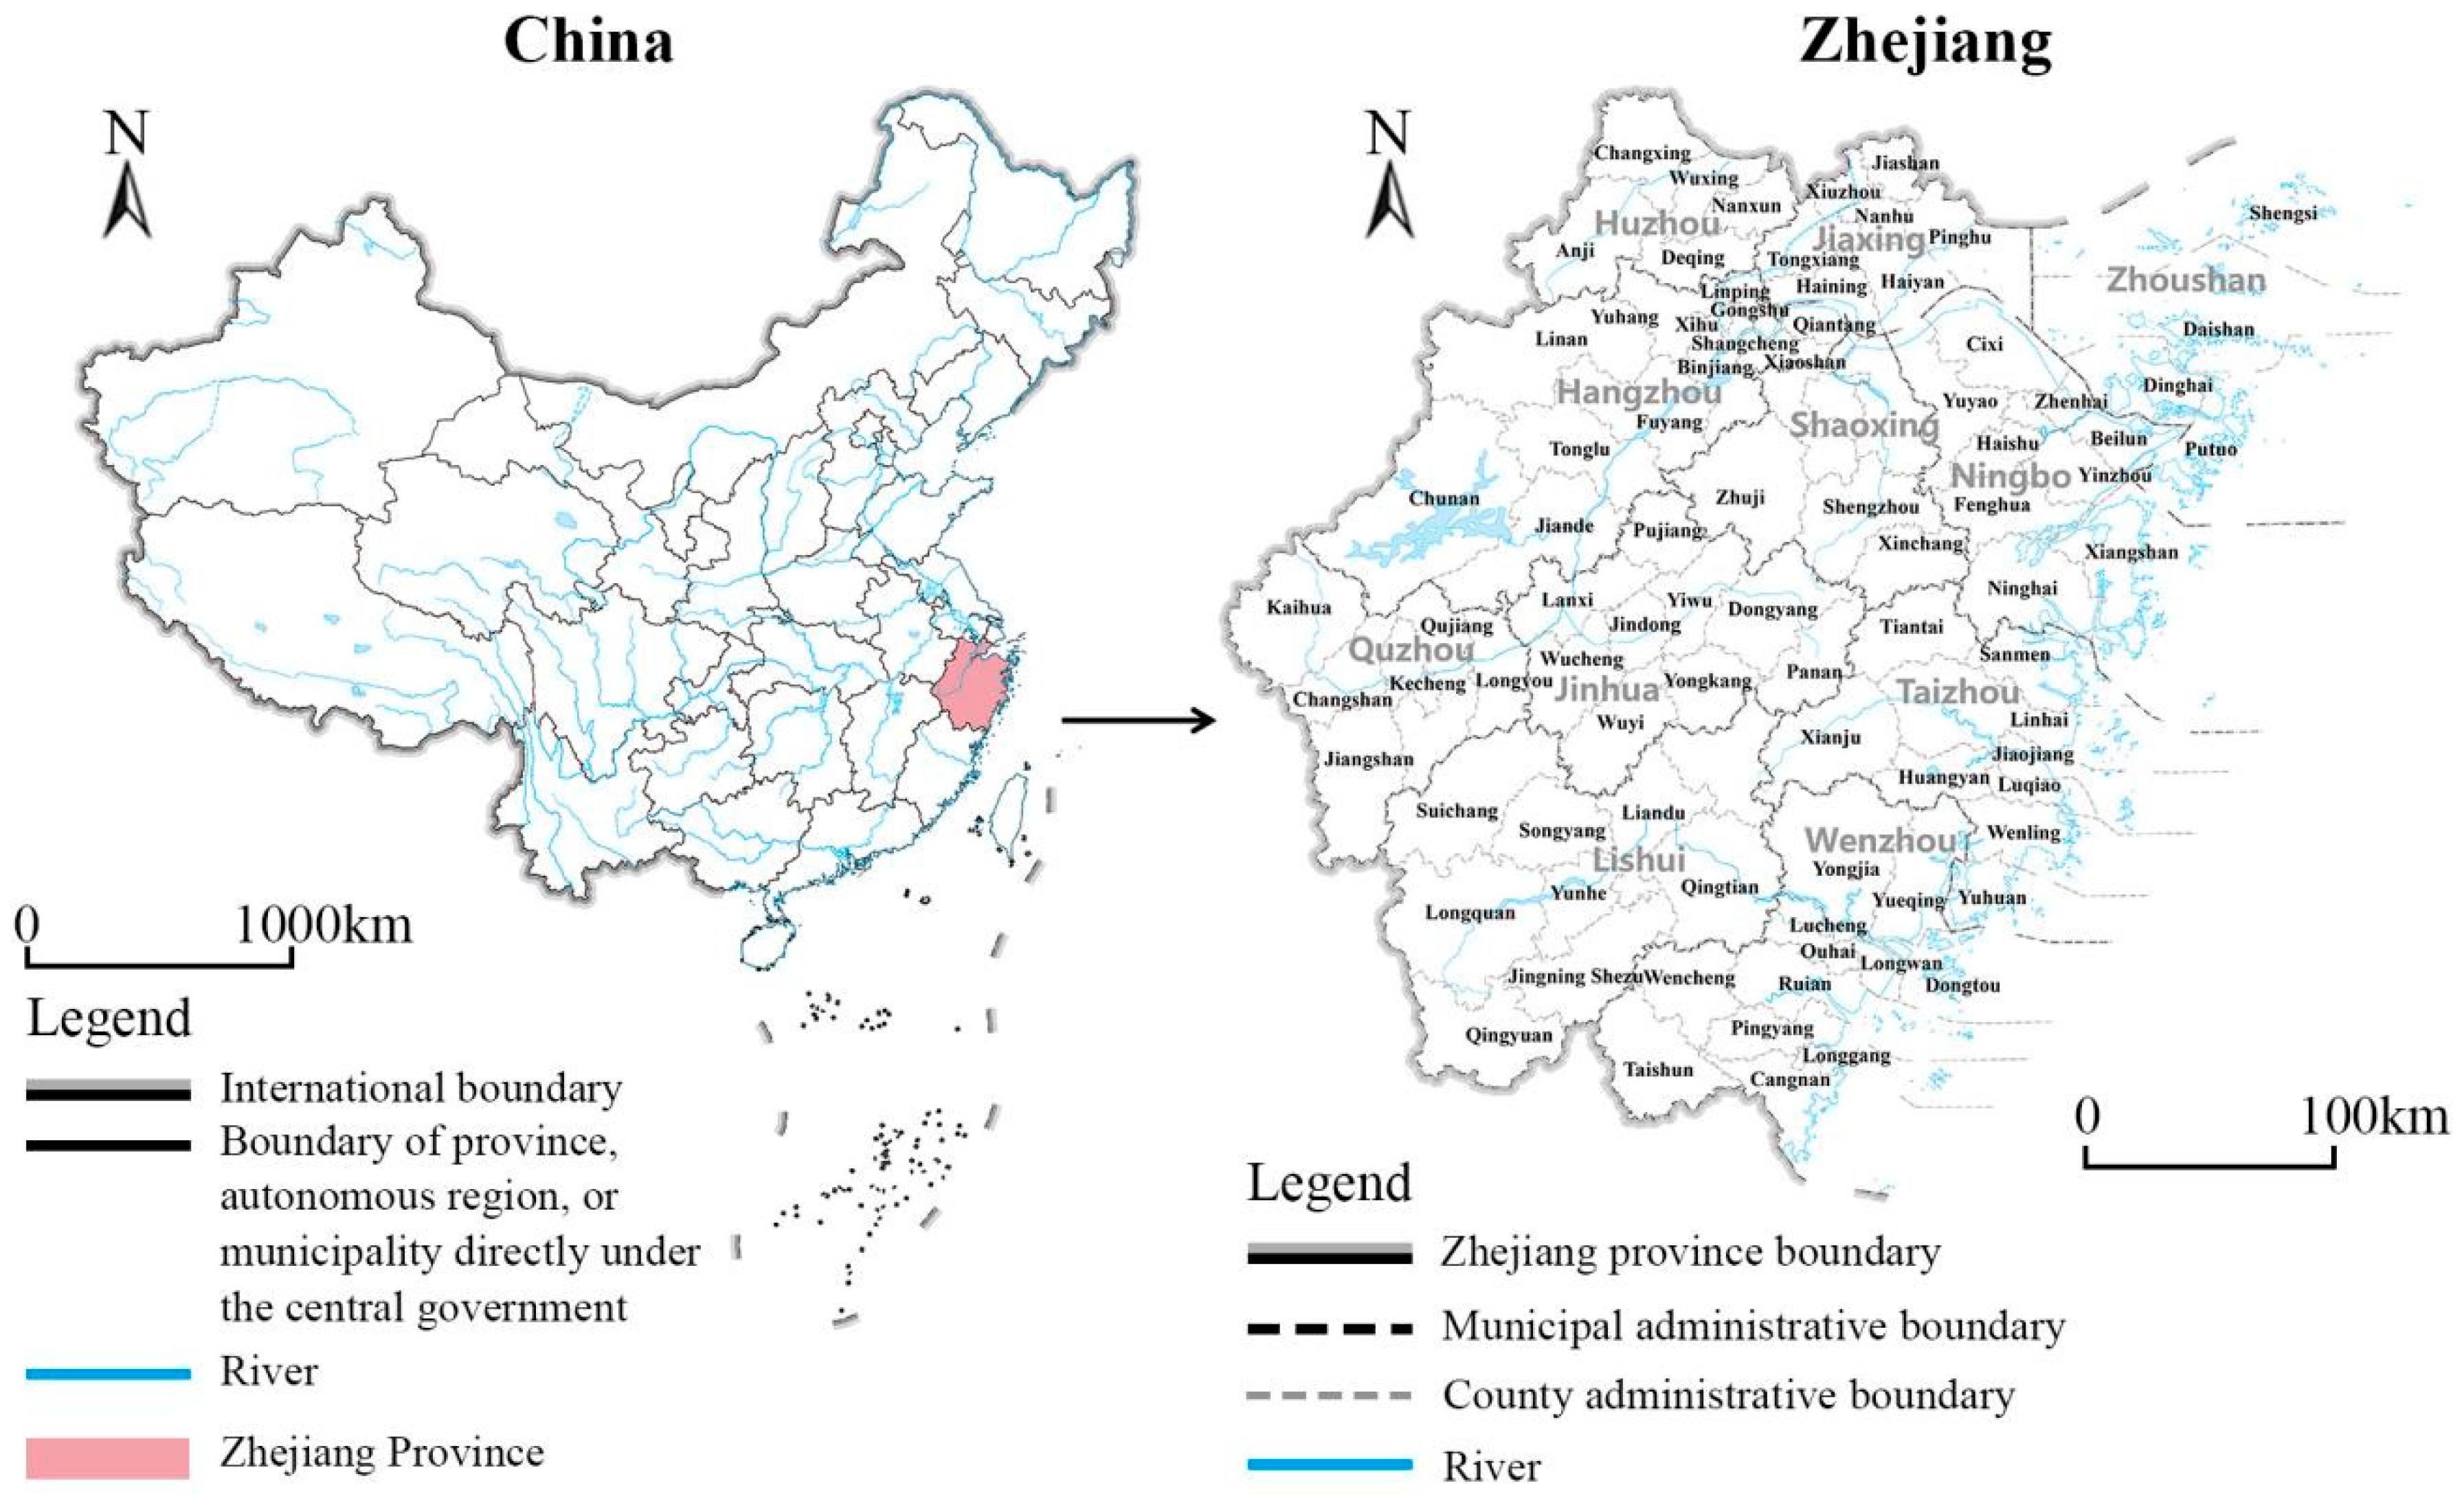
2.1. Research Material
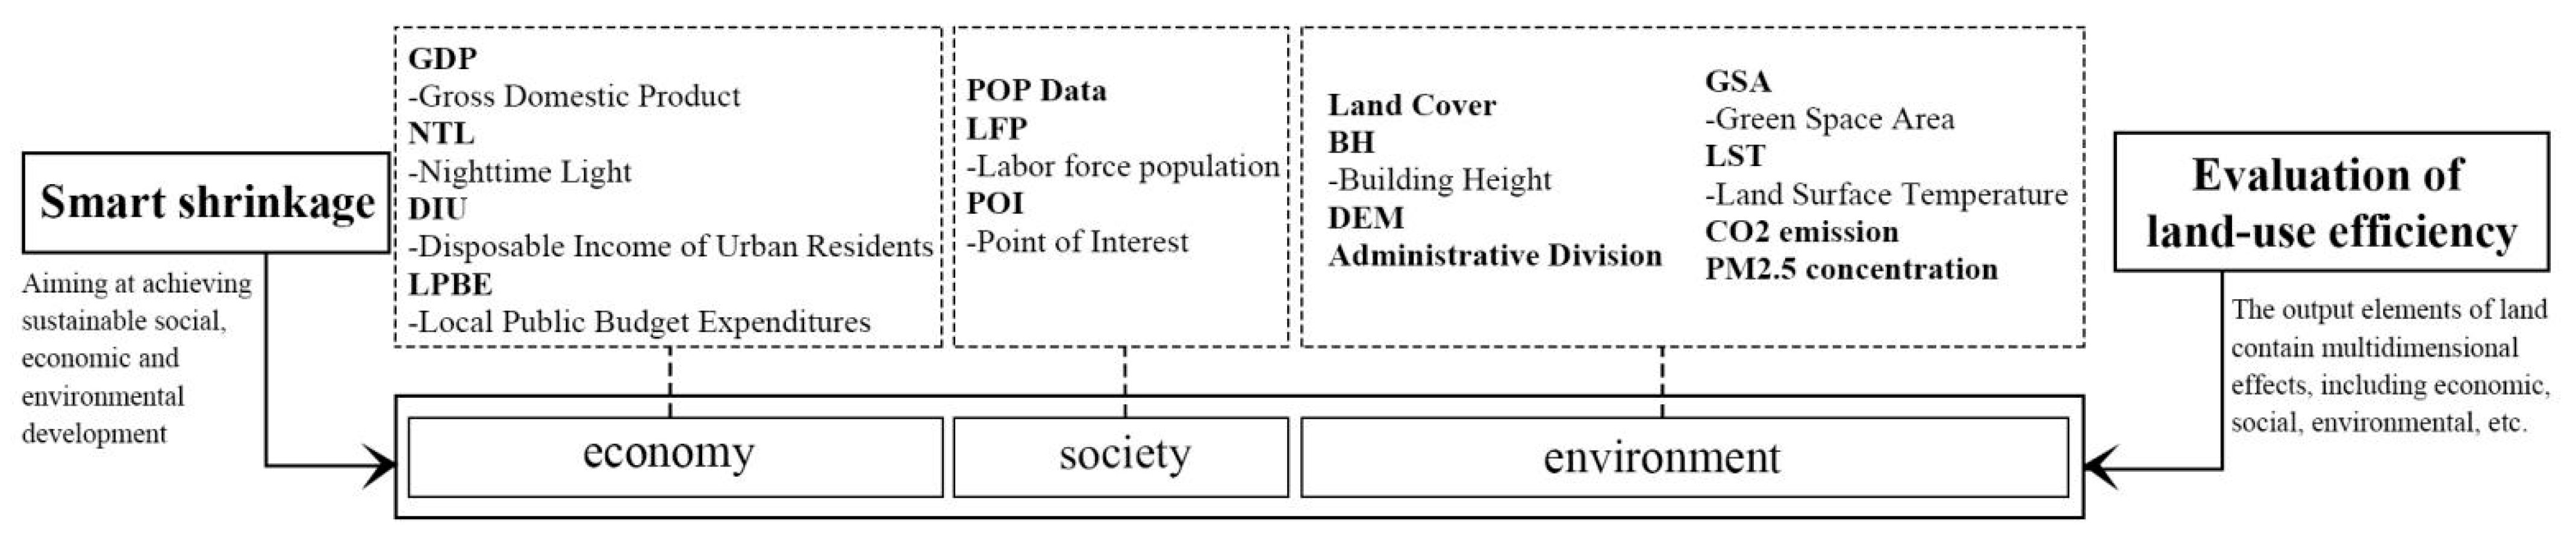
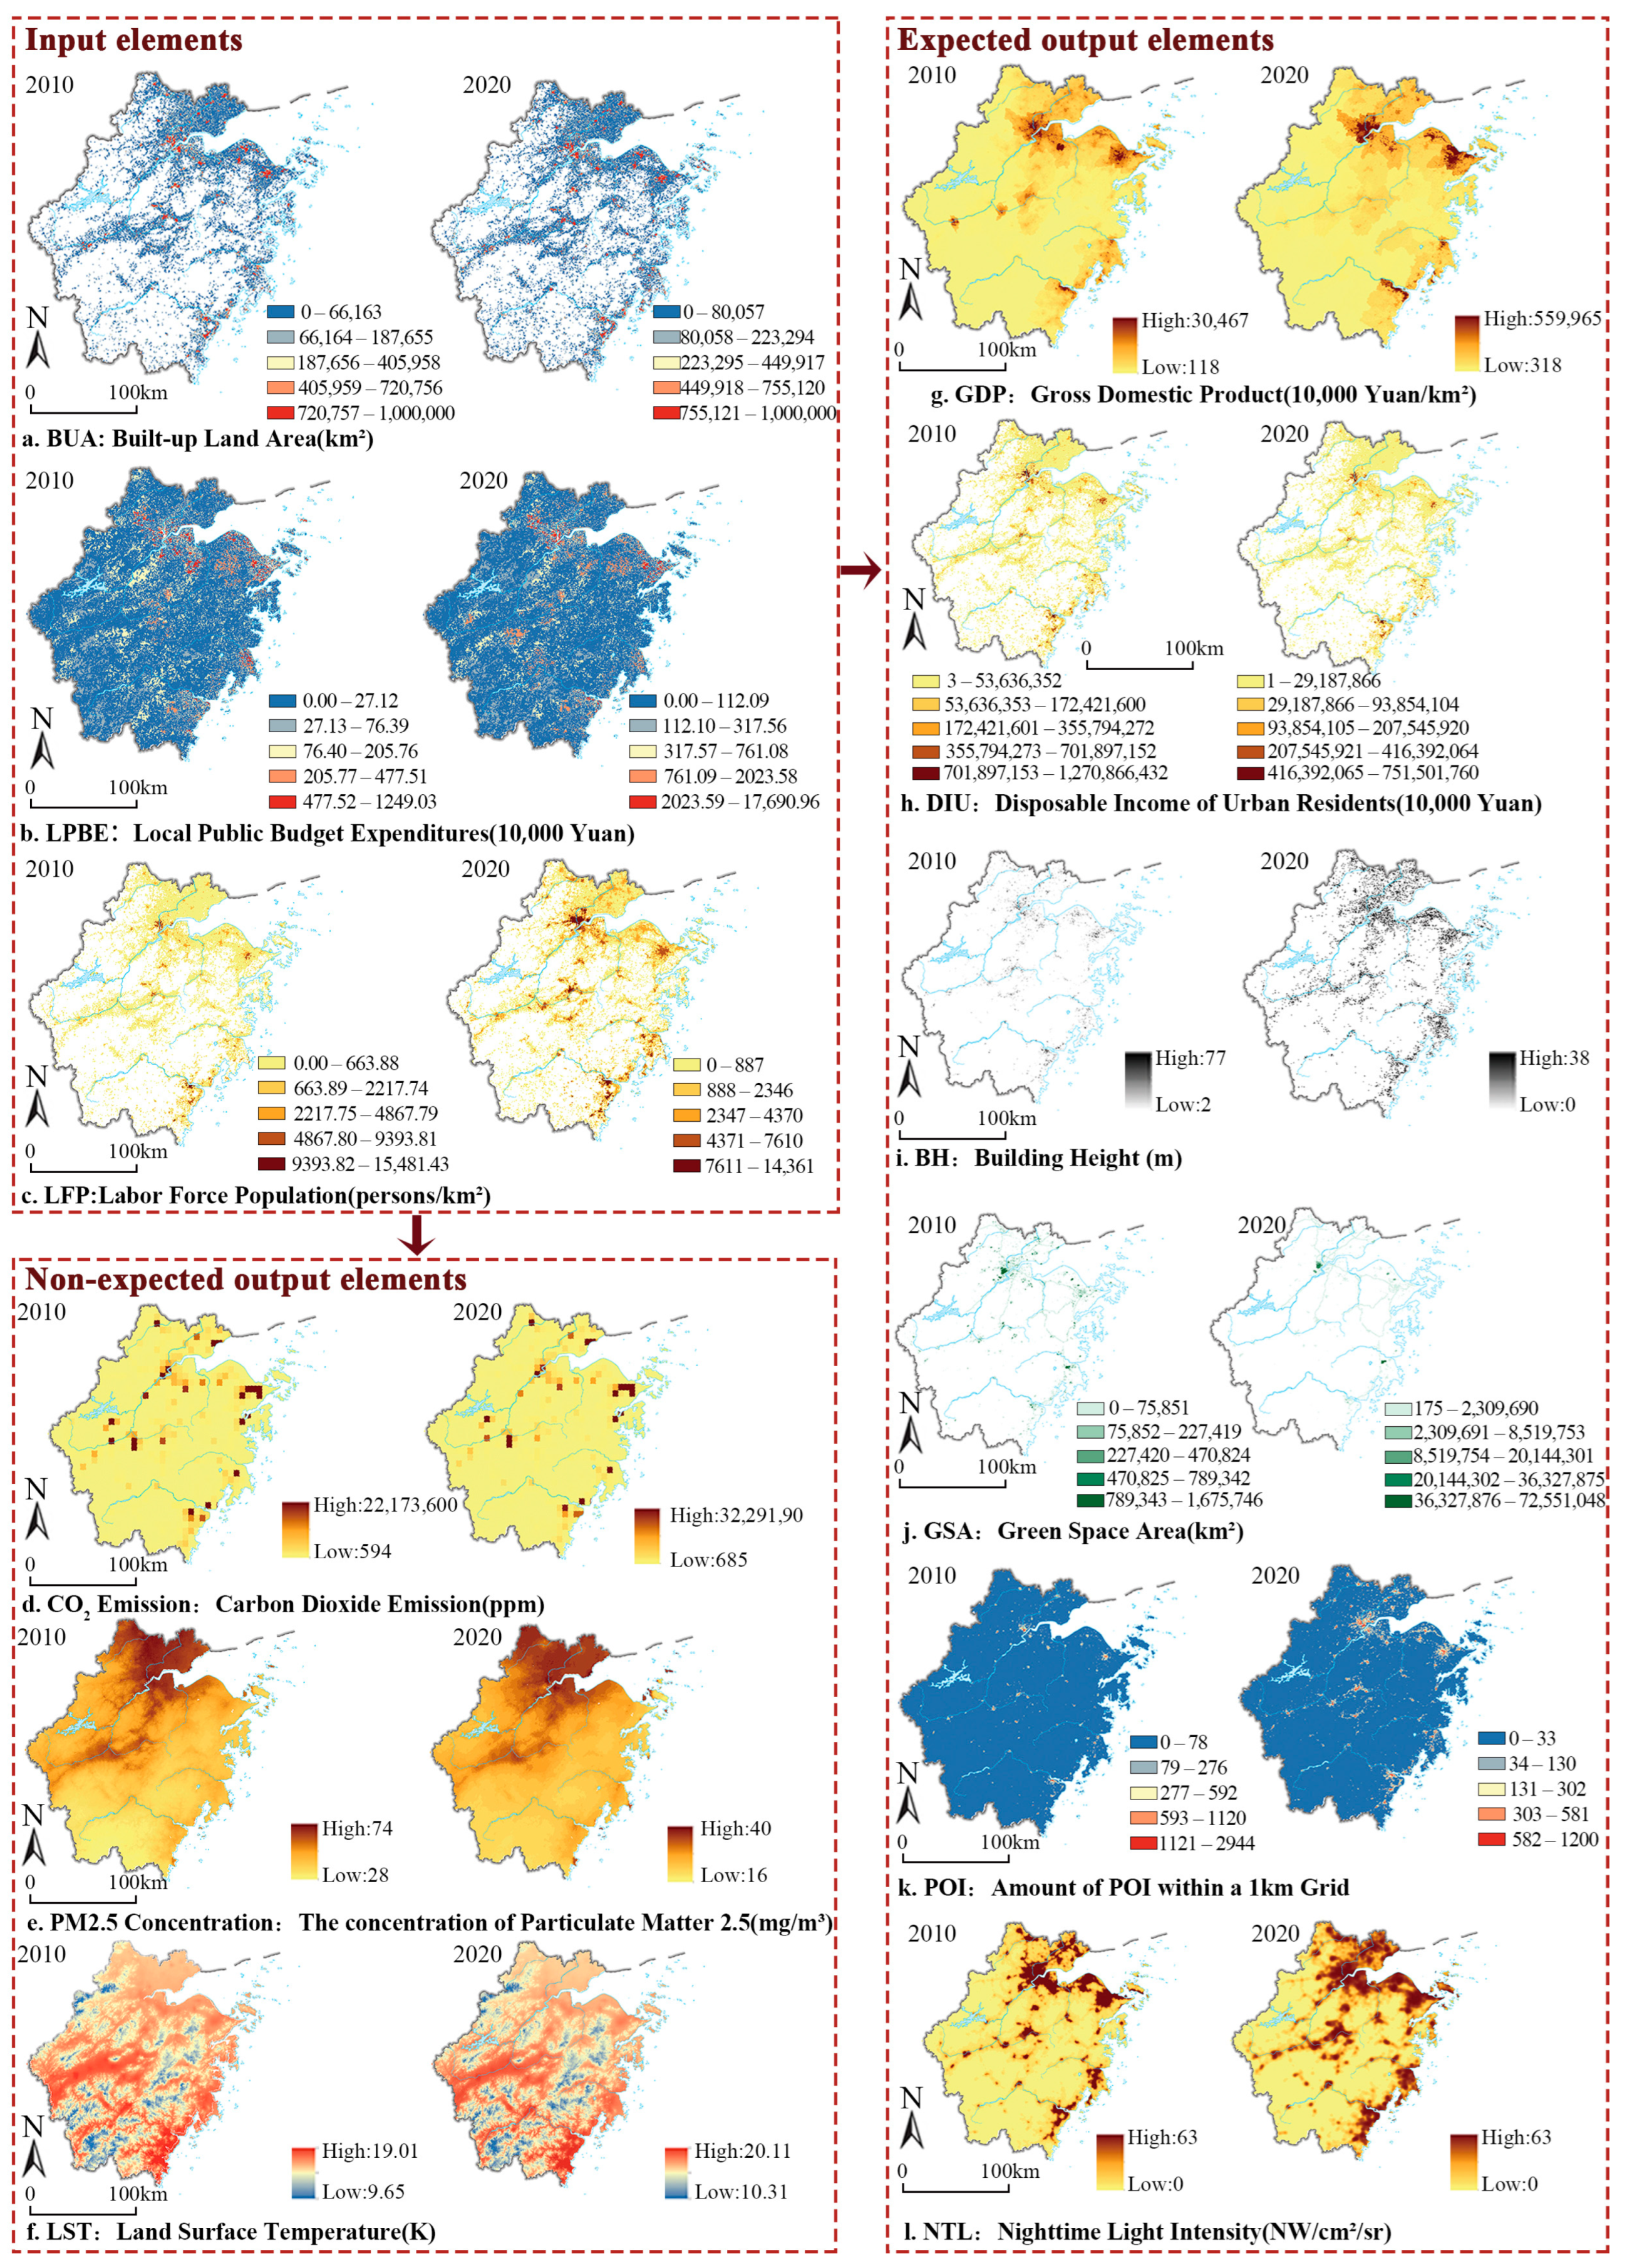
- Economic Data: GDP raster data are published by the Resource and Environmental Science and Data Centre (RESDC) of the Chinese Academy of Sciences. The nighttime light data are the corrected China-wide DMSP-OLS data, obtained by integrating DMSP-OLS and SNPP-VIIRS. Data on the disposable income of urban residents and local public budget expenditures are sourced from statistical yearbooks and social gazettes.
- Social Data: Population data are derived from the Sixth and Seventh Population Censuses. It is important to note that the population data used in this study are from the actual census data of the Sixth and Seventh Chinese Population Censuses, rather than model projections. The data were visualized by dividing the impermeable ground into 1 km × 1 km grids, with population statistics evenly distributed across the grid cells. This method ensures the most accurate population distribution, with population changes calculated for each unit grid. The POI (Point of Interest) data were collected through Gaode Map 2024.
- Environment Data: Firstly, land use data: Land cover data helps determine the extent of construction land and provides insights into land area inputs. These data are sourced from the China Multi-Period Land Use Remote Sensing Monitoring Dataset (CNLUCC). Building height data characterize construction output, which is closely related to urban expansion. The 2010 building height data are from Pengcheng Laboratory, while the 2020 building height data are provided by the GC3S team, which utilized multi-source Earth observation data and machine learning techniques to create a 10 m resolution building height dataset for China. The Digital Elevation Model (DEM) data were obtained from the National Platform for Earth System Science Data Sharing Service, and the 2020 administrative division data were sourced from the Standard Map Service System of the National Bureau of Surveying, Mapping, and Geographic Information of China (NBMSGI). Secondly, ecological environment data: The earliest green space area data in China, available up to 2012, were sourced from Gaode Maps, while the 2020 green space area data were obtained from OpenStreetMap. CO2 data indicate carbon emissions, PM2.5 data reflect urban pollution levels, and temperature data assess the urban heat island effect. The PM2.5 data were sourced from the China High Air Pollutants dataset (CHAP), and temperature data were obtained from the National Tibetan Plateau Data Centre (NTPDC).
2.2. Methodology Framework
2.3. Methods
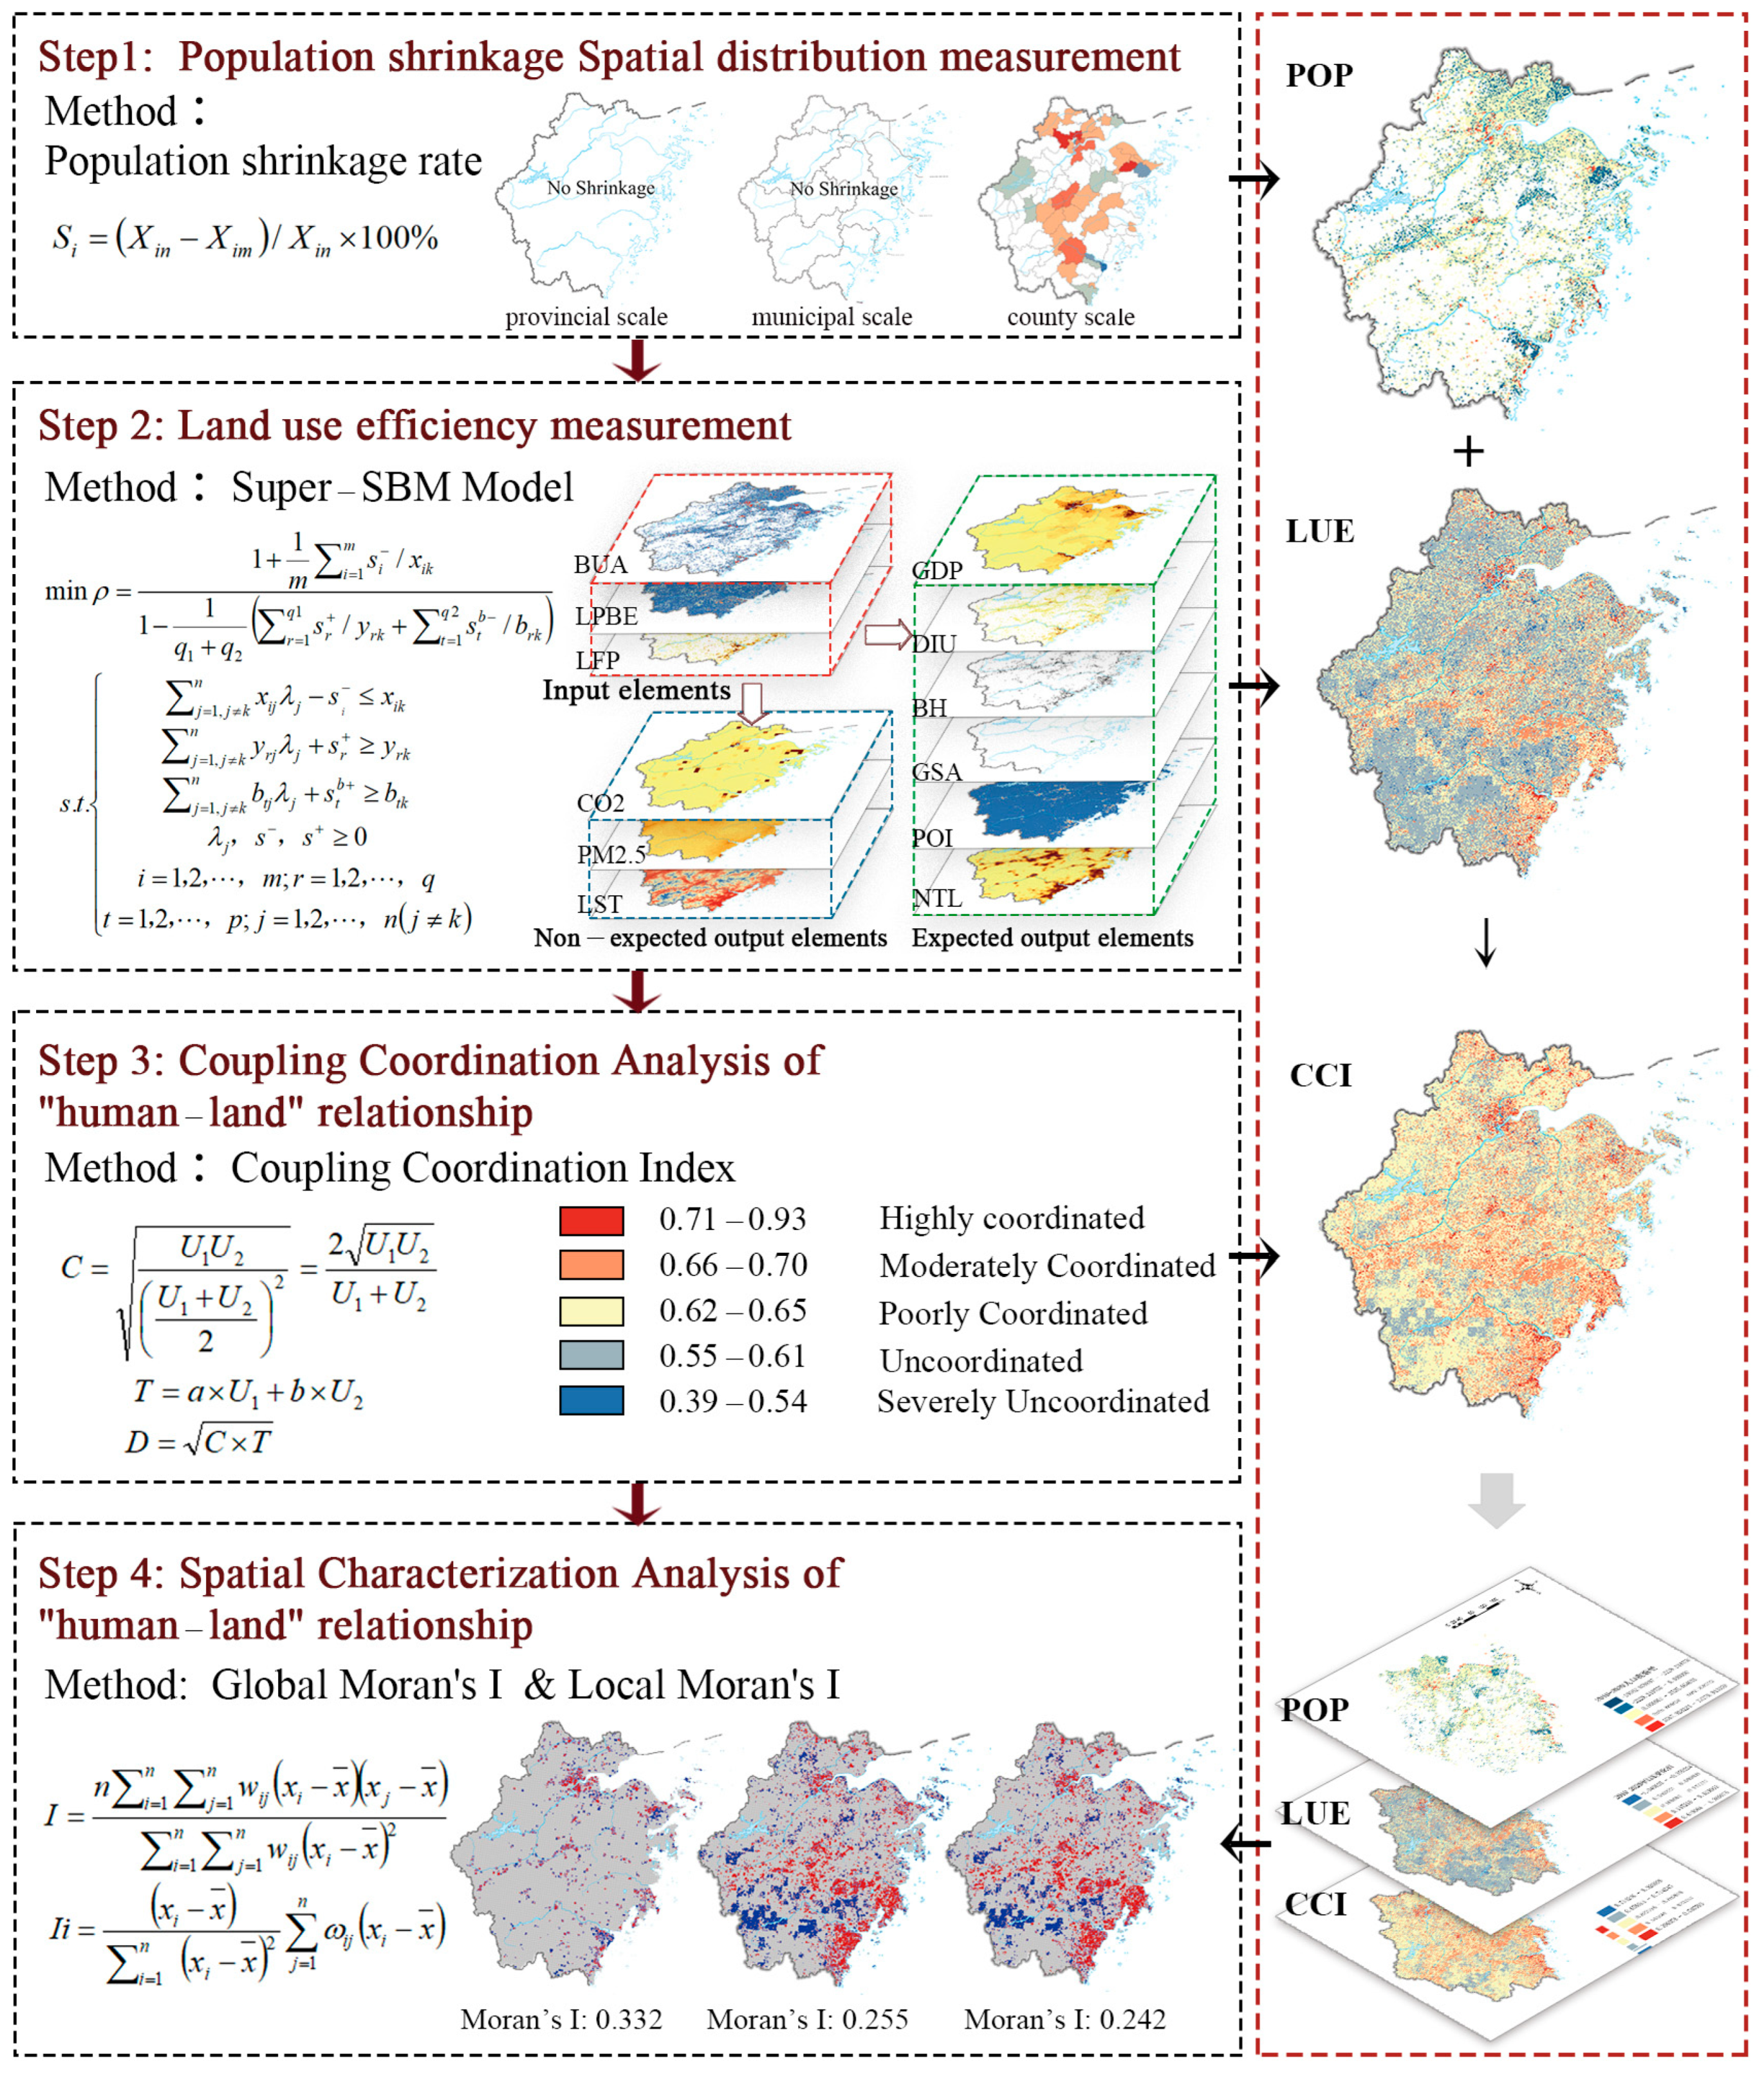
2.3.1. Identification of Population Shrinkage
2.3.2. Calculation of LUE Based on the Super-SBM Model
2.3.3. Measurement of the Coupling Coordination Index for Human–Land Relationships
2.3.4. Spatial Auto-Correlation Analysis
3. Results
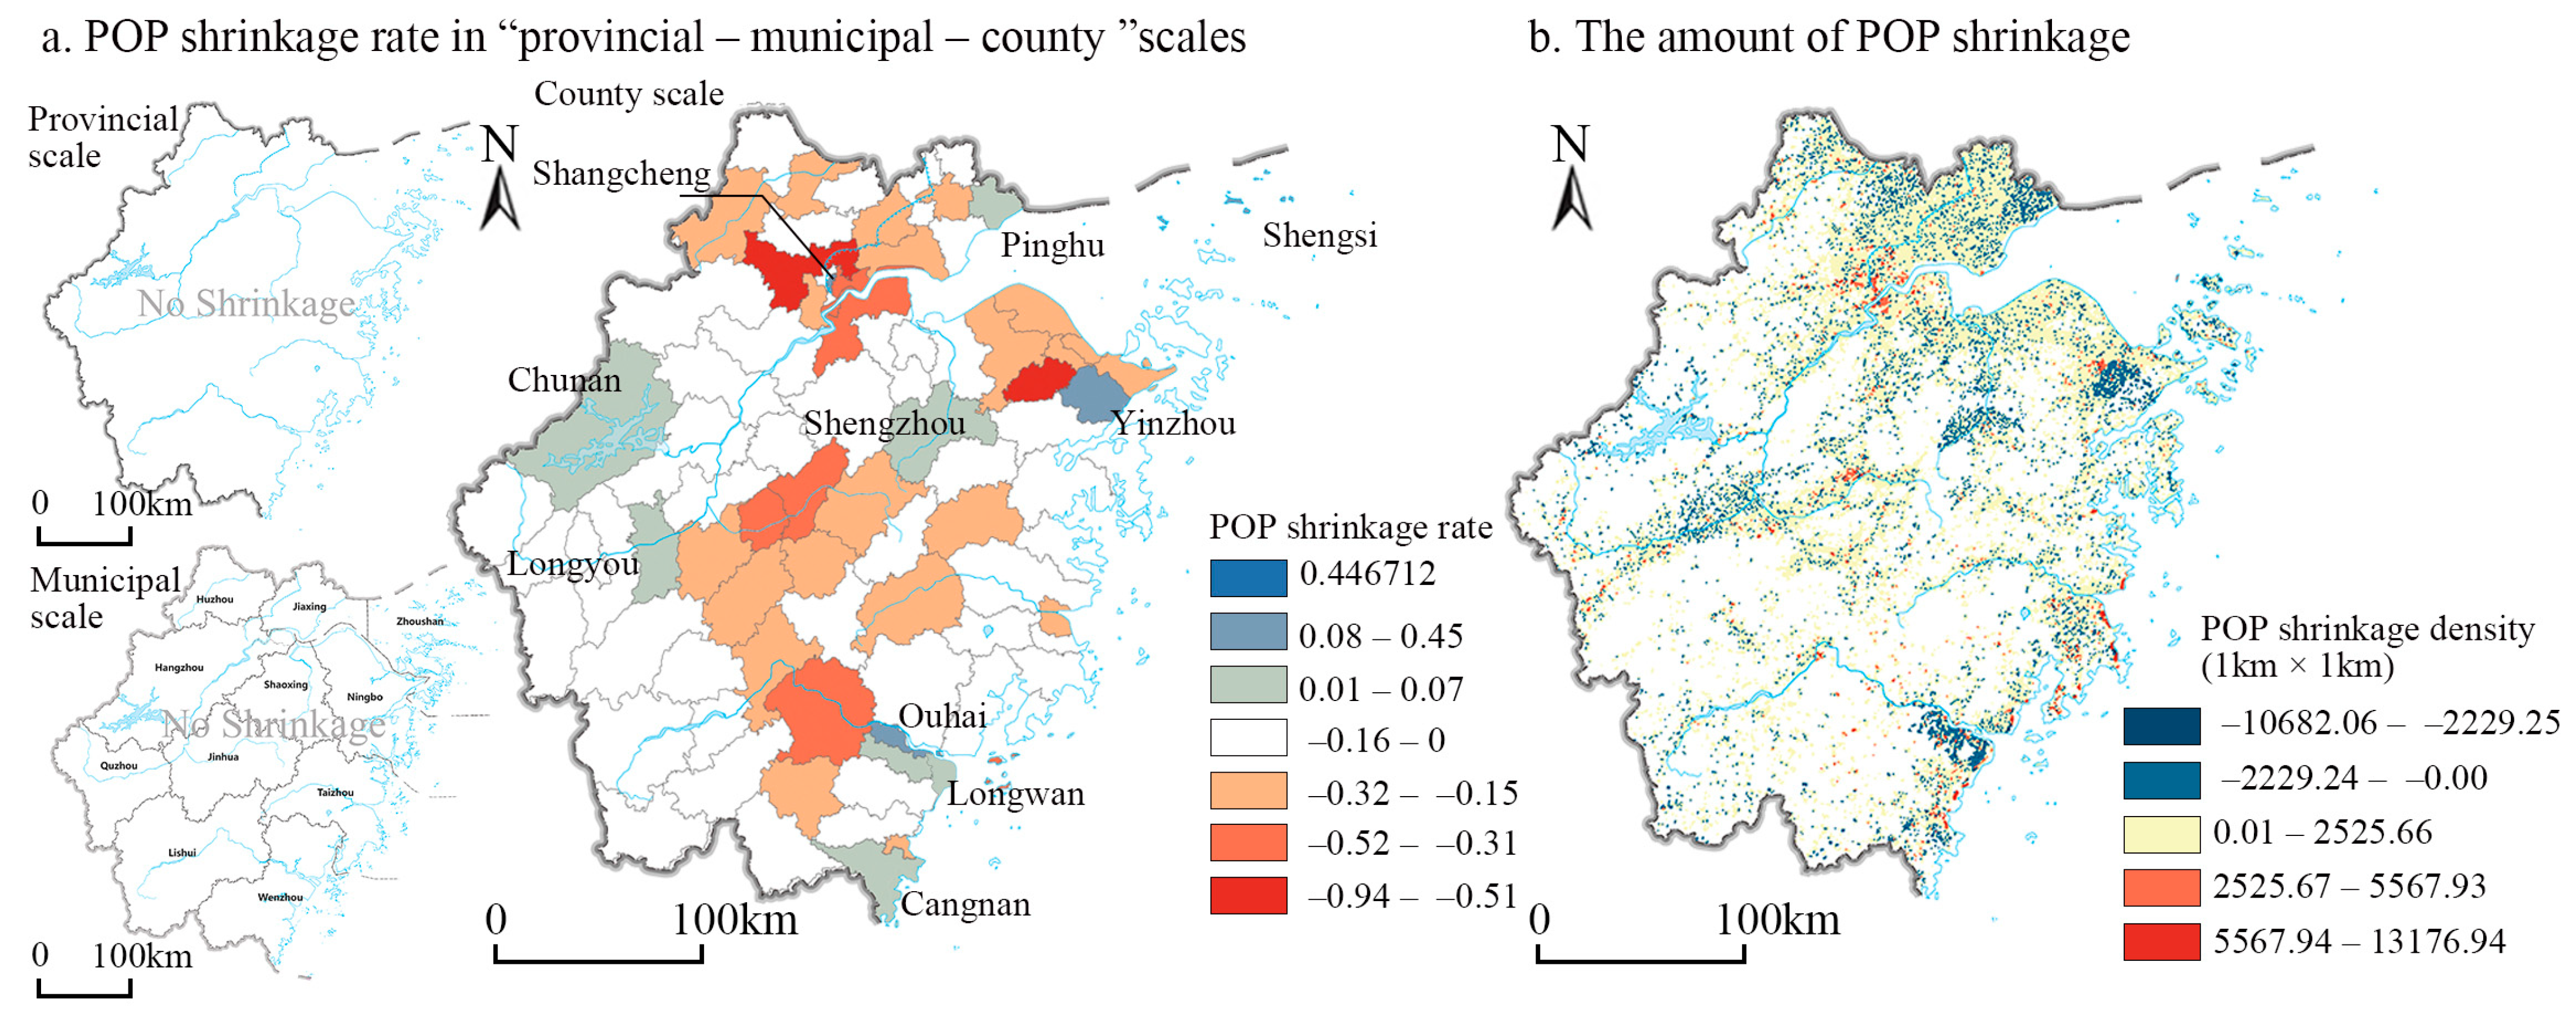
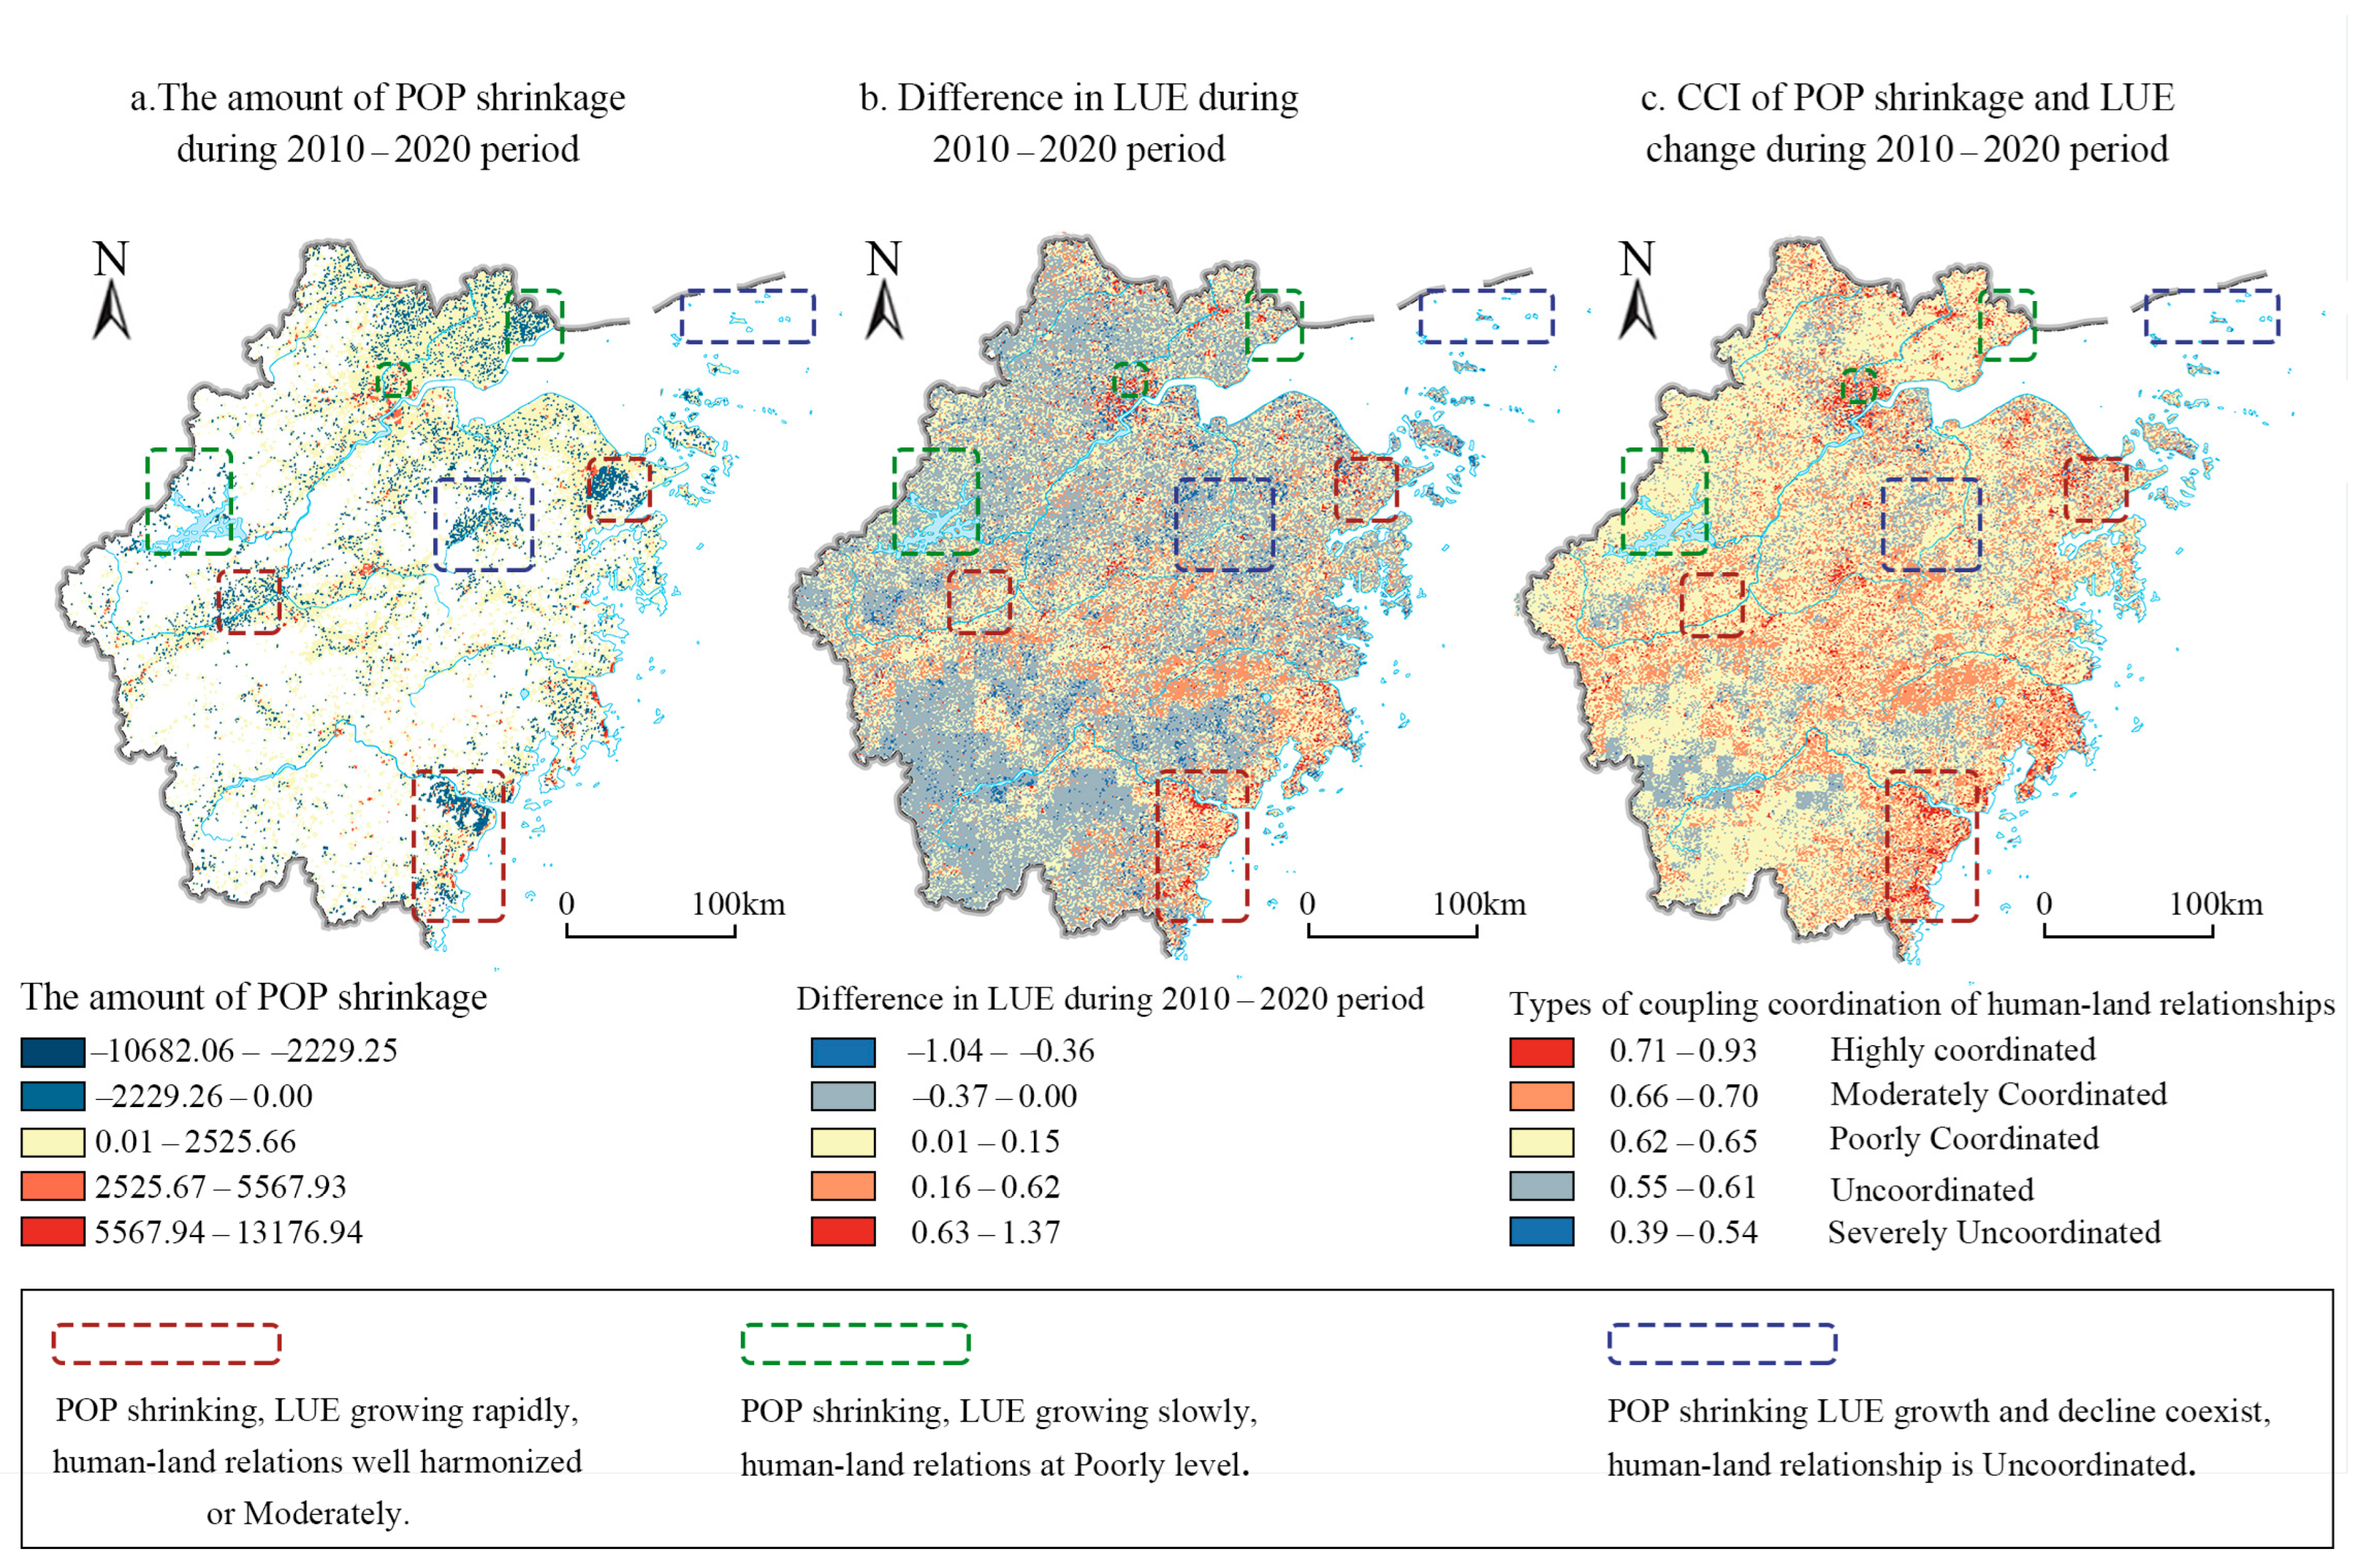
3.1. Subsection Population Shrinkage Situation
- Concentrated in economic centers along the north plain region and eastern coastal region, such as areas around the urban centers of Hangzhou, Ningbo, and Wenzhou, which are economically well-developed. For example, Xiacheng District of Hangzhou, Yinzhou District, and Shengzhou District around Ningbo, Ouhai District, Longwan District, and Cangnan District around Wenzhou.
- In economic centers near inland plains, such as areas around Jinhua City, for example, Longyou District around Jinhua.
- Proximity to Shanghai, the most economically developed city, where the northern plains along the border with Jiangsu Province and Shanghai Municipality exhibit a nearly continuous zone of shrinkage, for example, Pinghu District.
- Areas with unique geographical characteristics, such as some islands, for example, Shengsi District.
3.2. Land Use Situation
3.3. Coupling Coordination Types of Human–Land Relationships
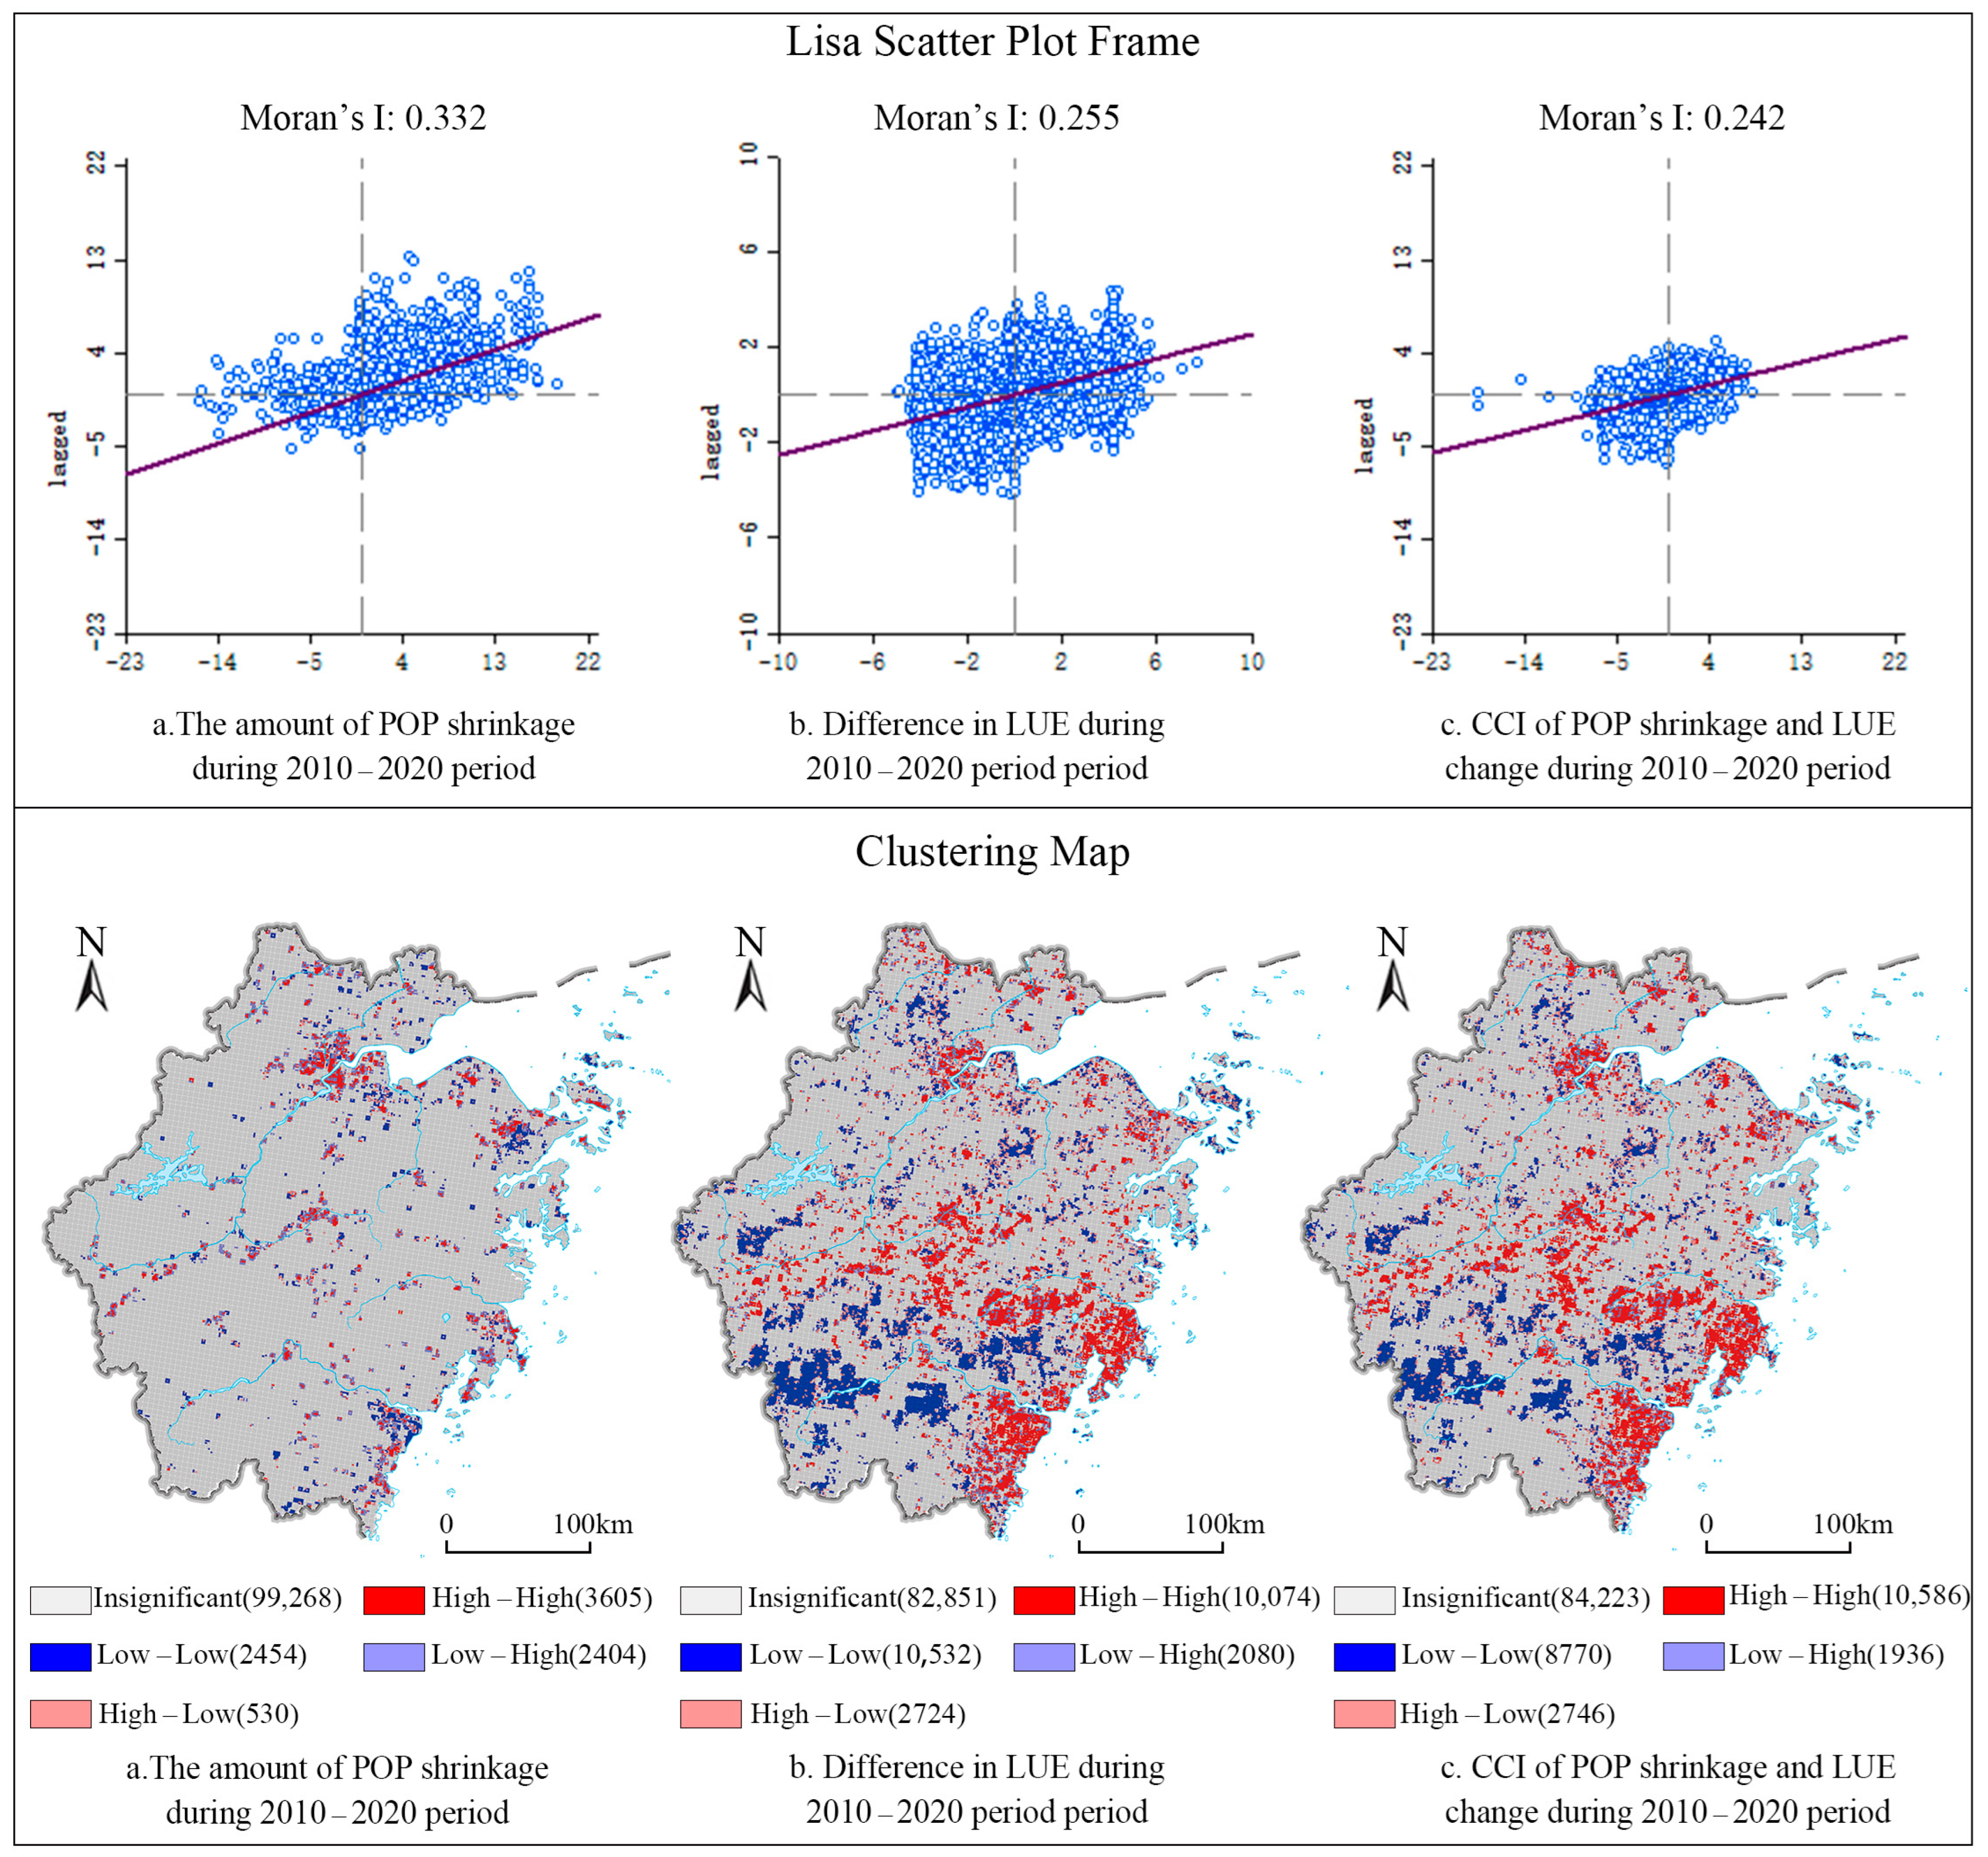
3.4. Spatial Auto-Correlation
4. Discussion
4.1. Reliability Test for LUE
4.2. Advantages and Limitation
4.3. Future Development Directions for Human–Land Relationships
4.3.1. Human–Land Relationship Coupling Coordination Warning Grading
4.3.2. Define the Types of Warning Units for Differentiated “Classification-Zoning” Guidance
- Specifically, red warning zones represent areas with severely uncoordinated human–land relationships and low resource allocation efficiency, predominantly located in population-growing regions along administrative boundaries in southwestern mountainous areas. For these zones, development-oriented planning should be intensified, leveraging local industrial strengths through government policies to attract high-end talent and cultivate regional specialty economies, thereby enhancing spatial utilization efficiency.
- Orange warning zones indicate uncoordinated human–land relationships, exclusively situated in population-shrinking regions such as Shengsi County in Zhoushan’s eastern offshore islands and Shengzhou City, Shaoxing. These zones require measures to reduce land waste and curb irrational urban expansion, including establishing urban growth boundaries and implementing urban renewal projects. Urban planning should integrate both development-oriented and shrinkage-responsive strategies based on local economic foundations and demographic profiles to address developmental imbalances. Resource allocation should be rationally adjusted to ensure broader coverage and accessibility.
- Yellow warning zones represent areas with low human–land relationship coordination. For population-shrinking yellow zones concentrated in Yinzhou District, Ningbo (eastern Zhejiang’s economic hub) and Longyou County, Quzhou (western Zhejiang, adjacent to Jinhua’s central economic zone), priority must be given to transforming development models to address resource supply imbalances and resolve inefficient spatial configuration or facility utilization in resource-abundant subregions. Implementing shrinkage-responsive planning with optimized intra-zone resource allocation is critical to prevent waste and low-efficiency land use, as exemplified by population-shrinking areas near the northeastern economic hubs of Hangzhou, Shaoxing, and Jiaxing. For population-growing yellow zones, development-focused strategies should enhance land use efficiency through improved resource utilization and facility layout adjustments.
- Blue warning zones indicate moderately coordinated human–land relationships. Population-shrinking blue zones clustered in the Hangzhou–Jiaxing–Huzhou metropolitan area should stabilize existing resource operations while strategically optimizing land functions to meet future demands. These areas must capitalize on their differentiated industrial strengths and regional synergies to drive multi-layered metropolitan development. Population-growing blue zones, primarily located in three regional centers and their connected central areas (e.g., Xianju County, Yongkang, and Wucheng), require consolidation of current development models to ensure stability.
- Green warning zones denote highly coordinated human–land relationships, exclusively found in population-shrinking regions such as Wenzhou (Lucheng, Ouhai, Longwan, and Cangnan districts). Governance here focuses on maintaining existing resource allocations, periodically assessing facility performance, and implementing targeted optimizations. Sustainable development necessitates maximizing existing facility efficiency while avoiding overdevelopment. The population shrinkage observed in Wenzhou’s southeastern economic hub reflects a natural equilibrium in urban maturation. Planning should align with this developmental phase by refining successful models. For these balanced, high-efficiency, and economically advanced zones, persisting with “growth-acceleration” urban strategies would precipitate spatial resource waste.
5. Conclusions
Author Contributions
Funding
Data Availability Statement
Conflicts of Interest
Abbreviations
| GDP | Gross Domestic Product |
| NTL | Nighttime Light |
| POP | Population |
| LFP | Labor Force Population |
| LPBE | Local Public Budget Expenditures |
| DIU | Disposable Income of Urban Residents |
| GSA | Green Space Area |
| POI | Point of Interest |
| LST | Land Surface Temperature |
| CO2 emission | Carbon Dioxide Emission |
| PM2.5 concentration | The concentration of Particulate Matter 2.5 |
| BUA | Built-up Land Area |
| BH | Building Height |
| LUE | Land Use Efficiency |
| CCI | Coupling Coordination Index |
References
- Oswalt, P.; Rieniets, T. Atlas of Shrinking Cities; Hatje Cantz: Ostfildern, Germany, 2006. [Google Scholar]
- Wiechmann, T. Errors expected—Aligning urban strategy with demographic uncertainty in shrinking cities. Int. Plan. Stud. 2008, 13, 431–446. [Google Scholar] [CrossRef]
- Schilling, J.; Logan, J. Greening the rust belt: A green infrastructure model for right sizing America’s shrinking cities. J. Am. Plan. Assoc. 2008, 74, 451–466. [Google Scholar] [CrossRef]
- Turok, I.; Mykhnenko, V. The trajectories of European cities, 1960–2005. Cities 2007, 24, 165–182. [Google Scholar] [CrossRef]
- Reis, J.P.; Silva, E.A.; Pinho, P. Spatial metrics to study urban patterns in growing and shrinking cities. Urban Geogr. 2016, 37, 246–271. [Google Scholar] [CrossRef]
- Huang, H. Smart Decline:Planning measures for urban decay and its practice in US. J. Urban Reg. Plan. 2017, 9, 164–175. [Google Scholar]
- Wu, K.; Liu, X.; Yao, C. The mechanisms of industrial transformation on the evolutionary trajectory of growth and shrinkage in Chinese resource-based cities. J. Nat. Resour. 2023, 38, 109–125. [Google Scholar] [CrossRef]
- Du, Z.; Zhang, H.; Ye, Y.; Jin, L.; Wang, C. Spatiotemporal evolution and influences of urban population shrinkage in Guangdong Since 2000. Trop. Geogr. 2019, 39, 22–30. [Google Scholar]
- Lan, F.; Gong, X.; Da, H.; Wen, H. How do population inflow and social infrastructure affect urban vitality? Evidence from 35 large-and medium-sised cities in China. Cities 2020, 100, 102454. [Google Scholar] [CrossRef]
- Zou, Z.; Shi, N.; Zhao, W. Research on the Identification and Influencing Factors of Urban Shrinkage in the Central Region. J. Henan Univ. 2022, 52, 518–530. [Google Scholar]
- Feng, Z.; Li, J.; Wang, S. Dynamic evolution and influencing factors of urban vitality of shrinking cities in Northeast China. Sci. Geogr. Sin. 2023, 43, 774–785. [Google Scholar]
- Zhou, Z.; Chen, H.; Wang, L. Dynamic characteristics and differentiation of construction land supply in shrinking small and medium-sised cities. Resour. Sci. 2024, 46, 321–335. [Google Scholar]
- Zhang, X.; Liu, Y.; Lv, C. Background, identification and characterization of urban shrinkage in China. J. Southeast Univ. 2016, 18, 132–139+148. [Google Scholar]
- Buhnik, S. From shrinking cities to Toshi no Shukushō: Identifying patterns of urban shrinkage in the Osaka metropolitan area. Berkeley Plan. J. 2010, 23, 132–155. [Google Scholar] [CrossRef]
- Rink, D.; Haase, A.; Bernt, M. Work Package 2: Urban Shrinkage in Leipzig and Halle, the Leipzig-Halle Urban Region, Germany; Helmholtz Centre for Environmental Research: Leipzig, Germany, 2010. [Google Scholar]
- Couch, C.; Cocks, M. Work Package 2: Urban Shrinkage in Liverpool, UK; School of the Built Environment, Liverpool John Moores University: Liverpool, UK, 2010. [Google Scholar]
- Li, Y.; Shu, B.; Wu, Q. Urban land use efficiency in China: Spatial and temporal characteristics, regional difference and influence factors. Econ. Geogr. 2014, 34, 133–139. [Google Scholar]
- Fang, X. On the index system of evaluating land utility efficiency. Syst. Eng. 2004, 22, 22–26. [Google Scholar]
- Wang, L.; Li, H.; Shi, C. Urban land use efficiency and its spillover effects and influencing factors in China. Acta Geogr. Sin. 2015, 70, 1788–1799. [Google Scholar]
- Gao, C. Study on Land Use Efficiency of Jilin Province in the Process of Urbanization. Ph.D. Thesis, Jilin University, Changchun, China, 2021. [Google Scholar]
- Charnes, A.; Cooper, W.W.; Rhodes, E. Measuring the efficiency of decision making units. Eur. J. Oper. Res. 1978, 2, 429–444. [Google Scholar] [CrossRef]
- Tone, K. A slacks-based measure of efficiency in data envelopment analysis. Eur. J. Oper. Res. 2001, 130, 498–509. [Google Scholar] [CrossRef]
- Couch, C.; Karecha, J.; Nuissl, H.; Rink, D. Decline and sprawl: An evolving type of urban development–observed in Liverpool and Leipzig. Eur. Plan. Stud. 2005, 13, 117–136. [Google Scholar] [CrossRef]
- Li, X.; Ma, X.; Hu, M. The mutual feedback mechanism of human-land-industry factors of the rural regional system. Geogr. Res. 2022, 41, 1981–1994. [Google Scholar]
- Xu, H.; Liu, Y. Spatiotemporal differentiation and influencing mechanism of construction land use efficiency of shrinking cities: A case study of Yichun City of Heilongjiang Province. Prog. Geogr. 2021, 40, 937–947. [Google Scholar] [CrossRef]
- Chen, T.; Zhang, H. Impact of intensive land use on urban economic development in Beijing-Tianjin-Hebei region. Urban Issues 2017, 24, 60–67. [Google Scholar]
- Zhang, H. Research on the relationship between intensive urban land use and urban economic growth. Urban Probl. 2013, 2017, 1–7. [Google Scholar]
- Oswalt, P. Shrinking Cities Volume 1: International Research; Hatje Cantz Publishers: Berlin, Germany, 2006. [Google Scholar]
- Haase, D.; Haase, A.; Kabisch, N.; Kabisch, S.; Rink, D. Actors and factors in land-use simulation: The challenge of urban shrinkage. Environ. Model. Softw. 2012, 35, 92–103. [Google Scholar] [CrossRef]
- Yang, L.; Chen, W.; Fang, C.; Zeng, J. How does the coordinated development of population urbanization and land urbanization affect residents’ living standards? Empirical evidence from China. Cities 2024, 149, 104922. [Google Scholar] [CrossRef]
- Yi, X.; Wang, S.; Zhang, H. Challenges and prospects of urban construction land in the context of population shrinkage: A case study of three northeastern provinces in China. Urban Plan. Forum 2023, 6, 68–78. [Google Scholar]
- Yang, D.; Long, Y.; Yang, W. Population loss and spatial expansion: The paradox of urban demographic shrinkage in China’s rapid urbanization. Mod. Urban Stud. 2015, 9, 20–25. [Google Scholar]
- Jarzebski, M.P.; Elmqvist, T.; Gasparatos, A.; Fukushi, K.; Pu, J. Ageing and population shrinking: Implications for sustainability in the urban century. Urban Sustain. 2021, 1, 17. [Google Scholar] [CrossRef]
- Kroll, F.; Haase, D. Does demographic change affect land use patterns: A case study from Germany. Land Use Policy 2010, 27, 726–737. [Google Scholar] [CrossRef]
- Han, H. Study on Shanghai Land Use Evolution of the Numerical Simulation and the Impact on Population, Economic and Environmental in Shanghai. Ph.D. Thesis, Fudan University, Shanghai, China, 2008. [Google Scholar]
- Ruan, L.; He, T.; Xiao, W.; Chen, W.; Lu, D.; Liu, S. Measuring the coupling of built-up land intensity and use efficiency: An example of the Yangtze River Delta urban agglomeration. Sustain. Cities Soc. 2022, 87, 104224. [Google Scholar] [CrossRef]
- Yu, J.; Zhou, K.; Yang, S. Land use efficiency and influencing factors of urban agglomerations in China. Land Use Policy 2019, 88, 104143. [Google Scholar] [CrossRef]
- Li, J.; Hu, B.; Kuang, B.; Chen, D. Measuring of Urban Land Use Efficiency and Its Dynamic Development in China. Econ. Geogr. 2017, 37, 162–167. [Google Scholar]
- Chen, Q.; Zhang, H.; Zhou, M. Efficiency and optimization strategy of land use efficiency at county (City) Level in Zhejiang Province. Bull. Soil Water Conserv. 2021, 41, 290–297. [Google Scholar]
- Wu, Y.; Shi, K.; Chen, Z.; Liu, S.; Chang, Z. Developing improved time-series DMSP-OLS-like data (1992–2019) in China by integrating DMSP-OLS and SNPP-VIIRS. IEEE Trans. Geosci. Remote Sens. 2021, 60, 1–14. [Google Scholar] [CrossRef]
- Xu, X.; Liu, J.; Zhang, S.; Li, R.; Yan, C.; Wu, S. China Multi-Period Land Use Remote Sensing Monitoring Dataset (CNLUCC); Resource and Environment Data Cloud Platform: Beijing, China, 2018. [Google Scholar]
- Wu, W.; Ma, J.; Banzhaf, E.; Meadows, M.; Yu, Z.; Guo, F.; Zhao, B. A first Chinese building height estimate at 10 m resolution (CNBH-10 m) using multi-source earth observations and machine learning. Remote Sens. Environ. 2023, 291, 113578. [Google Scholar] [CrossRef]
- Wei, J.; Li, Z.; Lyapustin, A.; Sun, L.; Peng, Y.; Xue, W.; Su, T.; Cribb, M. Reconstructing 1-km-resolution high-quality PM2.5 data records from 2000 to 2018 in China: Spatiotemporal variations and policy implications. Remote Sens. Environ. 2021, 252, 112136. [Google Scholar] [CrossRef]
- Peng, S.; Ding, Y.; Liu, W.; Li, Z. 1 km monthly temperature and precipitation dataset for China from 1901 to 2017. Earth Syst. Sci. Data 2019, 11, 1931–1946. [Google Scholar] [CrossRef]
- Statistics Bureau of the People’s Republic of China. China Population Cecsus Yearbook 2010; China Statistics Press: Beijing, China, 2010. [Google Scholar]
- Statistics Bureau of the People’s Republic of China. China Population Cecsus Yearbook 2020; China Statistics Press: Beijing, China, 2020. [Google Scholar]
- Yang, Q.; Duan, X.; Ye, L. Evaluation of urban land use efficiency based on SBM-Undesirable modeling--taking 16 cities in Yangtze River Delta region as an example. Resour. Sci. 2014, 36, 712–721. [Google Scholar]
- Banker, R.D.; Charnes, A.; Cooper, W.W. Some models for estimating technical and scale inefficiencies in data envelopment analysis. Manag. Sci. 1984, 30, 1078–1092. [Google Scholar] [CrossRef]
- Färe, R.; Grosskopf, S.; Norris, M.; Zhang, Z. Productivity growth, technical progress, and efficiency change in industrialised countries. Am. Econ. Rev. 2016, 84, 66–83. [Google Scholar]


| Data Categories | Indicator | Datatype | Year | Data Sources | Original Resolution | |
|---|---|---|---|---|---|---|
| Economic | GDP: Gross Domestic Product (10,000 Yuan/km2) | grid | 2010/2020 | The Resource and Environmental Science and Data Centre (RESDC) of the Chinese Academy of Sciences | 1 km | |
| LPBE: Local Public Budget Expenditure (10,000 Yuan) | statistics | 2010/2020 | Statistical yearbooks and social gazettes | - | ||
| NTL: Nighttime Light (NW/cm2/sr) | grid | 2010/2020 | [40] | 1 km | ||
| DIU: Disposable Income of Urban Residents (10,000 Yuan) | statistics | 2010/2020 | Statistical yearbooks and social gazettes | - | ||
| Social | POP: Population | statistics | 2010/2020 | The Sixth and Seventh Population Censuses | - | |
| LFP: Labor Force Population (people/km2) | statistics | 2010/2020 | Statistical yearbooks and social gazettes | - | ||
| POI: Point of Interest | shapefile | 2010/2020 | Gaode Map 2024 | - | ||
| Environment | Land use | BUA: Built-up Land Area (km2) | shapefile | 2010/2020 | [41] | 30 m |
| BH: Building Height (m) | grid | 2010 | Pengcheng Laboratory (pcl.ac.cn) | 30 m | ||
| grid | 2020 | [42] | 10 m | |||
| Administrative boundary data | shapefile | 2020 | Chinese National Administration of Surveying: bzdt.ch.mnr.gov.cn | - | ||
| DEM: Digital Elevation Model | grid | China National Earth System Science Data Sharing Service Platform: www.geodata.cn; accessed on 1 May 2024. | 30 m | |||
| Ecological environment | GSA: Green Space Area (km2) | shapefile | 2012 | Gaode Map 2024 | - | |
| shapefile | 2020 | Open Street Map | - | |||
| CO2 emission: Carbon Dioxide Emission (ppm) | grid | 2010/2020 | EDGAR-Global Greenhouse Gas Emissions EDGAR-The Emissions Database for Global Atmospheric Research (europa.eu); accessed on 1 May 2024. | 10 km | ||
| PM2.5 concentration: The concentration of Particulate Matter 2.5 (mg/m3) | grid | 2010/2020 | [43] | 1 km | ||
| LST: Land Surface Temperature (K) | grid | 2010/2020 | [44] | 1 km | ||
| Indicator Type | Indicator | Meaning of the Indicator |
|---|---|---|
| inputs | BUA: Built-up Land Area | Land input |
| LPBE: Local Public Budget Expenditures | Capital input | |
| LFP: Labor Force Population | Labor input | |
| expected output | GDP: Gross Domestic Product | Economic output |
| DIU: Disposable Income of Urban Residents | ||
| NTL: Nighttime Light | ||
| GSA: Green Space Area | Ecological output | |
| Number of POI | Social output | |
| Number of medical facility POI | ||
| Number of educational and cultural facilities POI | ||
| Number of catering and shopping POI | ||
| BH: Building Height | Land use output | |
| non-expected output | CO2 emission | Environmental pollution output |
| PM2.5 concentration | ||
| LST: Land Surface Temperature | Environmental heat island effect output |
| Population Change | LUE Change | Human–Land Relationship | Districts or Countries |
|---|---|---|---|
| Population shrinkage | LUE grows faster | Highly coordinated | Wenzhou: Lucheng District, Ouhai District, Longwan District, Cangnan County |
| Moderately coordinated | Ningbo: Yinzhou District Quzhou: Longyou County | ||
| LUE grows and falls in parallel | Poorly coordinated | Hangzhou: Chun’an County, Xiucheng District Jiaxing: Pinghu | |
| LUE falls mostly | Uncoordinated | Zhoushan: Shengsi County Shaoxing: Shengzhou | |
| Population growth | LUE falls mostly | Severely uncoordinated | South-West Mountain area administrative division junction |
| LUE falls mostly | Poorly coordinated | most area | |
| LUE grows faster | Moderately coordinated | Three regional centers, and the central areas connected to them (Xianju County, Yongkang County, Wucheng County) |
| Warning Type | D Range | Current Proportion | Key Issues | Suggestion | Response Type |
|---|---|---|---|---|---|
| Red Warning | D ≥ 0.71 | 1.31% | Supply and demand imbalance: severely uncoordinated human–land relationships | Keynote | Population growth areas: promoting development (concentrated in population-growing areas along southwestern mountainous administrative boundaries) |
| Orange Warning | 0.66 ≤ D < 0.70 | 10.09% | Inefficient utilization: uncoordinated human–land relationships | Population shrinkage areas: implementing shrinkage planning (e.g., Shengsi County, Shengzhou City) | |
| Population growth areas:overcoming waste and irrational expansion, reasonably utilizing stock | |||||
| Yellow Warning | 0.62 ≤ D < 0.65 | 57.71% | Low human–land relationship coordination | Priority | Population shrinkage areas: transforming development models (e.g., Yinzhou District, Longyou County) |
| Population growth areas: improving efficiency | |||||
| Blue Warning | 0.55 ≤ D < 0.61 | 26.13% | Moderately coordinated human–land relationships. | Prevent | Population shrinkage areas: stable resources, timely updates (e.g., Xianju County, Yongkang, Wucheng) |
| Population growth areas: ensuring stability of development (e.g., Hangzhou–Jiaxing–Huzhou metropolitan area) | |||||
| Green Warning | D ≤ 0.54 | 4.76% | Steady state equilibrium: highly coordinated human–land relationships | Monitor | Population shrinkage areas: maintain the status quo, conduct regular evaluations, monitor learning, and summarize experience (e.g., Yinzhou District, Longyou County) |
Disclaimer/Publisher’s Note: The statements, opinions and data contained in all publications are solely those of the individual author(s) and contributor(s) and not of MDPI and/or the editor(s). MDPI and/or the editor(s) disclaim responsibility for any injury to people or property resulting from any ideas, methods, instructions or products referred to in the content. |
© 2025 by the authors. Licensee MDPI, Basel, Switzerland. This article is an open access article distributed under the terms and conditions of the Creative Commons Attribution (CC BY) license (https://creativecommons.org/licenses/by/4.0/).
Share and Cite
Li, Z.; Wang, C.; Wang, J. Research on Spatial Coupling Coordination of Population Shrinkage and Land Use Efficiency from the Human–Land Relationship Perspective: Case Study of Zhejiang Province, China. Land 2025, 14, 811. https://doi.org/10.3390/land14040811
Li Z, Wang C, Wang J. Research on Spatial Coupling Coordination of Population Shrinkage and Land Use Efficiency from the Human–Land Relationship Perspective: Case Study of Zhejiang Province, China. Land. 2025; 14(4):811. https://doi.org/10.3390/land14040811
Chicago/Turabian StyleLi, Zijia, Chenhao Wang, and Jiwu Wang. 2025. "Research on Spatial Coupling Coordination of Population Shrinkage and Land Use Efficiency from the Human–Land Relationship Perspective: Case Study of Zhejiang Province, China" Land 14, no. 4: 811. https://doi.org/10.3390/land14040811
APA StyleLi, Z., Wang, C., & Wang, J. (2025). Research on Spatial Coupling Coordination of Population Shrinkage and Land Use Efficiency from the Human–Land Relationship Perspective: Case Study of Zhejiang Province, China. Land, 14(4), 811. https://doi.org/10.3390/land14040811