Article

Evaluation of Rural Human Settlement Development Quality and Impact Analysis: Empirical Evidence from China’s Micro Survey?

College of Economics and Management, Huazhong Agricultural University, Wuhan 430070, China
*
Author to whom correspondence should be addressed.
Land 2025, 14(4), 780; https://doi.org/10.3390/land14040780
Submission received: 7 March 2025 / Revised: 1 April 2025 / Accepted: 3 April 2025 / Published: 4 April 2025

Abstract

:
Improving the quality of rural human settlements is a key objective in China’s rural revitalization strategy. The purpose of this study is to construct and evaluate the quality of rural human settlements in China from a micro perspective. To achieve this objective, the main tasks include constructing an evaluation system for rural human settlement quality from a micro perspective; measuring the overall and dimension-specific quality levels of rural human settlements using the entropy method based on data from 108 villages in Shandong, Jilin, and Hubei provinces; and further analyzing the influencing factors of rural human settlement quality, focusing on village per capita income, resident population, fire incidents, and agricultural input prices. The findings reveal the following: (1) The overall quality of rural human settlements in Hubei, Shandong, and Jilin is at a moderate-to-low level, with no significant differences among provinces. (2) Among the various dimensions of rural human settlement quality, economic development and public services score higher, whereas living facilities and sanitary conditions score relatively lower, reflecting the inertia of long-term resource allocation and the lagged effects of emerging projects. (3) An increase in village per capita net income and the resident population significantly improves rural human settlement quality, whereas incidents such as village fires and sharp increases in agricultural input prices significantly reduce it. This study provides empirical insights into the mechanisms affecting rural human settlement quality from a micro perspective and offers policy implications for its targeted improvement.

1. Introduction

With the deepening implementation of China’s rural revitalization strategy, the development of rural human settlements has gradually become an integral part of the country’s modernization efforts. The Five-Year Action Plan for the Improvement and Enhancement of Rural Human Settlements (2021–2025), released by the General Office of the State Council of China, states the following: “The improvement and enhancement of rural human settlements is an important task in implementing the rural revitalization strategy and a key measure for promoting agricultural and rural modernization”. This initiative is not only crucial for enhancing the living quality of rural residents but also for achieving agricultural and rural modernization. The Three-Year Action Plan for Rural Human Settlement Improvement, released in 2018, was the first to systematically outline the goals and pathways for improving rural human settlements. Subsequently, the 14th Five-Year Plan for Rural Human Settlement Improvement and Enhancement further clarified the need to comprehensively improve the ecological livability of rural areas by strengthening infrastructure construction, promoting green development, and enhancing environmental governance. With strong policy support and active government initiatives at all levels, rural human settlement development has gradually advanced toward a stage of high-quality development. However, challenges such as uneven resource allocation, insufficient public services, and delayed environmental governance persist. Under these new circumstances, there is an urgent need for systematic and innovative measures to achieve the comprehensive improvement and sustainable development of rural human settlements.
Since Greek scholar Doxiadis introduced the concept of “human settlement science” in 1958, international scholars have conducted extensive research on human settlements, primarily considering rural human settlements as part of urban human settlements. The main research focuses include the evolution of rural human settlements and their mechanisms [1,2,3,4], exploring the changes in rural human settlements at different historical stages and the driving factors behind them; the sustainable development of rural human settlements [5,6], examining how to improve the quality of life and human settlements in rural areas while maintaining ecological balance, economic development, and social harmony; the human settlements in urban fringe areas [7,8], involving the complex interactions between living conditions, ecological environment, and socio-economic structures at the junction of urban and rural areas; the formation of rural settlements and their theoretical framework [9,10,11], studying the origins, evolution process, spatial distribution, and influencing factors of rural settlements to explore the development patterns of rural settlements; and counter-urbanization and rural migration trends [12,13,14,15], analyzing the phenomenon of population migration from cities to rural areas in modern society and its driving factors. Overall, international research on rural environments typically starts from multiple dimensions such as ecological environment, socio-economy, infrastructure, and cultural heritage, and explores the development models and changing trends of rural human settlements in combination with the unique geographical, economic, and social contexts of different countries.
Domestic research on rural human settlements focuses on the following aspects: First, it explores rural residents’ participation in human settlement governance, exploring the individual and socio-economic factors that influence their willingness and behavior to engage in governance. For example, rural residents’ participation in human settlement governance is not only related to individual factors such as their income level [16], education level [17], and environmental awareness [18] but also to socio-economic factors such as institutional trust [19], social supervision [20], and governance costs of human settlement projects [21]. Second, it examines the current state and challenges of rural human settlement governance in China, using micro-level surveys that investigate issues such as environmental degradation [22,23,24,25,26], regional disparities [27], and governance difficulties [28] in rural human settlements. Third, it examines the cognition and evaluation of rural human settlements [29], which involve both rural residents’ and external groups’ perceptions of rural living conditions, ecological environment, infrastructure, and social services, as well as the scientific assessment of their quality through evaluation indicator systems. Fourth, it highlights the government’s central role in the public infrastructure supply mechanism, emphasizing the importance of government resource investment [30] and governance [31] in infrastructure and public services. For example, Min et al. [29] evaluated the policy implementation effects of rural public facility supply and renovation projects and found that such projects significantly enhanced farmers’ enthusiasm for participating in toilet renovation, reducing sewage and solid waste emissions [32]. Overall, domestic research on rural human settlements primarily reflects China’s focus on rural environments, infrastructure, economic development, and social governance in the context of rapid urbanization.
This paper argues that most existing studies on the assessment of rural human settlement quality focus on the analysis of urban human settlement quality and regional differences [33], with evaluations of rural human settlement quality mostly concentrating on single regions [34]. There are few studies comparing rural human settlements across provinces [35], with a lack of research exploring the real development conditions of rural human settlements from a micro perspective. Clearly, existing studies on rural human settlements rarely analyze regional differences and their relationship with village characteristics from a micro perspective, despite the critical role such research plays in formulating localized policies for improving rural human settlements.
Compared to existing studies, this paper makes three new attempts in the following aspects: First, in terms of research content, most existing studies have focused on macro-level data indicators, neglecting the autonomy of rural governance subjects and the unique characteristics of each rural area. This paper, based on numerous rural revitalization practices such as rural education, healthcare, sanitation toilet renovation, and drinking water improvement in China, constructs a relatively comprehensive rural human settlement quality evaluation system from the micro-level perspective of rural subjects and conducts a scientific assessment. Second, in terms of research perspective, existing studies on rural human settlement quality assessment lack an examination of the autonomy of rural governance subjects and adaptability to socio-economic environments. This paper, based on survey data from 108 villages across Hubei, Shandong, and Jilin provinces, explores the differences between provinces and development disparities across various dimensions. Through comparisons across these dimensions, this study not only investigates the development gaps between provinces but also highlights the root causes of disparities in the advancement and outcomes of rural revitalization infrastructure. Third, in terms of research methodology and depth, rural human settlement quality significantly varies depending on local economic environments, population structures, social governance stability, and price levels. Further attention to the village-specific characteristics of each rural area provides important theoretical value and practical guidance on how to improve rural human settlement quality.
Based on the above analysis, this study aims to construct and evaluate the quality of rural human settlements in China from a micro perspective. To achieve this objective, the study first develops an evaluation framework for rural human settlement quality from a micro perspective, drawing on the characteristics of rural human settlement practices and policy guidelines in China. Second, using data from 108 villages in Shandong, Jilin, and Hubei provinces, the entropy method is employed to measure the overall quality of rural human settlements as well as their sub-dimension scores. Furthermore, the study explores the influencing factors of rural human settlement quality from the perspectives of village per capita income, resident population, fire incidents, and agricultural input prices.

2. Construction of the Indicator System

2.1. Current Relevant Standards for the Rural Human Settlement Indicator System in China

From the policy documents and relevant standards issued by the Chinese government and related departments in recent years, the top-level design, specific targets, and practical guidelines for the development of rural human settlements are quite mature. These documents not only reflect the current state of rural human settlement development in China but also strike a good balance between urban–rural coordinated development and the rational allocation of resources. Table 1 presents the relevant documents for the human settlement indicator evaluation system in China.

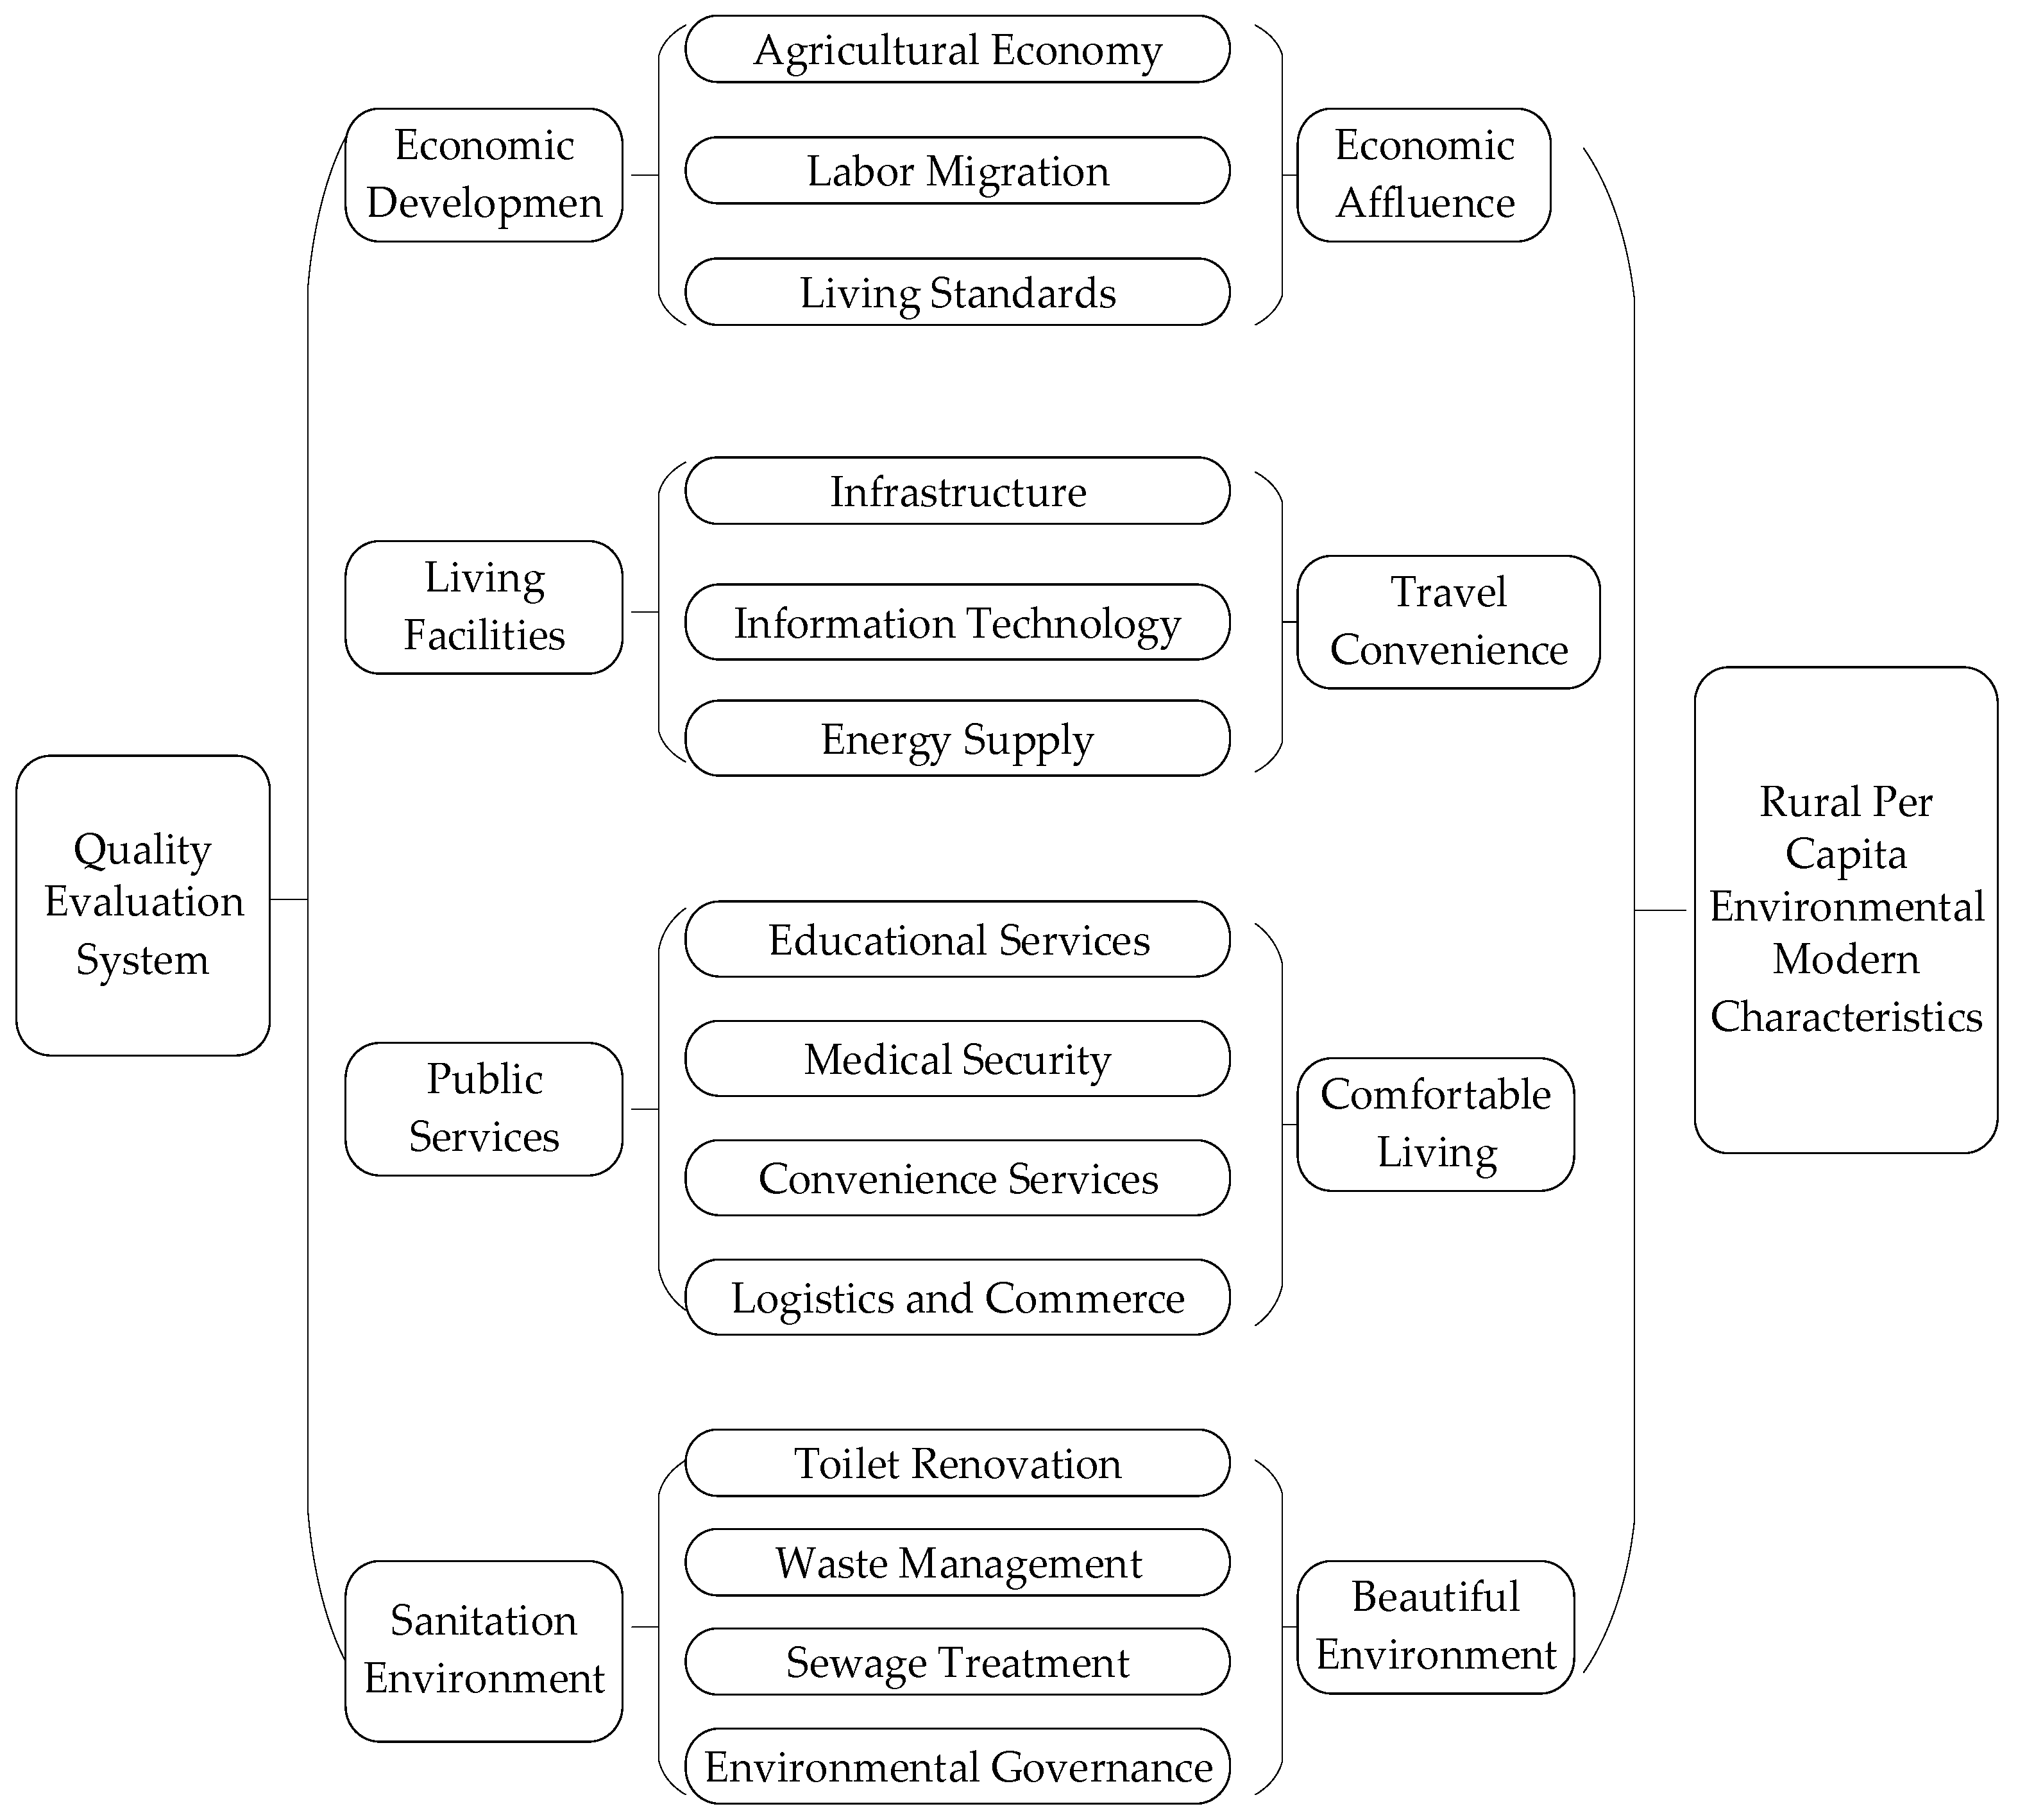
2.2. Design of the Quality Assessment Indicator System

The standards and principles for evaluating the quality of rural human settlements in China involve a multi-level comprehensive analysis, covering various fields such as environmental governance, ecological protection, public services, and infrastructure. This article comprehensively weighs the selection of rural human settlement quality evaluation indicators based on the following three aspects: First, based on China’s rural revitalization strategy and sustainable development concept, it comprehensively evaluates existing policies, national standards, and policy reports related to rural human settlement quality standards and guidelines. Second, building on existing research, it considers the differences and commonalities in evaluation approaches, perspectives, and selected data levels used in previous studies on rural human settlement assessment. Third, starting from the micro survey data at the village level, it selects rural human settlement quality evaluation indicators based on data availability and the fundamental facts from the micro survey data. Specifically, this article scientifically, objectively, and comprehensively evaluates the comprehensive development level of rural human settlements across four dimensions: economic development, living facilities, public services, and sanitation. The economic development dimension of rural human settlement quality mainly measures the economic well-being of rural residents, while the living facilities dimension reflects the convenience of residents’ daily activities. The public service dimension primarily reflects rural residents’ life satisfaction and happiness, and the sanitation environment dimension mainly reflects the comfort of the living environment for rural residents. The framework for analyzing China’s rural human settlement quality evaluation indicator system is shown in Figure 1.

2.2.1. Economic Development Dimension

The quality of the rural living environment is closely related to economic prosperity, which is mainly reflected in three aspects: production, sources of income, and consumption capacity. Therefore, drawing on existing research perspectives [36], we choose agricultural economy (production), labor migration (sources of income), and living standards (consumption capacity) to measure this dimension, each representing a different aspect of the rural economy.
(1)
Agricultural economy. Traditional agriculture holds a central position in the rural economy but is also a primary environmental carrier. Agricultural production methods and technological advancements directly determine the consumption and pollution of land, air, and water resources. With the development and application of agricultural production technologies, particularly modernized agricultural practices such as precision agriculture and sustainable farming, agricultural efficiency has significantly improved while reducing environmental pollution. This study selects six indicators to measure the agricultural economic aspect: the land transfer rate, number of village enterprises, number of specialized crop farmers, number of specialized livestock farmers, rate of agricultural socialized service provision, and ratio of irrigable dry farmland.
(2)
Labor migration. As part of the labor migration process, a significant number of rural populations work in cities and bring their earnings back to rural areas. This “economic reflux” effect plays a crucial role in boosting the rural economy and improving living conditions. Additionally, labor migration facilitates the transfer of knowledge and experience. This bidirectional movement is not merely about labor force mobility but also about updating mindsets, influencing lifestyle choices, environmental awareness, residential concepts, consumption behaviors, and production activities. This study evaluates labor migration using five indicators: the ratio of outbound labor, ratio of returning labor, ratio of local to county-level urban labor income, ratio of local to provincial capital urban labor income, and ratio of non-agricultural employment.
(3)
Living standards. As rural residents’ income levels rise, their standard of living shifts from basic subsistence to higher-quality living. This transformation is reflected in aspects such as housing conditions, infrastructure, public services, and sanitation. Additionally, the demand for environmental quality has increased, including cleaner air, safer water sources, and healthier living environments. This study uses the Engel coefficient of village residents as an indicator to measure living standards.

2.2.2. Living Facilities Dimension

The living facilities dimension in this study is primarily used to reflect the travel convenience in rural areas. Travel convenience depends not only on transportation infrastructure but also on factors such as information flow and energy supply. Infrastructure (such as roads and transportation facilities) directly impacts the physical conditions of travel; informatization (such as communication networks and digital traffic information) affects access to and decision-making regarding travel information; energy supply (such as electricity and natural gas) influences travel demand and convenience in daily life. Drawing on existing research approaches [37,38], this study divides the living facilities dimension into three aspects: infrastructure, informatization, and energy supply, which are used to reflect the travel convenience in the rural living environment quality.
(1)
Infrastructure. Infrastructure includes factors such as road network density, road hardening rate, and the number of communication signal towers, which directly determine the basic living conditions of rural residents. Infrastructure not only affects the convenience of daily life but also impacts public health, living comfort, and overall environmental improvement. This study selects the hardening rate of main village roads and the number of signal towers as indicators to measure infrastructure conditions.
(2)
Informatization. The improvement of rural informatization has significantly enhanced economic and social conditions in rural areas. Through information technology, rural residents can access market information, agricultural knowledge, healthcare services, and educational resources more conveniently, breaking the information barriers between rural areas and the outside world. This study selects the desktop computer usage rate, smartphone usage rate, and broadband connection rate as indicators to measure the level of informatization.
(3)
Energy supply. With the promotion of clean energy sources such as solar power, wind energy, and biogas, rural energy consumption is gradually shifting towards a green and sustainable model. This transformation not only improves energy efficiency but also significantly reduces environmental damage. Additionally, the use of clean energy can lower household pollution emissions, improve air quality, and provide a more stable electricity supply, facilitating the adoption of modern household appliances, thereby enhancing convenience and living comfort. This study selects the proportion of online utility bill payments and the natural gas connection rate as indicators to measure energy supply conditions.

2.2.3. Public Services Dimension

This study divides the public services dimension into four aspects: educational services, medical security, convenience services, and logistics and commerce, each reflecting the level of travel convenience in rural human settlement quality. The selection of these four aspects is based on their representation of the core elements of public services in rural areas, as well as their alignment with the actual conditions in rural environments. In many rural areas, educational resources, medical security, and convenience services are often concentrated in distant locations, and logistics and commerce facilities are often lacking [39]. By dividing the dimension into these four aspects, we can better understand and assess the impact of these public services on the level of life satisfaction in the evaluation of rural human settlement quality.
(1)
Educational services. The accessibility and quality of educational services in rural areas directly impact the accumulation of human capital among rural residents. A lower level of education often limits skill development in the rural workforce, leading to long-term economic stagnation. Conversely, high-quality education services not only cultivate a highly skilled workforce for rural areas but also improve agricultural production methods, promote agricultural modernization, and enhance overall living standards. This study selects the public transportation coverage rate and the number of annual education training participants in villages as indicators to measure educational services, where the public transportation coverage rate reflects the accessibility of education for rural students.
(2)
Medical security. Medical security is a core safeguard for rural residents’ quality of life and the sustainability of the workforce. Rural areas often face challenges such as inadequate medical resources, low-quality healthcare services, and poor sanitary conditions, which contribute to the prevalence of chronic diseases and infectious diseases. These health issues reduce the availability of an effective labor force and hinder continuous productivity improvements. This study selects the number of standardized village clinics, the number of village doctors, the participation rate in the New Rural Cooperative Medical Scheme (NRCMS), and the participation rate in the New Rural Social Pension Scheme (NRPS) as indicators to measure medical security.
(3)
Convenience services. Convenience services include essential services such as postal services, government administrative services, and public transportation, which directly determine the ease of daily life for rural residents. These services not only improve residents’ quality of life but also reduce the gap between rural and urban areas, fostering the modernization of rural living. This study selects the distance to township shopping streets, the distance to township government offices, the number of office computers in the village committee, and the number of village social groups as indicators to measure convenience service levels.
(4)
Logistics and commerce. The development of logistics and commerce is crucial for rural economic growth, as it facilitates access to essential goods and provides channels for selling agricultural products. With the expansion of e-commerce and logistics networks, rural agricultural products can be more easily sold to external markets, while modern and high-quality consumer goods can be introduced to rural areas, improving residents’ living standards. This study selects the number of express delivery points, the number of village supermarkets and small shops, and the number of village restaurants as indicators to measure the development of logistics and commerce.

2.2.4. Sanitation Environment Dimension

The demand for improvements in sanitation in rural areas is often urgent, as residents commonly face issues such as a lack of sanitation facilities and improper sewage and waste disposal. The level of improvement in toilet renovations, waste disposal, sewage treatment, and environmental management directly reflects the accessibility and effectiveness of these public health services [40]. Rural sanitation directly affects the quality of the living environment, and these four aspects address the most common environmental sanitation issues in daily rural life. Therefore, the selection of these aspects helps comprehensively reflect the actual level of environmental beauty in rural areas.
(1)
Toilet renovation. Toilet renovation is a crucial measure for improving rural sanitation conditions and reducing disease prevalence. In many rural areas, traditional rudimentary toilets lack necessary sanitation management, leading to untreated human and livestock waste exposure, which increases the risk of public health issues such as intestinal infectious diseases and parasitic infections. This study selects the toilet renovation rate, the actual usage rate of renovated toilets, and the number of public toilets in villages as indicators to measure the extent of toilet renovation.
(2)
Waste management. With rural economic development and lifestyle changes, solid waste issues—such as household garbage and agricultural waste—have become increasingly prominent in rural areas. Effective waste management, including waste classification, collection, transportation, and harmless disposal, can significantly reduce the environmental impact of waste, improve the rural ecological environment, and enhance the quality of rural human settlements. This study selects the number of harmless waste treatment facilities as an indicator to measure the level of waste management.
(3)
Sewage treatment. If rural sewage issues are not effectively addressed, untreated wastewater may be directly discharged into rivers, lakes, and groundwater, leading to water pollution. This not only threatens the safety of drinking water for rural residents but also damages local aquatic ecosystems, subsequently affecting agricultural production and the overall living environment. This study selects the number of domestic sewage purification facilities as an indicator to measure sewage treatment conditions.
(4)
Environmental governance. Environmental issues in rural areas often result from multiple factors, such as excessive land use, agricultural pollution, and industrial waste discharge. Comprehensive environmental governance measures can effectively control and restore these issues, improving rural ecological quality and providing residents with a more livable environment. This study selects the number of annual environmental cleanups and the natural disaster incidence rate as indicators to measure the level of environmental governance.
The selection of evaluation indicators for rural human settlement quality in China is shown in Table 2.

3. Study Area, Data, and Models

3.1. Study Area and Data

The data in this study come from field visits and surveys conducted by the research team in Hubei, Shandong, and Jilin provinces from July to August 2022. The respondents were either the household head or other family members involved in household economic and consumption decisions, as well as village leaders such as village heads and village committee secretaries. A stratified random sampling method was used to select sample households. First, all counties in each province were divided into four groups based on per capita industrial output, from highest to lowest. One sample county was randomly selected from each group. Then, all townships within each county were divided into three groups based on per capita net industrial output, and one township was randomly selected from each group. Finally, three sample villages were randomly selected from each township, and ten sample households were randomly selected from each sample village. Using this sampling method, a total of 1080 household questionnaires and 108 village-level questionnaires were collected from the three provinces. The samples in this study come from Hubei, Shandong, and Jilin provinces, selected primarily for their representativeness in rural development. Hubei, Shandong, and Jilin represent the central, eastern, and northeastern regions of China, respectively, each with distinct rural economic and social backgrounds. Therefore, these samples can reflect the quality of rural living environments under different geographical, economic, and cultural contexts. Although the sample size in this study is 108 villages, statistical tests for this sample size have been thoroughly analyzed. The representativeness of the data, its distribution, and the control of regional differences have been taken into account to ensure that the research results possess a certain level of statistical significance. The study area is shown in Figure 2.
Specifically, 360 household questionnaires were collected from Hubei, Shandong, and Jilin provinces each. The household questionnaire primarily covered the respondent’s personal basic information, family situation, detailed consumption and expenditure information, as well as their use of digital finance. The village-level questionnaire focused on economic and population information, natural resources and environmental information, infrastructure conditions, and information related to the internet and community. The descriptive statistical analysis results based on the selected indicators are shown in Table 3.
From Table 3, we can see that there is still significant room for improvement within the various indicators of rural living environment quality in China, with notable regional differences.
Within the economic development dimension, first, in terms of agricultural economy, the land transfer rates in Hubei and Shandong are 35.9% and 37.5%, respectively, which are higher than Jilin’s 31.5%. Jilin has developed large-scale agriculture earlier, achieving a higher land transfer completion rate, while Hubei and Shandong began land transfer later, resulting in higher actual land transfer rates. This characteristic is reflected in the number of specialized farmers, showing that Jilin has far more specialized farmers than Hubei and Shandong. However, in terms of the agricultural socialized service provision rate, Jilin scores much lower than Hubei and Shandong. These data reflect the significant results of Jilin’s agricultural scale and industrialized operations. In the labor migration dimension, labor outflow and inflow levels are very high in all three provinces, with the overall sample averages being 89.1% and 71.7%. These data show that labor migration and employment remain the main forms of labor movement in the three provinces, with migrant workers seeking higher income levels to improve family life. However, the high labor inflow also suggests that the attractiveness of migrating for work is not very strong, and this situation can be confirmed by the local-to-county and county-to-provincial income ratio. The income ratio gap between local and county or provincial income does not exceed 35%, indicating that local employment and entrepreneurship have become an important choice for rural labor. This allows increased family involvement without significantly lowering income levels, which not only helps improve the educational situation of left-behind children but also increases support for elderly people in empty-nest households. More importantly, the return of rural labor will provide sufficient talent and labor resources for rural revitalization and the improvement of rural living environments.
Within the dimension of living facilities, regarding infrastructure, there is little difference among the three provinces in terms of the hardening rate of major village roads, all close to 100%, indicating that infrastructure construction in these regions is relatively well developed. In terms of information technology, there is little difference among the three provinces in the usage rates of desktop computers and smartphones, but the broadband penetration rate in the surveyed villages of Hubei is relatively low, at 34.3%. Regarding energy supply, with the rise in digital technology and online payments, the ratio of online payments for water and electricity bills in the three provinces is over 90%, but the use of natural gas is limited by the lower level of local energy supply infrastructure construction. The upgrading of the energy consumption structure has been slow, and the usage ratio is low. However, the rural energy consumption structure has gradually shifted towards the consumption of liquefied gas and electricity.
Within the dimension of public services, regarding educational services, the annual number of educational trainings in Jilin villages is 110.86, far exceeding other regions, indicating that the province has increased investment in rural education and training. It also shows that the development of agricultural scale, mechanization, and market-oriented operations forces agricultural workers to improve their professional quality, creating a mutually reinforcing process. In terms of medical insurance, the number of standardized clinics in villages across the three provinces is 1, with an average of 1.6 village doctors per province. This indicates that medical facilities are gradually improving, and with the insurance rates of the New Rural Cooperative Medical Scheme (NRCMS) and New Rural Social Pension Insurance (NRSP) both over 90%, it further ensures the health of rural residents. In terms of convenience services, the average number of village committee computers and village community groups in the three provinces is four and above, respectively, indicating significant improvements in government services and communication effectiveness. In logistics and trade, the average number of courier points in the three provinces is 1.2, indicating that rural residents are benefiting from the improvements brought about by the development of mobile digital technology and e-commerce, which can enhance household consumption structures and improve living standards.
Within the dimension of sanitation and environmental conditions, in terms of toilet renovation, Hubei and Shandong have renovation rates of 86% and 85%, respectively, far exceeding Jilin’s 31.5%. Moreover, the actual usage rates of renovated toilets are also much higher in Hubei and Shandong than in Jilin. In terms of waste disposal and domestic wastewater treatment facilities, Jilin’s numbers are 47.1 and 1.7 per village, respectively, both higher than those of Hubei and Shandong. This suggests considerable differences in the approaches to toilet renovation, waste disposal, and sewage treatment among the three provinces. On one hand, Jilin, located in northeastern China, has a cold climate with long winters, which imposes higher technical requirements on toilet renovation projects, particularly on water-flushing toilets. Frozen or clogged water pipes affect usage and maintenance, and therefore, anti-freeze installations are necessary, which slows down the progress of toilet renovations. On the other hand, waste disposal and domestic wastewater treatment facilities are less affected by natural environment and temperature. Additionally, Jilin’s higher agricultural scale and mechanization levels, along with agricultural workers’ greater awareness of the economic losses caused by water and soil pollution, result in stronger efforts in environmental governance and waste and wastewater treatment.

3.2. Methods

This paper uses the entropy method to assess the quality of the rural living environment in China. The entropy method is an objective weighting approach commonly used in comprehensive evaluation and decision analysis, particularly in scenarios with multiple indicators. This method applies the concept of information entropy to determine the weight of each indicator by evaluating its degree of variation. Indicators with greater variation have larger weights, while those with smaller variation have smaller weights. The entropy method can avoid the influence of human factors in subjective weighting, making it widely used in multi-indicator comprehensive evaluations across various fields. The calculation steps for the entropy method are as follows:
First, the standardization of the original data includes the following:
To eliminate the dimensional differences between various indicators, the original data need to be standardized. A common method for standardization is range normalization, and its formula is as follows:
Normalization of positive indicators:
Z i j = X i j m i n ( X i j ) max X i j m i n ( X i j )
Normalization of negative indicators:
Z i j = max X i j X i j max X i j min X i j
where Z i j is the standardized value, and X i j is the original value of the j indicator for the i village, with i = 1,2 , , n ; j = 1,2 , m .
Second, we calculate the weight of the i village under the j indicator:
P i j = Z i j i = 1 n Z i j ( i = 1,2 , , n ; j = 1,2 , m )
Third, we calculate the entropy value of the j indicator:
e j = k × i = 1 n P i j ln P i j
where k > 0 , l n denotes the natural logarithm, and e j 0 . The constant k in the above equation is related to the sample size m, and it is generally taken as k = 1 ln m , so the value of e j ranges from 0 to 1.
Fourth, we calculate the coefficient of variation for the j indicator:
The coefficient of variation reflects the degree of dispersion of each indicator. The greater the variation in the indicator value Z i j of the j indicator, the smaller the entropy value. The calculation formula is as follows:
g j = 1 e j
Fifth, we calculate the weight of the j indicator:
The weight of each indicator can be obtained by normalizing the coefficient of variation. The calculation formula is as follows:
W j = g j j = 1 m g j ,             j = 1,2 , , m
Sixth, we calculate the comprehensive score of the rural living environment quality:
S i = j = 1 m W j × Z i j ,             i = 1,2 , , n
where S i is the comprehensive score of the i village.

4. Results and Analysis

4.1. Calculation Results of Rural Living Environment Quality

This paper uses the entropy method to evaluate the quality of the living environment in 108 villages from Hubei Province, Shandong Province, and Jilin Province. The results are shown in Table 4.
This paper draws on existing research approaches and uses the entropy method to calculate the rural human settlement environment quality scores [41,42]. The evaluation criteria are as follows: based on the distribution of the full sample and using the quantile method, the rural human settlement environment quality is divided into three levels: “low”, “medium”, and “high”. A score of 0.25 or lower is considered low; a score between 0.25 and 0.5 is considered medium-low; a score between 0.5 and 0.75 is considered medium-high; and a score above 0.75 is considered high. From the perspective of the full sample, the current overall rural human settlement environment quality score in China is 0.455, which is at a medium-low level, indicating significant room for improvement in the development of rural human settlements. At the provincial level, the rural human settlement environment quality scores for Hubei, Shandong, and Jilin provinces are 0.480, 0.458, and 0.425, respectively. The score for Hubei is higher than the full sample average, Shandong’s score is consistent with the full sample, and Jilin’s score is slightly lower than the full sample score. However, the score gap between the three provinces is small. On the one hand, the country is vigorously promoting the development of ecological agriculture and green agriculture, but there is still an incremental gap in the promotion of ecological agriculture in these provinces. The energy consumption structure and agricultural development model in rural areas have not undergone significant transformation.
Furthermore, from the perspective of the four dimensions of economic development, living facilities, public services, and sanitation, the scores for economic development and public services are higher than those for living facilities and sanitation. This paper suggests that this score gap reflects issues of resource allocation and policy priorities in the development process of rural areas. Rural economic development and public services are often the areas where the country and regions focus their limited resources. Economic development directly impacts income levels and can bring significant economic benefits in the short term. It is also considered the core driving force for the overall development of rural areas. Additionally, public services such as education and healthcare are seen as key to improving social equity and narrowing the urban–rural gap. Therefore, in terms of policy resource allocation and funding investment, economic development and public services are often prioritized. As a result, this score gap is a result of the decision-making differences in long-term economic development and policy guidance priorities.
From a more detailed perspective within the specific dimensions, categories such as waste treatment and sewage treatment, which were implemented later and have higher construction costs, have lower values in both the dimension scores and the total score. This also indirectly supports the above viewpoint. From the evaluation above, it can be concluded that the current rural living environment quality in China exhibits the following characteristics: First, the overall rural living environment quality score is at a medium-low level, indicating significant room for improvement. Under the dual economic structure of urban and rural areas in China, rural development has always lagged behind urban areas. Although the country has increased policy support and financial investment in rural areas, this catch-up effect still faces a time lag. Second, there is an imbalance in the development levels across dimensions. Economic development and public services, such as education and healthcare, are the main supports for the current rural living environment quality dimensions, as these projects can significantly improve local economic levels and enhance the quality of the labor force and health levels in a short period. On the other hand, although projects focusing on living facilities and sanitation can significantly improve the quality of life in rural areas in the long term, they require continuous investment and maintenance, and the degree of policy support may vary.
From the perspective of household head characteristics, male heads and those with higher risk preferences significantly exacerbate household consumption inequality, while being married and having higher education levels can significantly alleviate this inequality. Males tend to show a preference for high-return, high-risk goods or services in consumption decisions, especially in non-essential consumption areas such as high-end electronics, luxury goods, or high-risk investments. This preference can marginalize the basic consumption needs of lower-income members in households with unequal resource distribution, further intensifying consumption inequality within the family. Being married is usually associated with closer economic ties and consumption consensus among family members, with the household head more likely to consider the overall needs of the family in consumption decisions, leading to a more balanced resource allocation. Household heads with higher education levels generally possess stronger resource integration and information-gathering abilities and are more focused on balanced and long-term consumption decisions.

4.2. Factors Influencing the Quality of Rural Living Environment

4.2.1. Variable Selection

As indicated by the previous analysis, the current rural living environment quality is at a medium-low level and is one of the weak links in rural revitalization. This section of the paper analyzes the factors influencing the quality of the rural living environment to explore the mechanisms that promote environmental improvement, providing a reference for policy implementation. Based on existing research, many scholars have pointed out that village economic conditions, population mobility, public safety, and price levels are key factors influencing rural living environment quality. For example, Yang and Wang [43] noted that rural economic growth, labor mobility, and investment in infrastructure are crucial for improving the quality of rural living environments. Peng and Zhang’s study found that public safety management and factors such as population density in rural areas have a significant impact on the management capacity and governance effectiveness of the environment [44]. This study aims to explore the main factors affecting rural living environment quality and ultimately selects four aspects with seven variables: village economic characteristics, village population characteristics, village public safety management characteristics, and price characteristics. The specific variables selected and identified are as follows:
Among these, the village economy is the core of rural resources and development capacity. In this paper, per capita net income is chosen as an indicator to measure the economic characteristics of the village. The impact of village population on the rural living environment governance is mainly reflected in the labor structure, population density, and population mobility. The governance of rural clans and the “big family” gentry is also an important component of rural social governance. This paper selects the permanent population of the village and the proportion of the largest surname in the village to measure the village’s population characteristics. Village public safety management is the foundation of rural social stability and environmental protection. Good security management can effectively protect environmental governance facilities from damage. This paper selects two indicators—whether fires have occurred and whether property theft has occurred—to measure the village’s public safety management characteristics. Village price characteristics refer to the price level of goods in the village and surrounding areas, including prices of daily necessities, energy prices, and infrastructure construction costs. These price characteristics indirectly affect the cost of rural living environment governance and the lifestyle of rural residents. This paper selects two indicators—whether the prices of agricultural materials have risen significantly and whether the prices of grain and oil have risen significantly—to measure the village’s price characteristics.

4.2.2. Estimation Results

Table 5 reports the baseline regression results for the factors influencing rural living environment quality.
In column (1), the estimated coefficient of per capita net income is 0.0002, significantly positive, indicating that an increase in rural residents’ income level will improve the quality of the rural living environment. An increase in income means that rural residents are more likely to invest in their living environment, for example, through supporting public sector projects related to waste treatment, sewage treatment, and toilet renovations, thereby improving their living standards. On the other hand, the estimated coefficient of the village’s permanent population is 0.0028, significantly positive, which confirms that labor return and the improvement of the existing population and labor force in villages are important components of enhancing the quality of the rural living environment. The estimated coefficient for whether a fire has occurred is −2.9738, significantly positive. The occurrence of fires and sharp increases in agricultural material prices may exacerbate the economic burden on rural areas, damage infrastructure, and reduce residents’ quality of life, thereby negatively impacting the quality of rural human settlements.
In column (2), the estimated coefficient of per capita net income is significantly positive, and the estimated coefficient of the proportion of the largest surname in the village is also significantly positive. The paper suggests that the proportion of the largest surname reflects the rural social demographic structure, community cohesion, and resource-sharing degree. A large proportion of a single surname means that the social structure of the village is relatively homogeneous, with closer kinship among villagers. This kinship helps enhance social cohesion and trust within the village, encouraging collective efforts to maintain the village environment and facilities, thus promoting the village’s economic development.
In column (3), only the estimated coefficients for per capita net income and the permanent population of the village are significantly positive. The paper argues that, on the one hand, the limited sample size may hinder the potential impact of other factors from being fully reflected. On the other hand, the main drivers of the implementation of the living facilities dimension are the government and third-party resources. The construction and maintenance of infrastructure require some degree of self-sufficiency based on the village’s own economic development, and the size of the permanent population determines the scale of infrastructure benefits, thus demonstrating a ripple effect.
In column (4), the permanent population of the village is significantly positive, consistent with the scale effects of educational and healthcare resource investments. The larger the permanent population, the lower the marginal cost of investing in education and healthcare resources. Additionally, the development of logistics and commerce also requires a certain number of rural consumers to support it.
In column (5), none of the factors show significant coefficients, indicating that the projects related to sanitation are relatively recent. The policy effects of toilet renovations, waste treatment, sewage treatment, and environmental governance have not yet fully materialized. It could also be due to the limited sample size available for this paper, where small sample sizes tend to result in weaker statistical significance.

4.2.3. Robustness Test

Considering the heterogeneity of rural living environment quality scores, this paper employs quantile regression to explore heterogeneity across different score levels [45]. Five classic quantiles—10%, 25%, 50%, 75%, and 90%—are selected for analysis, and the estimation results are presented in Table 6.
From the quantile regression results, the following conclusions can be drawn: First, the estimated coefficient of per capita net income is significantly positive across all quantiles except for the 90th percentile. This suggests that in villages with higher rural living environment scores, the benefits gained through per capita net income, which reflects the consumption potential of rural residents, are not as evident due to the “barrel effect”. Meanwhile, the estimated coefficients for the village’s permanent population and whether agricultural material prices have significantly increased are significantly positive across all quantiles, consistent with the baseline regression results. The coefficient for fire occurrence is not significant at the 10%, 75%, and 90% quantiles, indicating a polarization effect in resource allocation following fire incidents in villages with either very low or very high rural living environment scores.

5. Discussion

5.1. Research Contributions

This study focuses on the assessment of rural living environment quality, utilizing survey data from 108 villages across Hubei, Shandong, and Jilin provinces. By adopting a micro-level perspective, it explores regional differences in rural living environment quality and their influencing factors. Compared to existing studies, the marginal contributions of this research are reflected in the following aspects.
First, in terms of research content, previous studies on rural living environment quality have primarily focused on single regions and relied mainly on macro-level statistical data, often neglecting the autonomy of rural governance entities and the unique characteristics of individual villages. In constructing evaluation indicators, this study draws on national policy documents and rural revitalization practices, incorporating key dimensions such as rural education, healthcare, sanitation facility renovation, and drinking water improvement. Additionally, it emphasizes the autonomy of villages in improving their living environment, establishing a more targeted micro-level evaluation system.
Second, in terms of research perspective, prior studies have rarely considered the alignment between governance autonomy and the socio-economic environment in rural areas. This study conducts an inter-provincial comparison to examine the disparities in rural living environments under different socio-economic backgrounds and natural geographical conditions. It further analyzes the varying levels of development in essential infrastructure such as drinking water safety, healthcare facilities, and educational accessibility, as well as their underlying causes. This perspective not only helps reveal the structural differences in rural living environment quality across provinces but also provides empirical support for region-specific rural governance optimization.
Finally, in terms of research methodology and depth, existing studies are constrained by macro-level data, making it difficult to capture how village-level characteristics affect rural living environment quality. This study employs micro-level survey data and incorporates factors such as the economic environment, demographic structure, social governance stability, and price levels to investigate their impact on improving rural living environment quality. This micro-level analysis not only addresses the data limitations of previous research but also provides empirical evidence for formulating targeted policies to enhance rural living environments.

5.2. Research Limitations and Outlook

Despite its contributions, this study has certain limitations that should be acknowledged.
First, the sample size of this study is relatively small. It only involves data from 108 villages across three provinces: Hubei, Shandong, and Jilin. This limitation may affect the generalizability and representativeness of the findings. Future research will consider multi-dimensional sample selection to ensure that the sample covers different types of rural areas, including economically developed and underdeveloped regions, areas with different geographical conditions, as well as villages with varying cultural backgrounds and social structures. This approach will help enhance the generalizability of the research conclusions.
Second, the implementation of environmental improvement policies is often a long-term process, and the effects of different policies may vary significantly between the short term and the long term. If the temporal differences before and after policy implementation are not considered, the study may underestimate the long-term impact of policies on the improvement of environmental quality. In future research, a longitudinal design will be adopted to track the changes in rural environmental quality before and after policy implementation at different periods. This will help capture both the short-term and long-term effects of policies on rural environments, particularly the comparison of effects during the early and mature stages of policy implementation.

6. Research Conclusions and Policy Implications

This paper, based on a micro perspective, constructs an assessment system for the quality of rural human settlements in China across four dimensions: economic development, living facilities, public services, and sanitary environment. The system covers various rural revitalization practices in China, including rural education, healthcare, sanitary toilet renovation, and drinking water improvement. Using micro survey data from 108 villages in Hubei, Shandong, and Jilin provinces, the entropy method is employed to scientifically assess the quality level of rural human settlements. The paper further explores the differential impact of village-specific characteristics on rural human settlement quality. The findings are as follows: First, the overall quality of rural human settlements in Hubei, Shandong, and Jilin is at a moderate-to-low level, with minimal differences between the provinces, indicating significant room for improvement and highlighting a major shortcoming in the current rural revitalization process. Second, among the various dimensions, economic development and public services score relatively high, while living facilities and sanitary environment score lower, reflecting the persistent imbalance in long-term resource allocation that prioritizes economic growth, with delayed development of living and sanitation infrastructure. Third, an increase in per capita net income and the resident population in villages significantly improves the quality of rural human settlements, while incidents such as village fires and sharp increases in agricultural input prices notably degrade the quality of rural human settlements.
Based on the above conclusions, to improve the quality of rural living environments and achieve the goal of ecological livability, the policy recommendations proposed in this study are as follows: First, optimize resource allocation and balance economic development with infrastructure construction. Currently, resource allocation has long been biased toward economic growth, resulting in delayed development of living and sanitation facilities. A more balanced resource allocation policy should be formulated, particularly in the rural revitalization strategy. The government should simultaneously promote economic development and infrastructure construction, avoiding an excessive focus on economic growth at the expense of improving rural human settlement quality. Investments should be made, especially in areas such as sanitary toilet renovation, drinking water safety, and waste management, to ensure the improvement of basic living conditions for rural residents.
Second, the level of public services and encourage the diversification of village economies. Although public services score relatively high, there is still a need to strengthen the coverage and quality of services such as education and healthcare, especially in remote and impoverished areas. Efforts should be made to bring educational and medical resources to rural areas and reduce the urban–rural public service gap. In addition, the study found that the economic characteristics of villages significantly impact human settlement quality. The government should promote the diversification of village economies through policy guidance and financial support, encourage farmers to start businesses, and support the development of emerging industries such as rural tourism, which can drive rural economic development and subsequently improve the quality of rural human settlements.
Third, strengthen rural fire safety management and disaster response capabilities, stabilize agricultural material prices, and improve farmers’ income levels. Fires and natural disasters negatively impact the quality of rural human settlements, so it is important to enhance fire safety management in rural areas, raise villagers’ fire prevention awareness, and improve disaster emergency response mechanisms. The government can build more fire safety facilities and train local residents to improve disaster response capabilities. Furthermore, fluctuations in agricultural material prices significantly affect the quality of rural human settlements. Therefore, the government should take measures to stabilize agricultural material prices and reduce the impact of price volatility on farmers’ production and daily life. At the same time, efforts should be made to promote the continuous growth of farmers’ incomes, especially through rural labor force transfer and industrial poverty alleviation, improving farmers’ economic conditions and further enhancing the quality of rural human settlements.

Author Contributions

Conceptualization, S.X. and Y.X.; methodology, S.X.; software, S.X.; validation, S.X., L.Z. and X.L.; formal analysis, Y.X.; investigation, S.X.; resources, S.X.; data curation, S.X.; writing—original draft preparation, S.X.; writing—review and editing, S.X.; visualization, X.L.; supervision, L.Z.; project administration, X.L.; funding acquisition, X.L. All authors have read and agreed to the published version of the manuscript.

Funding

This research was funded by The National Social Science Fund Project “Research on the Multidimensional Linkage and Collaborative Innovation of Financial Service Models for Rural Revitalization in Poverty Alleviation Areas”, grant number “22BGL066” and the APC was funded by The High-Level Talent Start-Up Fund Project “Research on Accelerating the Construction of a Chinese-Characteristic Agricultural Financial Market System” (108/11042010017).

Institutional Review Board Statement

The data obtained in this study is micro-level survey data. During the survey, participants were informed in advance about the detailed content of the investigation and provided with informed consent. This research does not require ethical approval. The reason is that, according to Article 32 of the "Ethical Review Measures for Life Sciences and Medical Research Involving Humans," jointly issued by the National Health Commission, the Ministry of Education, the Ministry of Science and Technology, and the National Administration of Traditional Chinese Medicine, life science and medical research involving human beings that uses human information data or biological samples in the following situations—without causing harm to the human body, and without involving sensitive personal information or commercial interests—can be exempt from ethical review. This is to reduce unnecessary burdens on researchers and promote the development of life sciences and medical research involving humans. Research using publicly available data legally obtained or data generated through observation without interfering with public behavior. National Legislation Information Source: https://www.gov.cn/zhengce/zhengceku/2023-02/28/content_5743658.htm, accessed on 12 March 2024.

Informed Consent Statement

Informed consent was obtained from all subjects involved in the study.

Data Availability Statement

The data used in this study were obtained from a micro-level survey conducted by the research team in Hubei, Shandong, and Jilin provinces of China. The data are authentic and reliable. However, due to privacy concerns and the need for ongoing research, the raw data cannot be provided.

Acknowledgments

We appreciate the support and understanding of the respondents during the micro-level survey. We also extend our gratitude to the staff involved in data collection and initial processing.

Conflicts of Interest

The authors declare no conflicts of interest.

References

  1. Dahms, F. Settlement evolution in the arena society in the urban field. J. Rural Stud. 1998, 14, 299–320. [Google Scholar] [CrossRef]
  2. Schnaiberg, J.; Riera, J.; Turner, M.G.; Voss, P.R. Explaining human settlement patterns in a recreational lake district: Vilas County, Wisconsin, USA. Environ. Manag. 2002, 30, 24–34. [Google Scholar] [CrossRef] [PubMed]
  3. Gude, P.; Hansen, A.; Rasker, R.; Maxwell, B. Rates and drivers of rural residential development in the Greater Yellowstone. Landsc. Urban Plan. 2006, 77, 131–151. [Google Scholar] [CrossRef]
  4. Amit, K. Study of Rural Settlements in Western Himalayas with the Help of GIS; LAP Lambert Academic Publishing: Saarbrücken, Germany, 2012; pp. 123–129. [Google Scholar]
  5. Mani, M.; Ganesh, L.; Koshy, V. Sustainability and Human Settlements: Fundamental Issues. In Modeling and Simulations; SAGE Publications: Washington, DC, USA, 2005. [Google Scholar]
  6. NUHT. Cities-engines of rural development. Habitat Dehate 2004, 10, 11–24. [Google Scholar]
  7. Aguilar, A.G. Peri-urbanization, illegal settlements and environmental impact in Mexico City. Cities 2008, 25, 133–145. [Google Scholar] [CrossRef]
  8. Thorn, J.; Thornton, T.F.; Helfgott, A. Autonomous adaptation to global environmental change in peri-urban settlements: Evidence if a growing culture if innovation and revitalization in Mathare Valley Slums, Nairobi. Glob. Environ. Change 2015, 31, 121–131. [Google Scholar] [CrossRef]
  9. Singh, R.L. Readings in Rural Settlement Geography; National Geographical Society of India: Varanasi, India, 1975. [Google Scholar]
  10. Bunce, M. Rural Settlement in an Urban World; Martins Press: New York, NY, USA, 1982. [Google Scholar]
  11. Mandal, R.B. Introduction to Rural Settlements; Non Basic Stock Line: Munger, India, 2002. [Google Scholar]
  12. Dahms, F.; McComb, J. Counter urbanization, interaction and functional change in a rural amenity area: A Canadian example. J. Rural Stud. 1999, 15, 129–146. [Google Scholar] [CrossRef]
  13. Shumway, J.; Otterstro, S. Spatial patterns of migration and income change in the Mountain West: The dominance of service-based, amenity rich counties. Prof. Geogr. 2001, 53, 492–502. [Google Scholar] [CrossRef]
  14. Kuentzel, W.; Ramaswamy, V. Tourism and amenity migration: A longitudinal analysis. Ann. Tour. Res. 2005, 32, 419–438. [Google Scholar] [CrossRef]
  15. Daniel, T.; Kenneth, M. Emerging rural settlement patterns and the geographic redistribution of America’s new immigrants. Rural Sociol. 2006, 71, 109–131. [Google Scholar]
  16. Wang, J.X.; Li, Y.M.; Huang, K.X. The current situation and influencing factors of rural household solid waste management. China Popul. Resour. Environ. 2011, 21, 74–78. [Google Scholar]
  17. Li, D.Q.; Hou, L.L.; Min, S.; Huang, J. Evaluation of the effectiveness of rural living environment improvement—An empirical study based on panel data of farmers in seven provinces nationwide. Manag. World 2021, 37, 182–194. [Google Scholar]
  18. Tang, H.S. Research on residents’ waste classification behavior in rural living environment improvement—Based on survey data from Sichuan Province. J. Southwest Univ. (Nat. Sci. Ed.) 2020, 42, 1–8. [Google Scholar]
  19. He, K.; Zhang, J.B.; Zhang, L.; Wu, X. Interpersonal trust, institutional trust, and farmers’ willingness to participate in environmental governance—A case study of agricultural waste recycling. Manag. World 2015, 5, 75–88. [Google Scholar]
  20. Tang, L.; Luo, X.F.; Huang, Y.Z.; Yu, W. Does labor mobility suppress farmers’ participation in village environmental governance?—Based on survey data from Hubei Province. China Rural Econ. 2019, 9, 88–103. [Google Scholar]
  21. Miao, Y.Q.; Yang, Z.B.; Zhou, H.Y. Study on rural residents’ willingness to pay for environmental sanitation improvement and its influencing factors—A case study of toilet renovation. Manag. World 2012, 9, 89–99. [Google Scholar]
  22. Liu, Y.; Huang, J.K. An empirical analysis of rural environmental sustainability: A case study of farmers’ organic waste returning to fields. J. Agrotech. Econ. 2013, 7, 4–10. [Google Scholar]
  23. Wang, X.Y. Rebuilding rural life to achieve rural revitalization. J. Cent. China Norm. Univ. (Humanit. Soc. Sci. Ed.) 2019, 58, 1–4. [Google Scholar]
  24. Xu, S.T.; Chen, M.L.; Yuan, B.F.; Gu, D. Farmers’ willingness to participate in rural living environment improvement based on the SOR model. China Agric. Resour. Reg. Plan. 2024, 45, 212–222. [Google Scholar]
  25. Wang, J.R.; Gao, W.Y.; Wei, X.C.; Liu, F.; Li, H.; Zhang, C.; Wang, Q.; Gao, Y.; Zheng, X. Research on improving rural living environments abroad and its experience for China. China Agric. Resour. Reg. Plan. 2023, 44, 89–98. [Google Scholar]
  26. Jiang, Q.F.; Guo, S.H. The impact of social capital on villagers’ participation behavior in environmental governance. China Agric. Resour. Reg. Plan. 2024, 45, 177–189. [Google Scholar]
  27. Zhu, B.; Zhang, X.L.; Yin, X. Evaluation of rural living environment quality and spatial pattern analysis in Jiangsu Province. Econ. Geogr. 2015, 35, 138–144. [Google Scholar]
  28. Wang, X.Y. Reconstructing living space: Rural revitalization and environmental governance. J. Beijing Norm. Univ. (Soc. Sci. Ed.) 2018, 6, 124–130. [Google Scholar]
  29. Li, B.H.; Zeng, J.X. Study on rural living environment based on changes in farmers’ spatial behavior. Geogr. Geogr. Inf. Sci. 2009, 25, 84–88. [Google Scholar]
  30. Zhu, G.L.; Yu, D. Building a service-oriented government: A new stage in the transformation of government functions—A review and outlook on the transformation process of China’s government functions. Political Sci. Res. 2008, 6, 67–72. [Google Scholar]
  31. Liu, P.; Cui, C.X. Legal protection of rural living environment governance in the new era. J. Northwest AF Univ. (Soc. Sci. Ed.) 2020, 20, 102–109. [Google Scholar]
  32. Min, S.; Wang, X.B.; Hou, L.L.; Wang, J. Factors influencing farmers’ participation in rural living environment improvement—Based on survey data from the southwestern mountainous areas. China Rural Surv. 2019, 4, 94–110. [Google Scholar]
  33. Dong, S.C.; Zhang, P.P.; Li, F.; Li, F.J.; Cheng, C.; Ma, B. Comprehensive evaluation of the quality of the living environment in the Shandong Peninsula urban agglomeration. China Popul. Resour. Environ. 2017, 27, 155–162. [Google Scholar]
  34. Zhou, K.; Lin, X.Q. Characteristics and influencing factors of rural living environment in Beijing suburbs since the construction of new rural areas. Hum. Geogr. 2011, 26, 76–82. [Google Scholar]
  35. Gao, H.; Jin, J.S.; Li, F.; Zhou, C. Evaluation and development strategies for rural living environment construction at the provincial level in China. J. Ecol. Rural Environ. 2015, 31, 835–843. [Google Scholar]
  36. D’Agostini, L.R.; Fantini, A.C. Quality of life and quality of living conditions in rural areas: Distinctively perceived and quantitatively distinguished. Soc. Indic. Res. 2008, 89, 487–499. [Google Scholar] [CrossRef]
  37. Li, Y.-R.; Cao, L.-Z.; Wang, P.-Y.; Chang, G.-J. Rural living environment improvement and rural revitalization. J. Nat. Resour. 2022, 37, 96–109. [Google Scholar] [CrossRef]
  38. Ma, L.; Liu, S.; Fang, F.; Che, X.; Chen, M. Evaluation of urban-rural difference and integration based on quality of life. Sustain. Cities Soc. 2020, 54, 101877. [Google Scholar] [CrossRef]
  39. Zhang, J.; Huang, B.; Chen, X.; Zhu, C.; Gan, M. Multidimensional evaluation of the quality of rural life using big data from the perspective of common prosperity. Int. J. Environ. Res. Public Health 2022, 19, 14166. [Google Scholar] [CrossRef]
  40. Tang, C.; He, Y.; Zhou, G.; Zeng, S.; Xiao, L. Optimizing the spatial organization of rural settlements based on life quality. J. Geogr. Sci. 2018, 28, 685–704. [Google Scholar] [CrossRef]
  41. Xu, J.H. Construction and empirical study of an evaluation index system for rural living environment. Stat. Decis. 2023, 39, 97–101. [Google Scholar] [CrossRef]
  42. Lu, Q. Comprehensive evaluation index system for rural living environment: Construction and empirical study—A case study of Hubei Province. Stat. Decis. 2022, 38, 71–75. [Google Scholar] [CrossRef]
  43. Yang, X.Z.; Wang, Q. Evaluation and analysis of factors influencing the quality of rural living environment in the southern Anhui tourism area. Acta Geogr. Sin. 2013, 68, 851–867. [Google Scholar]
  44. Peng, C.; Zhang, C. Study on the quality of rural living environment and its influencing factors. Macroecon. Qual. Res. 2019, 7, 66–78. [Google Scholar]
  45. Koenker, R.; Bassett, G., Jr. Regression Quantiles. Econometrica 1978, 46, 33–50. [Google Scholar] [CrossRef]
Figure 1. Framework of China’s rural human settlement quality evaluation system.
Land 14 00780 g001
Figure 2. Study area.
Land 14 00780 g002
Table 1. Relevant documents on rural human settlement quality standards and systems in China.
Standard Document/ReportIssuing DepartmentKey Content
Urban Human Settlement Evaluation Indicator System in ChinaMinistry of Housing and Urban–Rural DevelopmentAir quality, water quality, greenery coverage rate, public services, social security, etc.
Three-Year Action Plan for Rural Human Settlement Improvement (2018–2020)General Office of the State CouncilHousehold waste management, sewage treatment, toilet renovation, village appearance improvement, etc.
Annual Evaluation Report on Ecological Civilization Construction in ChinaNational Bureau of Statistics, Ministry of Ecology and Environment, National Development and Reform CommissionAir quality, water resource quality, land use, ecological protection, etc.
Standards for Beautiful Countryside ConstructionMinistry of Housing and Urban–Rural DevelopmentEnvironmental sanitation improvement, sewage and waste treatment, infrastructure construction, etc.
Green Building Evaluation Standard (GB/T 50378-2019)Ministry of Housing and Urban-Rural DevelopmentIndoor air quality, energy saving and emission reduction, resource conservation, health and comfort, etc.
National New Urbanization Plan (2014–2020)National Development and Reform Commission, Ministry of Housing and Urban–Rural DevelopmentGreen infrastructure, sustainable development, ecological environmental protection, etc.
Evaluation and Assessment Method for Ecological Civilization Construction GoalsMinistry of Ecology and EnvironmentAir quality, water quality, sustainable resource use, residents’ quality of life, etc.
Table 2. Evaluation indicators for rural human settlement quality in China.
Evaluation IndicatorsVariable CodeValue Direction
Rural Human Settlement Quality SystemEconomic DevelopmentAgricultural EconomyLand Transfer RateX1+
Number of Village EnterprisesX2+
Number of Specialized Crop FarmersX3+
Number of Specialized Livestock FarmersX4+
Rate of Agricultural Socialized Service ProvisionX5+
Ratio of Irrigable Dry FarmlandX6+
Labor MigrationRatio of Outbound Labor ForceX7
Ratio of Returning Labor ForceX8+
Ratio of Local to County-Level Urban Labor IncomeX9+
Ratio of Local to Provincial Capital Urban Labor IncomeX10+
Ratio of Non-Agricultural EmploymentX11+
Living StandardsEngel Coefficient of Village ResidentsX12
Living FacilitiesInfrastructureHardening Rate of Main Village RoadsX13+
Number of Signal TowersX14+
Information TechnologyDesktop Computer Usage RateX15+
Smartphone Usage RateX16+
Broadband Connection RateX17+
Energy SupplyProportion of Online Utility Bill PaymentsX18+
Natural Gas Connection RateX19+
Public ServicesEducational ServicesPublic Transportation Coverage RateX20+
Number of Annual Education Training Participants in VillagesX21+
Medical SecurityNumber of Standardized Village ClinicsX22+
Number of Village DoctorsX23+
Participation Rate in the New Rural Cooperative Medical Scheme X24+
Participation Rate in the New Rural Social Pension SchemeX25+
Convenience ServicesDistance to Township Shopping StreetX26
Distance to Township Government OfficeX27
Number of Office Computers in the Village CommitteeX28+
Number of Village Social GroupsX29+
Logistics and CommerceNumber of Express Delivery PointsX30+
Number of Village Supermarkets and Small ShopsX31+
Number of Village RestaurantsX32+
Sanitation EnvironmentToilet RenovationToilet Renovation RateX33+
Actual Usage Rate of Renovated ToiletsX34+
Number of Public Toilets in VillagesX35+
Waste ManagementNumber of Harmless Waste Treatment FacilitiesX36+
Sewage TreatmentNumber of Domestic Sewage Purification FacilitiesX37+
Environmental GovernanceNumber of Annual Environmental CleanupsX38+
Natural Disaster Incidence RateX39
Table 3. Descriptive statistical analysis.
Evaluation IndicatorsFull SampleHubeiShandongJilin
Economic DevelopmentAgricultural EconomyLand Transfer Rate (%)35.035.937.531.5
Number of Village Enterprises (units)0.4260.4440.2500.583
Number of Specialized Crop Farmers (units)56.4821.08347.139101.222
Number of Specialized Livestock Farmers (units)11.8707.00019.7788.833
Rate of Agricultural Socialized Service Provision (%)37.333.669.09.1
Ratio of Irrigable Dry Farmland (%)83.993.875.382.6
Labor MigrationRatio of Outbound Labor Force (%)89.188.688.890.0
Ratio of Returning Labor Force (%)71.770.468.076.8
Ratio of Local to County-Level Urban Labor Income (%)89.188.688.890.0
Ratio of Local to Provincial Capital Urban Labor Income (%)71.770.468.076.8
Ratio of Non-Agricultural Employment (%)60.566.962.452.2
Living StandardsEngel Coefficient of Village Residents (%)27.728.434.620.1
Living FacilitiesInfrastructureHardening Rate of Main Village Roads (%)98.898.798.998.8
Number of Signal Towers (units)1.5092.0281.0281.472
Information TechnologyDesktop Computer Usage Rate (%)35.031.730.642.8
Smartphone Usage Rate (%)83.081.979.787.2
Broadband Connection Rate (%)53.834.364.062.9
Energy SupplyProportion of Online Utility Bill Payments (%)95.299.594.591.7
Natural Gas Connection Rate (%)20.114.839.106.5
Public ServicesEducational ServicesPublic Transportation Coverage Rate (%)55.466.341.858.2
Number of Annual Education Training Participants in Villages (persons)84.34096.52845.639110.861
Medical SecurityNumber of Standardized Village Clinics (units)1.0001.1940.7501.056
Number of Village Doctors (units)1.6201.8061.4171.639
Participation Rate in the New Rural Cooperative Medical Scheme (%) 97.799.395.998.0
Participation Rate in the New Rural Social Pension Scheme (%)92.892.395.290.9
Convenience ServicesDistance to Township Shopping Street (km)5.4526.8253.8585.673
Distance to Township Government Office (km)5.5777.2113.8925.628
Number of Office Computers in the Village Committee (units)4.2595.1113.2224.444
Number of Village Social Groups (units)4.6205.1673.6675.028
Logistics and CommerceNumber of Express Delivery Points (units)1.2221.3891.3060.972
Number of Village Supermarkets and Small Shops (units)3.4352.2784.3613.667
Number of Village Restaurants (units)1.4811.1671.8891.389
Sanitation EnvironmentToilet RenovationToilet Renovation Rate (%)67.586.085.031.5
Actual Usage Rate of Renovated Toilets (%)69.286.096.725.0
Number of Public Toilets in Villages (units)1.6202.6111.3060.944
Waste ManagementNumber of Harmless Waste Treatment Facilities (units)21.39010.5006.55647.111
Sewage TreatmentNumber of Domestic Sewage Purification Facilities (units)1.3981.4171.0831.694
Environmental GovernanceNumber of Annual Environmental Cleanups (units)2.2202.8861.0832.690
Natural Disaster Incidence Rate (%)19.120.414.222.8
obs108363636
Note: Obtained through calculations and compilation by the author.
Table 4. Rural living environment quality score.
Total ScoreFull SampleHubeiShandongJilin
0.4550.4800.4580.425
Economic Development0.1310.1310.1380.125
Agricultural Economy0.0510.0540.0580.042
Labor Migration0.0640.0610.0650.067
Living Standards0.0160.0150.0150.017
Living Facilities0.0960.0850.1110.090
Infrastructure0.0300.0280.0330.031
Information Technology0.0360.0300.0450.034
Energy Supply 0.0290.0270.0340.025
Public Services0.1500.1720.1230.155
Educational Services0.0210.0260.0140.022
Medical Security0.0580.0680.0440.057
Convenience Services0.0530.0600.0450.054
Logistics and Commerce0.0200.0170.0200.022
Sanitation Environment0.0770.0930.0850.055
Toilet Renovation0.0400.0510.0460.022
Waste Management0.0040.0050.0040.004
Sewage Treatment0.0090.0090.0140.004
Environmental Governance0.0240.0270.0210.025
Table 5. Baseline regression results of factors influencing rural living environment quality.
Variables(1)(2)(3)(4)(5)
OverallEconomic DevelopLiving FacilitiesPublic ServicesSanitation Environ
Per Capita Income0.0002 ***0.0001 *0.0001 ***0.00010.0000
(0.0001)(0.0000)(0.0000)(0.0000)(0.0000)
Population0.0028 ***0.00030.0006 *0.0019 ***−0.0001
(0.0008)(0.0004)(0.0003)(0.0005)(0.0003)
Largest Surname_P0.63821.8397 *−0.2162−0.6260−0.3593
(1.9486)(1.0446)(0.7526)(1.1551)(0.7552)
Fire Occurrence−2.9738 **−1.4963 *0.28860.71230.4766
(1.4878)(0.7976)(0.5747)(0.8820)(0.5766)
Property Theft0.66830.3528−0.02450.3633−0.0234
(1.5138)(0.8115)(0.5847)(0.8973)(0.5866)
Agricultural Material Price Increase−2.9865 ***0.21160.1272−2.4387 ***0.2089
(1.0609)(0.5687)(0.4098)(0.6289)(0.4111)
Grain and Oil Price Increase0.2648−1.3473 **−0.1313−1.00610.0550
(1.0648)(0.5708)(0.4113)(0.6312)(0.4126)
Constant38.0232 ***9.5609 ***6.0362 ***13.2037 ***9.2225 ***
(2.1021)(1.1269)(0.8119)(1.2461)(0.8146)
Provincial Dummy VariableYESYESYESYESYES
Observations108108108108108
R-squared0.42480.24080.41300.50190.5161
Note: ***, **, and * represent significance levels of 1%, 5%, and 10%, respectively.
Table 6. Quantile regression results.
Variables(1)(2)(3)(4)(5)
Quantile 10%Quantile 25%Quantile 50%Quantile 75%Quantile 90%
Per Capita Income0.0003 **0.0003 ***0.0003 ***0.0002 **0.0002
(0.0001)(0.0001)(0.0001)(0.0001)(0.0001)
Population0.0038 ***0.0028 ***0.0023 **0.0025 ***0.0039 ***
(0.0014)(0.0009)(0.0011)(0.0009)(0.0013)
Largest Surname_P−1.6528−0.51882.38872.84204.4480
(3.4603)(2.3534)(2.6545)(2.1550)(3.2213)
Fire Occurrence4.2175−4.5032 **−4.4330 **1.8863−0.0482
(2.6420)(1.7969)(2.0268)(1.6454)(2.4596)
Property Theft0.76930.65731.28191.0628−0.1270
(2.6881)(1.8283)(2.0622)(1.6741)(2.5025)
Agricultural Material Price Increase−3.4397 *−3.1430 **−3.1434 **−4.0634 ***−4.2359 **
(1.8839)(1.2813)(1.4452)(1.1733)(1.7538)
Grain and Oil Price Increase1.70800.7054−0.5786−0.0124−0.3732
(1.8908)(1.2860)(1.4505)(1.1776)(1.7602)
Provincial Dummy VariableYESYESYESYESYES
Observations31.6968 ***34.0603 ***36.5003 ***40.4025 ***40.9568 ***
(3.7328)(2.5388)(2.8636)(2.3248)(3.4750)
Observations108108108108108
Note: ***, **, and * represent significance levels of 1%, 5%, and 10%, respectively.
Disclaimer/Publisher’s Note: The statements, opinions and data contained in all publications are solely those of the individual author(s) and contributor(s) and not of MDPI and/or the editor(s). MDPI and/or the editor(s) disclaim responsibility for any injury to people or property resulting from any ideas, methods, instructions or products referred to in the content.

