
Exploring the Rural Landscape of the Marches of the Welsh Borders in Roman Times Through Intervisibility Analysis

Abstract
1. Introduction
2. Methodology
2.1. The Concept of the Endogenous Visibility Network Model (EVNM)
2.2. Visibility Analysis
2.3. Generating the Endogenous Visibility Network Model (EVNM)
2.4. Area Under Study
2.5. Database
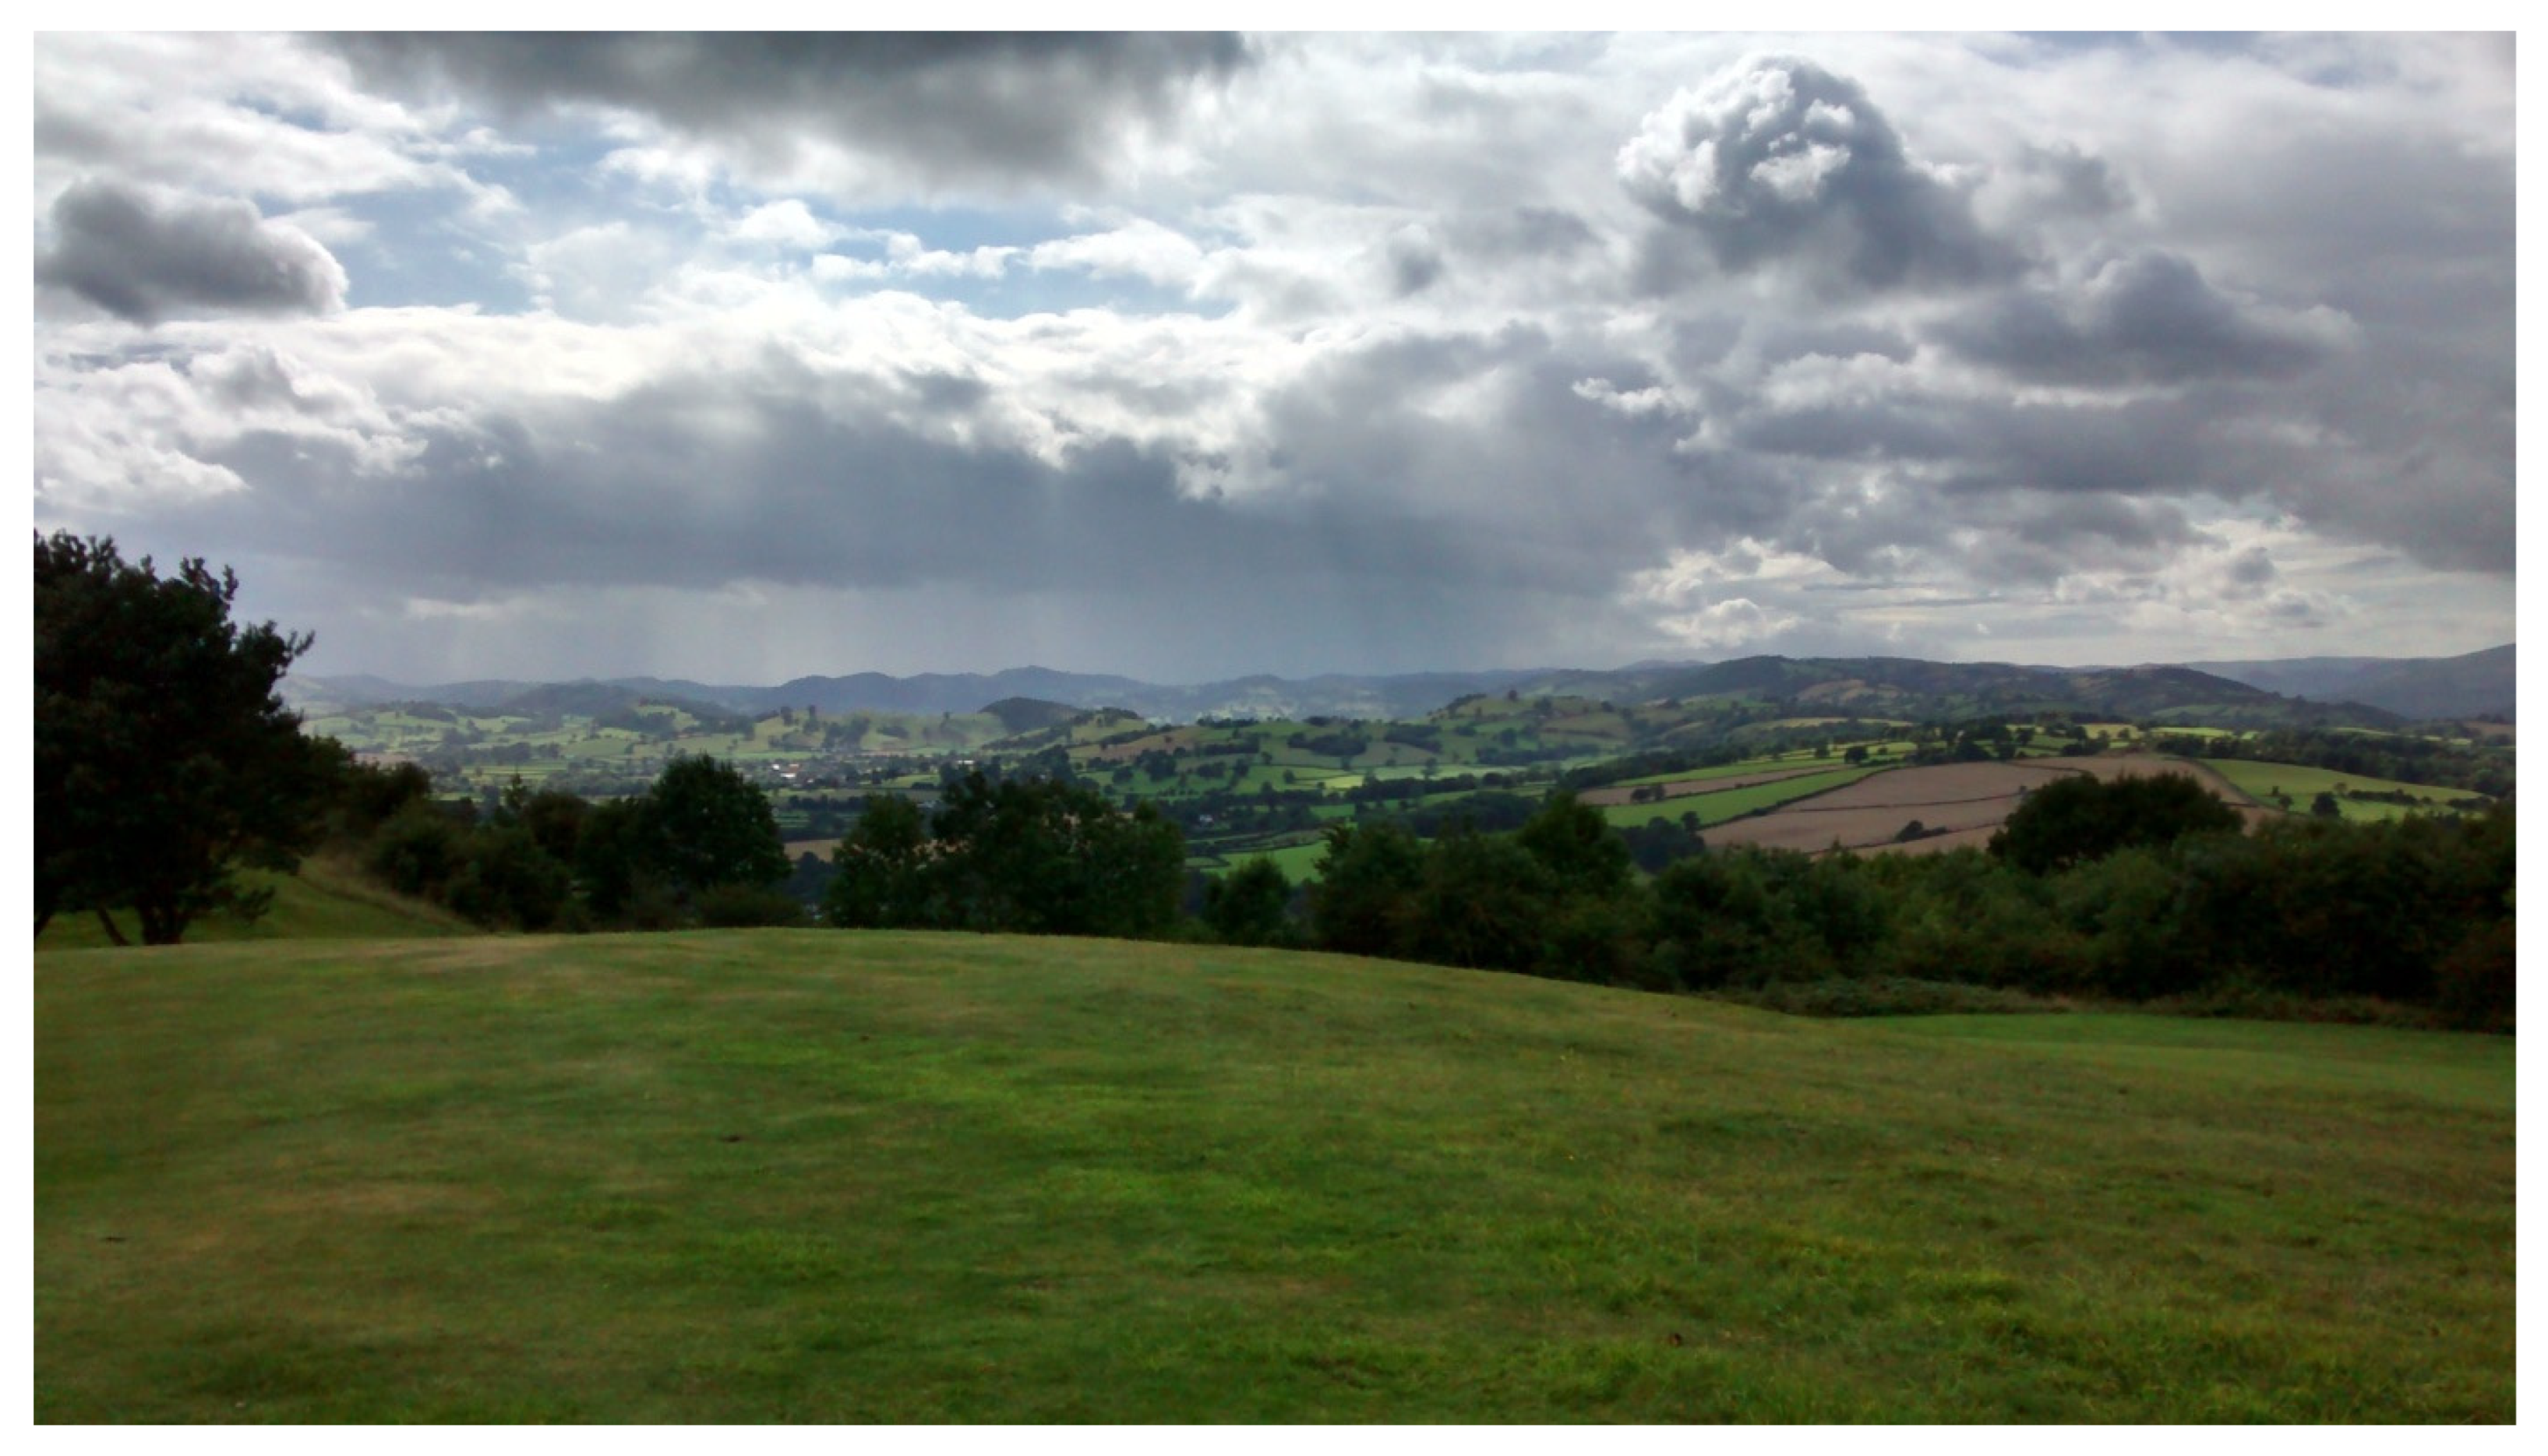
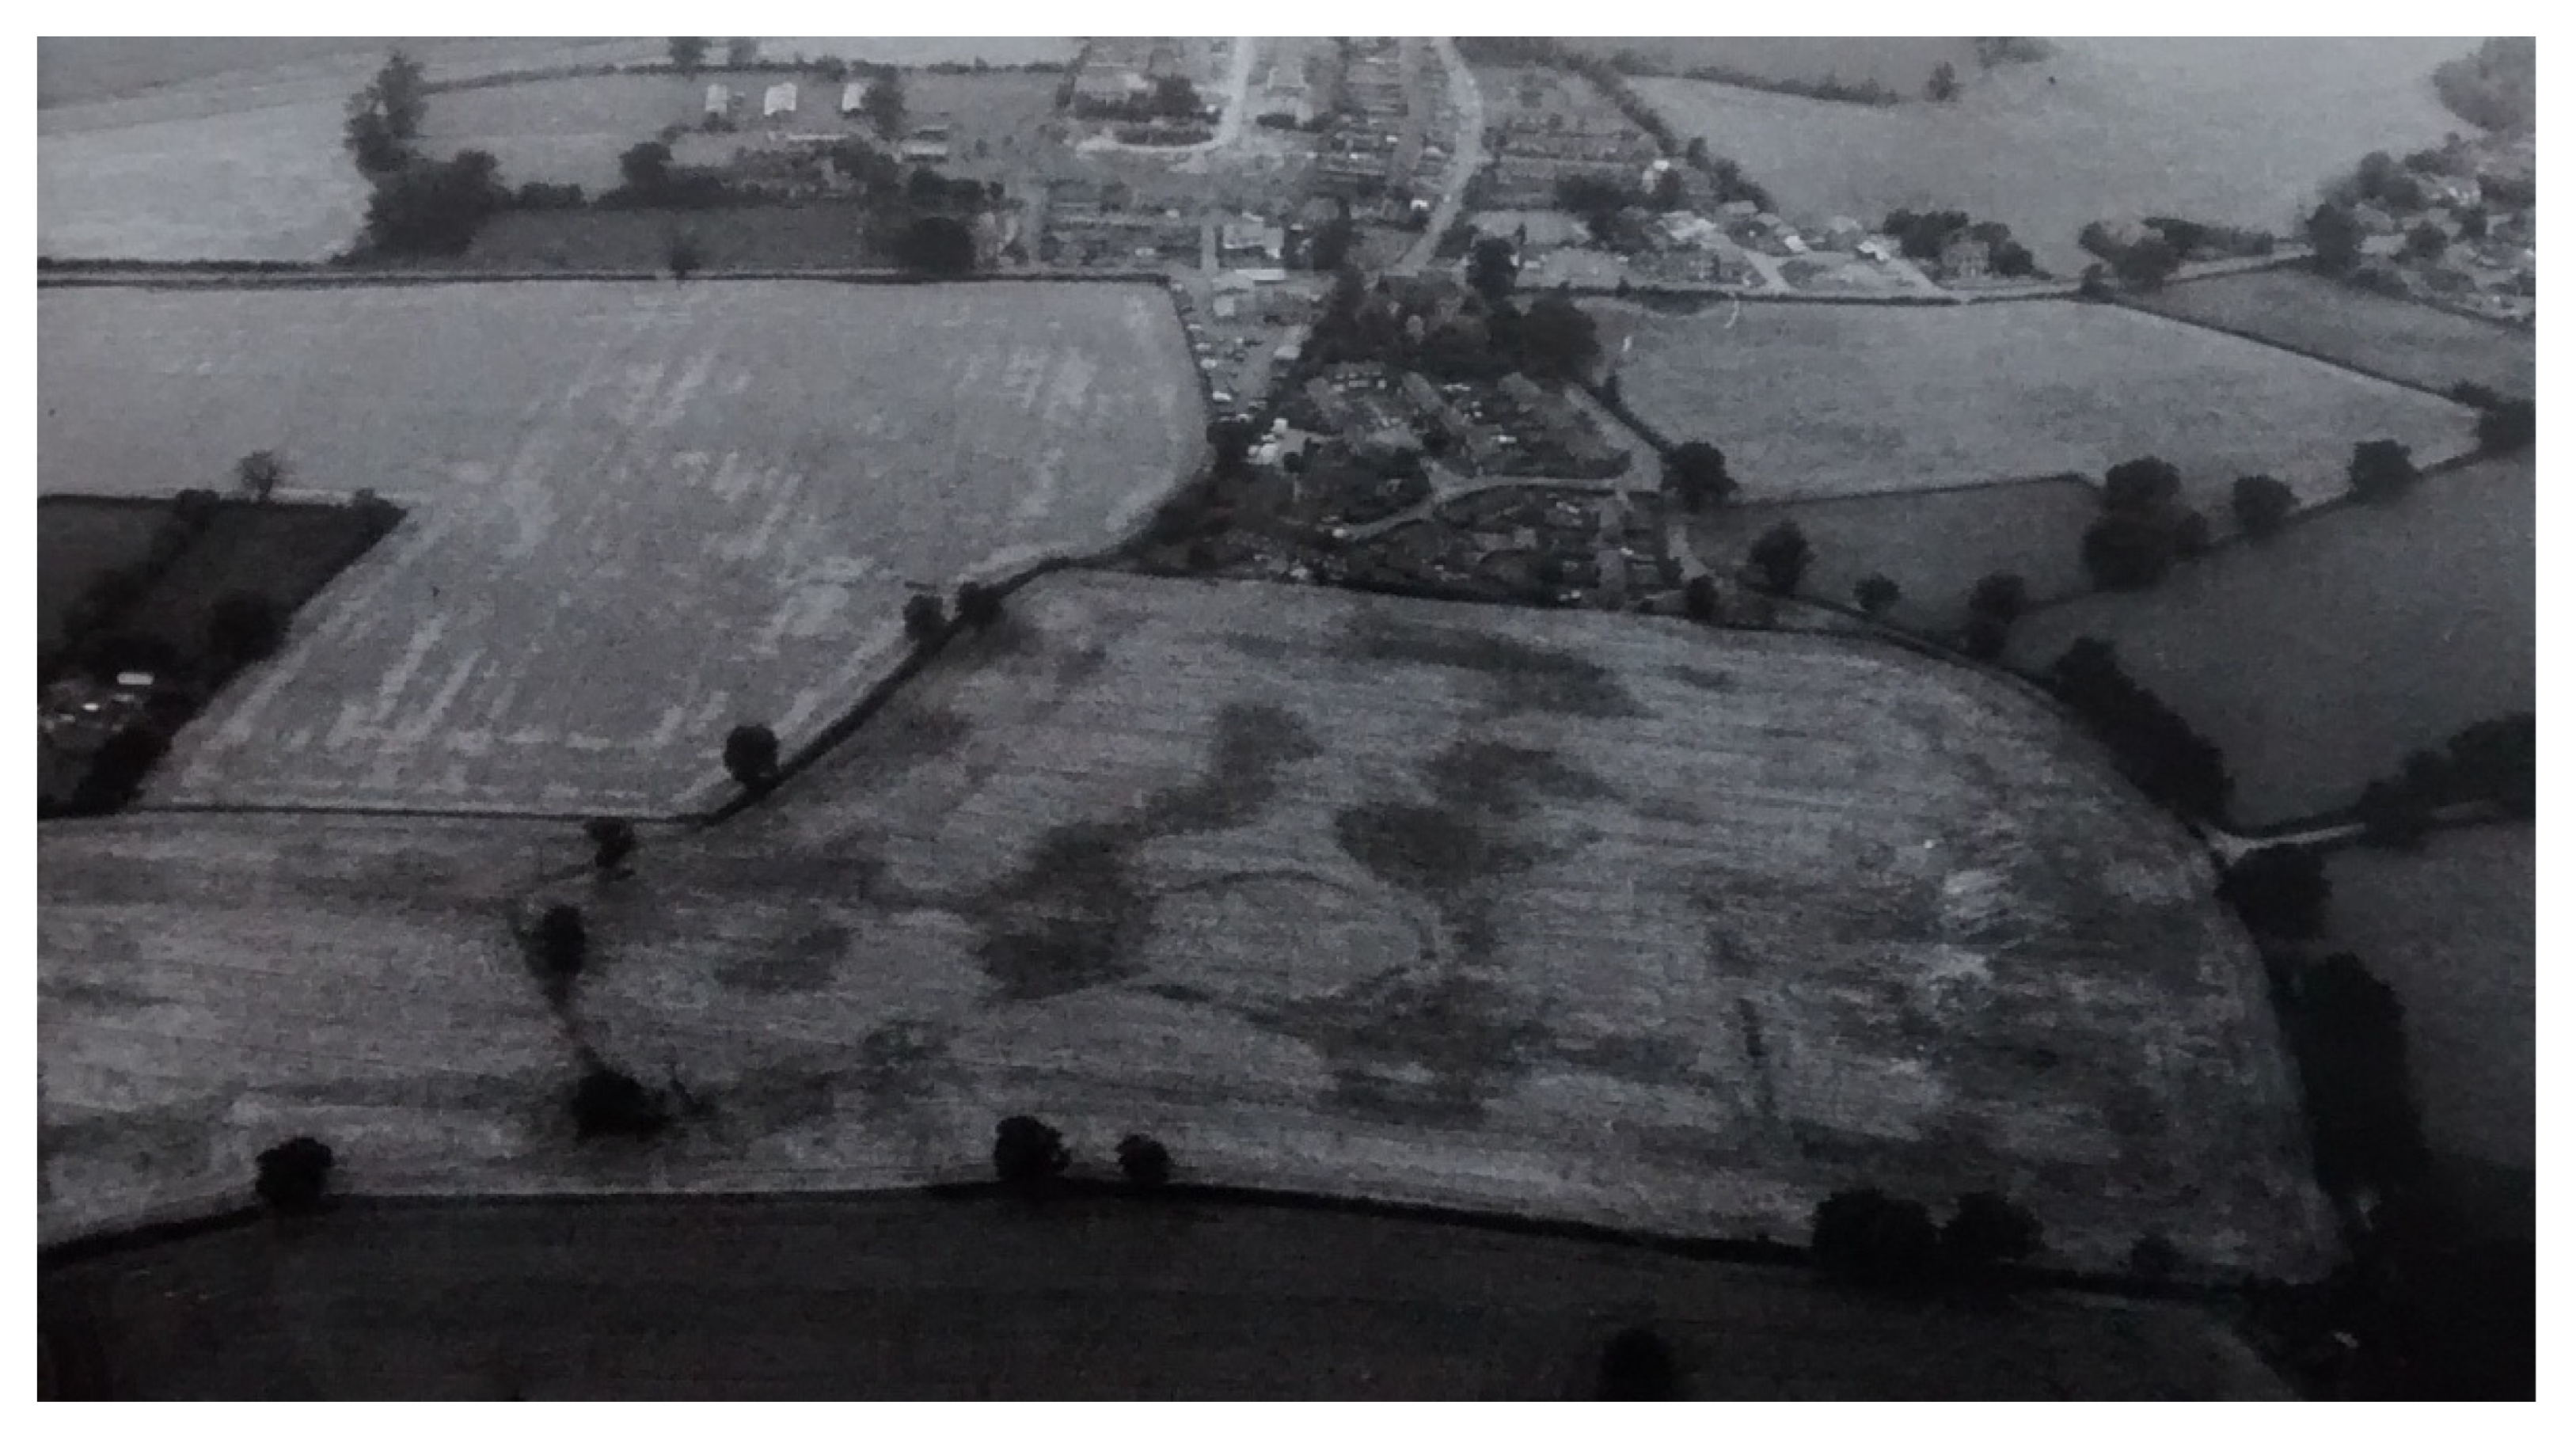
2.6. Field Research
3. Results
3.1. The EVNM
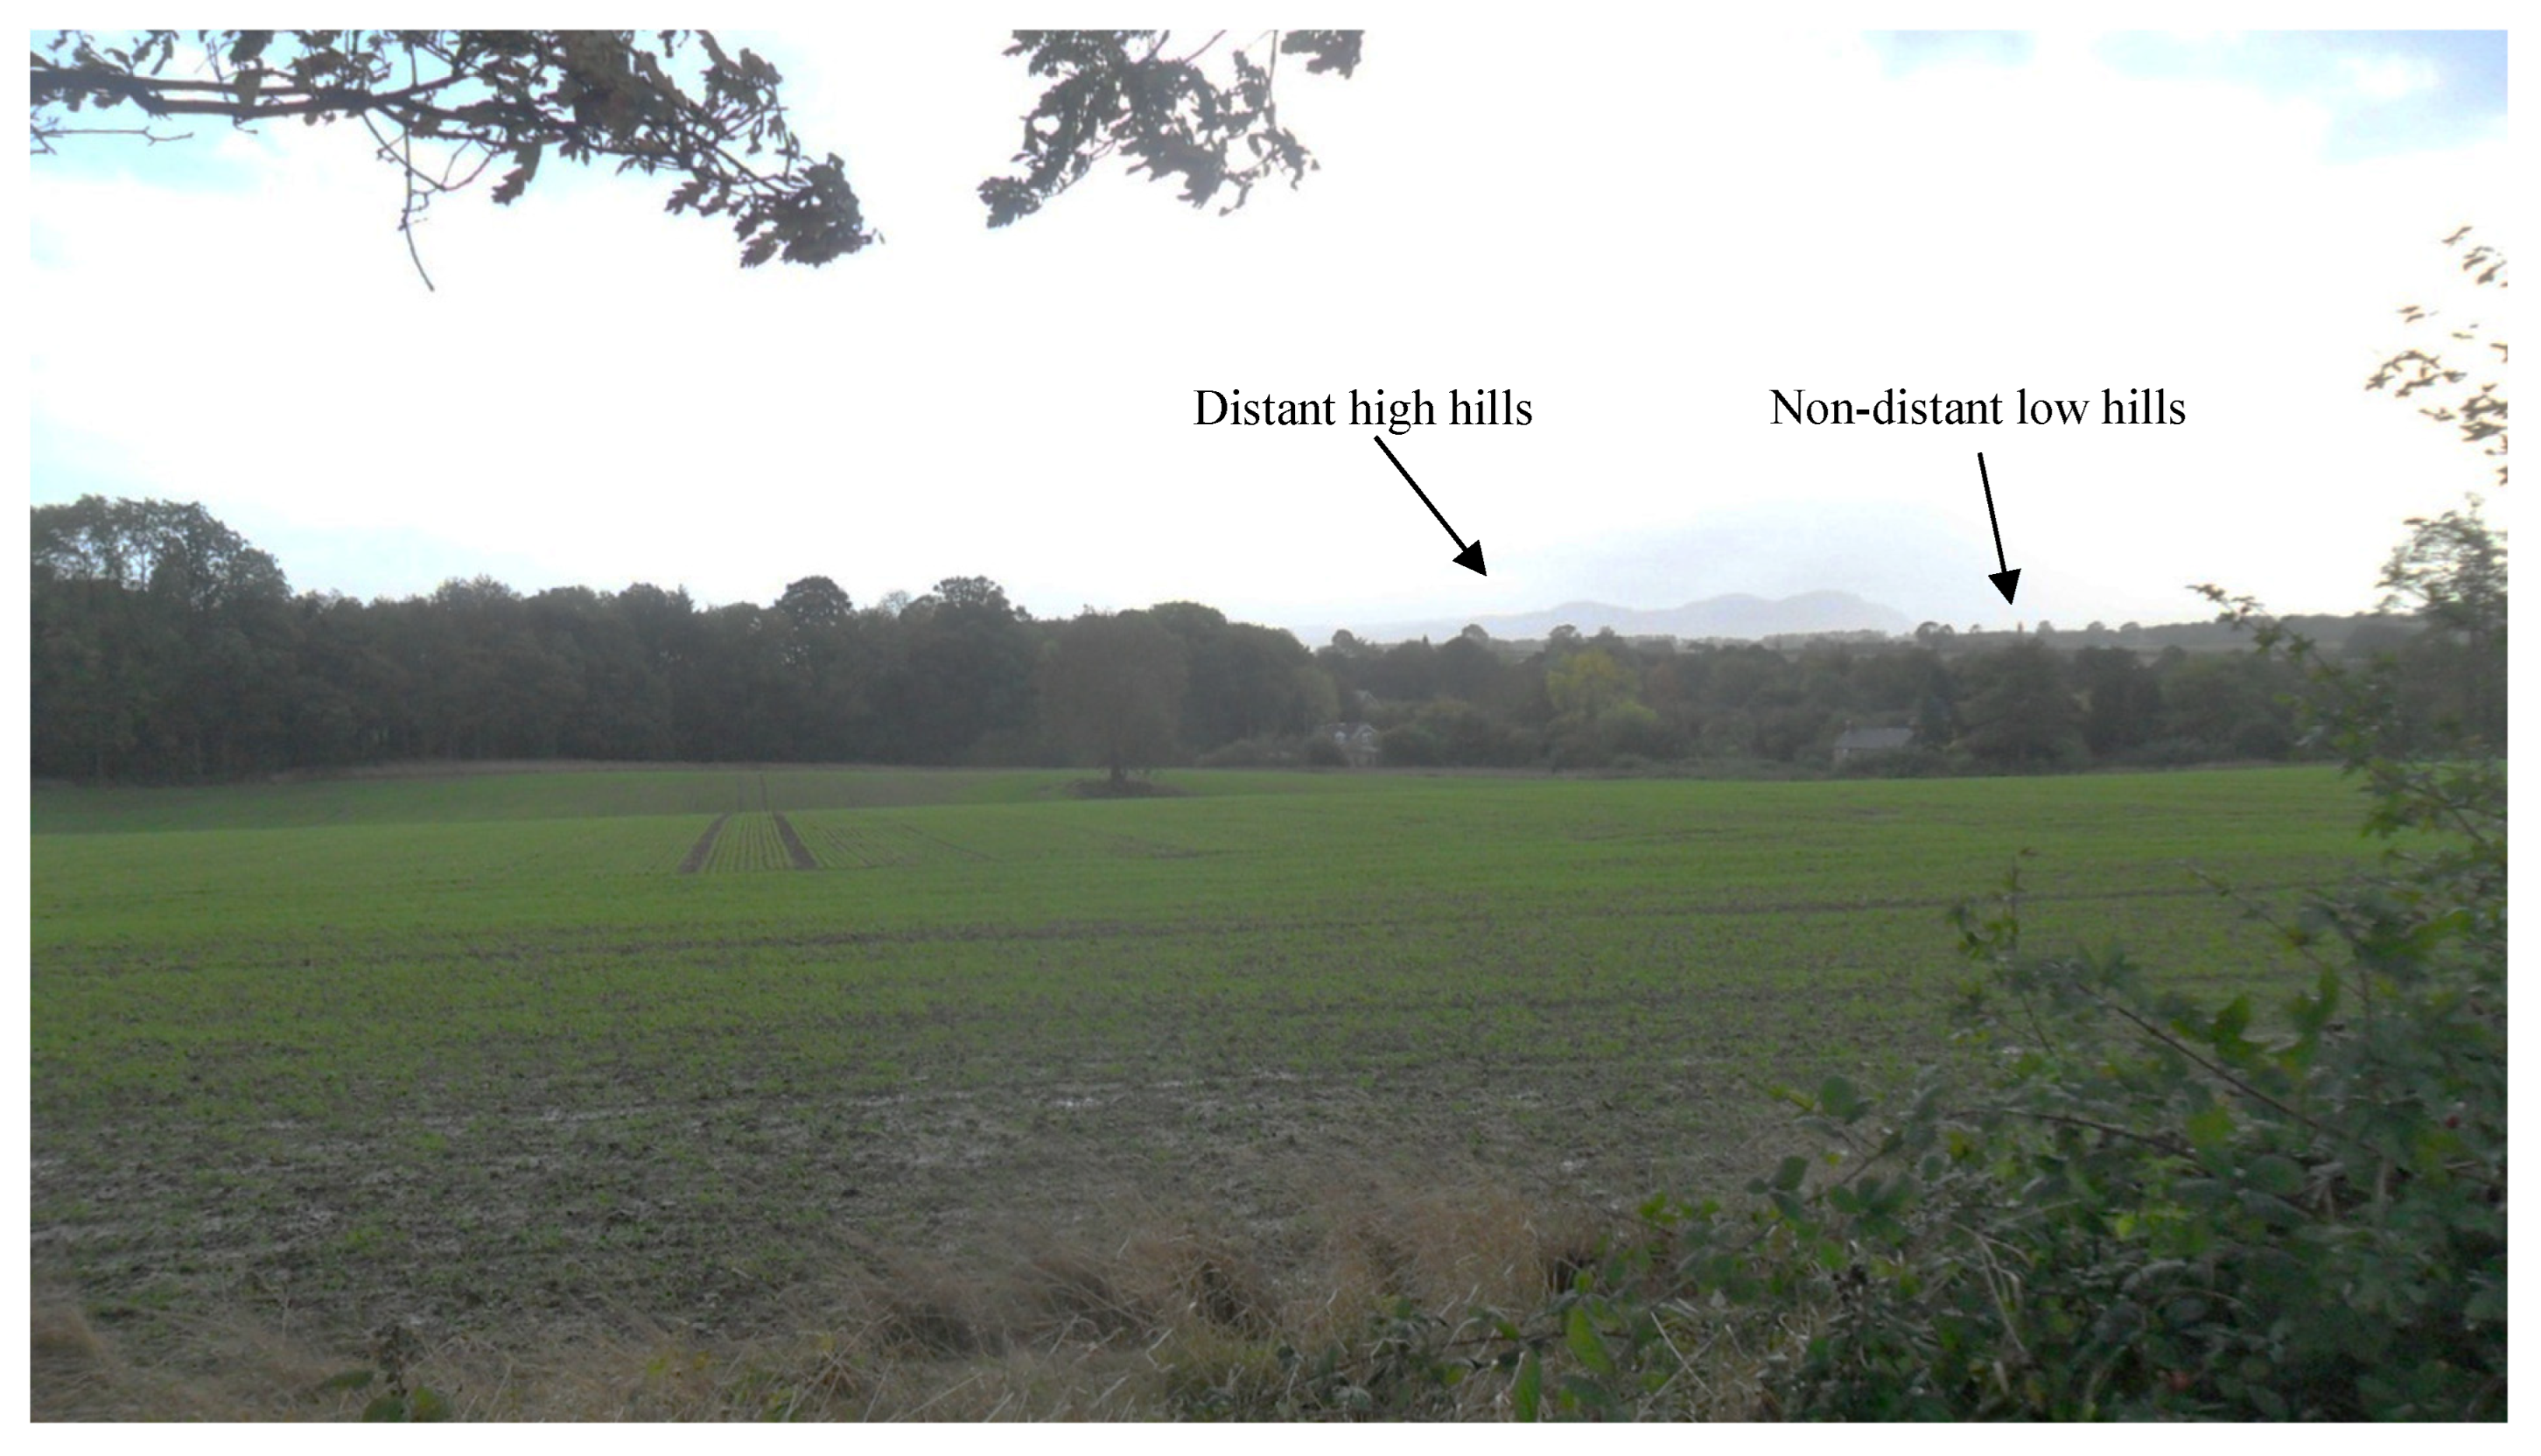
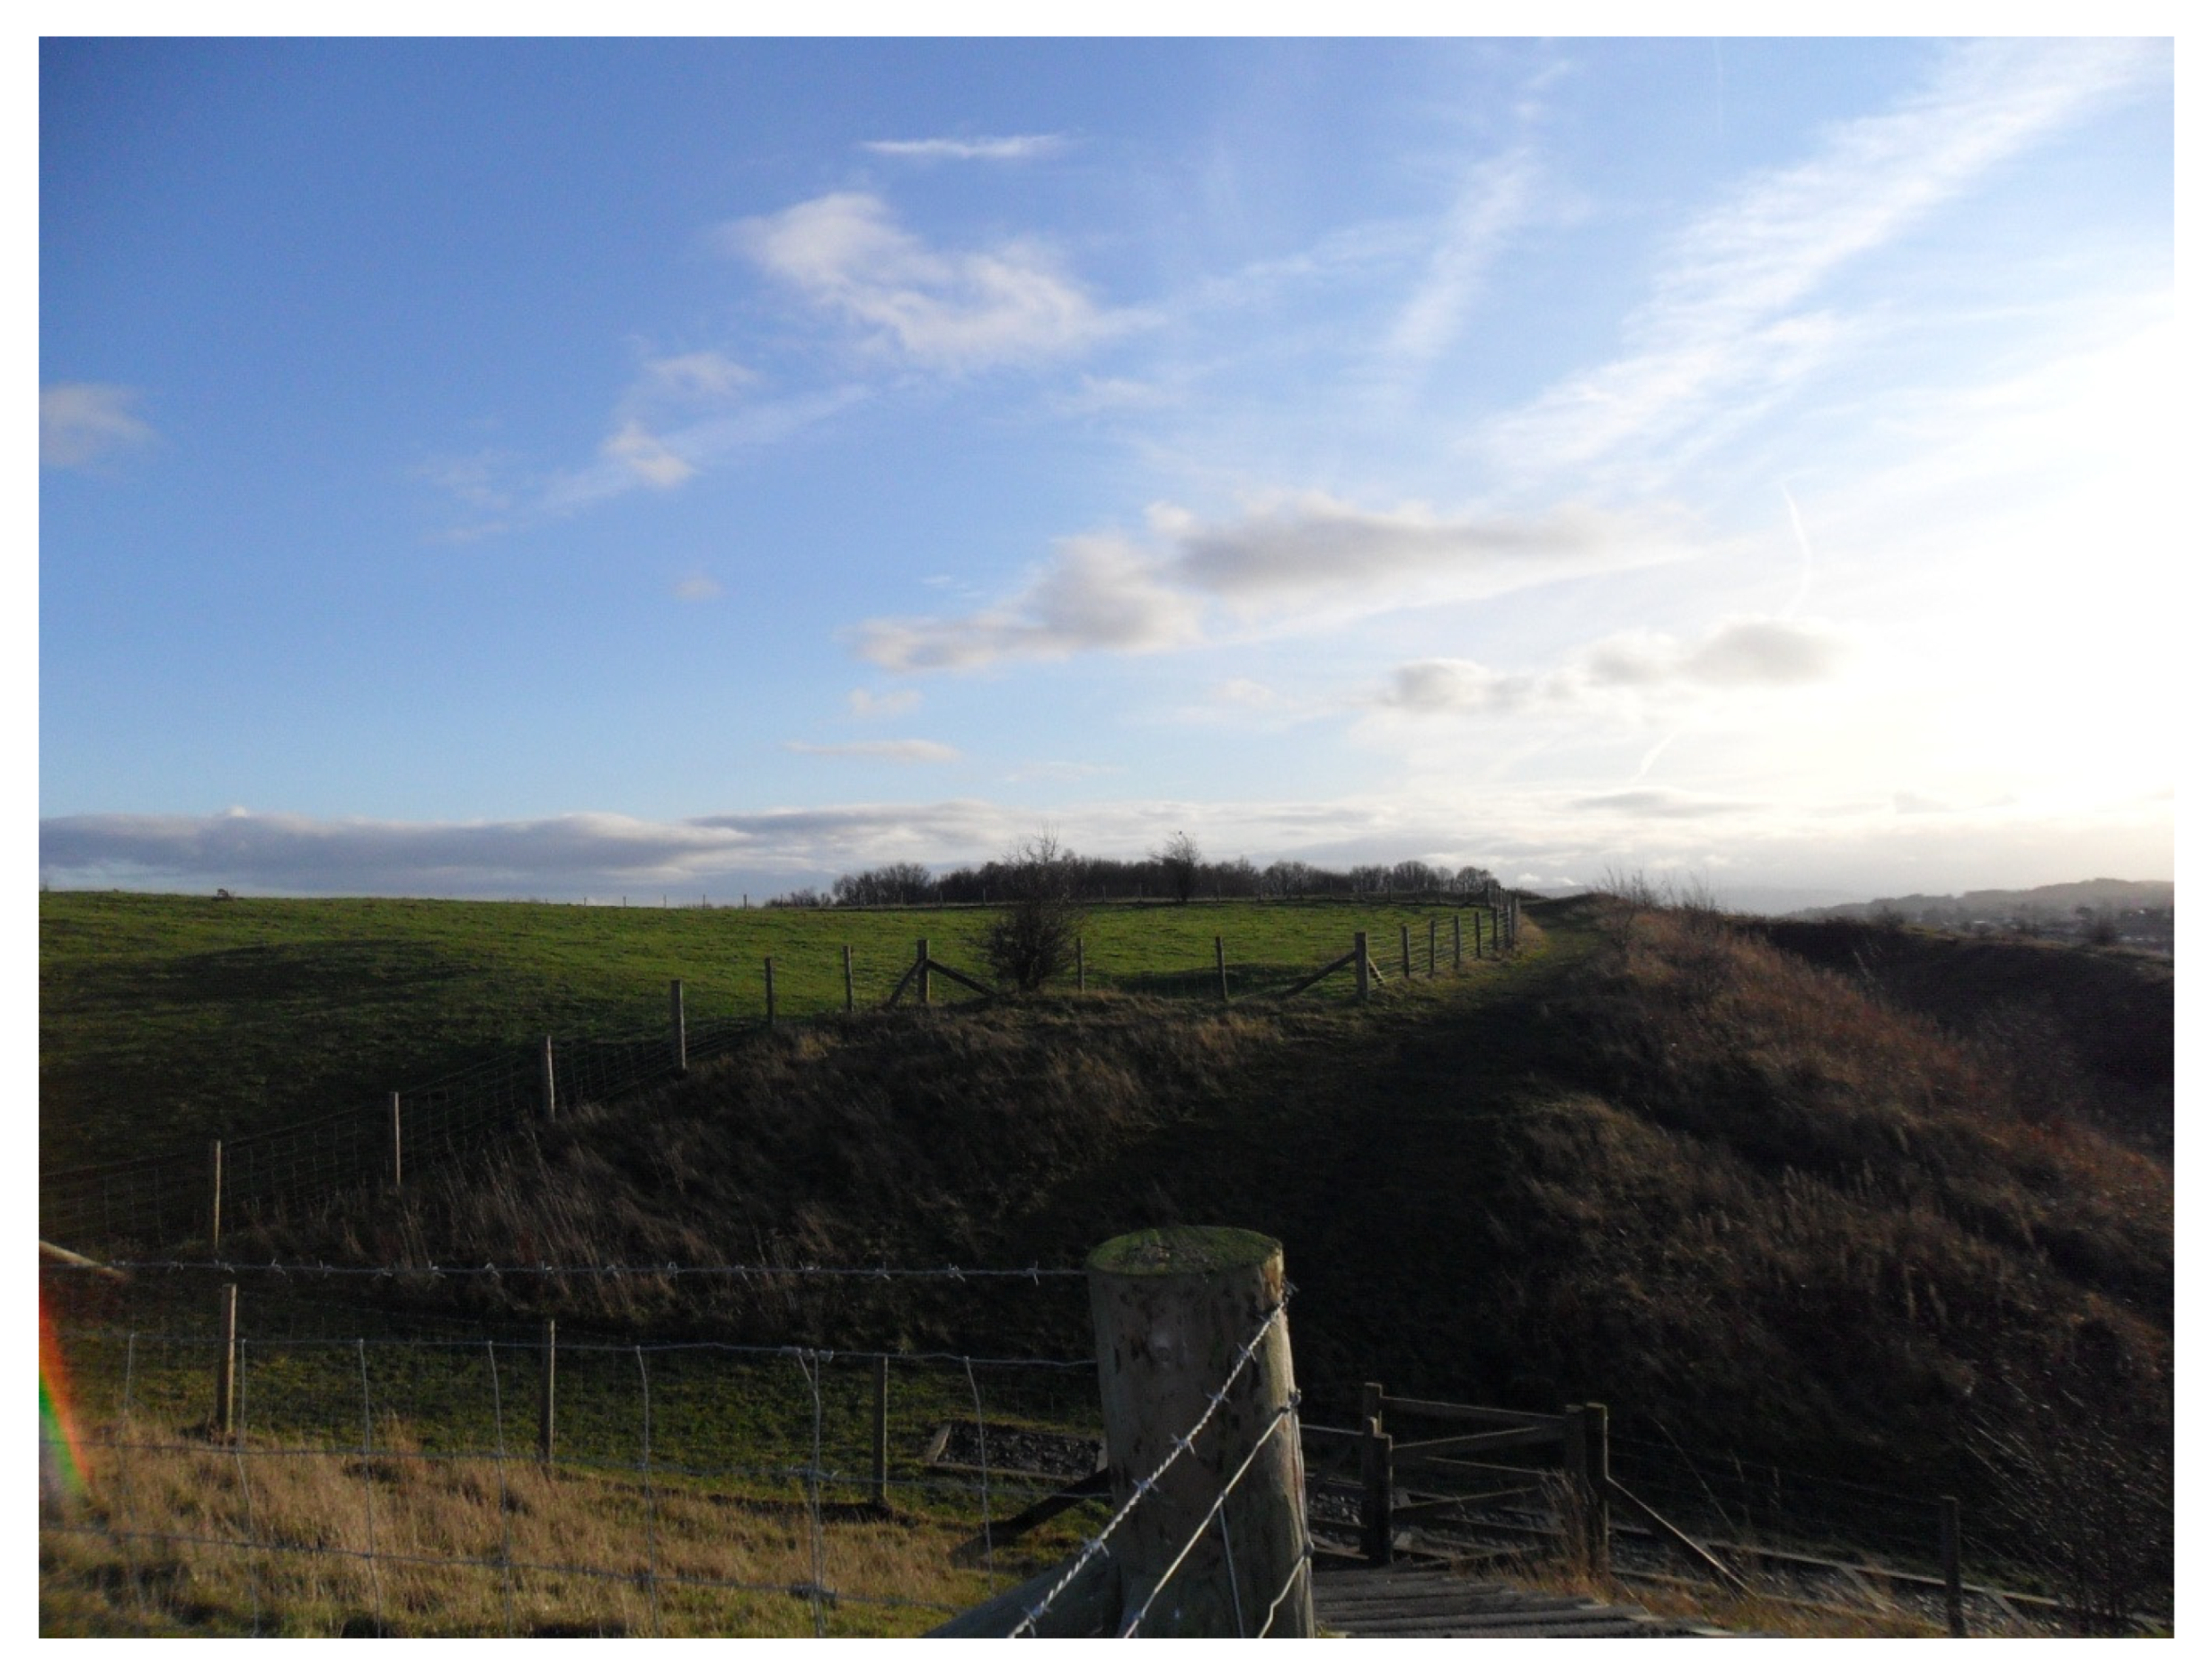
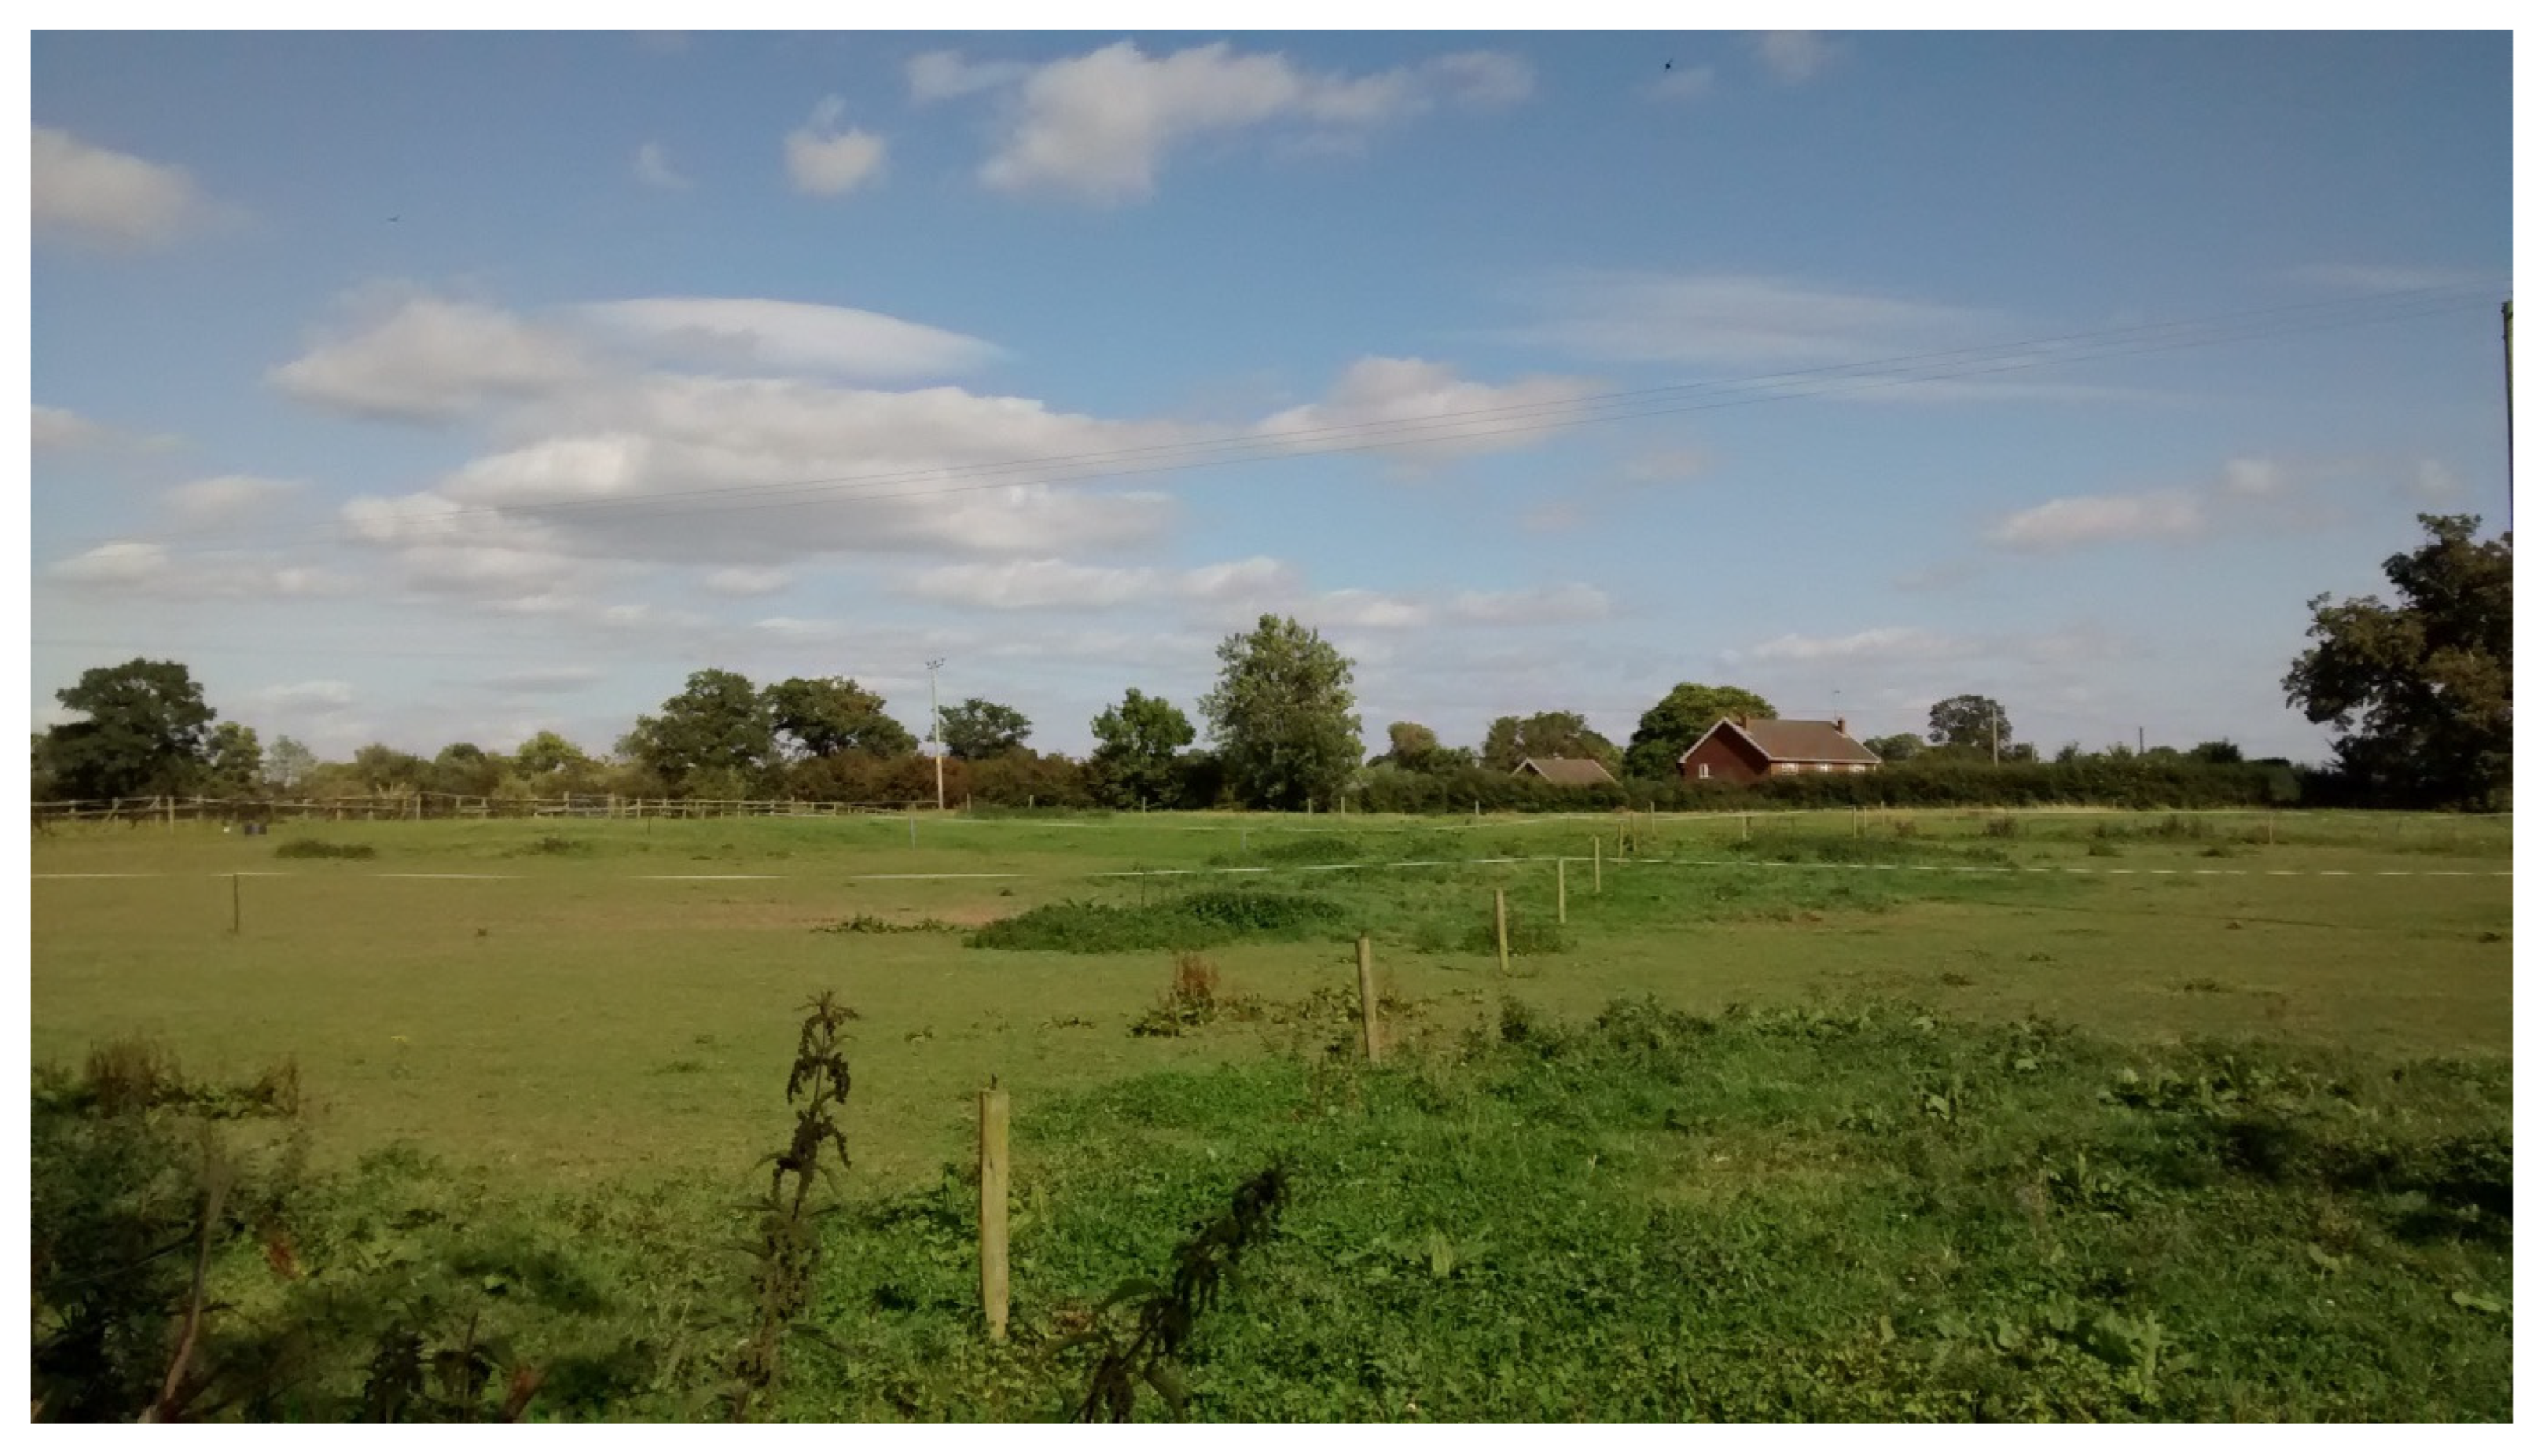
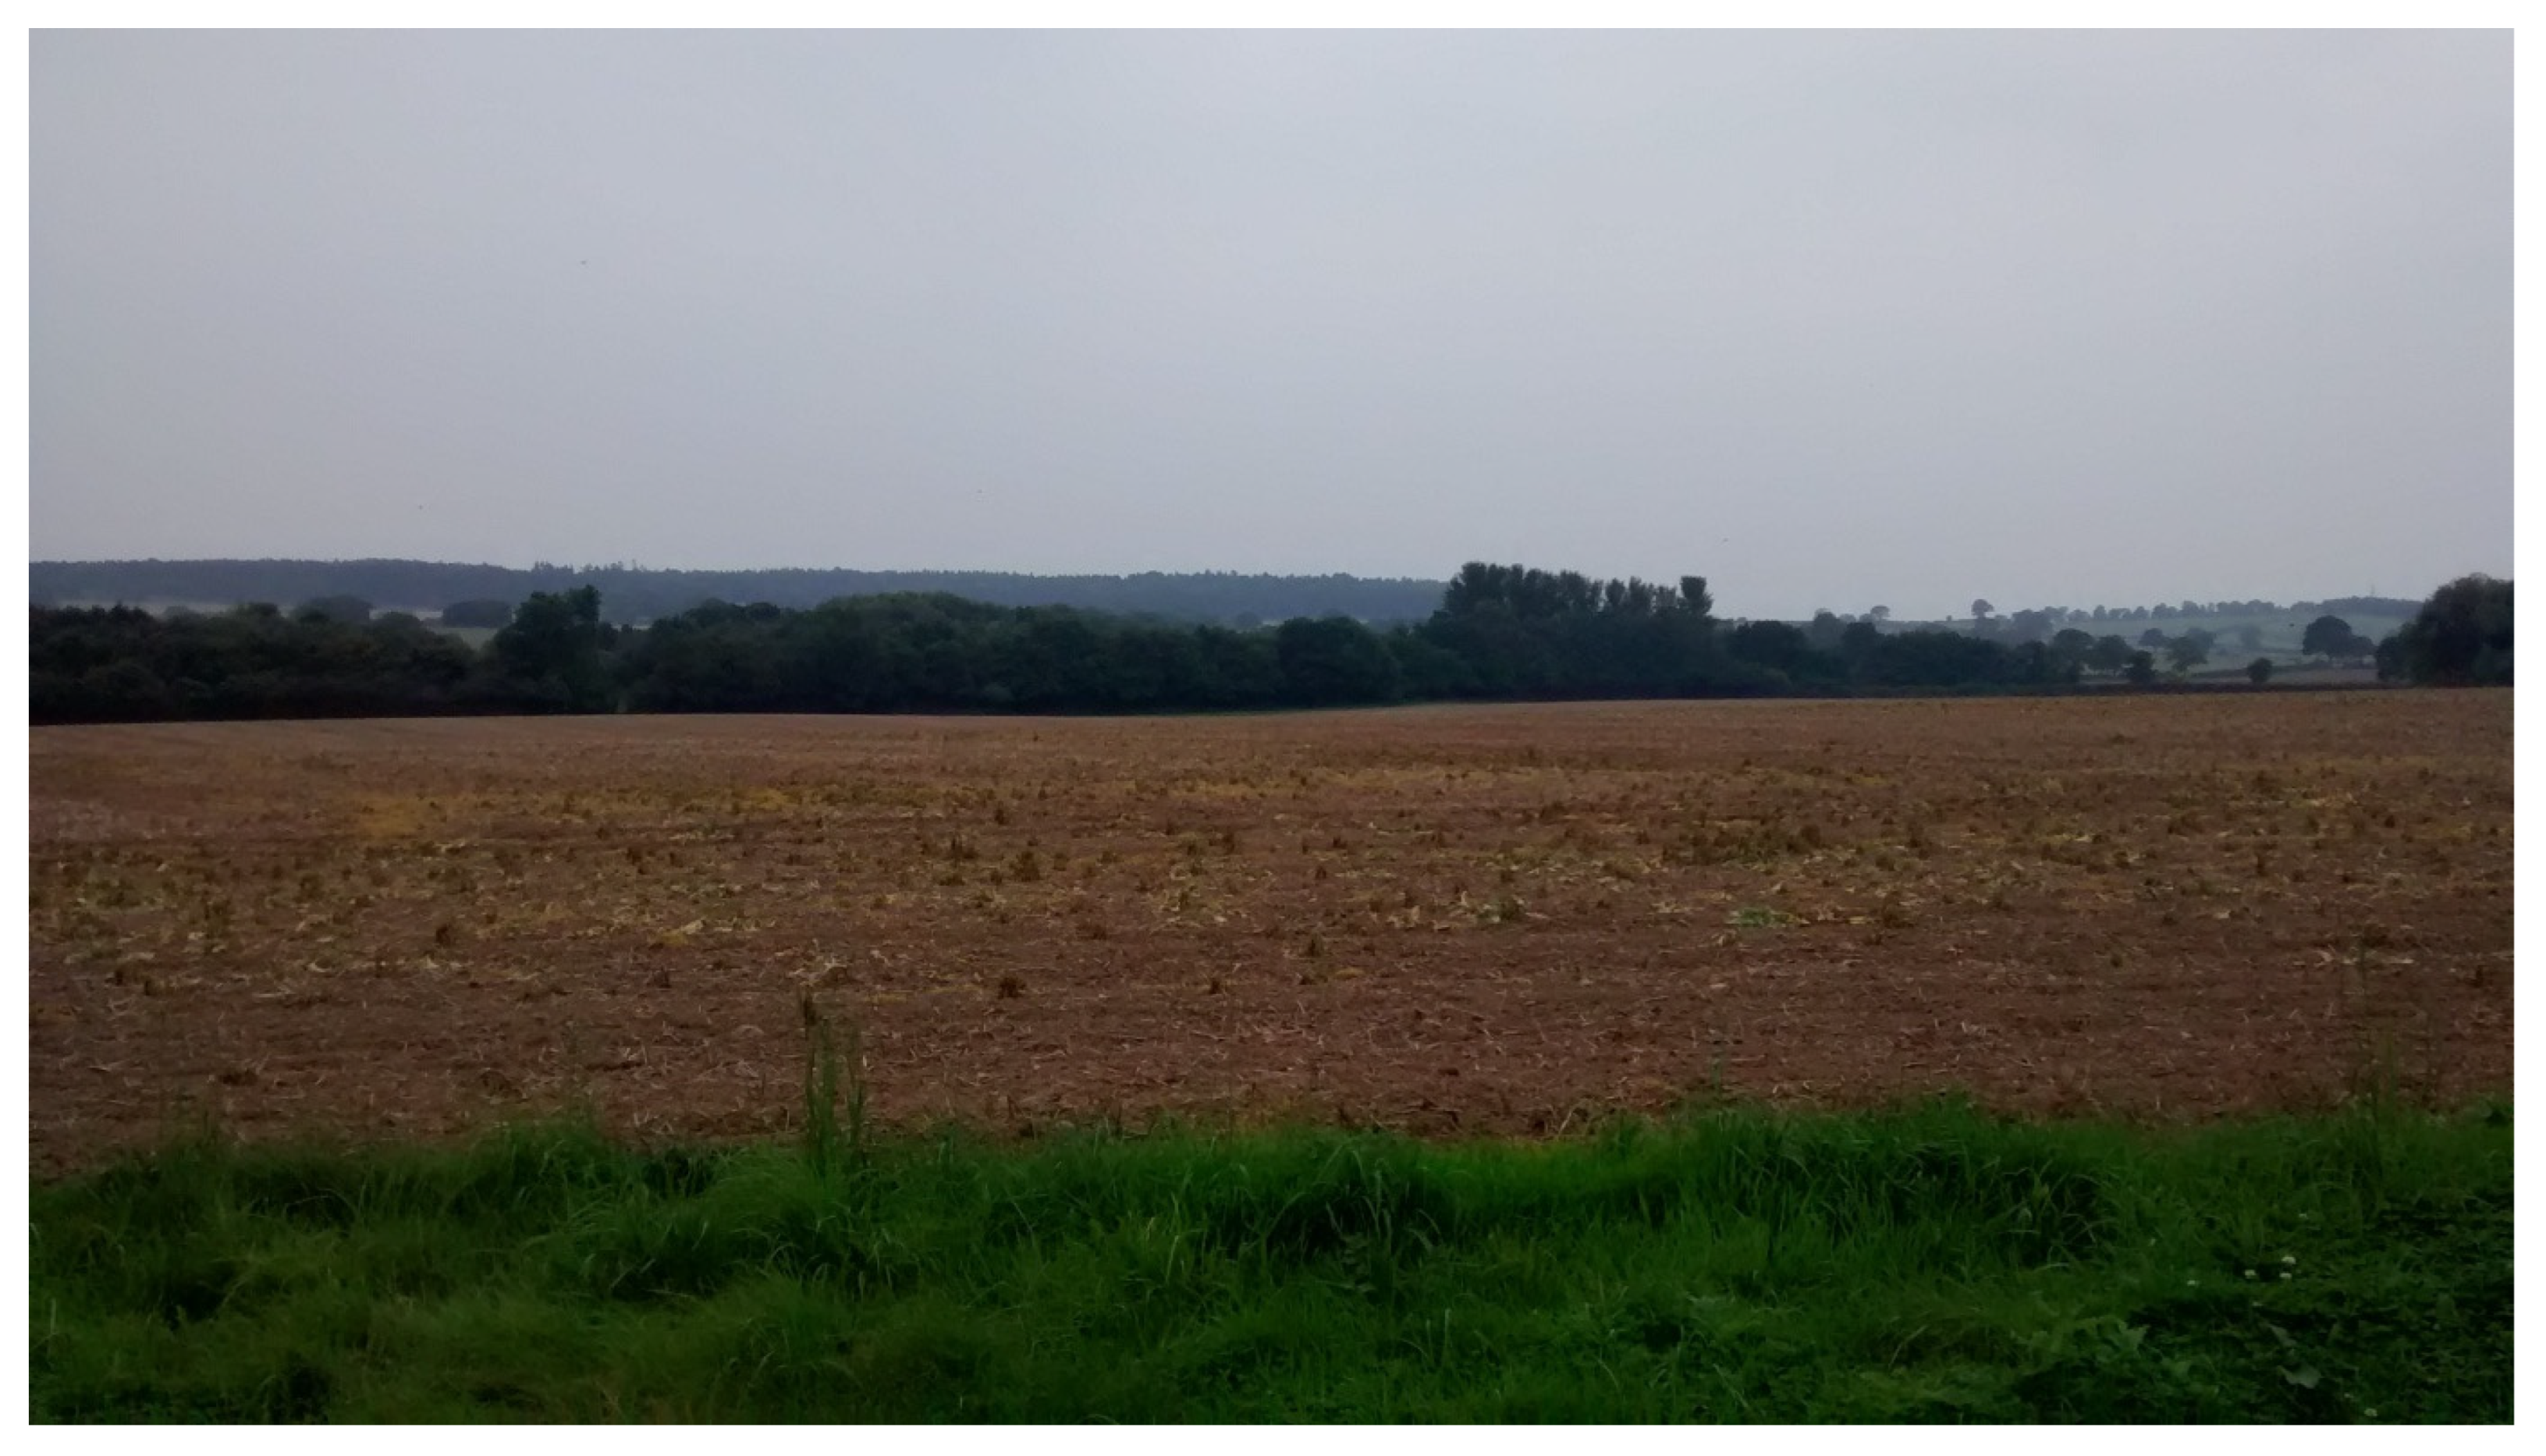
3.2. Results from the Field Research
4. Discussion
5. Conclusions
Funding
Data Availability Statement
Acknowledgments
Conflicts of Interest
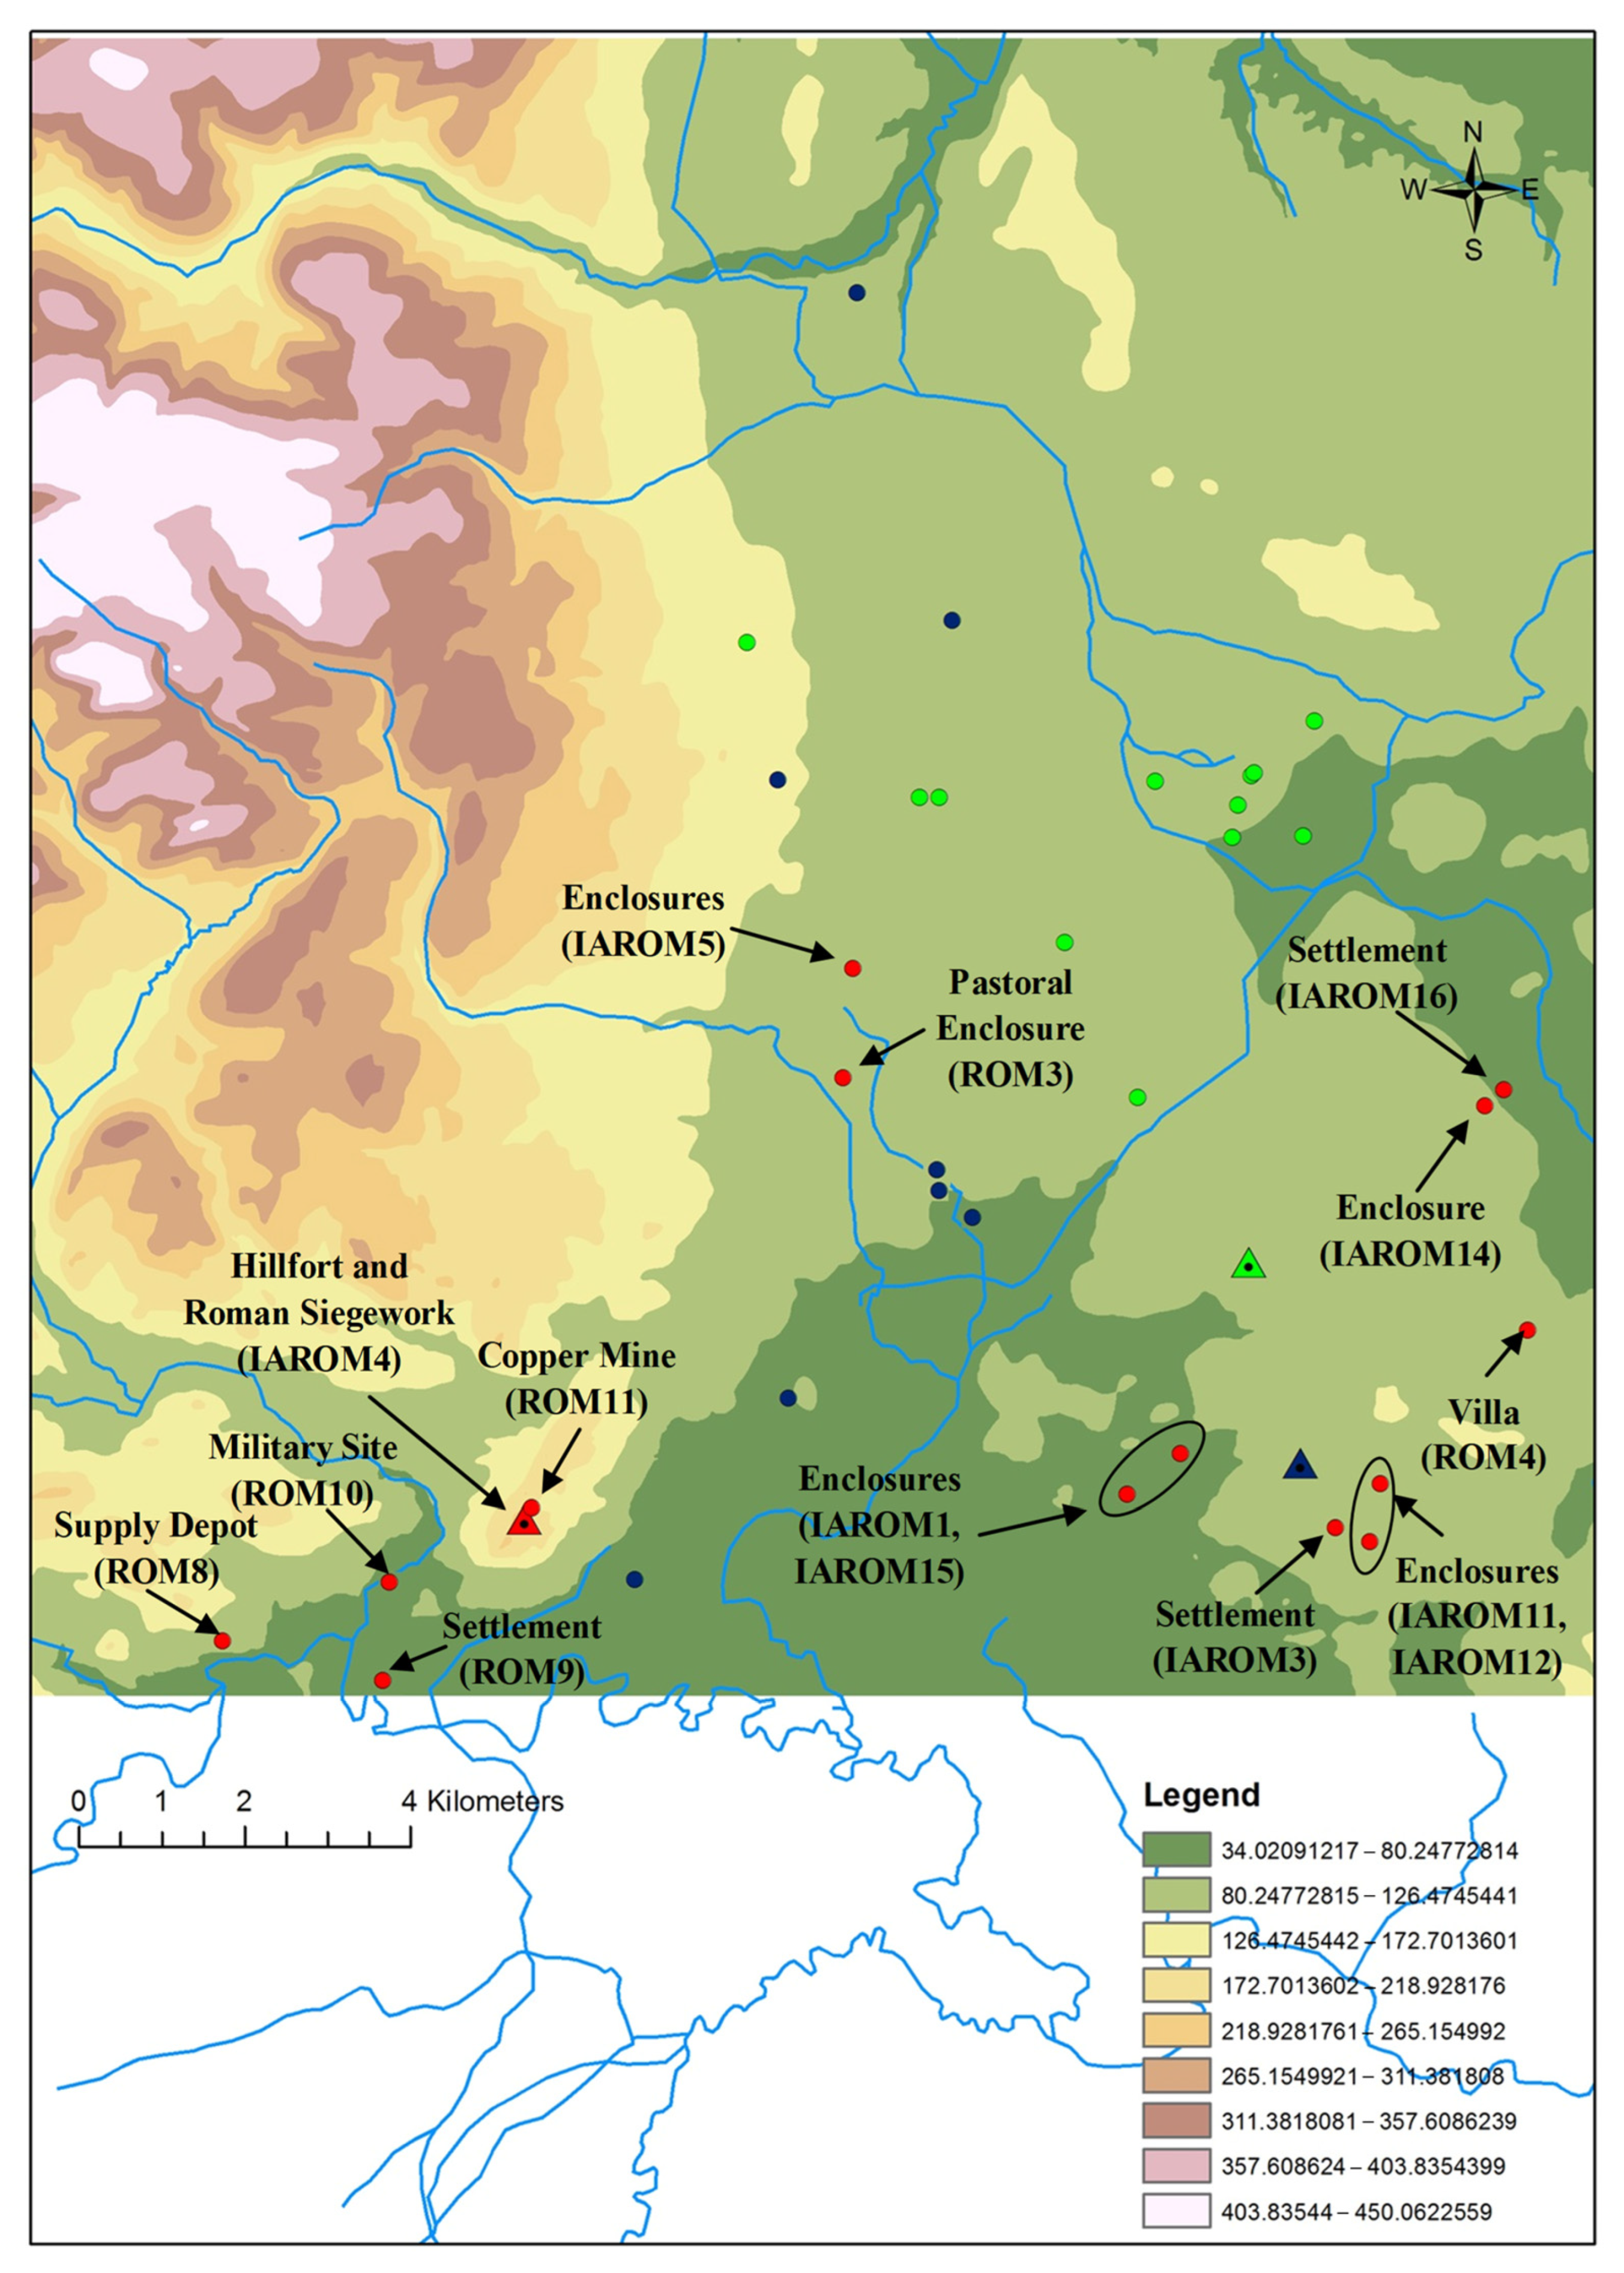
Appendix A. Database
| Site | Monument Number | Grid Reference | Description |
| IAROM1 | 66,798 | SJ 3375 2238 | Cropmarks of a sub-circular enclosure. |
| IAROM2 | 1,049,976 | SJ 358 227 | Cropmark of a sinuous linear feature. |
| IAROM3 | 1,049,985 | SJ 363 220 | Cropmark of a D-shaped enclosure. |
| IAROM4 | 66,006 | SJ 265 221 | Llanymynech hillfort, Roman siegework. |
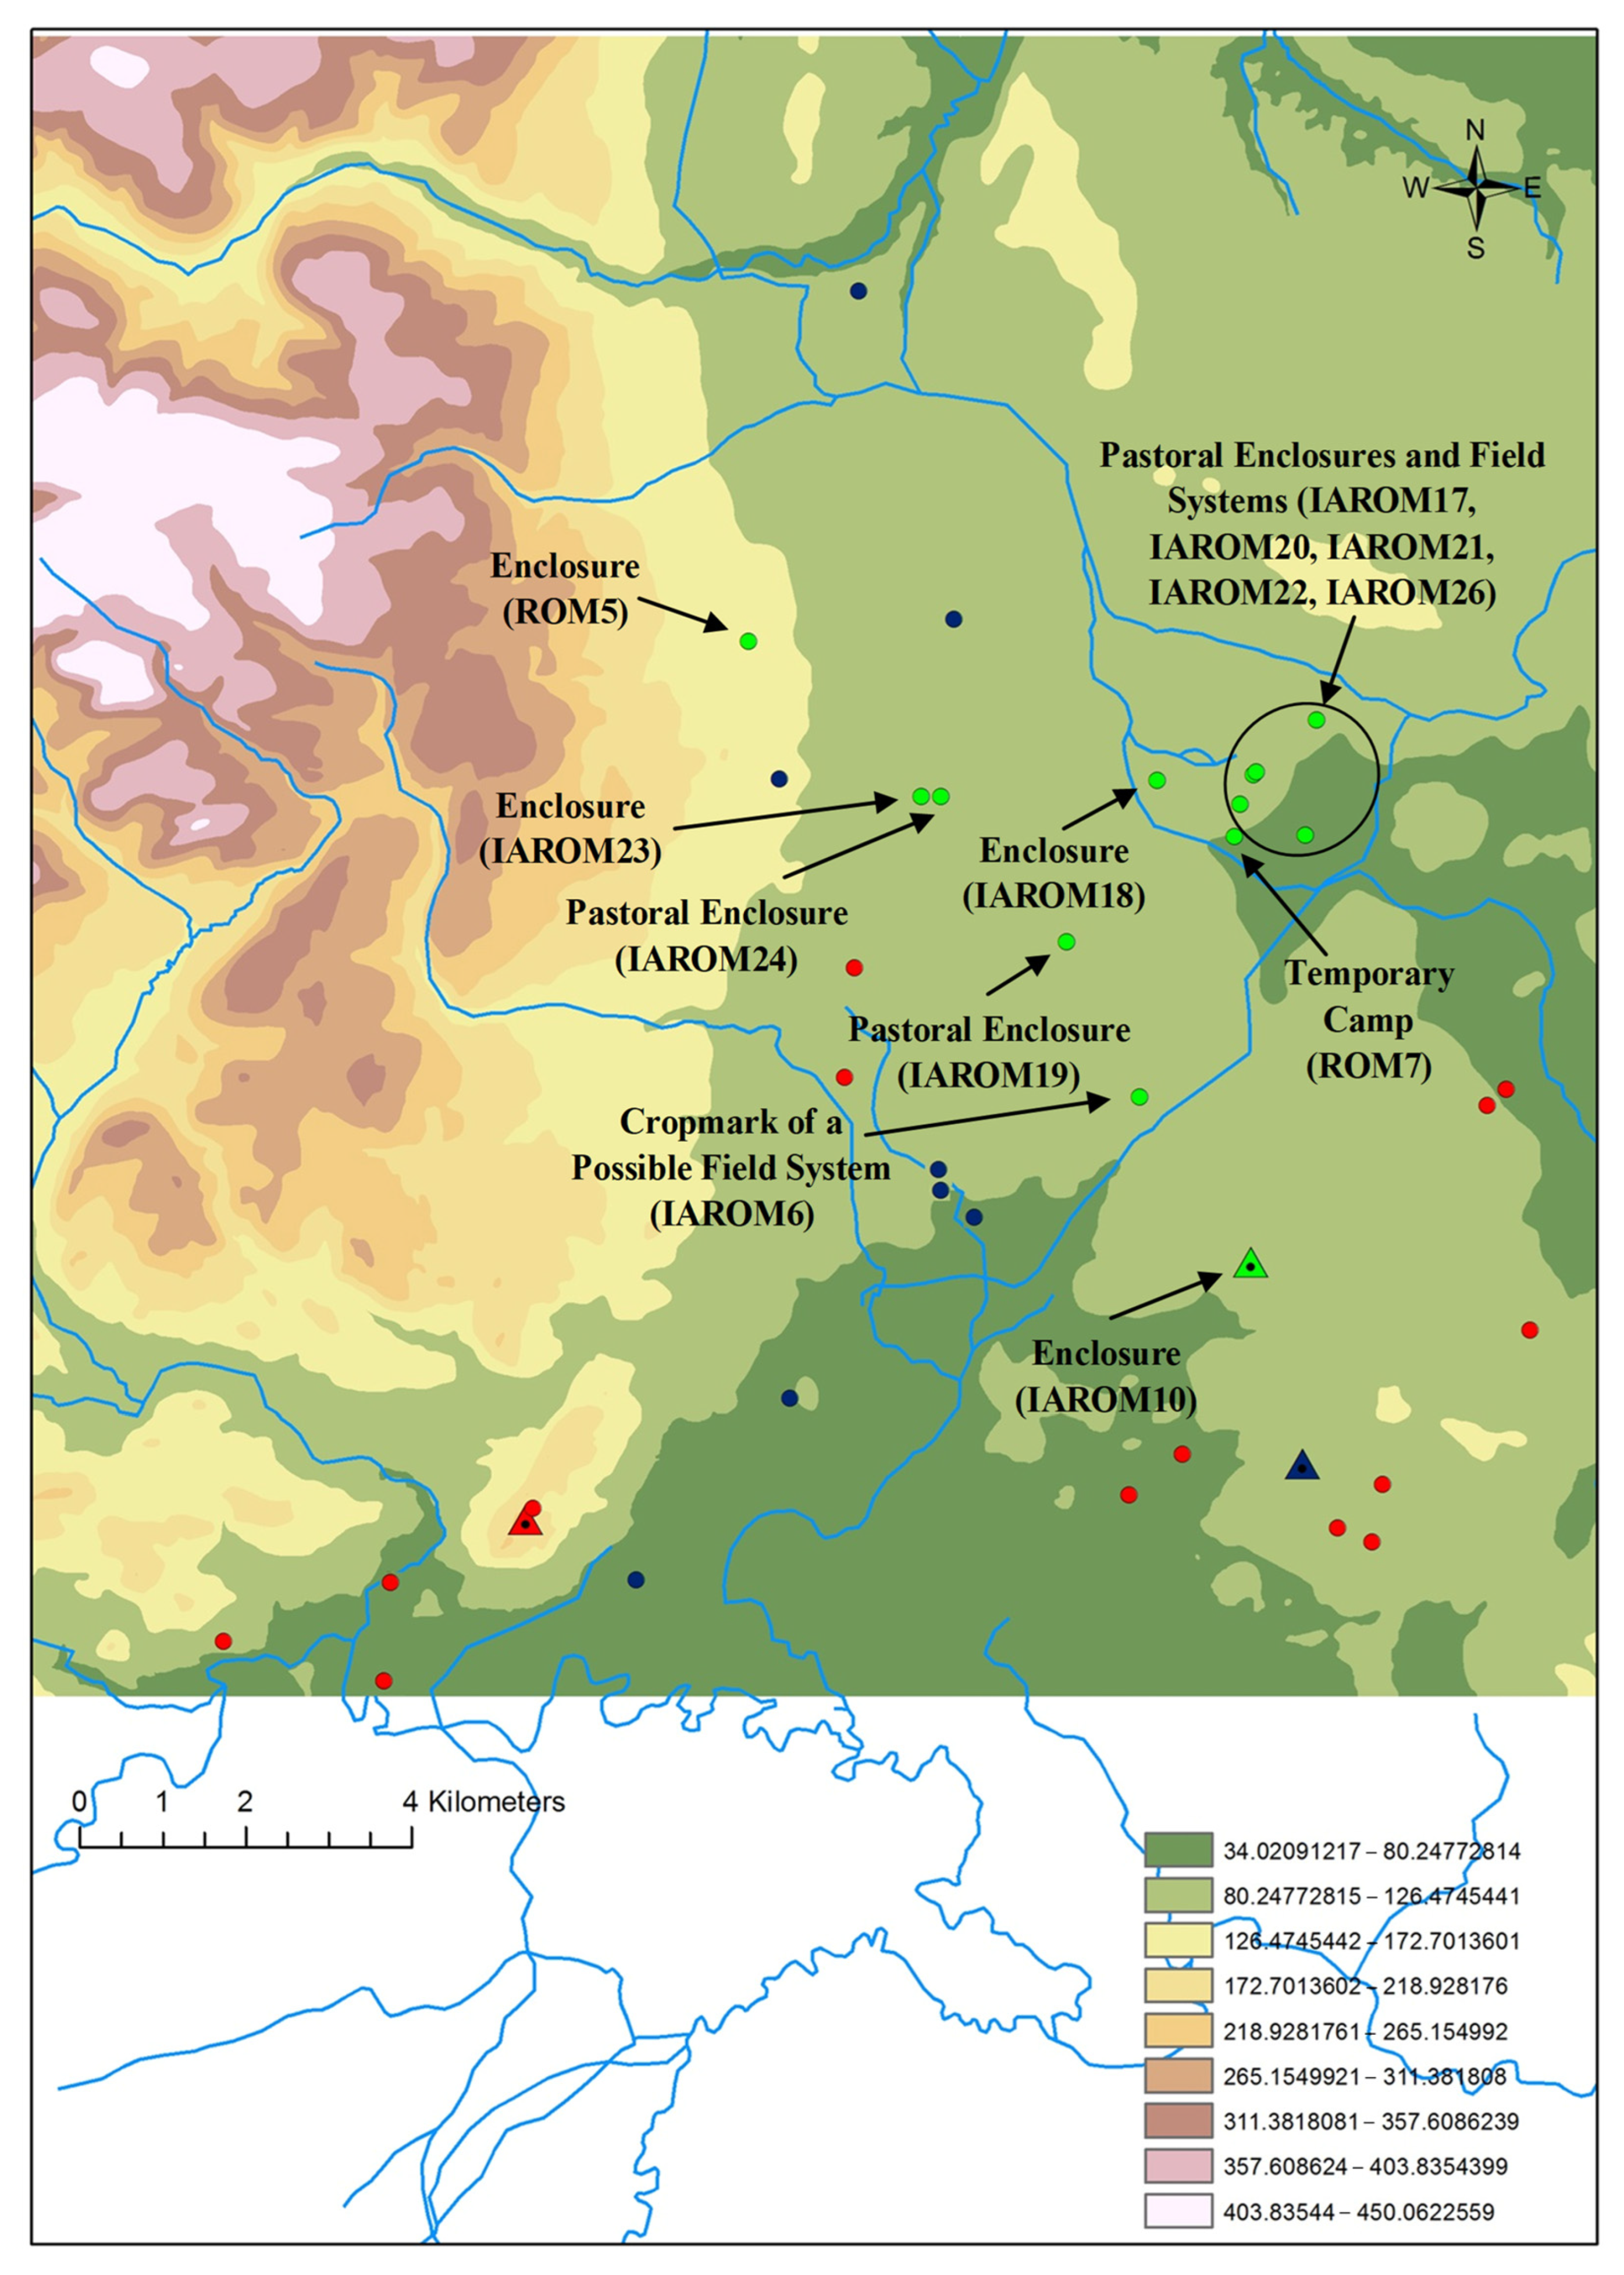
| IAROM5 | 66,636 | SJ 3045 2873 | Cropmarks of two enclosures. |
| IAROM6 | 66,642 | SJ 3392 2719 | Cropmarks of enclosures—possibly a field system. |
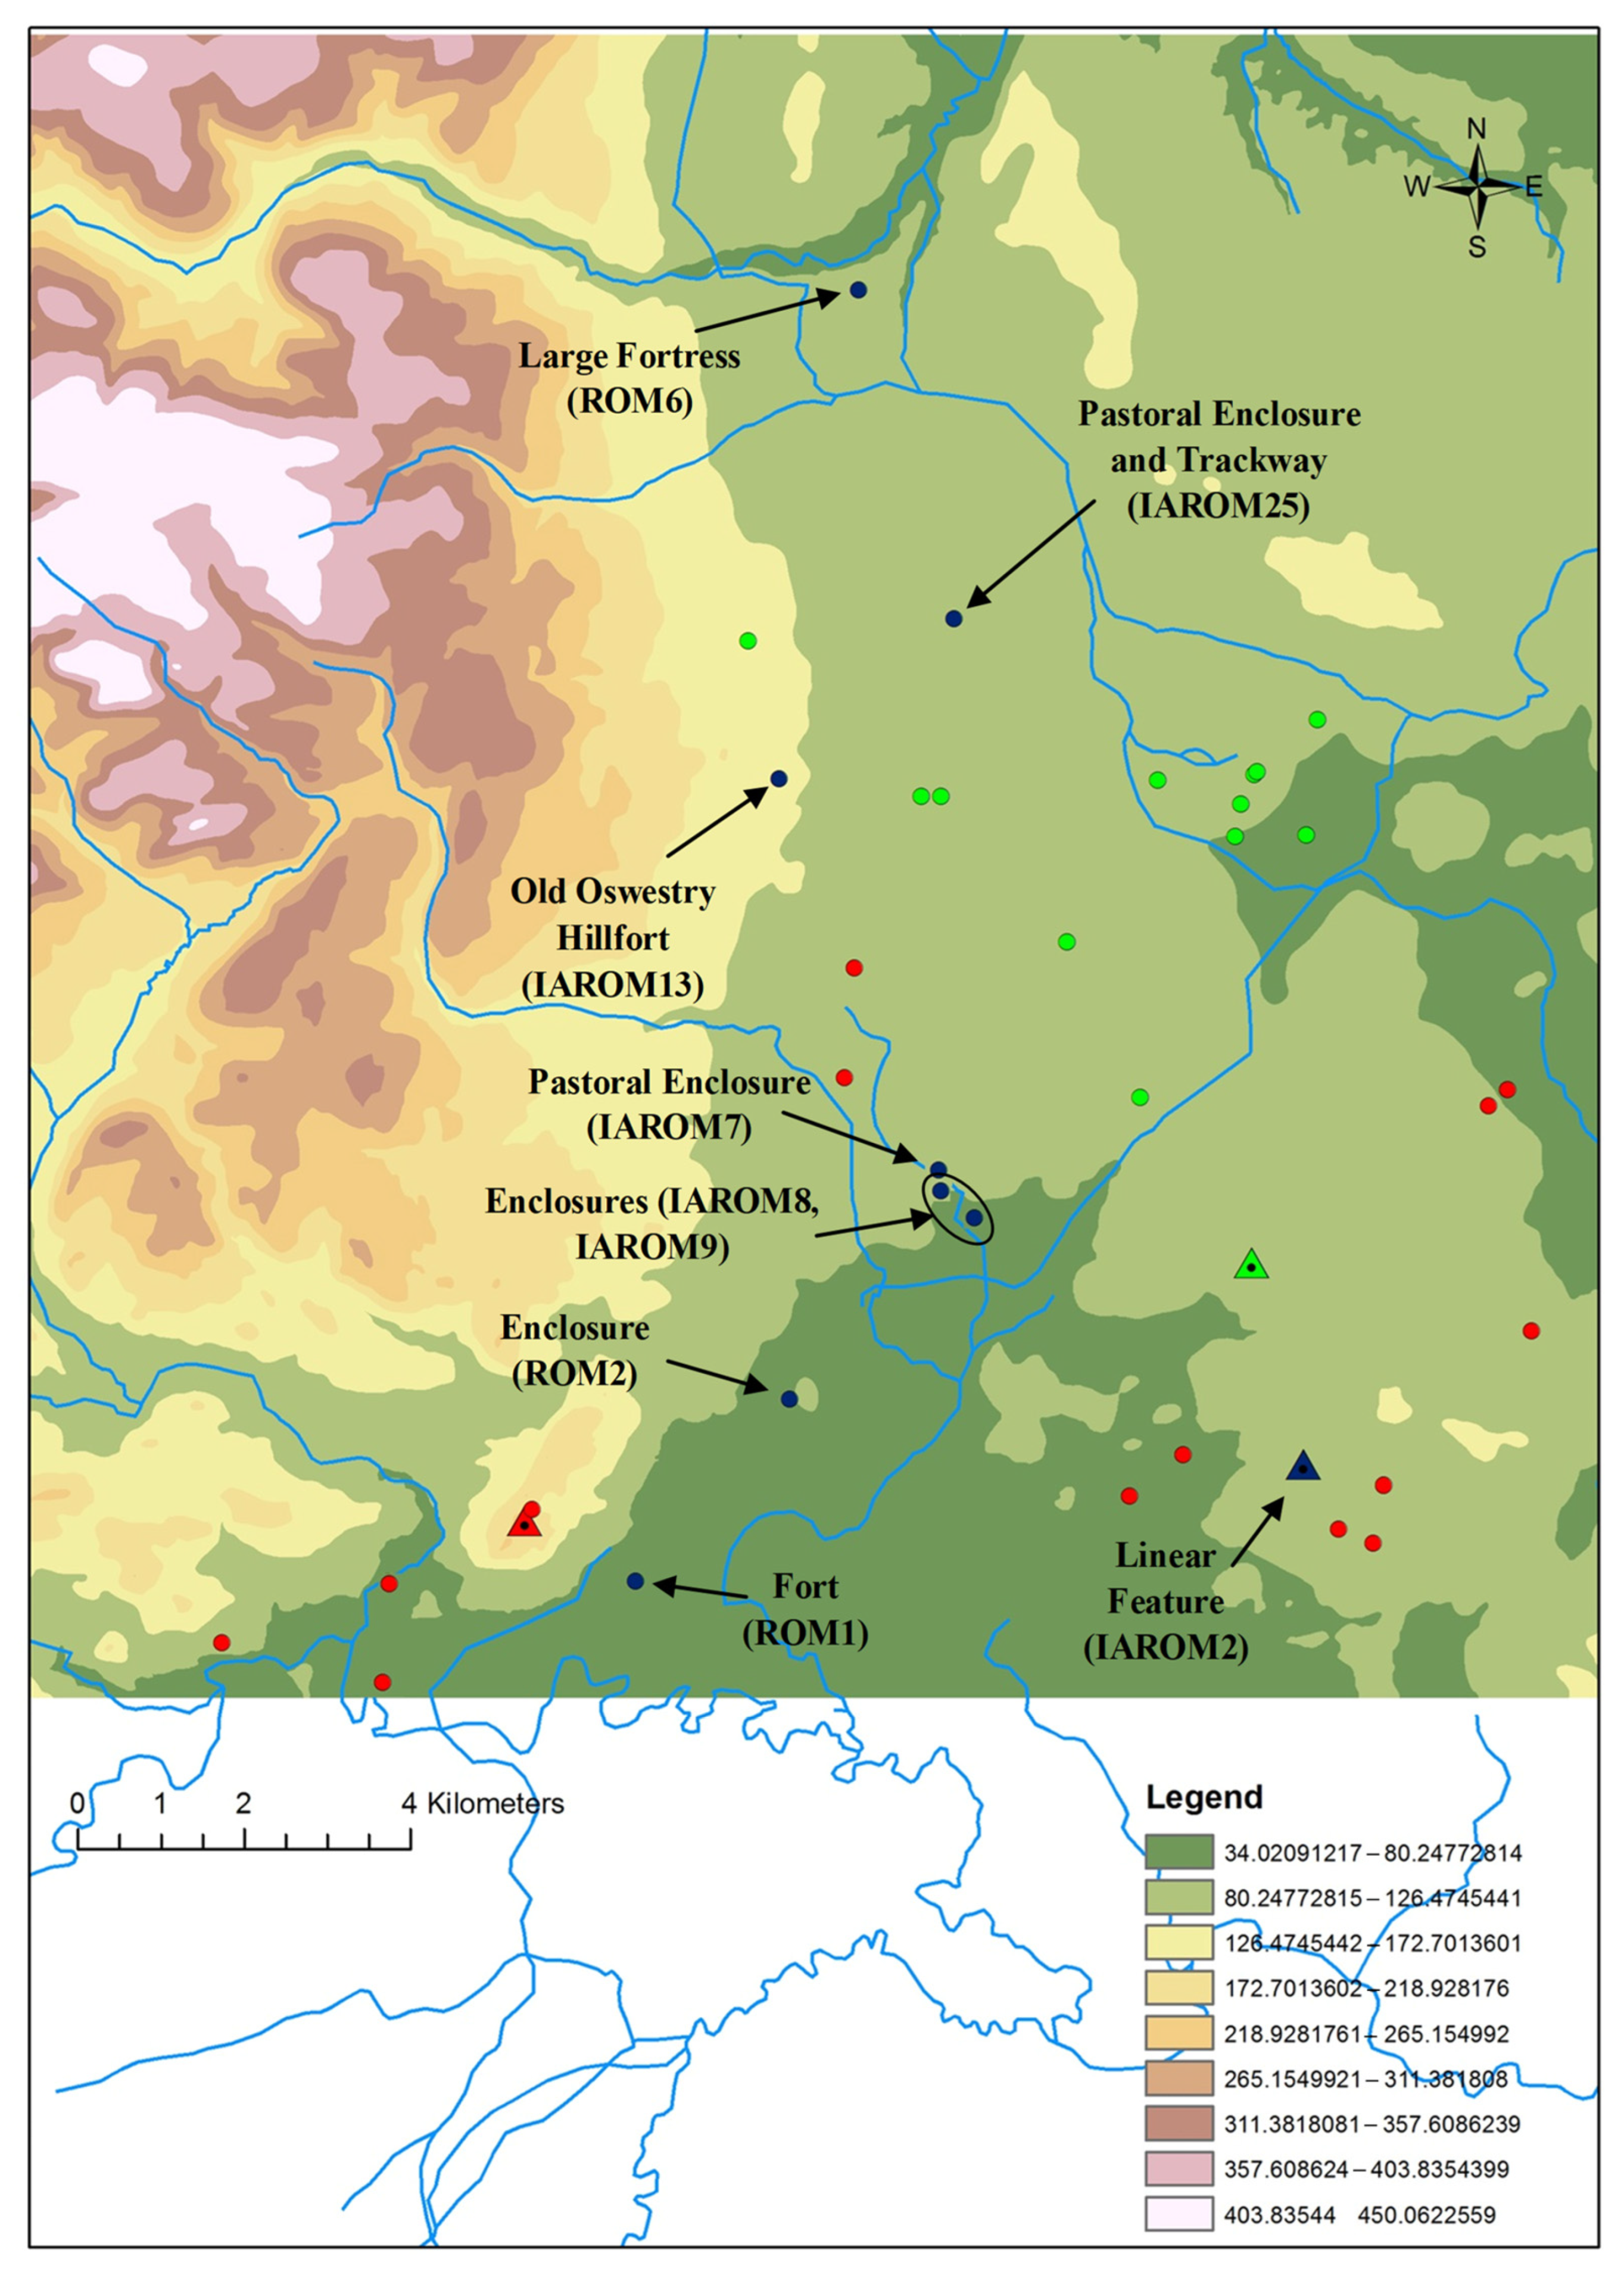
| IAROM7 | 66,648 | SJ 3141 2633 | Cropmarks of a trapezoidal enclosure. |
| IAROM8 | 66,657 | SJ 3184 2571 | Cropmark of an enclosure with a possible hut circle. |
| IAROM9 | 66,651 | SJ 3146 2608 | Cropmarks of single- ditched rectangular enclosures. |
| IAROM10 | 66,604 | SJ 3523 2519 | Cropmarks of a sub- rectangular, single- ditched enclosure. |
| IAQOM11 | 1,049,980 | SJ 367 218 | Cropmarks of a broad-ditched, rectangular enclosure. |
| IAROM12 | 1,049,994 | SJ 368 225 | Cropmark of a D-shaped enclosure. |
| IAROM13 | 66,112 | SJ 29560 31026 | Old Oswestry Hillfort. |
| IAROM14 | 66,592 | SJ 3807 2710 | Cropmarks of a substantial rectangular/square enclosure. |
| IAROM15 | 1,049,796 | SJ 3440 2292 | An oval enclosure with a south-east facing entrance. |
| IAROM16 | 1,443,556 | SJ 383 273 | Earthwork of a small, enclosed settlement. |
| IAROM17 | 66,865 | SJ 3512 3073 | Cropmarks of a rectangular pastoral enclosure. |
| IAROM18 | 1,050,213 | SJ 341 310 | A broad-ditched, sub-rectangular enclosure. |
| IAROM19 | 66,622 | SJ 3304 2906 | Cropmarks of a double- ditched pastoral enclosure. |
| IAROM20 | 66,859 | SJ 353 311 | Cropmarks of a pastoral enclosure and field system. |
| IAROM21 | 66,862 | SJ 3528 3106 | Cropmarks of enclosures. |
| IAROM22 | 66,880 | SJ 3589 3035 | Cropmarks of a pastoral enclosure and field system. |
| IAROM23 | 66,913 | SJ 3124 3080 | Cropmarks of a sub-rectangular enclosure. |
| IAROM24 | 66,916 | SJ 3146 3080 | Cropmarks of a double- ditched oval pastoral enclosure. |
| IAROM25 | 66,931 | SJ 3166 3300 | Cropmarks of a pastoral enclosure and trackway. |
| IAROM26 | 66,868 | SJ 3604 3174 | A small, enclosed settlement. |
| ROM1 | 66,019 | SJ 2780 2135 | Alleged Roman fort showing as cropmarks. |
| ROM2 | 66,054 | SJ 2967 2356 | Linear cropmarks. |
| ROM3 | 66,654 | SJ 3034 2742 | Cropmark of a rectangular pastoral enclosure. |
| ROM4 | 66,682 | SJ 3861 2438 | Cropmarks of a possible Roman villa. |
| ROM5 | 66,134 | SJ 2919 3266 | Cropmarks of a single- ditched rectangular enclosure. |
| ROM6 | 66,831 | SJ 305 369 | Rhyn Park Roman fortress. |
| ROM7 | 66,852 | SJ 3505 3033 | Cropmark of a Roman temporary camp. |
| ROM8 | 275,951 | SJ 22831 20635 | Cropmark. |
| ROM9 | 140,020 | SJ 24765 20175 | Settlement. |
| ROM10 | 306,986 | SJ 24876 21348 | Cropmark of a fort. |
| ROM11 | 307,004 | SJ 2656 2221 | Copper mine. |
Appendix B. Network Indicators of the EVNM
| Site | Betweenness Centrality | Degree | Modularity Class |
| IAROM1 | 0.0 | 3 | 0 |
| IAROM3 | 0.0 | 4 | 0 |
| IAROM4 | 145.0 | 27 | 0 |
| IAROM5 | 5.6 | 6 | 0 |
| IAROM11 | 0.0 | 4 | 0 |
| IAROM12 | 42.0 | 9 | 0 |
| IAROM14 | 5.7 | 4 | 0 |
| IAROM15 | 0.8 | 4 | 0 |
| IAROM16 | 0.9 | 3 | 0 |
| ROM2 | 2.5 | 4 | 0 |
| ROM3 | 0.2 | 3 | 0 |
| ROM4 | 5.7 | 4 | 0 |
| ROM11 | 143.9 | 26 | 0 |
| ROM1 | 2.4 | 4 | 0 |
| IAROM2 | 88.8 | 14 | 1 |
| IAROM7 | 0.3 | 6 | 1 |
| IAROM8 | 3.8 | 7 | 1 |
| IAROM9 | 0.3 | 6 | 1 |
| IAROM13 | 17.8 | 10 | 1 |
| IAROM25 | 2.9 | 6 | 1 |
| ROM6 | 0.1 | 3 | 1 |
| ROM8 | 2.3 | 2 | 1 |
| ROM9 | 37.5 | 3 | 1 |
| ROM10 | 0.0 | 1 | 1 |
| IAROM6 | 2.9 | 8 | 2 |
| IAROM10 | 38.9 | 18 | 2 |
| IAROM17 | 2.1 | 11 | 2 |
| IAROM18 | 1.9 | 9 | 2 |
| IAROM19 | 6.3 | 12 | 2 |
| IAROM20 | 6.7 | 14 | 2 |
| IAROM21 | 6.7 | 14 | 2 |
| IAROM22 | 7.2 | 15 | 2 |
| IAROM23 | 9.7 | 12 | 2 |
| IAROM24 | 3.6 | 9 | 2 |
| IAROM26 | 25.7 | 13 | 2 |
| ROM5 | 20.6 | 12 | 2 |
| ROM7 | 2.1 | 12 | 2 |
| 1 | Map available at https://www.ordnancesurvey.co.uk/opendatadownload/products.html (accessed on 2 March 2025). |
References
- White, R.H.; Gaffney, C.; Gaffney, V.L. Wroxeter: The Cornovii, and the Urban Process; Final Report on the Wroxeter Hinterland Project 1994–1997; Volume 2: Characterising the City; Archaeopress: Oxford, UK, 2013. [Google Scholar]
- Gaffney, C.F.; Gater, J.A.; Linford, P.; Gaffney, V.L.; White, R. Large-scale systematic fluxgate Gradiometry at the Roman city of wroxeter. Archaeol. Prospect. 2000, 7, 81–99. [Google Scholar]
- Gaffney, V.L.; White, R.H.; Goodchild, H. Wroxeter, the Cornovii and the Urban Process; Final Report on the Wroxeter Hinterland Project 1994–1997. Volume 1: Researching the Hinterland; Journal of Roman Archaeology Supplementary Series 68; Cambridge University Press: Portsmouth, RI, USA, 2007. [Google Scholar]
- Buteux, S.; Gaffney, S.; White, R.; van Leusen, M. Wroxeter hinterland project and geophysical survey at wroxeter. Archaeol. Prospect. 2000, 7, 69–80. [Google Scholar]
- White, R.; Wigley, A. Shropshire in the Roman period. In Clash of Cultures? The Romano-British Period in the West Midlands; White, R., Hodder, M., Eds.; Oxbow Books: Oxford, UK, 2018; pp. 115–135. [Google Scholar]
- Jones, E.E. Using Viewshed Analysis to Explore Settlement Choice: A Case Study of the Onondaga Iroquois. Am. Antiq. 2006, 71, 523–538. [Google Scholar]
- Lock, G. Using Computers in Archaeology; Routledge: London, UK, 2003. [Google Scholar]
- Euler, L. Solutio Problematis ad Geometriam Situs Pertinentis. Comment. Acad. Sci. Imp. Petropolitanae 1736, 8, 128–140. [Google Scholar]
- Evans, S.; Gould, P. Settlement Models in Archaeology. J. Anthropol. Archaeol. 1982, 1, 275–304. [Google Scholar] [CrossRef]
- Grant, J.; Gorin, S.; Fleming, N. The Archaeology Coursebook. An Introduction to Themes, Sites, Methods and Skills, 3rd ed.; Routledge: New York, NY, USA, 2008. [Google Scholar]
- Nakoinz, O. Models of Centrality. J. Anc. Stud. 2012, 3, 217–223. [Google Scholar]
- Mills, B.J.; Roberts, J.M.; Clark, J.J.; Haas, W.R.; Huntley, D.; Peeples, M.A.; Borck, L.; Ryan, S.C.; Trowbridge, M.; Breiger, R.L. The Dynamic of Social Networks in the Late Prehispanic US Southwest. In Network Analysis in Archaeology; Knappett, C., Ed.; Oxford University Press: Oxford, UK, 2013; pp. 181–202. [Google Scholar]
- Rivers, R.; Knappett, C.; Evans, T. What makes a site important? Centrality, gateways and gravity. In Network Analysis in Archaeology: New Approaches to Regional Interaction; Knappett, C., Ed.; Oxford University Press: Oxford, UK, 2013; pp. 125–150. [Google Scholar]
- Cuckovic, Z. Visibility Networks. In Oxford Handbook of Archaeological Network Research; Brughmans, T., Mills, B.J., Munson, J., Reeples, M.A., Eds.; Oxford University Press: Oxford, UK, 2024; pp. 230–247. [Google Scholar]
- Swanson, S. Documenting Prehistoric Communication Networks: A Case Study in the Paquimé Polity. Am. Antiq. 2003, 68, 753–767. [Google Scholar]
- Bitria, C.R. A multi-technique GIS visibility analysis for studying visual control of an Iron Age landscape. Internet Archaeol. 2008, 23. [Google Scholar] [CrossRef]
- De Montis, A.; Caschili, S. Nuraghes and landscape planning: Coupling viewshed with complex network analysis. Landsc. Urban Plan. 2012, 105, 315–324. [Google Scholar]
- Shemming, J.; Briggs, K. Anglo-Saxon Communication Networks. 2014. Available online: http://keithbriggs.info/AS_networks.html (accessed on 14 August 2024).
- Galmés-Alba, A.; Calvo-Trias, M. Connecting Architectures across the Landscape: A Visibility and Network Analysis in the Island of Mallorca during the Late Bronze Age and Early Iron Age. Camb. Archaeol. J. 2022, 32, 467–487. [Google Scholar] [CrossRef]
- Brughmans, T.; Mills, B.J.; Munson, J.; Peeples, M.A. The Oxford Handbook of Archaeological Network Research; Oxford University Press: Oxford, UK, 2023. [Google Scholar]
- Fábrega-Álvarez, P.; Parcero-Oubiña, C. Now you see me. An assessment of the visual recognition and control of individuals in archaeological landscapes. J. Archaeol. Sci. 2019, 104, 56–74. [Google Scholar] [CrossRef]
- Brughmans, T.; Keay, S.; Earl, G. Introducing exponential random graph models for visibility networks. J. Archaeol. Sci. 2014, 49, 442–454. [Google Scholar] [CrossRef]
- Ogburn, D.E. Assessing the level of visibility of cultural objects in past landscapes. J. Archaeol. Sci. 2006, 33, 405–413. [Google Scholar] [CrossRef]
- Conolly, J. Geographical Information Systems and Landscape Archaeology. In Handbook of Landscape Archaeology; David, B., Thomas, J., Eds.; Left Coast Press: Walnut Creek, CA, USA, 2008; pp. 583–595. [Google Scholar]
- Wheatley, D. Cumulative viewshed analysis: A GIS-based method for investigating intervisibility, and its archaeological application. In Archaeology and Geographical Information Systems; Lock, G., Stancic, Z., Eds.; Taylor and Francis: London, UK, 1995; pp. 171–186. [Google Scholar]
- Lake, M.W.; Woodman, P.E.; Mithen, S.J. Tailoring GIS Software for Archaeological Applications: An Example Concerning Viewshed Analysis. J. Archaeol. Sci. 1998, 25, 27–38. [Google Scholar]
- Brown, I. Discovering a Welsh Landscape: Archaeology in the Clwydian Range; Windgather Press: Macclesfield, UK, 2004. [Google Scholar]
- Jackson, M. Social and Economic Networks; Princeton University Press: Princeton, NJ, USA, 2008. [Google Scholar]
- Agarwal, S. Networks in Nature: Dynamics, Evolution, and Modularity. Doctoral Thesis, University of Oxford, Oxford University Research Archive ORA, Oxford, UK, 2012. [Google Scholar]
- Bergamini, E.; Crescenzi, P.; D’angelo, G.; Meyerhenke, H.; Severini, L.; Velaj, Y. Improving the Betweenness Centrality of a Node by Adding Links. J. Exp. Algorithmics 2018, 23, 1–32. [Google Scholar]
- Jacob, R.; Harikrishnan, K.P.; Misra, R.; Ambika, G. Measure for degree heterogeneity in complex networks and its application to recurrence network analysis. R. Soc. Open Sci. 2017, 4, 160757. [Google Scholar] [PubMed]
- Currie, A.; Killin, A. From things to thinking: Cognitive archaeology. Mind Lang. 2019, 34, 263–279. [Google Scholar] [CrossRef]
- Coolidge, F.L.; Wynn, T. An Introduction to Cognitive Archaeology. Curr. Dir. Psychol. Sci. 2016, 25, 386–392. [Google Scholar] [CrossRef]
- Barcelo, J.A.; Briz, I.; Vila, A.; Van Leusen, M. (Eds.) Viewshed and Cost Surface Analysis using GIS (Cartographic modelling in a cell-based GIS II). In New Technologies for Old Times-CAA98. Computer Applications and Quantitative Methods in Archaeology, Proceedings of the 26th Conference, Barcelona, Spain, 25–28 March 1998; BAR International Series S; Archaeopress: Oxford, UK, 1999; Volume 757, pp. 215–223. [Google Scholar]
- Renfrew, C.; Bahn, P. Archaeology: Theories, Methods and Practice; Thames and Hudson: London, UK, 2000. [Google Scholar]
- Gaffney, V.; Ostir, K.; Podobnikar, T.; Stancic, Z. Spatial analyses, field survey, territories and mental maps on the Island of Braô. Archeol. Calc. 1996, 7, 27–41. [Google Scholar]
Disclaimer/Publisher’s Note: The statements, opinions and data contained in all publications are solely those of the individual author(s) and contributor(s) and not of MDPI and/or the editor(s). MDPI and/or the editor(s) disclaim responsibility for any injury to people or property resulting from any ideas, methods, instructions or products referred to in the content. |
© 2025 by the author. Licensee MDPI, Basel, Switzerland. This article is an open access article distributed under the terms and conditions of the Creative Commons Attribution (CC BY) license (https://creativecommons.org/licenses/by/4.0/).
Share and Cite
May, D.E. Exploring the Rural Landscape of the Marches of the Welsh Borders in Roman Times Through Intervisibility Analysis. Land 2025, 14, 728. https://doi.org/10.3390/land14040728
May DE. Exploring the Rural Landscape of the Marches of the Welsh Borders in Roman Times Through Intervisibility Analysis. Land. 2025; 14(4):728. https://doi.org/10.3390/land14040728
Chicago/Turabian StyleMay, Daniel E. 2025. "Exploring the Rural Landscape of the Marches of the Welsh Borders in Roman Times Through Intervisibility Analysis" Land 14, no. 4: 728. https://doi.org/10.3390/land14040728
APA StyleMay, D. E. (2025). Exploring the Rural Landscape of the Marches of the Welsh Borders in Roman Times Through Intervisibility Analysis. Land, 14(4), 728. https://doi.org/10.3390/land14040728