Figure 1.
Field experiment site photos.
Figure 1.
Field experiment site photos.
Figure 2.
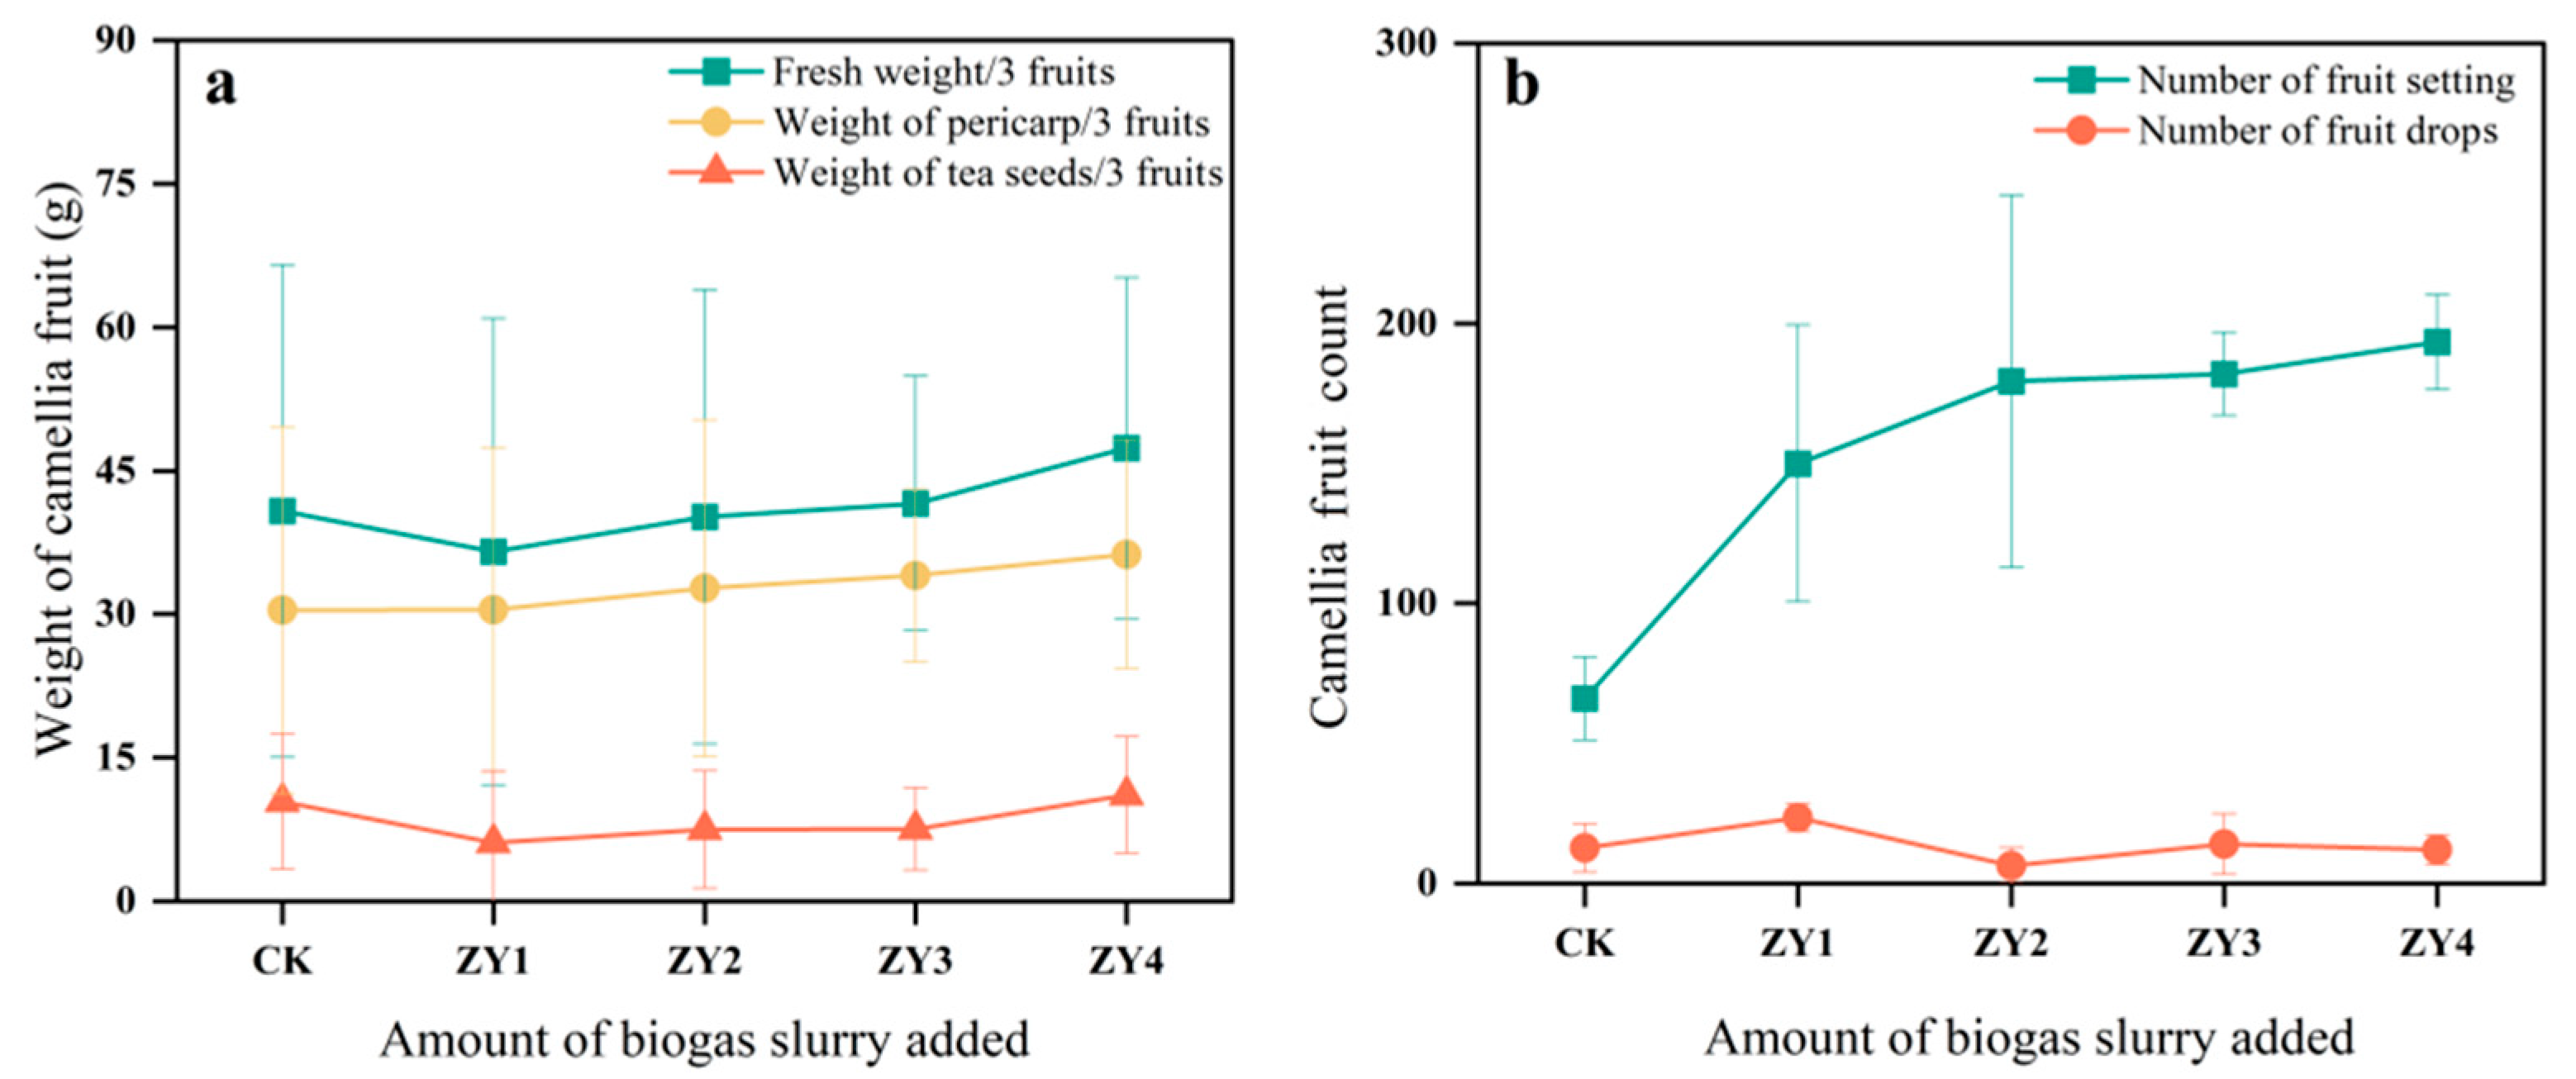
The effects of different biogas slurry application rates on the fruit of CO at harvest. (a) Difference in the fruit yield of CO among different treatment groups, (b) Fruiting of CO in different treatment groups during the harvest period.
Figure 2.
The effects of different biogas slurry application rates on the fruit of CO at harvest. (a) Difference in the fruit yield of CO among different treatment groups, (b) Fruiting of CO in different treatment groups during the harvest period.
Figure 3.
Community composition of phosphorus-metabolizing microbial phyla. Soil phosphate-solubilizing microflora were dominated by Actinobacteria, Proteobacteria, Chloroflexi, and Acidobacteria, with no significant differences between these four microbial groups (p < 0.05). Gemmatimonadetes, Candidatus_ Rokubacteria, and Candidatus_Eremiobacteraeota exhibited better variability.
Figure 4.
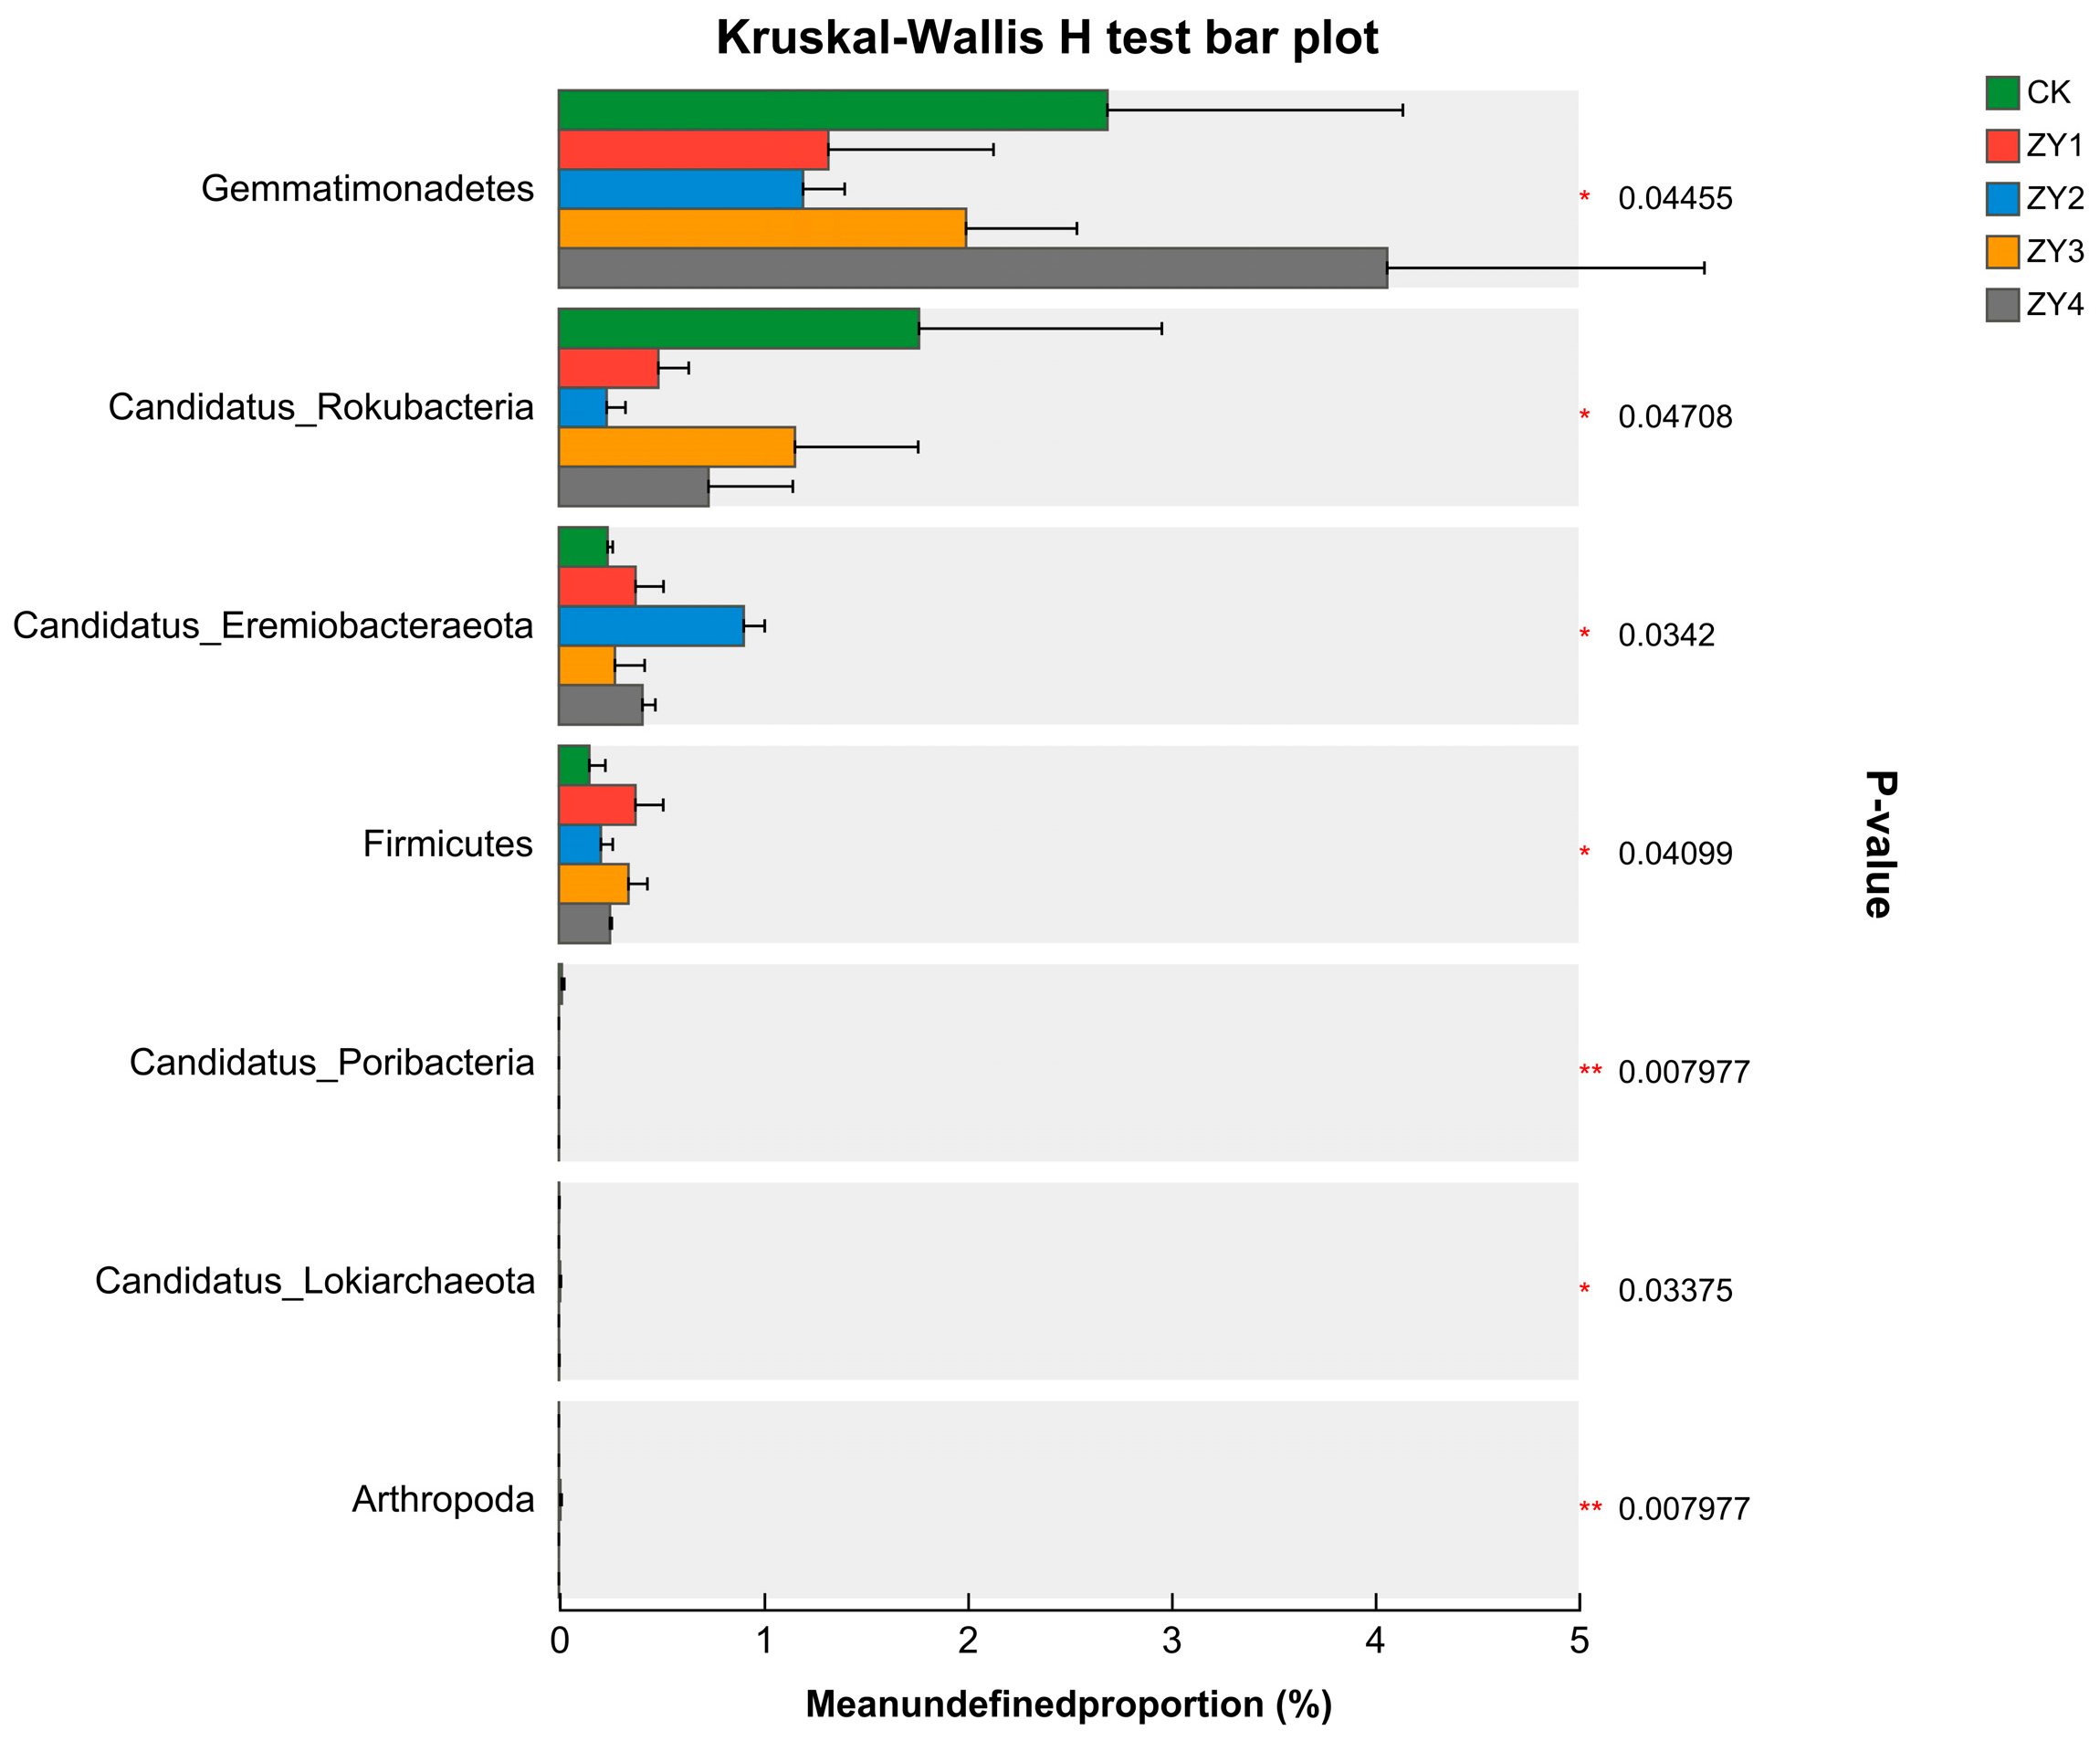
Inter-group variability test for microbial phylum-level communities (* p < 0.05, ** p < 0.01). The abundance of Gemmatimonadetes decreased at low biogas slurry returns and increased at high biogas slurry returns. The abundance of CandidatusRokubacteria was lower than that of the blank, and the abundance of CandidatusEremiobacteraeota was higher than that of the blank in the biogas slurry treatment groups. However, the linear increase in the amount of biogas slurry returned to the field did not exhibit a uniform pattern.
Figure 5.
Community structure of phosphorus-metabolizing microorganisms at the species level. Chloroflexi_bacterium, Acidobacteria_bacterium, Actinomycetia_bacterium, Streptosporangiaceae_bacterium, Hyphomicrobiales_bacterium, Alphaproteobacteria_bacterium, Terrrabacteria_group_bacterium_ANGP1, Candidatus_Dormibacteraeota_bacterium, Actinobacteria_bacterium bacterium, Gemmatimonadetes_bacterium were the dominant species.
Figure 6.
Distribution of phosphorus metabolism functional genes in each group.
Figure 6.
Distribution of phosphorus metabolism functional genes in each group.
Figure 7.
Functional genes with significant differences among the treatment groups (* p < 0.05, ** p < 0.01, *** p < 0.001). (a) Genes with significant differences and abundance ranking in the top 7–11, (b) Genes with significant differences and abundance ranking in the top 1–6. phnP, phnM, pstB, and appA showed highly significant group differences, and phoR, ppk1, glpQ, phoB, ugpC, phnJ, and phnK showed significant group differences.
Figure 8.
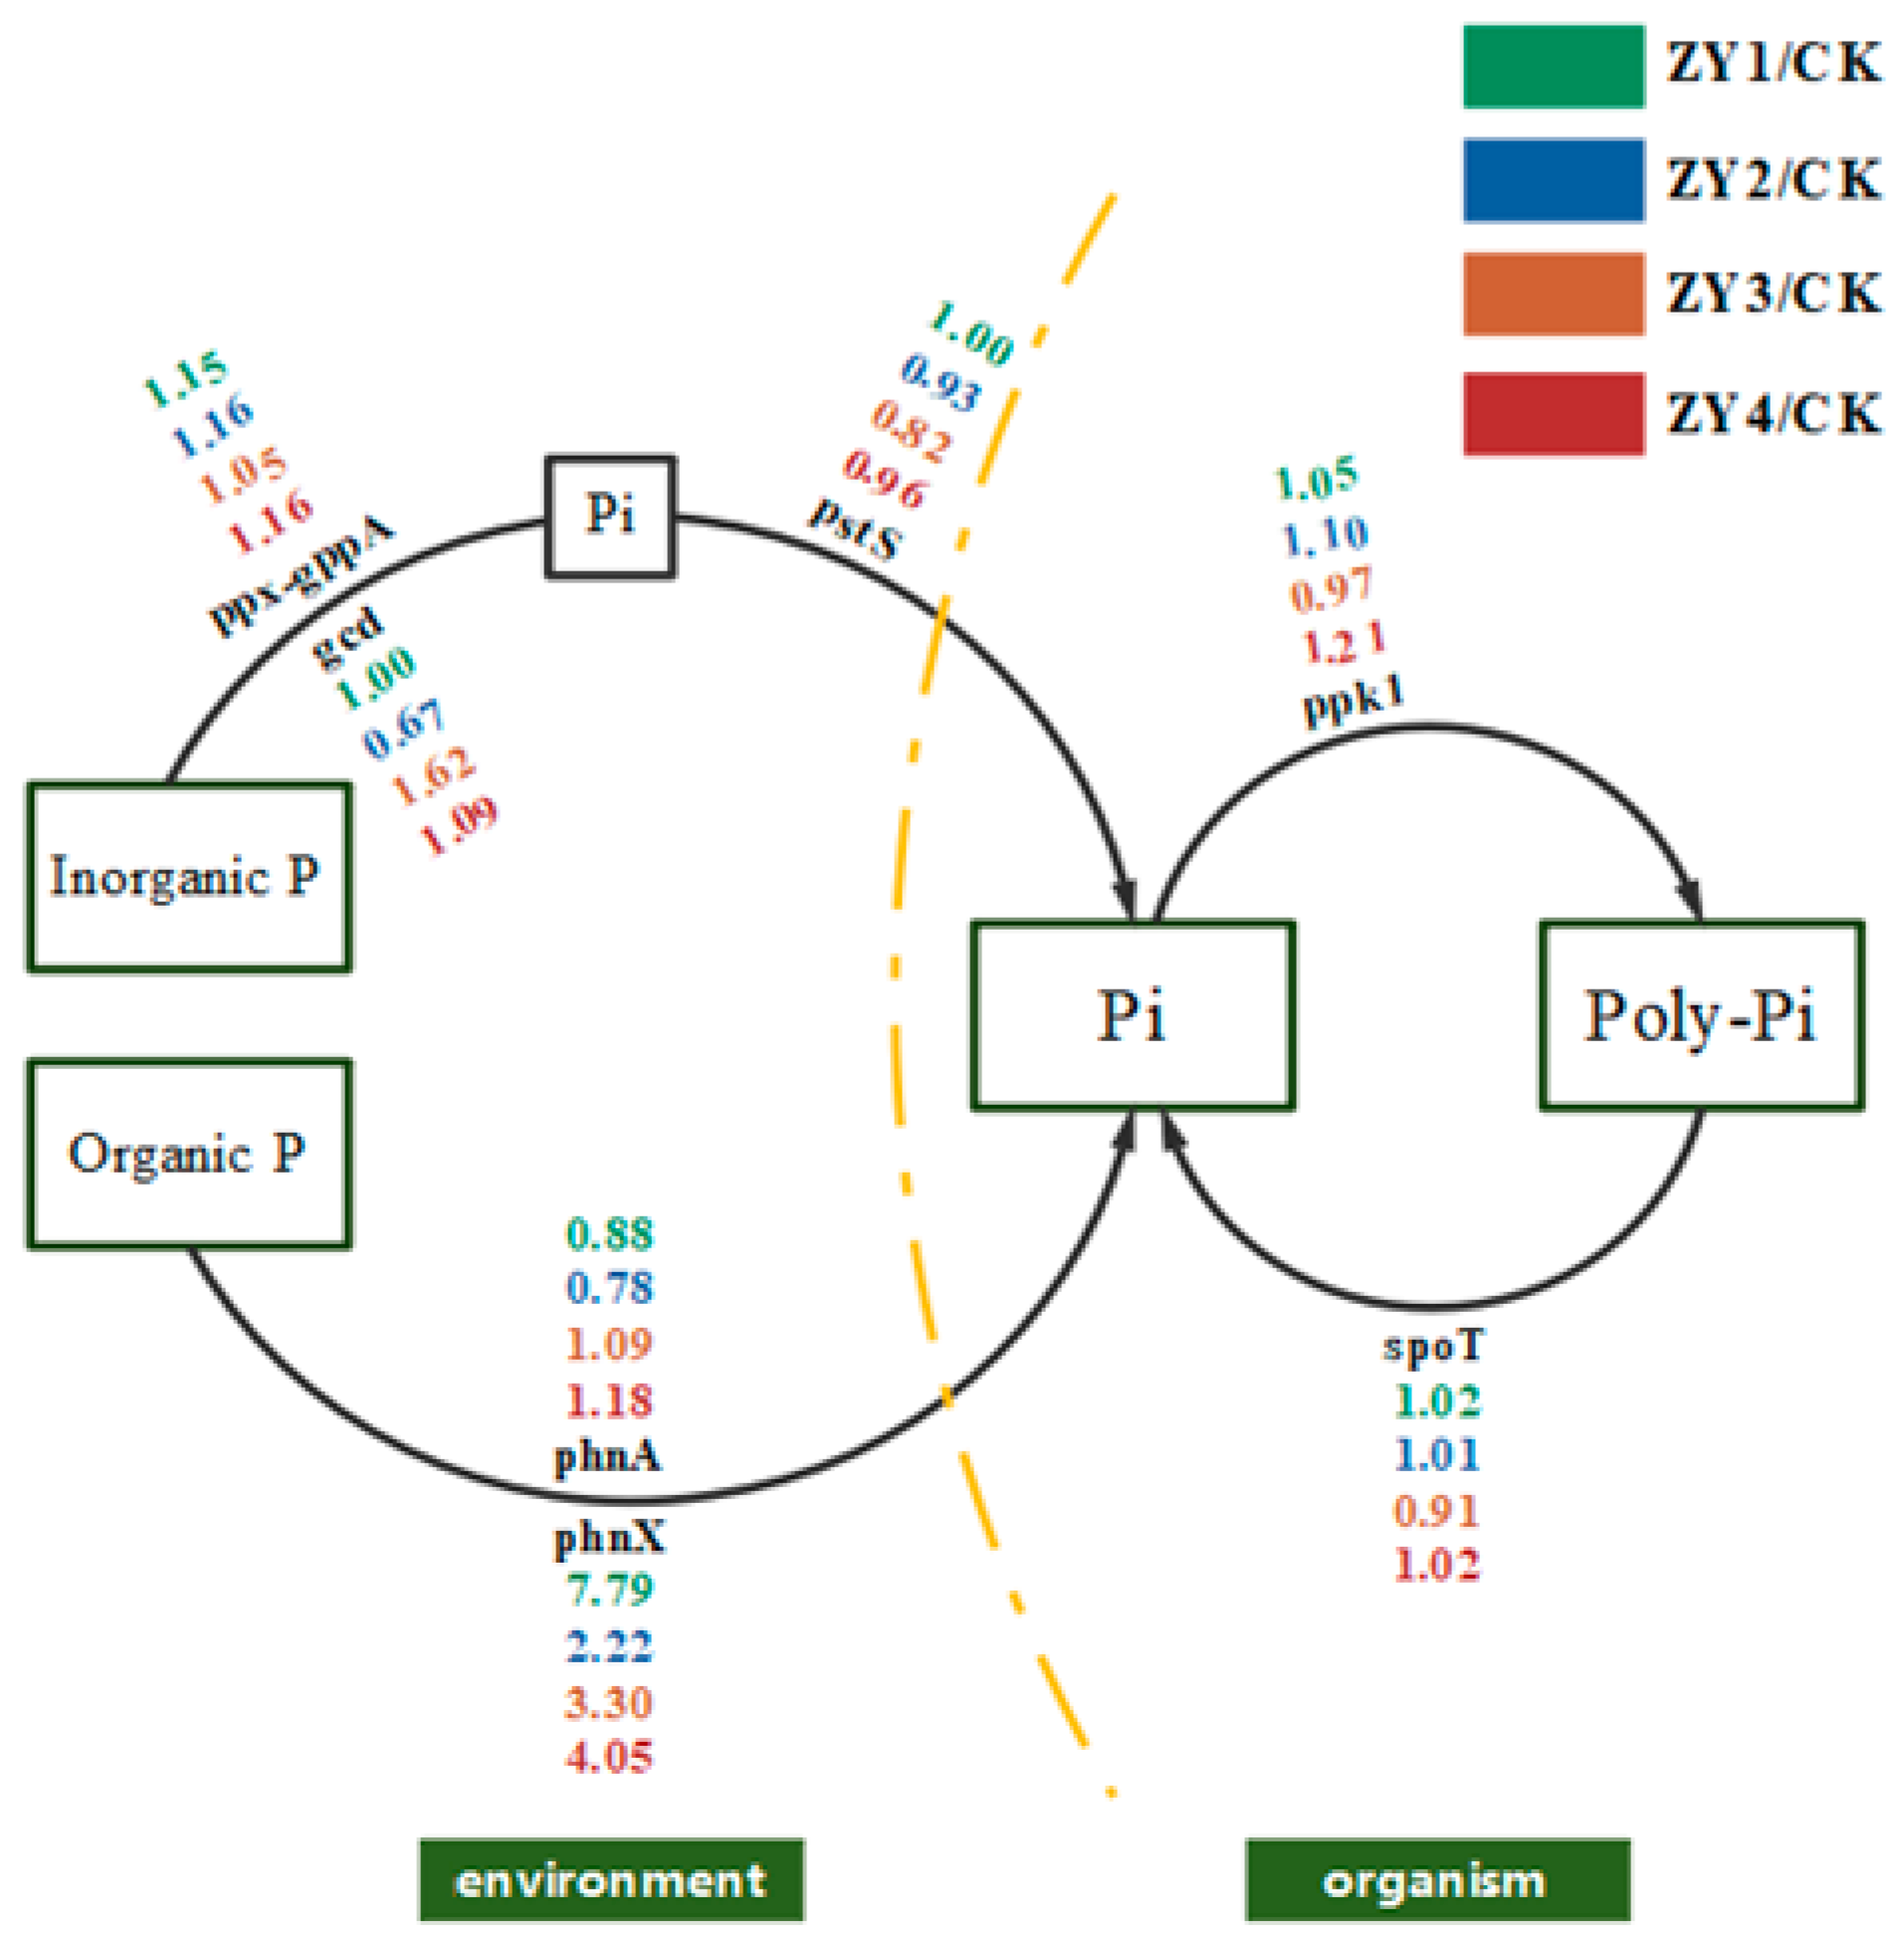
Schematic diagram of phosphorus cycling under the influence of soil microorganisms. Single gene abundance was compared with CK on the background of different biogas slurry application rates, and included inorganic phosphorus solubilization, organic phosphorus mineralization, phosphorus transfer, polyphosphate synthesis, and polyphosphate degradation.
Figure 9.
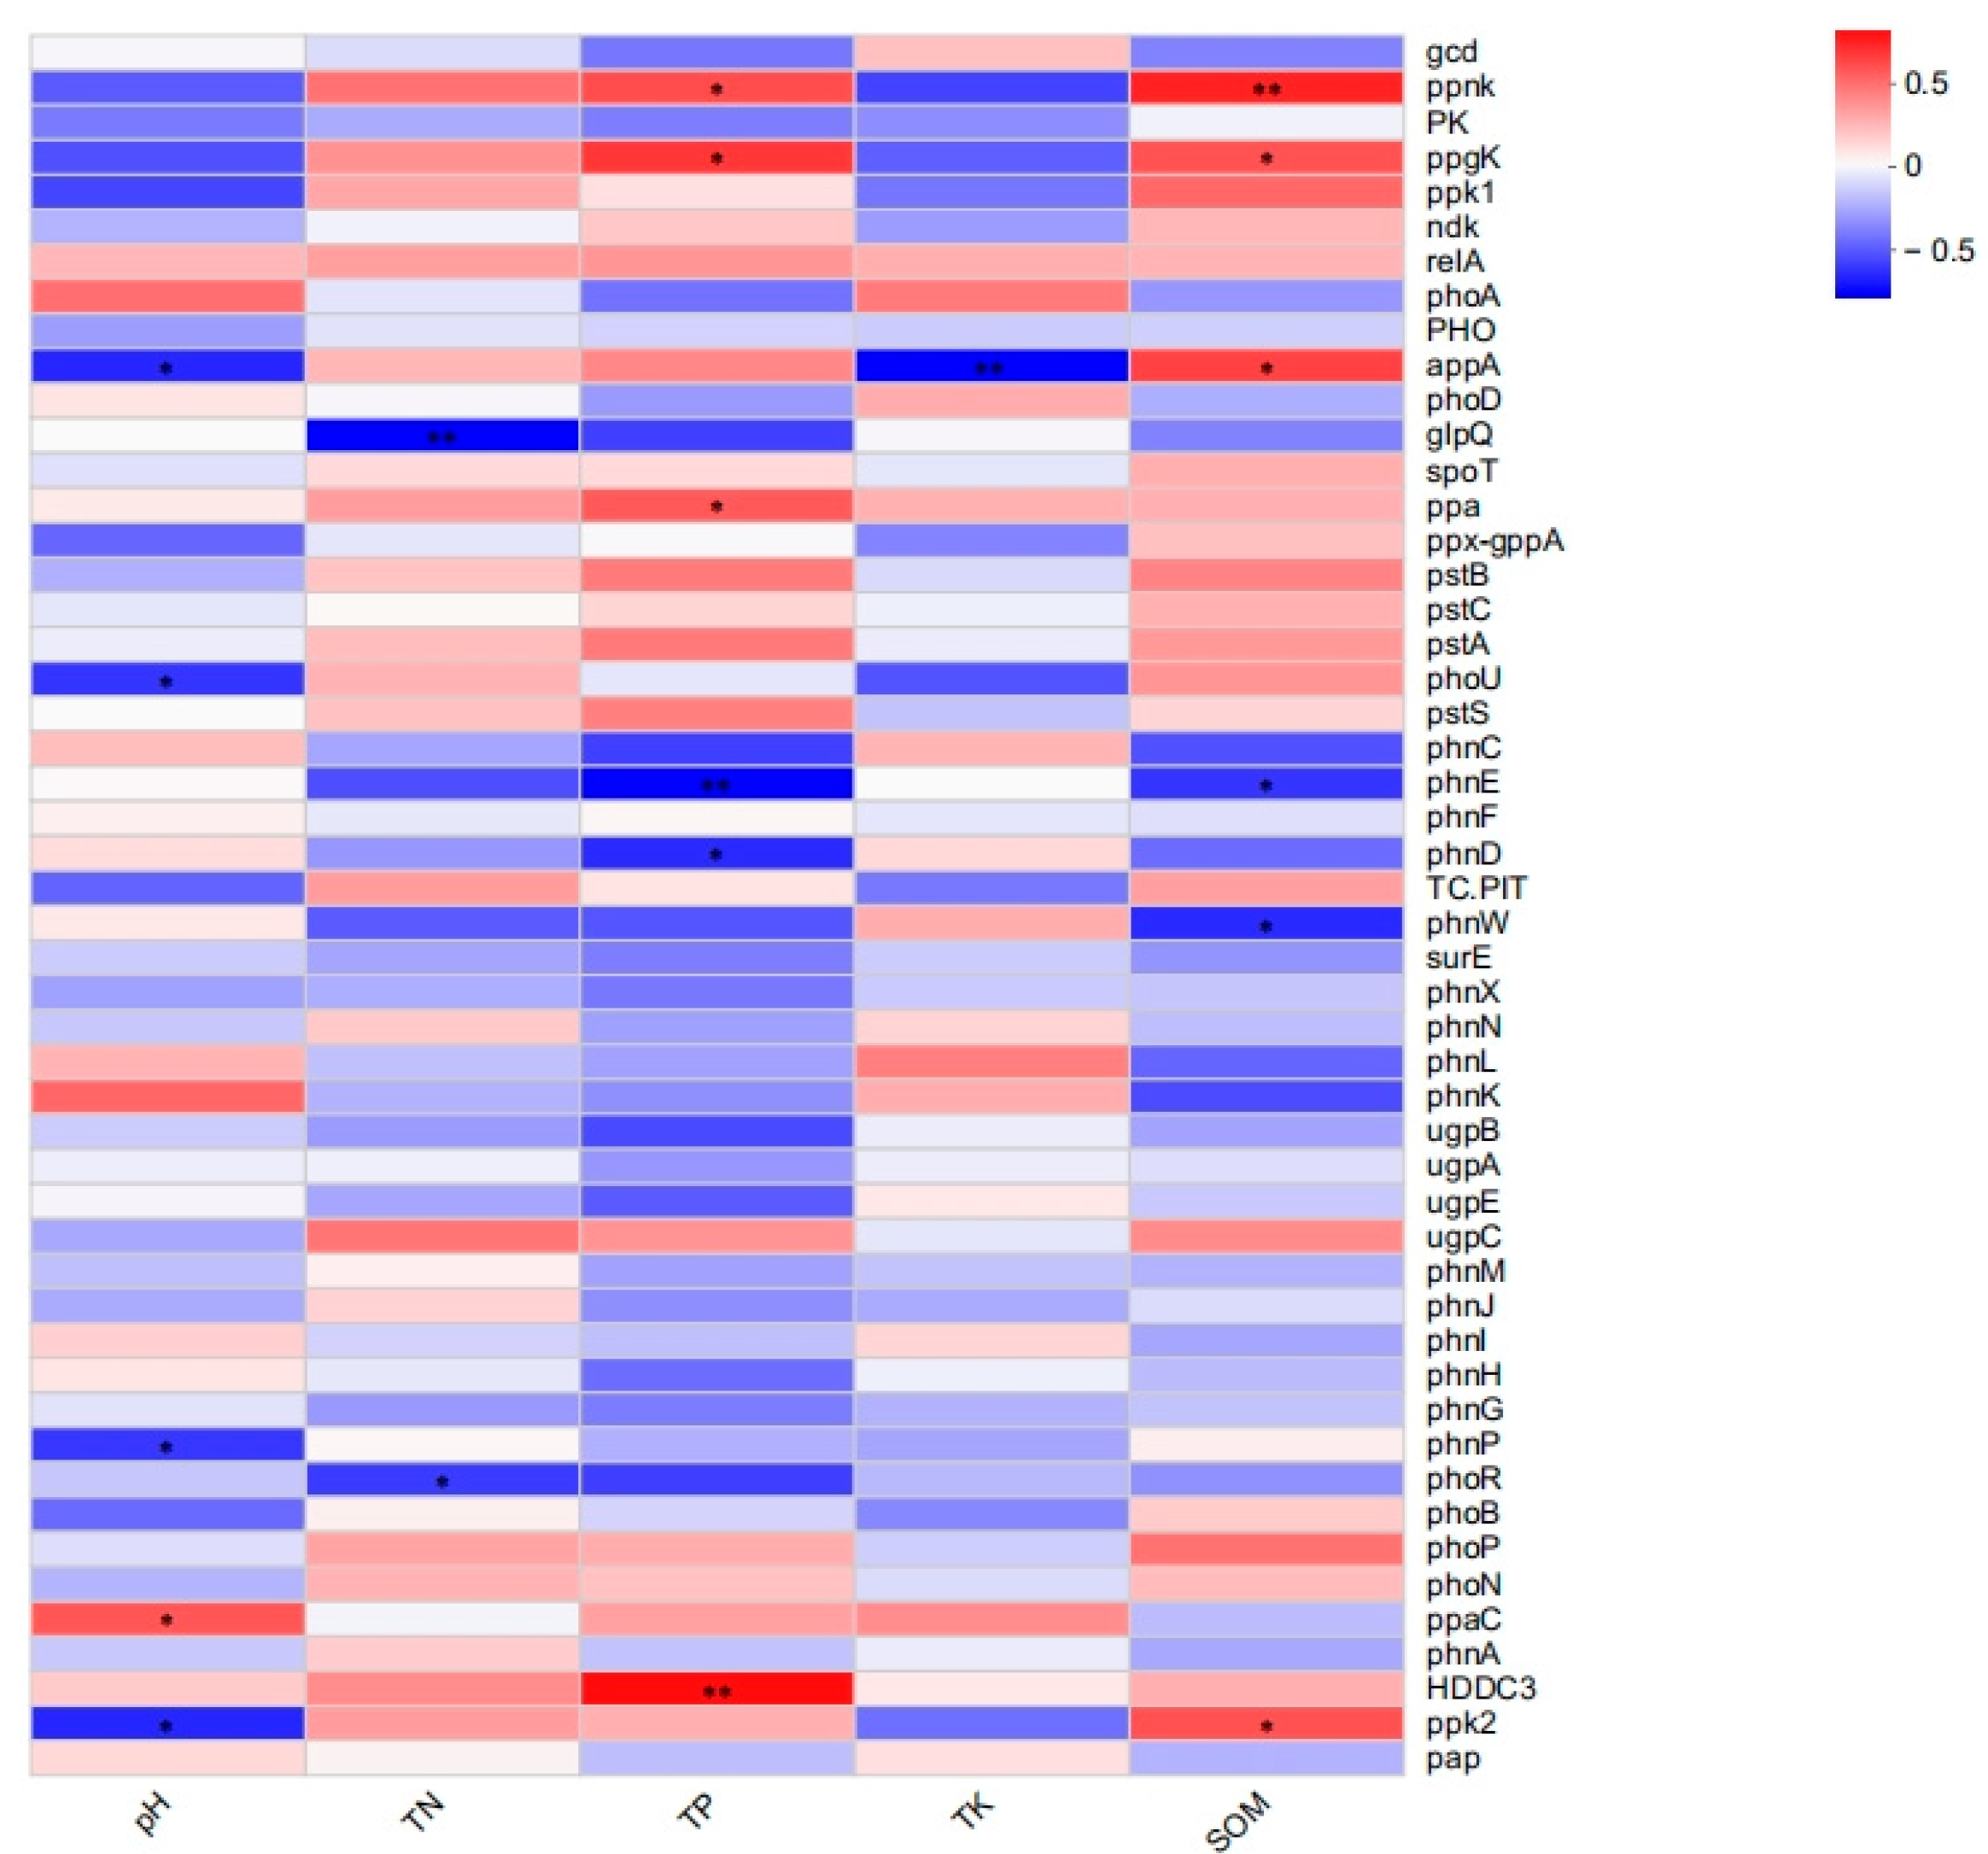
Heat map of the correlation analysis of environmental factors and phosphorus metabolism functional genes (* p < 0.05, ** p < 0.01). The Spearman correlation coefficient test revealed that genes with high relative abundance, such as pstS, spoT, phoR, and gcd, were not significantly correlated, but some genes with low relative abundance in the soil reflected significant relationships with environmental factors.
Table 1.
Experimental design for biogas slurry addition.
Table 1.
Experimental design for biogas slurry addition.
| Group | Replicates of the Experimental Group | Number | Field Experiment Biogas Slurry Application Rate (kg/plant) | Biogas Slurry Application Rate in the Indoor Simulation (g/500 g) |
|---|
| Blank group | 3 | CK | 0 | 0 |
| Low concentration group | 3 | ZY1 | 13 | 68.6 |
| Medium concentration group | 3 | ZY2 | 27 | 142.6 |
| Higher concentration group | 3 | ZY3 | 40 | 211.2 |
| High concentration group | 3 | ZY4 | 53 | 279.9 |
Table 2.
Phosphorus forms and contents in soil after 1 d and 30 d of simulated incubation.
Table 2.
Phosphorus forms and contents in soil after 1 d and 30 d of simulated incubation.
| Group | CK | ZY1 | ZY2 | ZY3 | ZY4 |
|---|
| Al-P (mg kg−1) | 1 d | 56.537 ± 4.46 | 62.335 ± 2.62 | 75.459 ± 3.26 | 81.821 ± 8.53 | 89.518 ± 26.14 |
| 30 d | 46.542 ± 2.40 | 52.215 ± 6.31 | 50.742 ± 4.92 | 53.207 ± 9.30 | 63.871 ± 10.25 |
| Fe-P (mg kg−1) | 1 d | 252.061 ± 9.11 | 273.120 ± 4.50 | 269.544 ± 8.02 | 282.675 ± 5.08 | 309.402 ± 9.85 |
| 30 d | 187.870 ± 8.14 | 197.948 ± 12.34 | 213.640 ± 14.37 | 223.829 ± 5.78 | 242.288 ± 7.42 |
| O-P (mg kg−1) | 1 d | 193.853 ± 6.58 | 197.207 ± 14.17 | 209.614 ± 10.68 | 208.502 ± 23.62 | 190.175 ± 17.28 |
| 30 d | 225.881 ± 20.38 | 223.786 ± 8.87 | 227.749 ± 51.47 | 215.778 ± 15.96 | 224.666 ± 6.99 |
| Ca-P (mg kg−1) | 1 d | 80.026 ± 21.17 | 65.676 ± 9.60 | 78.419 ± 12.69 | 69.958 ± 16.27 | 68.529 ± 5.50 |
| 30 d | 68.581 ± 2.91 | 65.176 ± 5.20 | 81.834 ± 13.46 | 80.979 ± 26.19 | 88.246 ± 4.84 |
| Org-P (mg kg−1) | 1 d | 189.316 ± 6.29 | 134.351 ± 43.24 | 157.089 ± 49.55 | 197.565 ± 13.71 | 162.338 ± 31.40 |
| 30 d | 19.65 ± 15.17 | 27.51 ± 1.18 | 6.52 ± 0.00 | 47.57 ± 32.67 | 17.89 ± 23.97 |
| TP (mg kg−1) | 1 d | 782.297 ± 38.56 | 732.688 ± 49.40 | 790.124 ± 42.53 | 840.520 ± 47.13 | 819.962 ± 35.72 |
| 30 d | 541.977 ± 34.80 | 557.467 ± 13.57 | 576.137 ± 58.03 | 605.509 ± 35.48 | 630.992 ± 6.04 |
Table 3.
Physicochemical indicators of soil in each treatment group (a, b, c, d, e indicate significant differences (p < 0.05) by Duncan’s test).
Table 3.
Physicochemical indicators of soil in each treatment group (a, b, c, d, e indicate significant differences (p < 0.05) by Duncan’s test).
| Treatments | CK | ZY1 | ZY2 | ZY3 | ZY4 |
|---|
| pH (H2O) | 5.81 ± 0.10 a | 4.92 ± 0.07 b | 4.53 ± 0.03 d | 4.75 ± 0.01 c | 4.36 ± 0.01 e |
| TN (g kg−1) | 1.38 ± 0.05 a | 1.39 ± 0.05 a | 1.13 ± 0.01 b | 1.13 ± 0.01 b | 1.40 ± 0.03 a |
| TP (g kg−1) | 0.61 ± 0.01 b | 0.68 ± 0.01 a | 0.56 ± 0.01 c | 0.55 ± 0.01 c | 0.70 ± 0.02 a |
| TK (g kg−1) | 14.60 ± 0.15 b | 15.24 ± 0.28 a | 14.07 ± 0.17 c | 14.41 ± 0.06 b | 15.00 ± 0.06 a |
| SOM (g kg−1) | 27.97 ± 3.16 a | 25.77 ± 2.21 b | 18.83 ± 1.08 e | 23.70 ± 1.90 d | 24.17 ± 0.55 c |
| Olsen-P (mg kg−1) | 27.38 ± 3.26 b | 15.54 ± 0.48 c | 23.27 ± 0.42 b | 16.78 ± 1.05 c | 52.24 ± 0.64 a |
| Al-P (mg kg−1) | 197.594 | 160.844 | 143.067 | 213.511 | 247.060 |
| Fe-P (mg kg−1) | 394.128 | 331.770 | 321.152 | 362.866 | 335.497 |
| Ca-P (mg kg−1) | 110.903 | 41.510 | 24.898 | 25.237 | 15.761 |
| Org-P (mg kg−1) | 103.778 | 42.106 | 90.512 | 115.099 | 151.972 |
Table 4.
Phosphorus content in different parts of CO from each treatment group.
Table 4.
Phosphorus content in different parts of CO from each treatment group.
| Treatments | Branch Phosphorus Content (mg kg−1) | Leaf Phosphorus Content
(mg kg−1) | Fruit (with Seeds) Phosphorus Content (mg kg−1) |
|---|
| CK | 1161.760 ± 144.17 | 704.625 ± 24.38 | 707.201 ± 27.55 |
| ZY1 | 1028.800 ± 107.98 | 638.697 ± 53.17 | 749.910 ± 5.09 |
| ZY2 | 1431.043 ± 101.33 | 669.567 ± 65.59 | 699.330 ± 15.64 |
| ZY3 | 915.413 ± 42.77 | 673.953 ± 15.77 | 711.750 ± 18.43 |
| ZY4 | 1110.643 ± 168.60 | 714.887 ± 66.66 | 921.567 ± 173.31 |
Table 5.
Microbial community diversity indices for each treatment group (a, b, c, indicate significant differences (p < 0.05) by Duncan’s test).
Table 5.
Microbial community diversity indices for each treatment group (a, b, c, indicate significant differences (p < 0.05) by Duncan’s test).
| Subunit | Diversity Index | Richness Estimator | Coverage |
|---|
| Shannon | Simpson | Ace | Chao |
|---|
| CK | 4.048 ± 0.32 a | 0.063 ± 0.02 c | 854.67 ± 73.16 a | 854.67 ± 73.16 a | 1 |
| ZY1 | 3.662 ± 0.10 c | 0.097 ± 0.01 a | 852 ± 73.51 a | 852 ± 73.51 a | 1 |
| ZY2 | 3.794 ± 0.07 b | 0.081 ± 0.01 b | 851.33 ± 65.77 a | 851.33 ± 65.77 a | 1 |
| ZY3 | 3.840 ± 0.54 b | 0.085 ± 0.02 b | 801.67 ± 86.01 c | 801.67 ± 86.01 b | 1 |
| ZY4 | 3.880 ± 0.14 b | 0.069 ± 0.01 c | 846 ± 21.38 b | 846 ± 21.38 a | 1 |
| CK | 4.048 ± 0.32 a | 0.063 ± 0.02 c | 854.67 ± 73.16 a | 854.67 ± 73.16 a | 1 |
| ZY1 | 3.662 ± 0.10 c | 0.097 ± 0.01 a | 852 ± 73.51 a | 852 ± 73.51 a | 1 |
Table 6.
Gene set related to soil microbial phosphorus metabolism in the experimental area.
Table 6.
Gene set related to soil microbial phosphorus metabolism in the experimental area.
| Function | Number | Gene |
|---|
| Organic P mineralization | 17 | PHO, phnX, phnW, phoA, phoD, appA, phnG, phnH, phnI, phnJ, phnL, phnM, phnN, phnO, phnP, phoN, phnA |
| Inorganic P solubilization | 3 | gcd, ppa, ppx-gppA |
| Regulatory | 4 | phoB, phoR, phoP, phoU |
| Transporters | 16 | phnC, phnD, phnE, pstA, pstB, pstC, pstS, phnK, phnF, TC.PIT, ugpA, ugpB, ugpC, ugpE, glpQ, pit |
| Polyphosphate synthesis | 2 | ppk1, ppaC |
| Polyphosphate degradation | 10 | ppk2, surE, pap, ppnK, ppgK, relA, spoT, HDDC3, ndk, PK |
| Organic P mineralization | 17 | PHO, phnX, phnW, phoA, phoD, appA, phnG, phnH, phnI, phnJ, phnL, phnM, phnN, phnO, phnP, phoN, phnA |
| Inorganic P solubilization | 3 | gcd, ppa, ppx-gppA |
| Regulatory | 4 | phoB, phoR, phoP, phoU |
Table 7.
Correlation analysis between soil phosphorus metabolism genes and biogas slurry use.
Table 7.
Correlation analysis between soil phosphorus metabolism genes and biogas slurry use.
| | | pstS | spoT | phnX | ppk1 | ppx-gppA | gcd | phnA | phoR | ppk1 |
| Treatments | coefficient | −0.173 | −0.096 | 0.066 | 0.351 | 0.202 | 0.251 | 0.281 | 0.102 | 0.351 |
| p | 0.537 | 0.735 | 0.816 | 0.199 | 0.470 | 0.367 | 0.311 | 0.717 | 0.199 |
| | | pstB | glpQ | phoB | phnP | ugpC | phnM | phnJ | appA | phnK |
| Treatments | coefficient | −0.164 | −0.092 | 0.488 | 0.430 | 0.029 | 0.380 | 0.336 | 0.223 | −0.144 |
| p | 0.559 | 0.744 | 0.065 | 0.109 | 0.918 | 0.162 | 0.220 | 0.425 | 0.608 |
Table 8.
Mantel test of the relationship between environmental factors and the overall abundance of soil phosphorus metabolism genes.
Table 8.
Mantel test of the relationship between environmental factors and the overall abundance of soil phosphorus metabolism genes.
| Soil Indicators | Phosphorus-Metabolizing Microbial Community Structure | Functional Gene Structure of Phosphorus Metabolism |
|---|
| Mantel_R | p | Mantel_R | p |
|---|
| TP | −0.034 | 0.522 | −0.029 | 0.433 |
| Olsen-P | −0.068 | 0.566 | −0.055 | 0.527 |
| Org-p | 0.161 | 0.129 | 0.069 | 0.299 |
| Al-P | 0.191 | 0.147 | −0.001 | 0.424 |
| Fe-P | −0.127 | 0.805 | −0.148 | 0.86 |
| Ca-P | −0.062 | 0.678 | −0.082 | 0.767 |
| O-P | / | / | / | / |
| pH(H2O) | −0.141 | 0.722 | −0.063 | 0.523 |
| TN | −0.058 | 0.586 | −0.042 | 0.487 |
| TK | −0.040 | 0.522 | −0.001 | 0.393 |
| Org-matter | 0.219 | 0.075 | 0.023 | 0.434 |


