Article

Effects of Biogas Slurry on Microbial Phosphorus Metabolism in Soil of Camellia oleifera Plantations

1
College of Resource and Environmental Engineering, Guizhou University, Guiyang 550025, China
2
Institute of Rural Revitalization, Guizhou University, Guiyang 550025, China
3
Guizhou ChuYang Ecological and Environmental Protection Technology Co., Ltd., Guiyang 550025, China
4
Agriculture and Rural Bureau of Yuping, Tongren 554300, China
5
Guizhou Agricultural Resources and Ecological Environment Protection Station, Guiyang 550025, China
*
Author to whom correspondence should be addressed.
Land 2025, 14(4), 718; https://doi.org/10.3390/land14040718
Submission received: 26 February 2025 / Revised: 20 March 2025 / Accepted: 24 March 2025 / Published: 27 March 2025

Abstract

:
The use of biogas slurry as an alternative to chemical fertilizers for supplying phosphorus to plants is gaining increasing attention. However, the mechanisms by which biogas slurry activates soil phosphorus and influences phosphorus-metabolizing microorganisms are not yet fully understood. This study characterized the effects of controlled biogas slurry application gradients (0, 13, 27, 40, and 53) on the soil phosphorus structure, camellia oleifera (CO) phosphorus content, microbial phosphorus metabolism functional gene abundance, and phosphorus transformation functions in CO plantation soils. Increasing the dosage of biogas slurry effectively enhanced soil phosphorus levels and significantly increased the proportions of aluminum-bound phosphorus (Al-P) and iron-bound phosphorus (Fe-P). Under simulated conditions, the contents of soil Al-P, Fe-P, and organic phosphorus significantly decreased and transformed into occluded phosphorus (O-P) and calcium-bound phosphorus (Ca-P), while under field conditions, due to spatial heterogeneity, the changes in soil phosphorus and its forms were not distinctly evident. The application of biogas slurry did not significantly alter the major phyla of phosphorus-metabolizing microorganisms in the soil, but significant changes in the abundance of different microorganisms were observed. The abundance of dominant bacterial communities such as Chloroflexi_bacterium increased, while the abundance of communities such as Actinomycetia_bacterium decreased. By influencing the expression of soil microbial functional genes related to inorganic phosphorus solubilization, organic phosphorus mineralization, phosphorus deficiency response regulation, and phosphorus transport, the solubility of inorganic phosphorus and the mineralization rate of organic phosphorus in the soil were enhanced. Additionally, it may weaken microbial phosphorus uptake by inhibiting intercellular phosphorus transport in microorganisms, thereby improving the utilization of soil phosphorus by CO.

1. Introduction

Phosphorus is an essential element for life, which constitutes many biomolecules and participates in important life activities such as photosynthesis and respiration [1]. It plays a significant role in material exchange and circulation throughout the entire biosphere. It is widely believed that phosphorus availability is optimal under near-neutral conditions [2]. In acidic environments, phosphorus strongly binds cations such as Fe3+ and Al3+, while in alkaline environments, it combines with Ca2+ to form insoluble salts, both of which hinder plant uptake. Phosphorus in acidic soil is prone to forming insoluble phosphates due to the actions of ion adsorption and coordination adsorption, which can lead to its fixation in the soil phosphorus pool or retention by microorganisms [3,4]. Therefore, most soils face the problem of a low available phosphorus content, which leads to phosphorus deficiency in crops and results in low yields [5,6,7]. The situation of a soil phosphorus deficiency and low utilization rate of phosphorus fertilizer has led to the fact that significant increases in grain production are always accompanied by substantial inputs of phosphorus fertilizer. This not only results in the wastage of limited phosphorus fertilizer resources but also inevitably leads to an increase in phosphorus concentrations in farmland runoff, which can easily cause eutrophication and other environmental problems [8,9].
Camellia Oleifera (CO) is an evergreen shrub belonging to the genus Camellia in the family Theaceae. It is rich in fatty acids and special nutrients such as squalene. In Guizhou, China, CO has been cultivated for hundreds of years. Not only are its fruits used as raw materials for tea oil production, but its leaves also hold certain economic value and strategic significance. This has brought considerable economic benefits to local CO growers and provided pathways and channels for rural economic development [10]. For CO, phosphorus deficiency can lead to a variety of problems of different degrees, such as slow growth, a dark green or bronze leaf color, poor root development, weakened stress resistance, a reduced oil content in fruits, and changes in flavor and quality. Therefore, it is particularly important to seek more efficient phosphorus supply methods in the production process of crops such as CO [11].
Biogas slurry is typically produced through the anaerobic fermentation of organic materials such as manure, kitchen waste, and straw. It is rich in plant growth hormones, including amino acids, indoleacetic acid, and gibberellins. Most of the raw materials for biogas slurry come from livestock and poultry farms. In the past, advanced processes and high costs were often required to safely treat these animal wastes. However, more people now opt for anaerobic fermentation combined with other additives to produce biogas fertilizer, which not only reduces the volume of solid waste but also effectively recycles resources [12]. Swamp fertilizers have always been an important source of nutrients for cultivated soils in China, especially with the rapid development of animal husbandry in recent years. Dung and urine resources from large-scale breeding have made the practice of returning biogas slurry to fields more common [13]. In recent years, as the awareness of environmental protection and green development has increased, research and practical applications concerning the replacement of chemical fertilizers with biogas slurry and its impact on soil microorganisms have received widespread attention. Studies have found that returning biogas slurry to fields can increase wheat yields [14], improve soil quality, and promote the growth of corn and ryegrass [15]. The combined application of biogas slurry and chemical fertilizers can enhance soil fertility, increase tomato yield [16], and effectively increase the yield of CO fruits [17]. Research by Tang and Zhang indicated that biogas not only serves as a conventional fertilizer but also affects the microbial community in the soil, leading to an increase in the abundance of beneficial bacteria [18,19]. The application of biogas slurry at different concentrations significantly influenced the microbial community structure in paddy soil at various stages [20]. Microorganisms play a highly prominent role in the cycling of elements such as phosphorus in the soil [21]. Soil microorganisms contain a variety of phosphorus metabolic functional genes that can promote the cycling of soil phosphorus through their own life activities. They can also activate phosphorus that is immobilized in the soil, thereby enhancing its availability [22]. However, most current research has focused on the effects of biogas slurry on the overall microbial community, with little reported on its impacts on phosphorus-solubilizing microorganisms and their phosphorus metabolic functions. Therefore, this study conducted field experiments using metagenomics as a key technique to investigate the role of soil microorganisms in phosphorus cycling in the context of biogas slurry returning to the field. This research can deepen our understanding of phosphorus transformation processes in biogas slurry and soil, providing theoretical support for the better utilization of phosphorus in the soil.

2. Materials and Methods

2.1. Experimental Design and Sampling

The field positioning experiment was conducted in Yuping County, Tongren City, Guizhou Province, China (27.3451° N, 108.9475° E). This area is located in the transitional zone from the Yunnan–Guizhou Plateau to the Xiangxi Hills, with an altitude of 530 m. It has a subtropical monsoon humid climate, with an annual average temperature of 16.4 °C, an average annual sunshine duration of 1227.8 h, and rainfall ranging from 1200 to 1600 mm [23].
The soil type of the experimental site is yellow soil [24], with basic physicochemical properties as follows: pH value of 4.87 ± 0.52, EC of 215.17 ± 8.44 µS/cm, total nitrogen content of 1.59 ± 0.26 g/kg, total phosphorus content of 0.79 ± 0.17 g/kg, total potassium content of 14.30 ± 0.51 g/kg, soil organic matter content of 30.38 ± 6.4 g/kg, and available phosphorus content of 8.90 mg/kg. The biogas slurry used in the experiment was collected from the biogas slurry collection pond of the biogasification project of Guizhou Gengze Agricultural Technology Co., Ltd. The basic physicochemical indicators of the biogas slurry are as follows: pH 7.97, EC of 16.14 ms/cm, redox potential of −363 mv, chemical oxygen demand of 4550 mg/L, ammonia nitrogen content of 1268 mg/L, total phosphorus content of 29.17 mg/L, and suspended solid content of 2645 mg/L.
The field experiment began in 2021 using the CO variety Xianglin 210, with tree ages ranging from 8 to 10 years. The planting density of CO was approximately 1665 trees per hectare, adopting a randomized block design, with each tree as an observation group (Figure 1). The treatments included: (1) no fertilizer treatment (CK); (2) low-concentration treatment ZY1 with a biogas slurry application rate of 13 kg/tree; (3) medium-concentration treatment ZY2 with a biogas slurry application rate of 27 kg/tree; (4) higher-concentration treatment ZY3 with a biogas slurry application rate of 40 kg/tree; and (5) high-concentration treatment ZY4 with a biogas slurry application rate of 53 kg/tree. Biogas slurry was applied to the field during the shooting period of CO in May 2022, with a single application. The specific design of the biogas slurry application rate is presented in Table 1. Corresponding indoor soil incubation experiments were carried out using soil collected from the field site. After air-drying and passing through a 20-mesh sieve, 500 g of soil was weighed and placed in plastic pots, with the same treatment groups and repetitions as those used in the field experiment for biogas slurry application.
Soil samples were collected during the camellia oil harvest period in October 2022. For each treatment group (each camellia plant), three different points around it were selected to collect and mix the surface soil (0–40 cm). After removing impurities such as leaves and stones, the soil for metagenomic sequencing was stored at −80 °C for testing [25], and the soil for determining soil physicochemical properties was naturally air-dried and sieved (100 mesh) before testing. An indoor soil culture experiment was set up with the same treatment groups and repetitions, and then placed in an artificial climate chamber under conditions of 20 °C and 75% humidity to be cultured for 1 d and 30 days before undisturbed sampling was conducted. After culturing, the soil samples were naturally air-dried and sealed for testing.

2.2. Physicochemical Index Determination

The pH of the biogas slurry was measured using a pH meter. The electrical conductivity of the biogas slurry was measured using a conductivity meter (EC 214, Hanna Instruments, Padovana, Italy). The COD of the biogas slurry was determined using the K2Cr2O7 titration method. The ammonia nitrogen and total phosphorus contents in the biogas slurry were measured using a fully automated intelligent chemical analyzer (CleverChem 380, Dechem-Tech. GmbH, Hamburg, Germany) after digestion and dilution. The solid content of the biogas slurry was determined using the gravimetric method.
Soil pH was measured using a pH meter at a soil–water ratio of 1:2.5 (w:v). Total nitrogen and total phosphorus contents in the soil were determined after digestion with the H2SO4-HClO4 method using an automatic intelligent chemical analyzer (CleverChem 380, Dechem-Tech. GmbH, Hamburg, Germany). Total potassium was measured using an atomic absorption spectrophotometer (ICE 3500, Thermo Fisher, Waltham, MA, USA). Soil organic matter was determined using the K2Cr2O7-FeSO4 titration method. Available phosphorus (Olsen-P) was extracted using the NH4F-HCl method and then determined using a flow analyzer [26].
Soil inorganic phosphorus was classified using the modified Chan and Jackson method to sequentially extract aluminum-bound phosphorus (Al-P), iron-bound phosphorus (Fe-P), occluded phosphorus (O-P), and calcium-bound phosphorus (Ca-P), followed by determination using a flow analyzer. Soil organic phosphorus was extracted using the ignition-H2SO4 extraction method and then determined using a flow analyzer [26].

2.3. Soil Microbial Metagenome Sequencing

After the unified extraction of soil microbial DNA, the extracted genomic DNA was detected using 1% agarose gel electrophoresis [27]. A Covaris M220 (Covaris, Woburn, MA, USA) high-energy ultrasonic shearing instrument was used to fragment the DNA samples into 400 bp lengths, followed by the construction of PE libraries using the NEXTFLEX™ Rapid DNA-Seq Kit (Bioo Scientific, Austin, TX, USA). Finally, bridge PCR and sequencing were performed using HiSeq X Reagent Kits (Illumina, San Diego, CA, USA).

2.4. Construction and Annotation of the Phosphorus Metabolism Gene Set

The non-redundant gene set was compared with the NR database using DIAMOND (https://github.com/bbuchfink/diamond, accessed on 8 December 2023) (parameters: blastp; E-value ≤ 1 × 10⁻⁵), and species annotation results were obtained from the corresponding taxonomic information database of the NR library. The abundance of each species was calculated by summing the gene abundance of the corresponding species, and the abundance of species in each sample was counted at the domain, phylum, and species taxonomic levels to construct an abundance profile at the corresponding taxonomic levels. The non-redundant gene set sequences were compared with the KEGG gene database (GENES) using DIAMOND (https://github.com/bbuchfink/diamond, accessed on 8 December 2023) (parameters: blastp; E-value ≤ 1 × 10⁻⁵) to screen for phosphorus metabolism-related genes and establish a functional gene set. The abundance of the functional category was calculated based on the sum of gene abundances corresponding to KO, Pathway, EC, and Module [28].

2.5. Data Statistics and Analysis

The Majorbio cloud platform (https://www.majorbio.com/, accessed on 12 January 2024) was used for the Kruskal–Wallis rank-sum test, Tukey–Kramer post hoc multiple comparisons test, permutation multivariate analysis of variance (ADONIS), and mantal variable matrix test, as well as the production of differential heatmaps [29]. SPSS (V20.0, IBM, Armonk, NY, USA) was used for one-way ANOVA and Pearson’s correlation analysis to test the relationships, with p < 0.05 considered significant. Other data statistics were performed using Excel 2010 (Microsoft, Redmond, WA, USA), and Origin 2020 (OriginLab Corporation, Northampton, MA, USA) was used for graphing.

3. Results and Discussion

3.1. The Impacts of Returning Biogas Slurry to the Field on the Physical and Chemical Properties of CO Planting Soil and the Distribution of Phosphorus Forms

The results of the indoor soil incubation experiment showed that the soil in CO plantations was dominated by inorganic phosphorus (accounting for approximately 80%), with Fe-P and O-P being the main forms of inorganic phosphorus. It can be observed that within a 30-day incubation period, the increase in the amount of slurry used could effectively raise the total phosphorus level in the CO planting soil, significantly increasing the contents of Al-P and Fe-P, while the impacts on O-P, Ca-P, and organic phosphorus in the soil were not significant. As the incubation time increased (30 days), the total phosphorus content in the soil decreased significantly, with the levels of the inorganic phosphorus forms Al-P and Fe-P also significantly decreasing, gradually transforming into O-P and Ca-P, and the organic phosphorus content also significantly decreasing (Table 2). After the biogas slurry is applied to the soil, the dissolved inorganic phosphorus in the slurry is rapidly bound by the abundant Fe3+ and Al3+ in the acidic soil of CO plantations, forming unstable Fe-P and Al-P, which are temporarily stored. As the application time extends, the organic phosphorus in the biogas slurry is transformed into inorganic phosphorus by soil microorganisms and oxidative environments, and Fe-P and Al-P are further oxidized, gradually encapsulated by iron oxides, and converted into the closed storage form O-P [30], with significantly reduced availability. It is commonly believed that phosphorus in the forms bound to aluminum, iron, and calcium in acidic soils can be slowly absorbed and utilized by plants [31]; although the absorption rate is slower than that of dissolved phosphorus (Pi), it can slowly release a phosphorus source over a longer period, while closed storage (O-P) phosphorus is extremely difficult to utilize [32].
This study monitored the soil physicochemical indicators and phosphorus forms during the harvest period (Table 3) and found that the application of the biogas slurry significantly improved the available phosphorus content in the soil, increased the content of Al-P, and significantly reduced the content of Ca-P. However, owing to the obvious spatial heterogeneity under field application, the effect of the variation in the amount of biogas slurry applied on the physicochemical properties of the soil for CO cultivation, soil phosphorus, and its forms is not clear.
Research shows that biogas slurry contains a higher amount of phosphorus, mostly in the form of inorganic phosphates, phosphoric acid, and phosphate ions, and contains some organic phosphorus compounds, such as fatty acid phosphates, but usually at lower levels [33]. The application of biogas slurry can effectively supplement phosphorus in the soil and has a certain activation effect on the phosphorus fixed in the soil phosphorus pool [34,35]. Al-P, which is a phosphorus form with good plant availability in acidic soils [36], also showed a significant increase, confirming that the return of biogas slurry to the field for CO cultivation can promote the absorption of soil phosphorus by plants. The significant reduction in the Ca-P content, combined with the view that Ca-P has the highest plant availability in acidic soils, suggests that the reason may be that during the shooting period, the growth and metabolic rate of CO is rapid, and the soil nutrients are quickly absorbed and assimilated by the plants. Therefore, the effect of applying biogas slurry on the increase in the total phosphorus content in the soil during the harvest period of CO did not show a significant difference. Overall, the application of biogas slurry not only directly supplies a readily available phosphorus source but also increases the proportions of metal ion-bound phosphorus, such as Fe-P, Al-P, and Ca-P, which are relatively easy for plants to absorb and utilize.

3.2. The Impacts of Returning Biogas Slurry to the Field on the Yield of CO and Phosphorus Content

The fresh weight of individual tea fruits, seeds, and peels showed an increasing trend with the increase in biogas slurry application, but compared to the control group, the application of biogas slurry slightly reduced the weight of the tea seeds while significantly increasing the weight of the peels (Figure 2a). The number of fruit sets of CO showed a significant increasing trend with an increase in biogas slurry application (Figure 2b). The average number of fruit sets in the area treated with biogas slurry was 176, which is an increase of 110 fruits per tree compared to the control group. Specifically, the number of fruit sets for ZY1, ZY2, ZY3, and ZY4 increased by 127%, 172%, 176%, and 193%, respectively. There was no significant difference in the number of fruit drops between the plots with and without biogas slurry application. As indicated by the number of fruit sets in each treatment group in Figure 2a, the theoretical yield of CO with biogas slurry application was significantly better than that of the control group. With an increase in the amount of biogas slurry, the yield of CO increased significantly. However, the effect of biogas slurry application on increasing the yield of CO is mainly manifested in the increase in peel weight, with no significant increase in the weight of the seeds.
As shown in Table 4, with an increase in the application amount of biogas slurry, the phosphorus content in the leaves and fruits of CO increased accordingly, and the enhancement effect was more significant with an increase in the amount of biogas slurry. Compared to the blank control group, the application of medium and low concentrations of biogas slurry reduced the phosphorus content in the leaves and fruits of CO, whereas the application of high concentrations of biogas slurry effectively increased the phosphorus content in the leaves and fruits. However, there was no significant difference between different concentrations of biogas slurry applications, as well as between the biogas slurry application and the control treatment.
Based on the results for the phosphorus content in the leaves, branches, and fruits of CO in this study, the application of biogas slurry can effectively increase the phosphorus content in the leaves and fruits. In particular, at higher application rates of biogas slurry, the increase in the phosphorus content in the leaves and fruits was more significant. This is consistent with the results of Li et al., who found that the application of biogas slurry can enhance plant phosphorus absorption [37]. In summary, this indicates that the application of biogas slurry improved the availability of phosphorus in the soil for CO plantations.

3.3. The Impact of Returning Slurry to the Field on the Microbial Community of Phosphorus-Solubilizing Bacteria

The high coverage estimate indicates the capture of Operational Taxonomic Units (OTUs) related to microbial phosphorus metabolism. Compared with CK, the return of biogas slurry to the field reduced the richness and diversity of the microbial community related to phosphorus metabolism in the soil (Table 5), with the low application rate of biogas slurry showing the most significant impact on the richness and diversity of the microbial community.
After the return of biogas slurry to the field, the main phyla, such as Actinobacteria, Proteobacteria, Chloroflexi, and Acidobacteria, in the CO planting soil still accounted for approximately 80% of the level, but the biogas slurry enhanced the community abundance of dominant bacteria such as Chloroflexi_bacterium, Acidobacteria_bacterium, Hyphomicrobiales_bacterium, Terrabacteria_group_bacterium_ANGP1, and Actinobacteria_bacterium in the soil. It correspondingly reduced the community abundance of Actinomycetia_bacterium, Streptosporangiaceae_bacterium, etc., indirectly affecting the relative abundance of major phosphorus metabolism genes such as gcd, ppx-gppA, phnA, pstS, ppk1, and spoT by altering the soil environment. It enhanced the solubility of inorganic phosphorus and the mineralization rate of organic phosphorus in the soil, and may weaken the competition between microorganisms and CO for phosphorus in the soil by inhibiting the transport of phosphorus between microbial cells, thus improving the utilization of soil phosphorus by CO.
At the phylum level, as shown in Figure 3, the main phosphorus-solubilizing microbial phyla in the CO planting soil were Actinobacteria, Proteobacteria, Chloroflexi, and Acidobacteria. After the return of biogas slurry to the field, the dominant phosphorus-solubilizing microorganisms in the soil were still the aforementioned four, accounting for approximately 80% of the total microbial biomass; however, compared to the CK, the application of biogas slurry somewhat increased the abundances of Actinobacteria, Chloroflexi, and Acidobacteria in the soil, and somewhat decreased the abundance of Proteobacteria (Figure 4). However, there was a significant impact on the abundances of non-dominant microbial phyla (Figure 4), with Gemmatimonadetes (1.05–3.61%), Candidatus_Rokubacteria (0.51–2.24%), Candidatus_Eremiobacteraeota (0.30–1.21%), and Bacteroidetes showing significant decreases in abundance, whereas the abundances of unclassified-d-Bacteria and Candidatus-Dormibacteraeota increased significantly (Figure 4).
At various levels, Chloroflexi_bacterium, Acidobacteria_bacterium, Actinomycetia_bacterium, Streptosporangiaceae_bacterium, Hyphomicrobiales_bacterium, Alphaproteobacteria_bacterium, Terrrabacteria_group_bacterium_ANGP1, Candidatus_Doribacteraeota_bacterium, Actinobacteria_bacterium, and Gemmatimonadetes_bacterium were the dominant bacterial species (Figure 5). Compared to the CK group, the biogas digestate treatment group showed increases in the relative abundances of Chloroflexi_bacterium, Acidobacteria_bacterium, Hyphomicrobiales_bacterium, Terrabacteria_group_bacterium_ANGP1, and Actinobacteria_bacterium, whereas decreases in the relative abundances of Actinomycetia_bacterium and Streptosporangiaceae_bacterium were observed. No significant differences were observed in the remaining species.
In the current study, the application of biogas slurry increased the contents of phosphates and organic matter in the soil, providing a rich source of nutrients for such bacteria, which was conducive to the growth and reproduction of nutrient-rich microorganisms such as Chloroflexi_bacterium and Acidobacteria_bacterium (Figure 5) [38,39]. However, Actinomycetia_bacterium and Streptosporangiaceae_bacterium, owing to their poor adaptability to the soil environmental changes caused by the application of biogas slurry, faced increased competition for living space and nutritional resources, resulting in a decrease in the relative abundances of these populations. Previous studies have shown that the role of microorganisms in the soil phosphorus cycle is influenced by various factors, such as the soil type, environmental conditions, and plant species [40]; therefore, their specific roles in the phosphorus cycle may vary with the environment. Currently, the specific roles and contributions of certain microbial phyla to the phosphorus cycle are not yet fully understood. For example, the role of one microbe may be specifically in promoting the decomposition and mineralization of organic phosphorus, whereas the role of other microbes may indirectly affect the phosphorus cycle through ecosystem functions. Some studies suggest that Actinobacteria can mineralize organic phosphorus and promote plant phosphorus absorption by producing phosphatases and forming mycorrhizal symbiosis with the roots of CO. Chloroflexi primarily participates in the mineralization of organic phosphorus to inorganic phosphorus in the soil phosphorus cycle and can release phosphorus by decomposing organic matter. Acidobacteria may be involved in the mineralization of organic phosphorus to inorganic phosphorus, and may play an important role in maintaining the availability of phosphorus in the acidic soil of the experimental area. Overall, the phosphorus metabolism of these functional microorganisms is mainly achieved through pathways such as releasing phosphorus by decomposing organic matter, using inorganic phosphates as phosphorus sources to promote phosphorus cycling, and decomposing organic phosphates into small-molecule inorganic phosphates [41].

3.4. The Impacts of Returning Biogas Slurry to the Field on the Soil Microbial Phosphorus Metabolic Functions

3.4.1. Distribution of Soil Microbial Phosphorus Metabolic Function Genes with Different Amounts of Biogas Slurry Returned to the Field

Based on the phosphorus metabolic functions of microorganisms, a set of genes related to phosphorus metabolism was established (Figure 6), as seen in Table 6, and the absolute abundance of phosphorus metabolism genes was subjected to a variance analysis of the differences between the biogas slurry application groups (Figure 7). The results showed that there were extremely significant differences between the groups for the phosphorus metabolism genes phnP, phnM, pstB, and appA. Meanwhile, phoR, ppk1, glpQ, phoB, ugpC, phnJ, and phnK showed significant differences between groups, while the remaining phosphorus metabolism genes did not exhibit significant intergroup differences. The phoR (gene for phosphorus deficiency response regulation) and glpQ (gene for phosphorus transport) genes showed an overall consistent pattern, with their abundance gradually decreasing as the concentration of biogas slurry application increased. The organic phosphorus mineralization genes phnM and phnJ also showed an overall consistent pattern, with their abundance gradually increasing as the concentration of biogas slurry application increased.
The Pearson analysis results of phosphorus metabolism genes and the amount of biogas slurry returned to the field show that the application amount of biogas slurry was negatively correlated with pstS, spoT, pstB, glpQ, and phnK, while it was positively correlated with other phosphorus metabolism genes. However, none of the correlations between the application rate of biogas slurry and the phosphorus metabolism genes reached a significant level (Table 7).

3.4.2. The Impact of Biogas Slurry Application on Phosphorus Metabolism Functional Genes

Based on the migration and transformation characteristics of inorganic phosphorus and organic phosphorus in microbial phosphorus metabolism genes, as well as the transformation characteristics of phosphorus in living organisms, a phosphorus cycling process in the soil for CO planting was created, as detailed in Figure 8. The abundance of the ppx-gppA gene in each biogas digestate application group increased compared to that in the CK group, while the relative abundance of the pstS gene decreased. The application of biogas digestate increased the solubility of inorganic phosphorus in the soil through the microbial community action of the ppx-gppA and gcd genes. After dissociating inorganic phosphate (Pi), it is carried and transported by the phosphorus transport gene community (such as the pstS gene community). Organic phosphorus is mineralized by the phnA and phnX gene communities, converted into Pi, and then absorbed by biological cells. With the increase in the amount of biogas digestate, the abundance of the phnA gene significantly increased; the phnX abundance in each biogas digestate application group significantly increased compared to the CK group, effectively promoting the conversion of soil organic phosphorus to inorganic phosphorus. The primary gene responsible for polyphosphate synthesis in the test soil was ppk1, and the abundance of ppk1 in each biogas digestate application group was higher than in that the CK group. The gene responsible for polyphosphate degradation was spoT, and the abundance of spoT after biogas treatment increased slightly compared to that in the CK group.
This study found that, compared to CK, the application of digested slurry increased the abundance of ppx-gppA and gcd, indicating that the application of digested slurry can promote microbial participation in the dissociation of inorganic phosphorus from soil into Pi, thus increasing the solubility of inorganic phosphorus. The relative abundances of PhnA and phnX increased, suggesting that the application of digested slurry enhanced the decomposition and mineralization rate of organic phosphorus by microorganisms. Organic phosphorus, under the action of certain bacteria (such as Streptomyces, Pseudomonas, Bacillus, and Gram-negative bacteria) and a few fungi and actinomycetes, is primarily mineralized to inorganic phosphorus through phosphatase enzyme activity and the secretion of certain organic acids (such as citric acid, lactic acid, and gluconic acid) [42,43]. Inorganic phosphorus is dissolved from soil phosphates by organic acids (citric acid, malic acid, etc.) and phosphatases secreted by phosphate-solubilizing and phosphorus-dissolving bacteria [44,45], releasing soluble phosphorus. Simultaneously, some bacteria and fungi in the soil can also promote the dissolution of inorganic phosphorus by secreting acidic metabolic products to change the soil pH conditions. The analysis of soil phnM and phnJ gene abundance in this study found that with an increase in the concentration of digested slurry application, both the phnM and phnJ genes related to organic phosphorus mineralization showed a trend of increasing expression abundance. This suggests that with an increase in the amount of digested slurry applied, the organic fraction of organic phosphorus in the soil increases, leading to an increased demand for the mineralization of organic matter such as organic phosphorus, resulting in an increase in the expression of the microbial phnM and phnJ genes [46].
The relative abundance of pstS decreased, and the application of digested slurry inhibited the microbial intake of Pi, which may weaken the competition for phosphorus between microorganisms, benefiting the absorption of phosphorus by CO. The results of this study indicate that the digested slurry also has an impact on the phosphorus deficiency response mechanism of microorganisms (Figure 5). It is worth noting that the read number of the phoR gene in the soil of CO planted in the field ranges from 3746 to 5142, which belongs to a relatively high abundance of genes. This functional gene can sense the external phosphorus content and activate downstream proteins (such as phoB) under low-phosphorus conditions to promote self-regulation, playing a role in helping microorganisms adapt to low-phosphorus environments [47,48]. This study found that with increasing amounts of digested slurry, the abundance of the phoR gene in the soil gradually decreased. This indicates that the application of digested slurry increased the amount of available phosphorus in the soil, leading to a gradual decrease in the stress of low-phosphorus conditions, resulting in weakened expression of the phoR gene in microorganisms [49,50]. From the perspective of the transformation relationship between inorganic phosphate and polyphosphate within biological cells, the application of the slurry can simultaneously increase the relative abundance of ppk1 and spoT, thereby accelerating the metabolic cycling rate of phosphorus within microbial cells. Relevant studies have shown that the application of organic manure can promote phosphorus metabolism within organisms and increase the overall phosphorus migration and transformation rates [51,52], which is consistent with the results of this study.

3.4.3. The Impacts of Soil Physicochemical Properties on Soil Phosphorus Metabolism

The Mantel analysis results and Spearman correlation coefficients indicate that when controlling for individual soil physicochemical indicators, the correlation between the structure of the microbial community involved in phosphorus metabolism in the soil and the structure of functional genes and soil physicochemical indicators is generally weak. The measured soil physicochemical indicators did not have a direct impact on the overall population of phosphorus-metabolizing microorganisms (Table 8, Figure 9). Soil pH and phosphorus, as well as organic matter indicators, showed a better correlation with the total nitrogen and soil potassium contents compared to the genes involved in phosphorus metabolism. Genes that have a relatively obvious correlation with soil physicochemical properties have a lower relative abundance within the entire set of phosphorus metabolism genes; hence, the direct effect is not significant.
Therefore, the return of digested slurry to the field has the potential to promote the solubilization of inorganic phosphorus and mineralization of organic phosphorus dominated by microorganisms and can weaken the competition for phosphorus between soil microorganisms and plants to some extent. Because of the incomplete understanding of the entire gene transcription, expression, enzyme, and protein action mechanisms involved in the activation of difficult-to-solubilize phosphorus in the soil, it is impossible to elaborate on the specific participation rates and contributions of various microorganisms and functional genes in the soil phosphorus cycle through specific modules and complete pathways. These deficiencies need to be addressed in the next step of this research.

4. Conclusions

The application of biogas slurry replenishes the soil phosphorus pool and increases the proportion of Al-P. Biogas slurry does not alter the major phyla of phosphorus-metabolizing microorganisms but increases the abundances of Chloroflexi_bacterium and Acidobacteria_bacterium while reducing the abundances of Actinomycetia_bacterium and Streptosporangiaceae_bacterium. At the functional gene level, biogas slurry enhances the solubility of inorganic phosphorus and the mineralization rate of organic phosphorus in the soil, while weakening the competition between microorganisms and CO for soil phosphorus by inhibiting intercellular phosphorus transport in microorganisms. In summary, biogas slurry can replenish the total soil phosphorus pool, increase the proportion of active phosphorus forms, and promote the microbial mineralization and solubilization of phosphorus. Within the scope of this study, the best results were achieved at the highest biogas slurry application rate. However, in practical production, the biogas slurry fertilization plan should also consider the nutrient demand characteristics of CO at different growth stages and the ratio of chemical fertilizer application.

Author Contributions

The conceptualization, writing, editing, and finalization of the manuscript were performed by Q.C., J.C., G.T., T.H., H.W., T.Z., J.H., L.D. and T.F. All authors have read and agreed to the published version of the manuscript.

Funding

Funded by the Yuping County Agricultural and Rural Bureau, Integration and Application of Technology for the Utilization of Breeding Manure in Yuping County, Honghuagang District Agricultural and Rural Bureau, Technical Support Service for Key Watershed Agricultural Non-point Pollution Control Project in Honghuagang District, Guizhou Province in 2023, Guizhou Province Science and Technology Support Program, and Key Technology Integration and Demonstration of Efficient Utilization of Pig Breeding Manure Resources in Integrated Planting and Breeding Model (Guikehe Support [2018] 2278).

Data Availability Statement

The original contributions presented in the study are included in the article, further inquiries can be directed to the corresponding author.

Conflicts of Interest

Author Hu Wang was employed by the company Guizhou ChuYang Ecological and Environmental Protection Technology Co., Ltd. The remaining authors declare that the research was conducted in the absence of any commercial or financial relationships that could be construed as a potential conflict of interest.

Abbreviations

The following abbreviations are used in this manuscript:
COCamellia oleifera
PiInorganic Phosphate
Al-PAluminum-Bound Phosphorus
Fe-PIron-Bound Phosphorus
O-POccluded Phosphorus
Ca-PCalcium-Bound Phosphorus
OTUsOperational Taxonomic Units
gcdGlucose Dehydrogenase
Ppx-gppAExopolyphosphatase/Guanosine Pentaphosphate Phosphatase
phnAPhosphate Regulation Protein A
phnMPhosphate Regulation Protein M
phnJPhosphate Regulation Protein J
phoRPhosphate Regulation Protein R
glpQGlycerophosphoryl Diester Phosphodiesterase
pstSPhosphate-Specific Transport System Subunit S

References

  1. Negrel, P.; Ladenberger, A.; Reimann, C.; Birke, M.; Demetriades, A.; Sadeghi, M.; GEMAS Project Team. GEMAS: Phosphorus in European agricultural soil—Sources versus sinks at the continental-scale—The geological perspective. Sci. Total Environ. 2024, 930, 172524. [Google Scholar] [CrossRef] [PubMed]
  2. Barrow, N.J. The effects of pH on phosphate uptake from the soil. Plant Soil 2016, 410, 401–410. [Google Scholar] [CrossRef]
  3. Barrow, N.J. Comparing two theories about the nature of soil phosphate. Eur. J. Soil Sci. 2020, 72, 679–685. [Google Scholar] [CrossRef]
  4. Zhang, M.; Liu, Y.; Wei, Q.; Gu, X.; Liu, L.; Gou, J. Biochar application ameliorated the nutrient content and fungal community structure in different yellow soil depths in the karst area of Southwest China. Front. Plant Sci. 2022, 13, 1020832. [Google Scholar] [CrossRef]
  5. Abou-Shady, A.; Osman, M.A.; El-Araby, H.; Khalil, A.K.A.; Kotp, Y.H. Electrokinetics-Based Phosphorus Management in Soils and Sewage Sludge. Sustainability 2024, 16, 10334. [Google Scholar] [CrossRef]
  6. Oliveira, C.L.B.d.; Cassimiro, J.B.; Lira, M.V.d.S.; Boni, A.d.S.; Donato, N.d.L.; Reis, R.d.A.; Heinrichs, R. Sugarcane Ratoon Yield and Soil Phosphorus Availability in Response to Enhanced Efficiency Phosphate Fertilizer. Agronomy 2022, 12, 2817. [Google Scholar] [CrossRef]
  7. Abou-Shady, A. Explore the potential for improving phosphorus availability in calcareous soil through electrokinetic methods. Soil Tillage Res. 2025, 250, 106525. [Google Scholar] [CrossRef]
  8. Zeng, W.; Wang, D.; Wu, Z.; He, L.; Luo, Z.; Yang, J. Recovery of nitrogen and phosphorus fertilizer from pig farm biogas slurry and incinerated chicken manure fly ash. Sci. Total Environ. 2021, 782, 146856. [Google Scholar] [CrossRef]
  9. Kakade, A.; Salama, E.-S.; Han, H.; Zheng, Y.; Kulshrestha, S.; Jalalah, M.; Harraz, F.A.; Alsareii, S.A.; Li, X. World eutrophic pollution of lake and river: Biotreatment potential and future perspectives. Environ. Technol. Innov. 2021, 23, 101604. [Google Scholar] [CrossRef]
  10. Yang, L.; Gao, C.; Xie, J.; Qiu, J.; Deng, Q.; Zhou, Y.; Liao, D.; Deng, C. Fruit economic characteristics and yields of 40 superior Camellia oleifera Abel plants in the low-hot valley area of Guizhou Province, China. Sci. Rep. 2022, 12, 7068. [Google Scholar] [CrossRef]
  11. Roychowdhury, A.; Srivastava, R.; Akash; Shukla, G.; Zehirov, G.; Mishev, K.; Kumar, R. Metabolic footprints in phosphate-starved plants. Physiol. Mol. Biol. Plants 2023, 29, 755–767. [Google Scholar] [CrossRef] [PubMed]
  12. Jiang, Y.; Zhang, Y.; Li, H. Research Progress and Analysis on Comprehensive Utilization of Livestock and Poultry Biogas Slurry as Agricultural Resources. Agriculture 2023, 13, 2216. [Google Scholar] [CrossRef]
  13. Liang, X.; Wang, H.; Wang, C.; Yao, Z.; Qiu, X.; Ju, H.; Wang, J. Disentangling the impact of biogas slurry topdressing as a replacement for chemical fertilizers on soil bacterial and fungal community composition, functional characteristics, and co-occurrence networks. Environ. Res. 2023, 238, 117256. [Google Scholar] [CrossRef] [PubMed]
  14. Gupta, R.K.; Bhatt, R.; Sidhu, M.S.; Dhingra, N.; Alataway, A.; Dewidar, A.Z.; Mattar, M.A. Evaluating Biogas Slurry for Phosphorus to Wheat in a Rice–Wheat Cropping Sequence. J. Soil Sci. Plant Nutr. 2023, 23, 3726–3734. [Google Scholar] [CrossRef]
  15. Inga-Mareike, B.; Lisa, E.; Andrea, B.; Torsten, M. Efficiency of Phosphorus Fertilizers Derived from Recycled Biogas Digestate as Applied to Maize and Ryegrass in Soils with Different pH. Agriculture 2022, 12, 325. [Google Scholar] [CrossRef]
  16. Zheng, J.; Qi, X.; Shi, C.; Yang, S.; Wu, Y. Tomato Comprehensive Quality Evaluation and Irrigation Mode Optimization with Biogas Slurry Based on the Combined Evaluation Model. Agronomy 2022, 12, 1391. [Google Scholar] [CrossRef]
  17. Wu, R.; You, L.; Yu, S.; Liu, H.; Wang, C.; Zhou, Z.; Zhang, L.; Hu, D. Effects of biogas slurry fertilization on fruit economic traits and soil nutrients of Camellia oleifera Abel. PLoS ONE 2019, 14, 208289. [Google Scholar] [CrossRef]
  18. Zhang, H.; Ma, Y.; Shao, J.; Di, R.; Zhu, F.; Yang, Z.; Sun, J.; Zhang, X.; Zheng, C. Changes in soil bacterial community and functions by substituting chemical fertilizer with biogas slurry in an apple orchard. Front. Plant Sci. 2022, 13, 184. [Google Scholar] [CrossRef]
  19. Tang, J.; Yin, J.; Davy, A.J.; Pan, F.; Han, X.; Huang, S.; Wu, D. Biogas Slurry as an Alternative to Chemical Fertilizer: Changes in Soil Properties and Microbial Communities of Fluvo-Aquic Soil in the North China Plain. Sustainability 2022, 14, 15099. [Google Scholar] [CrossRef]
  20. Wang, Q.; Huang, Q.; Wang, J.; Khan, M.A.; Guo, G.; Liu, Y.; Hu, S.; Jin, F.; Wang, J.; Yu, Y. Dissolved organic carbon drives nutrient cycling via microbial community in paddy soil. Chemosphere 2021, 285, 131472. [Google Scholar] [CrossRef]
  21. Widdig, M.; Heintz-Buschart, A.; Schleuss, P.-M.; Guhr, A.; Borer, E.T.; Seabloom, E.W.; Spohn, M. Effects of nitrogen and phosphorus addition on microbial community composition and element cycling in a grassland soil. Soil Biol. Biochem. 2020, 151, 108041. [Google Scholar] [CrossRef]
  22. Yao, H.; Chen, X.; Yang, J.; Li, J.; Hong, J.; Hu, Y.; Mao, X. Effects and Mechanisms of Phosphate Activation in Paddy Soil by Phosphorus Activators. Sustainability 2020, 12, 3917. [Google Scholar] [CrossRef]
  23. Gizhou Meteorological Bureau. Guizhou Climate Assessment June 2022 [贵州省2022年6月气候评价]. Guizhou Meteorological Service. 2022. Available online: http://gz.cma.gov.cn/qxfw/qhjcpg/qhpj/202207/t20220705_4960408.html (accessed on 4 January 2023).
  24. Zhao, N.; Wang, X.L.; He, J.; Yang, S.M.; Zheng, Q.W.; Li, M.R. Effects of Replacing Chemical Nitrogen Fertilizer with Organic Fertilizer on Active Organic Carbon Fractions, Enzyme Activities, and Crop Yield in Yellow Soil. Huan Jing Ke Xue 2024, 45, 4196–4205. [Google Scholar] [CrossRef]
  25. Pavlovska, M.; Prekrasna, I.; Parnikoza, I.; Dykyi, E. Soil Sample Preservation Strategy Affects the Microbial Community Structure. Microbes Environ. 2021, 36, ME20134. [Google Scholar] [CrossRef]
  26. Bao, S. Soil Agrochemistry Analysis, 3rd ed.; China Agriculture Press: Beijing, China, 2015; pp. 90–93. [Google Scholar]
  27. Tuo, L.J.; Zhang, T.; Chen, G.Q.; Liu, Y.; Zhao, C.; Jiang, S.W. Proper application of DNA dyes in agarose gel electrophoresis. Electrophoresis 2024, 45, 1796–1804. [Google Scholar] [CrossRef]
  28. Han, C.; Shi, C.; Liu, L.; Han, J.; Yang, Q.; Wang, Y.; Li, X.; Fu, W.; Gao, H.; Huang, H.; et al. Majorbio Cloud 2024: Update single-cell and multiomics workflows. Imeta 2024, 3, e217. [Google Scholar] [CrossRef]
  29. Ren, Y.; Yu, G.; Shi, C.; Liu, L.; Guo, Q.; Han, C.; Zhang, D.; Zhang, L.; Liu, B.; Gao, H.; et al. Majorbio Cloud: A one-stop, comprehensive bioinformatic platform for multiomics analyses. Imeta 2022, 1, e12. [Google Scholar] [CrossRef]
  30. Caporale, A.G.; Adamo, P.; Azam, S.M.G.G.; Rao, M.A.; Pigna, M. May humic acids or mineral fertilisation mitigate arsenic mobility and availability to carrot plants (Daucus carota L.) in a volcanic soil polluted by As from irrigation water? Chemosphere 2018, 193, 464–471. [Google Scholar] [CrossRef]
  31. Wang, Q.; Zhang, N.; Chen, Y.; Qin, Z.; Jin, Y.; Zhu, P.; Peng, C.; Colinet, G.; Zhang, S.; Liu, J. The Phosphorus Availability in Mollisol Is Determined by Inorganic Phosphorus Fraction under Long-Term Different Phosphorus Fertilization Regimes. Agronomy 2022, 12, 2364. [Google Scholar] [CrossRef]
  32. Ren, C.; Wang, J.; Cheng, H.; Zou, Y.; Li, Q. Effects of rubber (Hevea brasiliensis) plantations on soil phosphorus fractions and microbial community composition. Acta Ecol. Sin. 2017, 37, 7983–7993. [Google Scholar] [CrossRef]
  33. Sun, H.; Cui, X.; Stinner, W.; Zhang, L.; Ju, X.; Guo, J.; Dong, R. Ensiling excessively wilted maize stover with biogas slurry: Effects on storage performance and subsequent biogas potential. Bioresour. Technol. 2020, 305, 123042. [Google Scholar] [CrossRef]
  34. Jin, J.; Fang, Y.; He, S.; Liu, Y.; Liu, C.; Li, F.; Khan, S.; Eltohamy, K.M.; Liu, B.; Liang, X. Improved phosphorus availability and reduced degree of phosphorus saturation by biochar-blended organic fertilizer addition to agricultural field soils. Chemosphere 2023, 317, 137809. [Google Scholar] [CrossRef] [PubMed]
  35. Niyungeko, C.; Liang, X.; Liu, C.; Zhou, J.; Chen, L.; Lu, Y.; Tiimub, B.M.; Li, F. Effect of biogas slurry application on soil nutrients, phosphomonoesterase activities, and phosphorus species distribution. J. Soils Sediments 2019, 20, 900–910. [Google Scholar] [CrossRef]
  36. Zhang, Y.; Chen, H.; Xiang, J.; Xiong, J.; Wang, Y.; Wang, Z.; Zhang, Y. Effect of Rice-Straw Biochar Application on the Acquisition of Rhizosphere Phosphorus in Acidified Paddy Soil. Agronomy 2022, 12, 1556. [Google Scholar] [CrossRef]
  37. Li, M.; Liu, Y.; Luo, L.; Ying, S.; Jiang, P. Effects of different biogas slurry application patterns on nitrogen and phosphorus losses in a paddy field. Paddy Water Environ. 2024, 22, 521–533. [Google Scholar] [CrossRef]
  38. Boubekri, K.; Soumare, A.; Mardad, I.; Lyamlouli, K.; Ouhdouch, Y.; Hafidi, M.; Kouisni, L. Multifunctional role of Actinobacteria in agricultural production sustainability: A review. Microbiol. Res. 2022, 261, 127059. [Google Scholar] [CrossRef]
  39. Li, Y.; Chi, J.; Ao, J.; Gao, X.; Liu, X.; Sun, Y.; Zhu, W. Effects of Different Continuous Cropping Years on Bacterial Community and Diversity of Cucumber Rhizosphere Soil in Solar-Greenhouse. Curr. Microbiol. 2021, 78, 2380–2390. [Google Scholar] [CrossRef]
  40. Pang, F.; Li, Q.; Solanki, M.K.; Wang, Z.; Xing, Y.X.; Dong, D.F. Soil phosphorus transformation and plant uptake driven by phosphate-solubilizing microorganisms. Front. Microbiol. 2024, 15, 1383813. [Google Scholar] [CrossRef]
  41. Pramanik, K.; Das, A.; Banerjee, J.; Das, A.; Chatterjee, S.; Sharma, R.; Kumar, S.; Gupta, S. Metagenomic Insights into Rhizospheric Microbiome Profiling in Lentil Cultivars Unveils Differential Microbial Nitrogen and Phosphorus Metabolism under Rice-Fallow Ecology. Int. J. Mol. Sci. 2020, 21, 8895. [Google Scholar] [CrossRef]
  42. Wang, Y.; Luo, D.; Xiong, Z.; Wang, Z.; Gao, M. Changes in rhizosphere phosphorus fractions and phosphate-mineralizing microbial populations in acid soil as influenced by organic acid exudation. Soil Tillage Res. 2023, 225, 105543. [Google Scholar] [CrossRef]
  43. Barra, P.J.; Viscardi, S.; Jorquera, M.A.; Duran, P.A.; Valentine, A.J.; de la Luz Mora, M. Understanding the Strategies to Overcome Phosphorus–Deficiency and Aluminum–Toxicity by Ryegrass Endophytic and Rhizosphere Phosphobacteria. Front. Microbiol. 2018, 9, 01155. [Google Scholar] [CrossRef]
  44. Saranya, K.; Sundaramanickam, A.; Manupoori, S.; Kanth, S.V. Screening of multi-faceted phosphate-solubilising bacterium from seagrass meadow and their plant growth promotion under saline stress condition. Microbiol. Res. 2022, 261, 127080. [Google Scholar] [CrossRef] [PubMed]
  45. Biswas, S.S.; Biswas, D.R.; Ghosh, A.; Sarkar, A.; Das, A.; Roy, T. Phosphate solubilizing bacteria inoculated low-grade rock phosphate can supplement P fertilizer to grow wheat in sub-tropical inceptisol. Rhizosphere 2022, 23, 100556. [Google Scholar] [CrossRef]
  46. Siles, J.A.; Starke, R.; Martinovic, T.; Parente Fernandes, M.L.; Orgiazzi, A.; Bastida, F. Distribution of phosphorus cycling genes across land uses and microbial taxonomic groups based on metagenome and genome mining. Soil Biol. Biochem. 2022, 174, 108826. [Google Scholar] [CrossRef]
  47. Bruna, R.E.; Kendra, C.G.; Pontes, M.H. An intracellular phosphorus-starvation signal activates the PhoB/PhoR two-component system in Salmonella enterica. mBio 2023, 15, e0164224. [Google Scholar] [CrossRef]
  48. Jia, R.; Zhao, Y.; Hattori, M. Crystal structure of the catalytic ATP-binding domain of the PhoR sensor histidine kinase. Proteins 2023, 91, 999–1004. [Google Scholar] [CrossRef]
  49. Jiang, N.; Wang, Q.; Jiang, D.; Wu, C.; Pu, J.; Huang, W.; Yao, Z.; Chen, Z.; Zhang, Y.; Chen, L. High-rate nitrogen loading accelerates organic phosphorus loss through enzymatic and non-enzymatic processes in a semi-arid grassland. Appl. Soil Ecol. 2025, 205, 105755. [Google Scholar] [CrossRef]
  50. Jha, V.; Tikariha, H.; Dafale, N.A.; Purohit, H.J. Exploring the rearrangement of sensory intelligence in proteobacteria: Insight of Pho regulon. World J. Microbiol. Biotechnol. 2018, 34, 172. [Google Scholar] [CrossRef]
  51. Wang, M.; Sha, C.; Wu, J.; Li, P.; Tan, J.; Huang, S. Comparison of Bacterial Community in Paddy Soil after Short-Term Application of Pig Manure and the Corresponding Organic Fertilizer. Land 2021, 11, 9. [Google Scholar] [CrossRef]
  52. Chatterjee, D.; Nayak, A.K.; Mishra, A.; Swain, C.K.; Kumar, U.; Bhaduri, D.; Panneerselvam, P.; Lal, B.; Gautam, P.; Pathak, H. Effect of Long-Term Organic Fertilization in Flooded Rice Soil on Phosphorus Transformation and Phosphate Solubilizing Microorganisms. J. Soil Sci. Plant Nutr. 2021, 21, 1368–1381. [Google Scholar] [CrossRef]
Figure 1. Field experiment site photos.
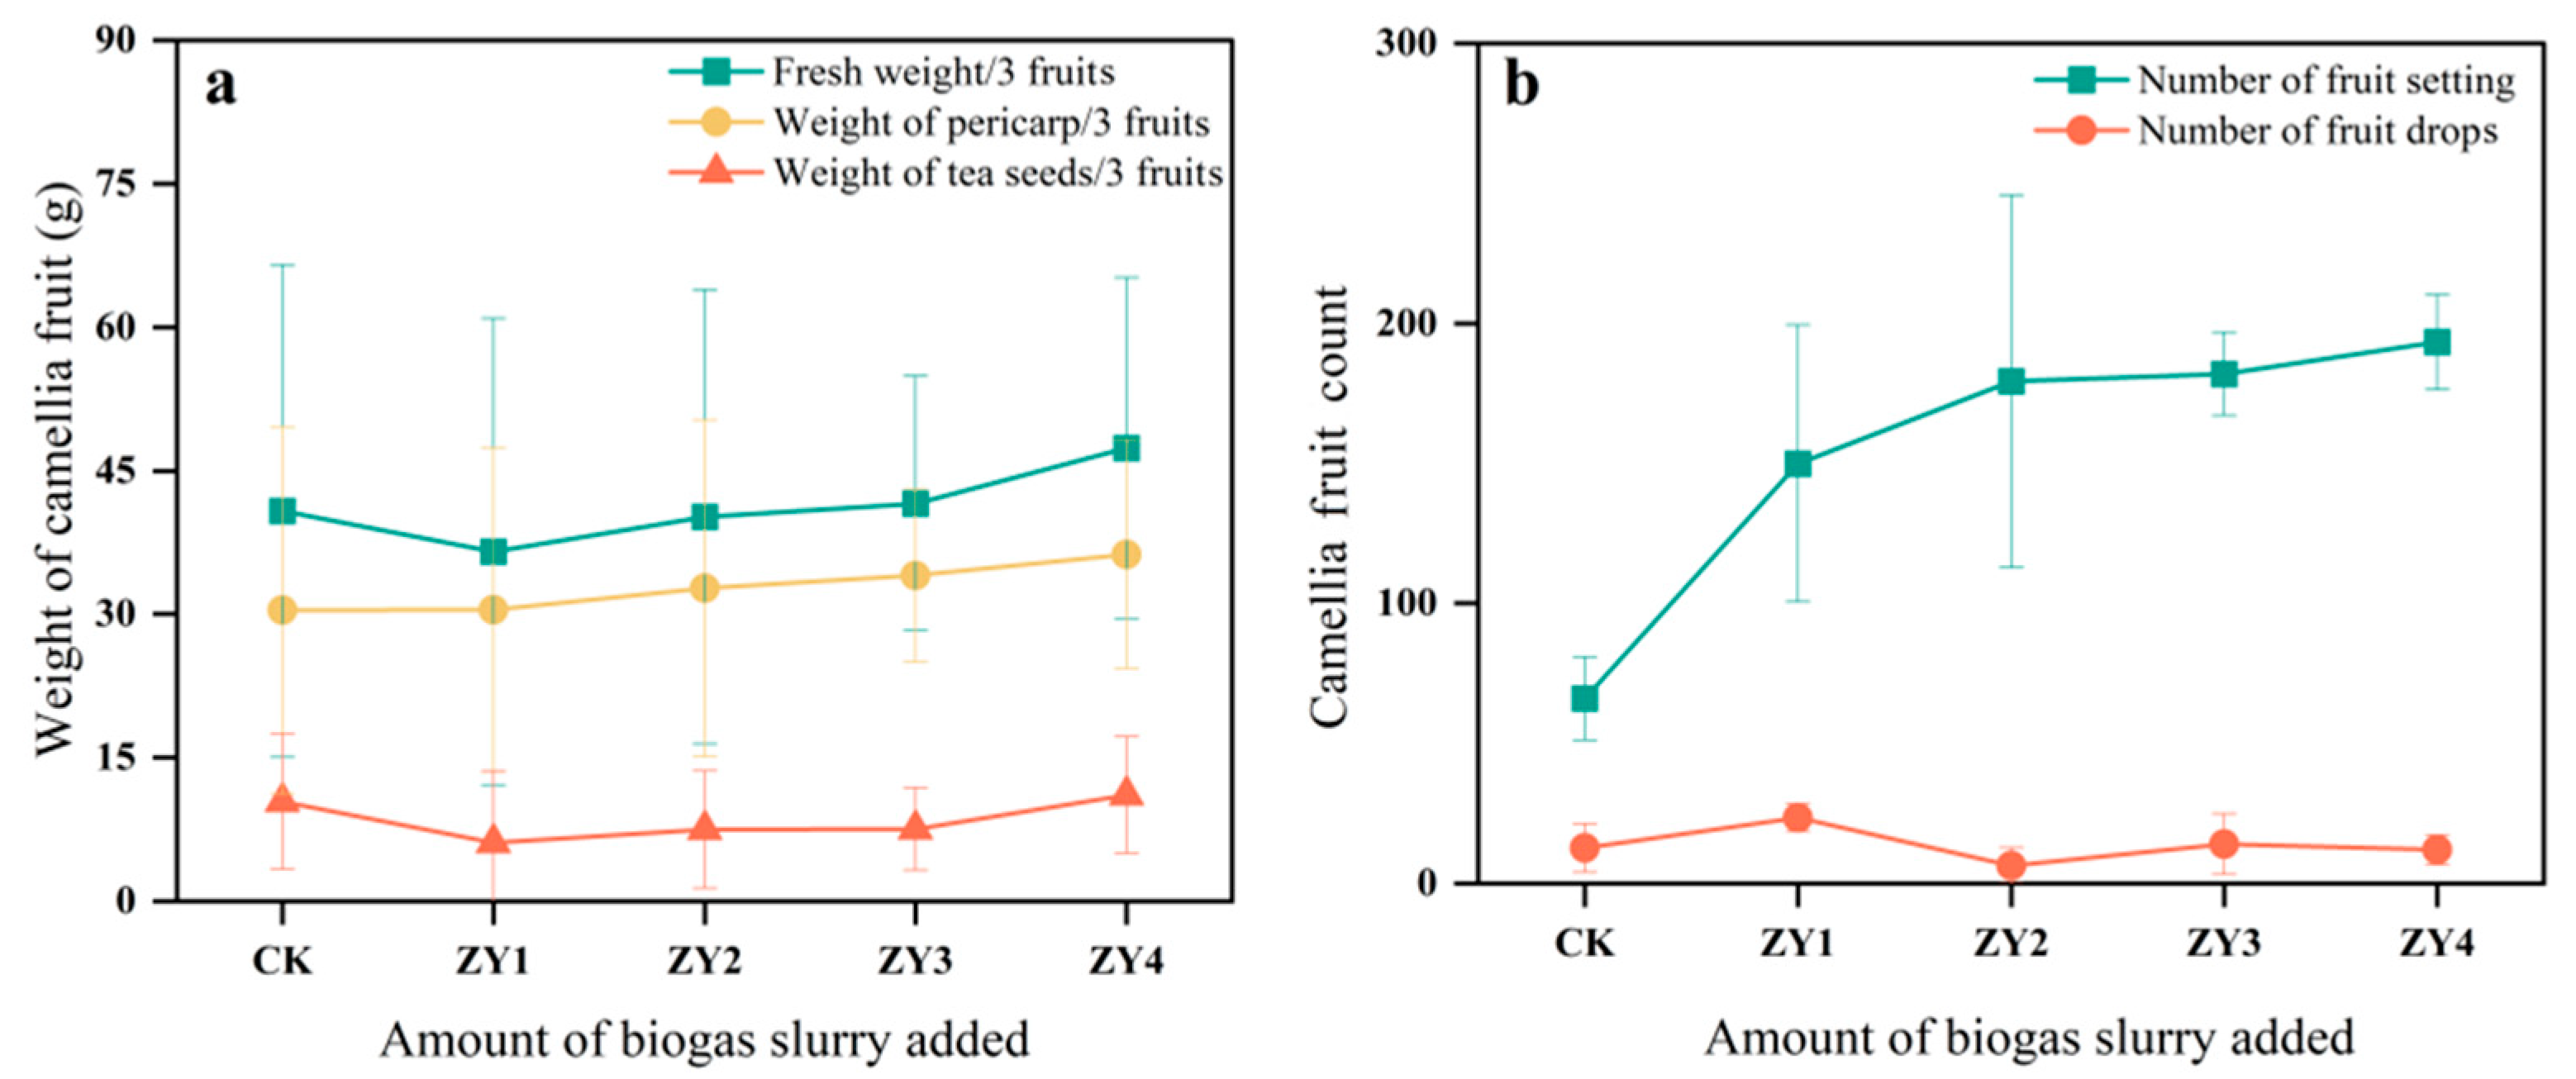
Land 14 00718 g001
Figure 2. The effects of different biogas slurry application rates on the fruit of CO at harvest. (a) Difference in the fruit yield of CO among different treatment groups, (b) Fruiting of CO in different treatment groups during the harvest period.
Land 14 00718 g002
Figure 3. Community composition of phosphorus-metabolizing microbial phyla. Soil phosphate-solubilizing microflora were dominated by Actinobacteria, Proteobacteria, Chloroflexi, and Acidobacteria, with no significant differences between these four microbial groups (p < 0.05). Gemmatimonadetes, Candidatus_ Rokubacteria, and Candidatus_Eremiobacteraeota exhibited better variability.
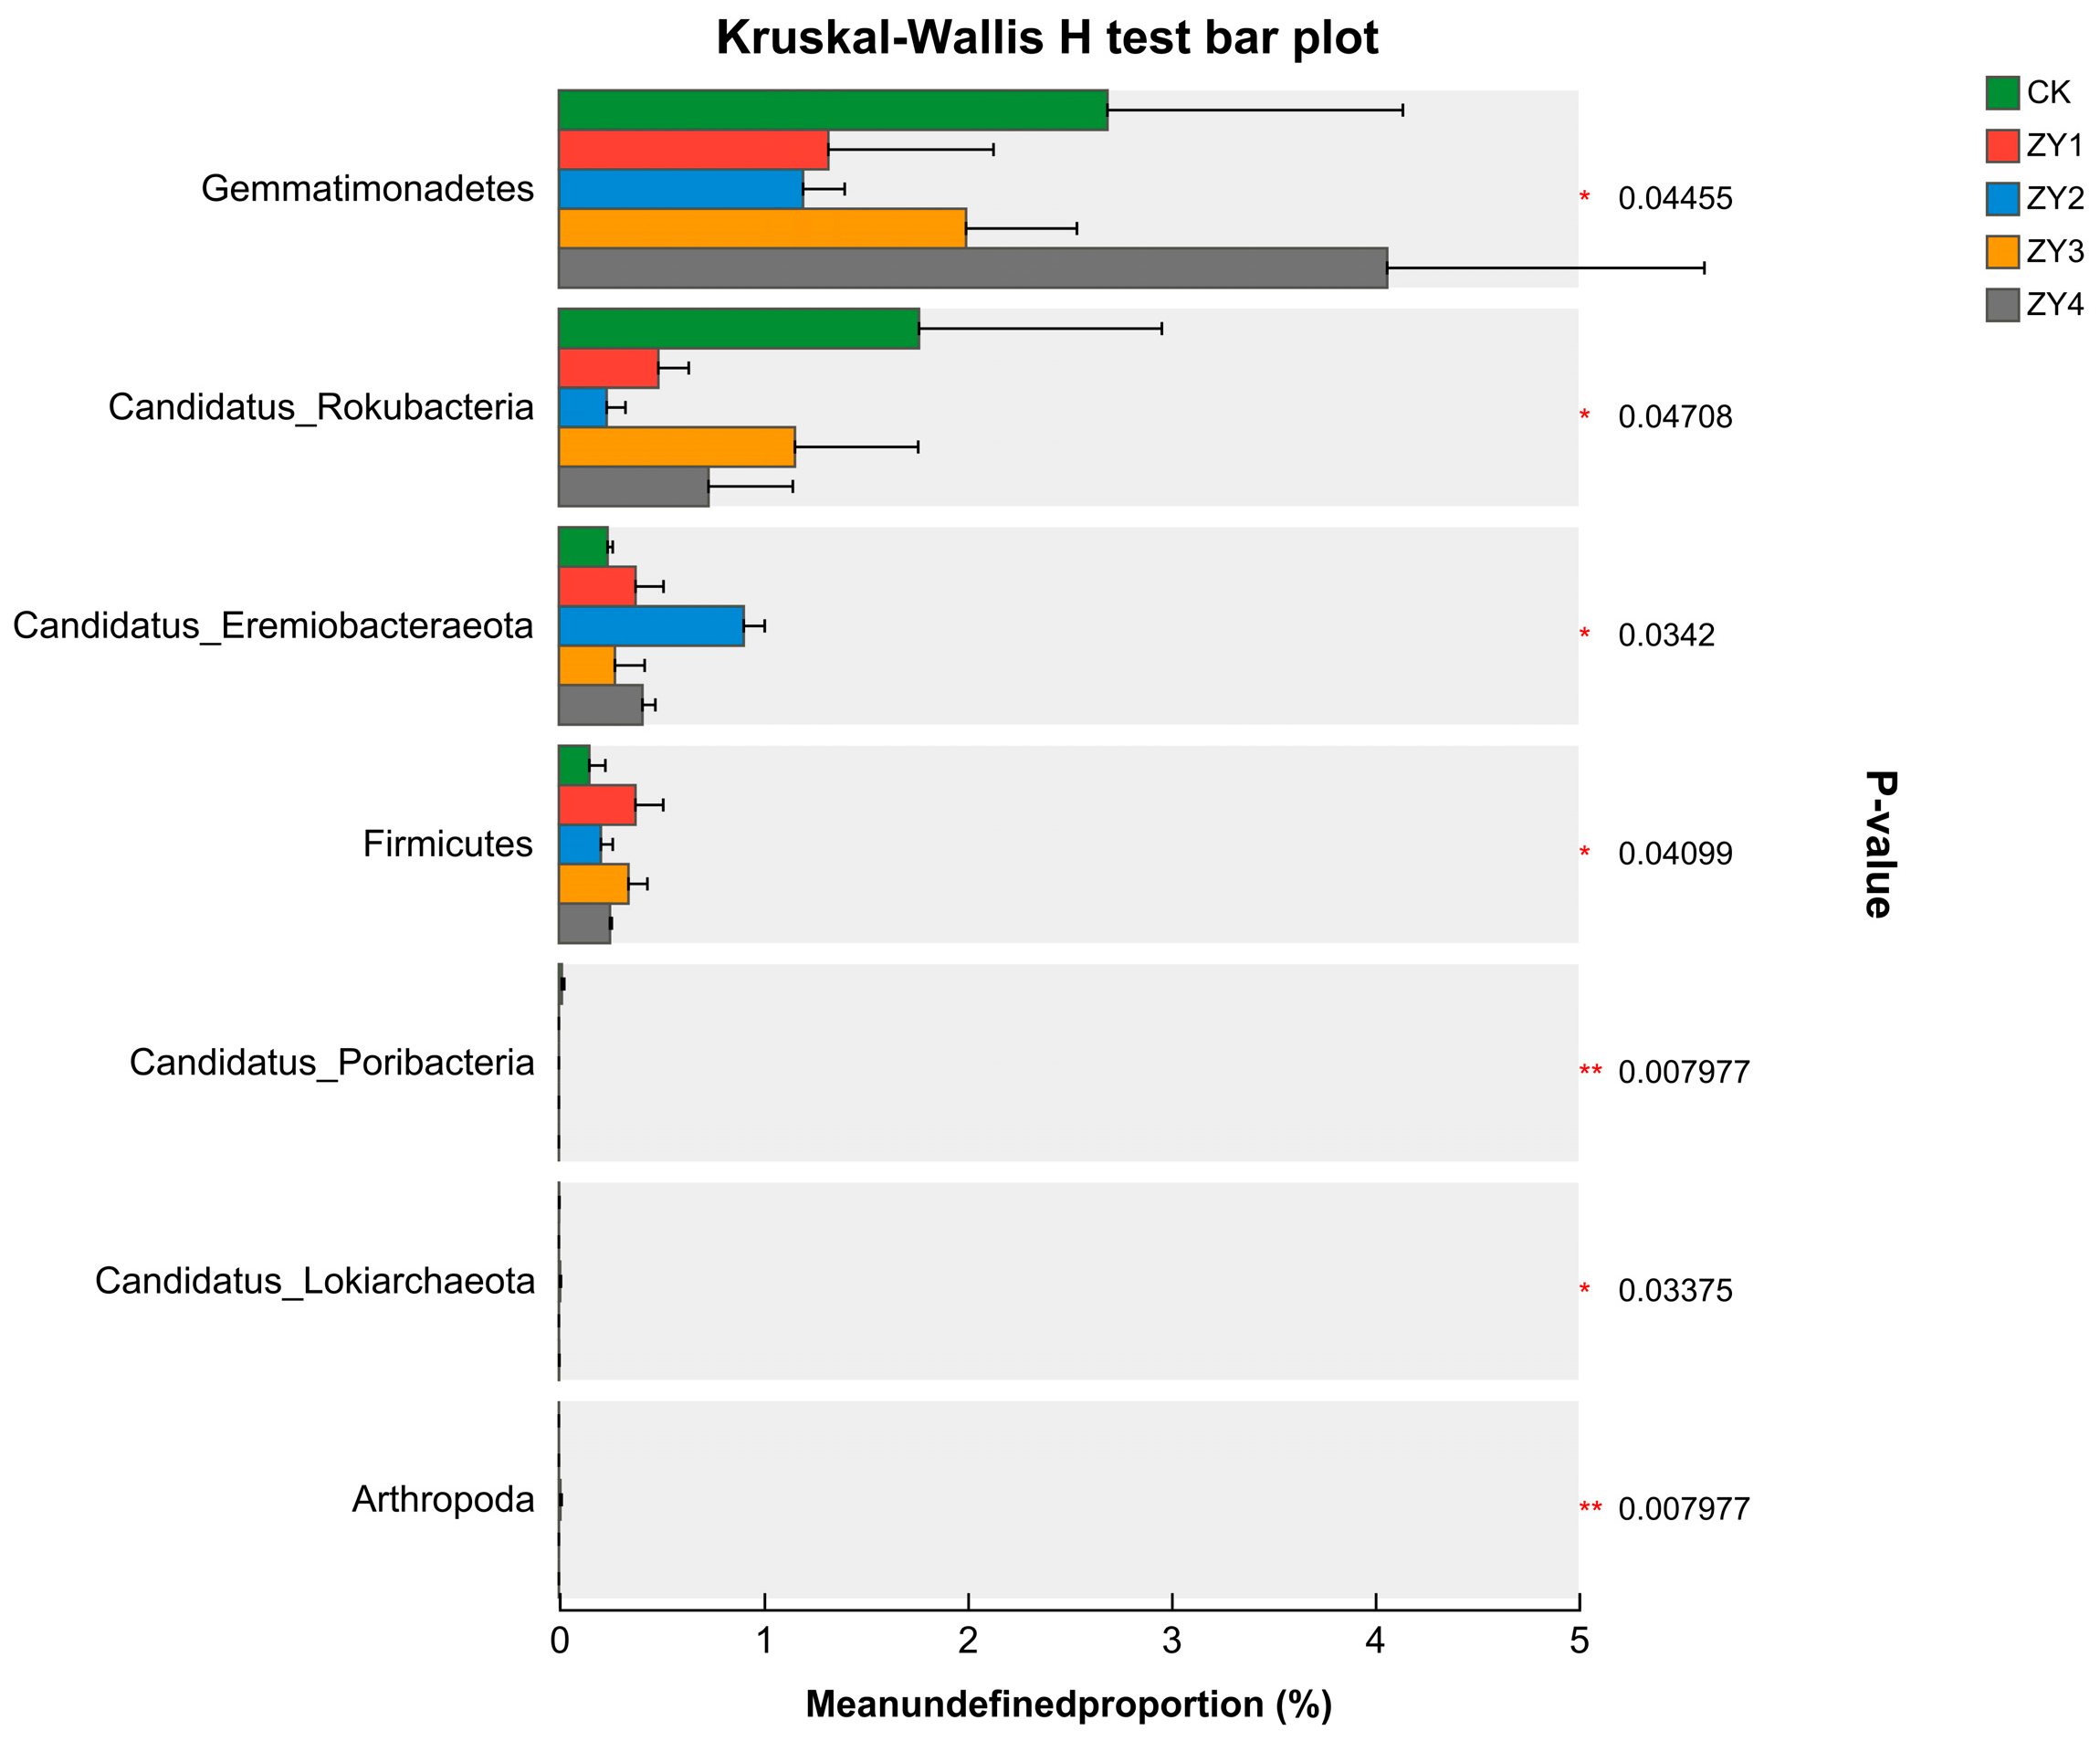
Land 14 00718 g003
Figure 4. Inter-group variability test for microbial phylum-level communities (* p < 0.05, ** p < 0.01). The abundance of Gemmatimonadetes decreased at low biogas slurry returns and increased at high biogas slurry returns. The abundance of CandidatusRokubacteria was lower than that of the blank, and the abundance of CandidatusEremiobacteraeota was higher than that of the blank in the biogas slurry treatment groups. However, the linear increase in the amount of biogas slurry returned to the field did not exhibit a uniform pattern.
Land 14 00718 g004
Figure 5. Community structure of phosphorus-metabolizing microorganisms at the species level. Chloroflexi_bacterium, Acidobacteria_bacterium, Actinomycetia_bacterium, Streptosporangiaceae_bacterium, Hyphomicrobiales_bacterium, Alphaproteobacteria_bacterium, Terrrabacteria_group_bacterium_ANGP1, Candidatus_Dormibacteraeota_bacterium, Actinobacteria_bacterium bacterium, Gemmatimonadetes_bacterium were the dominant species.
Land 14 00718 g005
Figure 6. Distribution of phosphorus metabolism functional genes in each group.
Land 14 00718 g006
Figure 7. Functional genes with significant differences among the treatment groups (* p < 0.05, ** p < 0.01, *** p < 0.001). (a) Genes with significant differences and abundance ranking in the top 7–11, (b) Genes with significant differences and abundance ranking in the top 1–6. phnP, phnM, pstB, and appA showed highly significant group differences, and phoR, ppk1, glpQ, phoB, ugpC, phnJ, and phnK showed significant group differences.
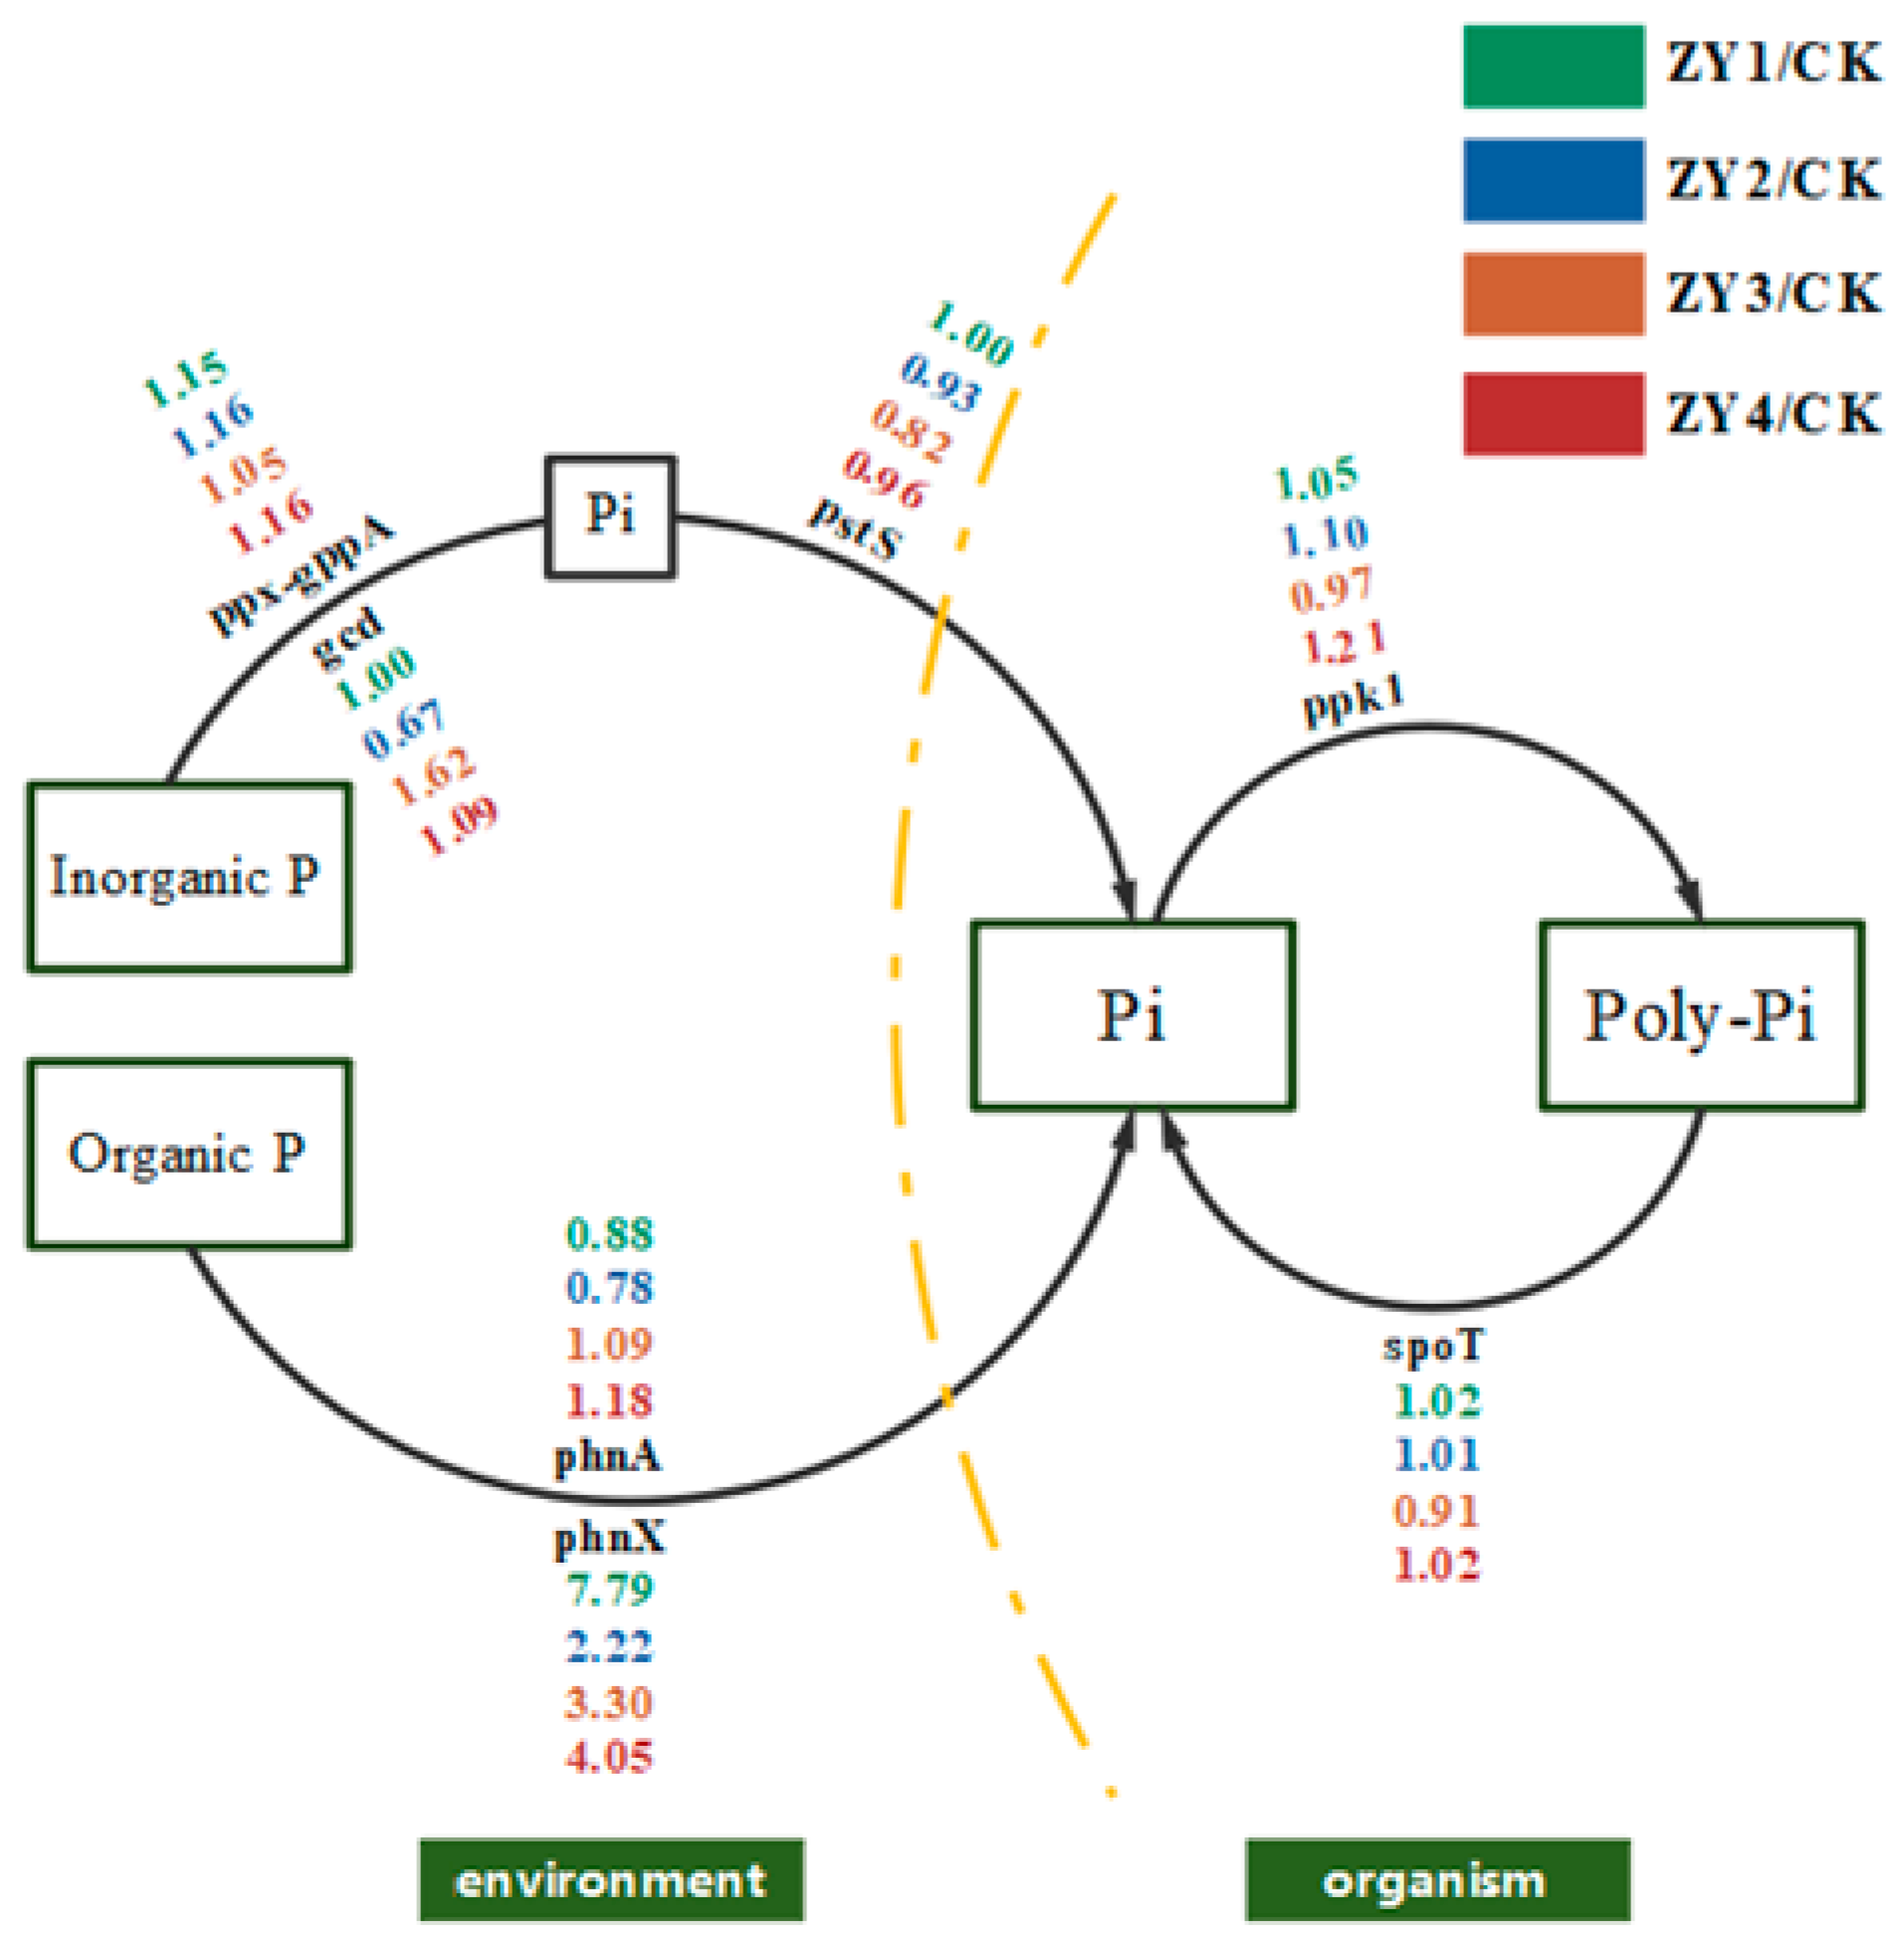
Land 14 00718 g007
Figure 8. Schematic diagram of phosphorus cycling under the influence of soil microorganisms. Single gene abundance was compared with CK on the background of different biogas slurry application rates, and included inorganic phosphorus solubilization, organic phosphorus mineralization, phosphorus transfer, polyphosphate synthesis, and polyphosphate degradation.
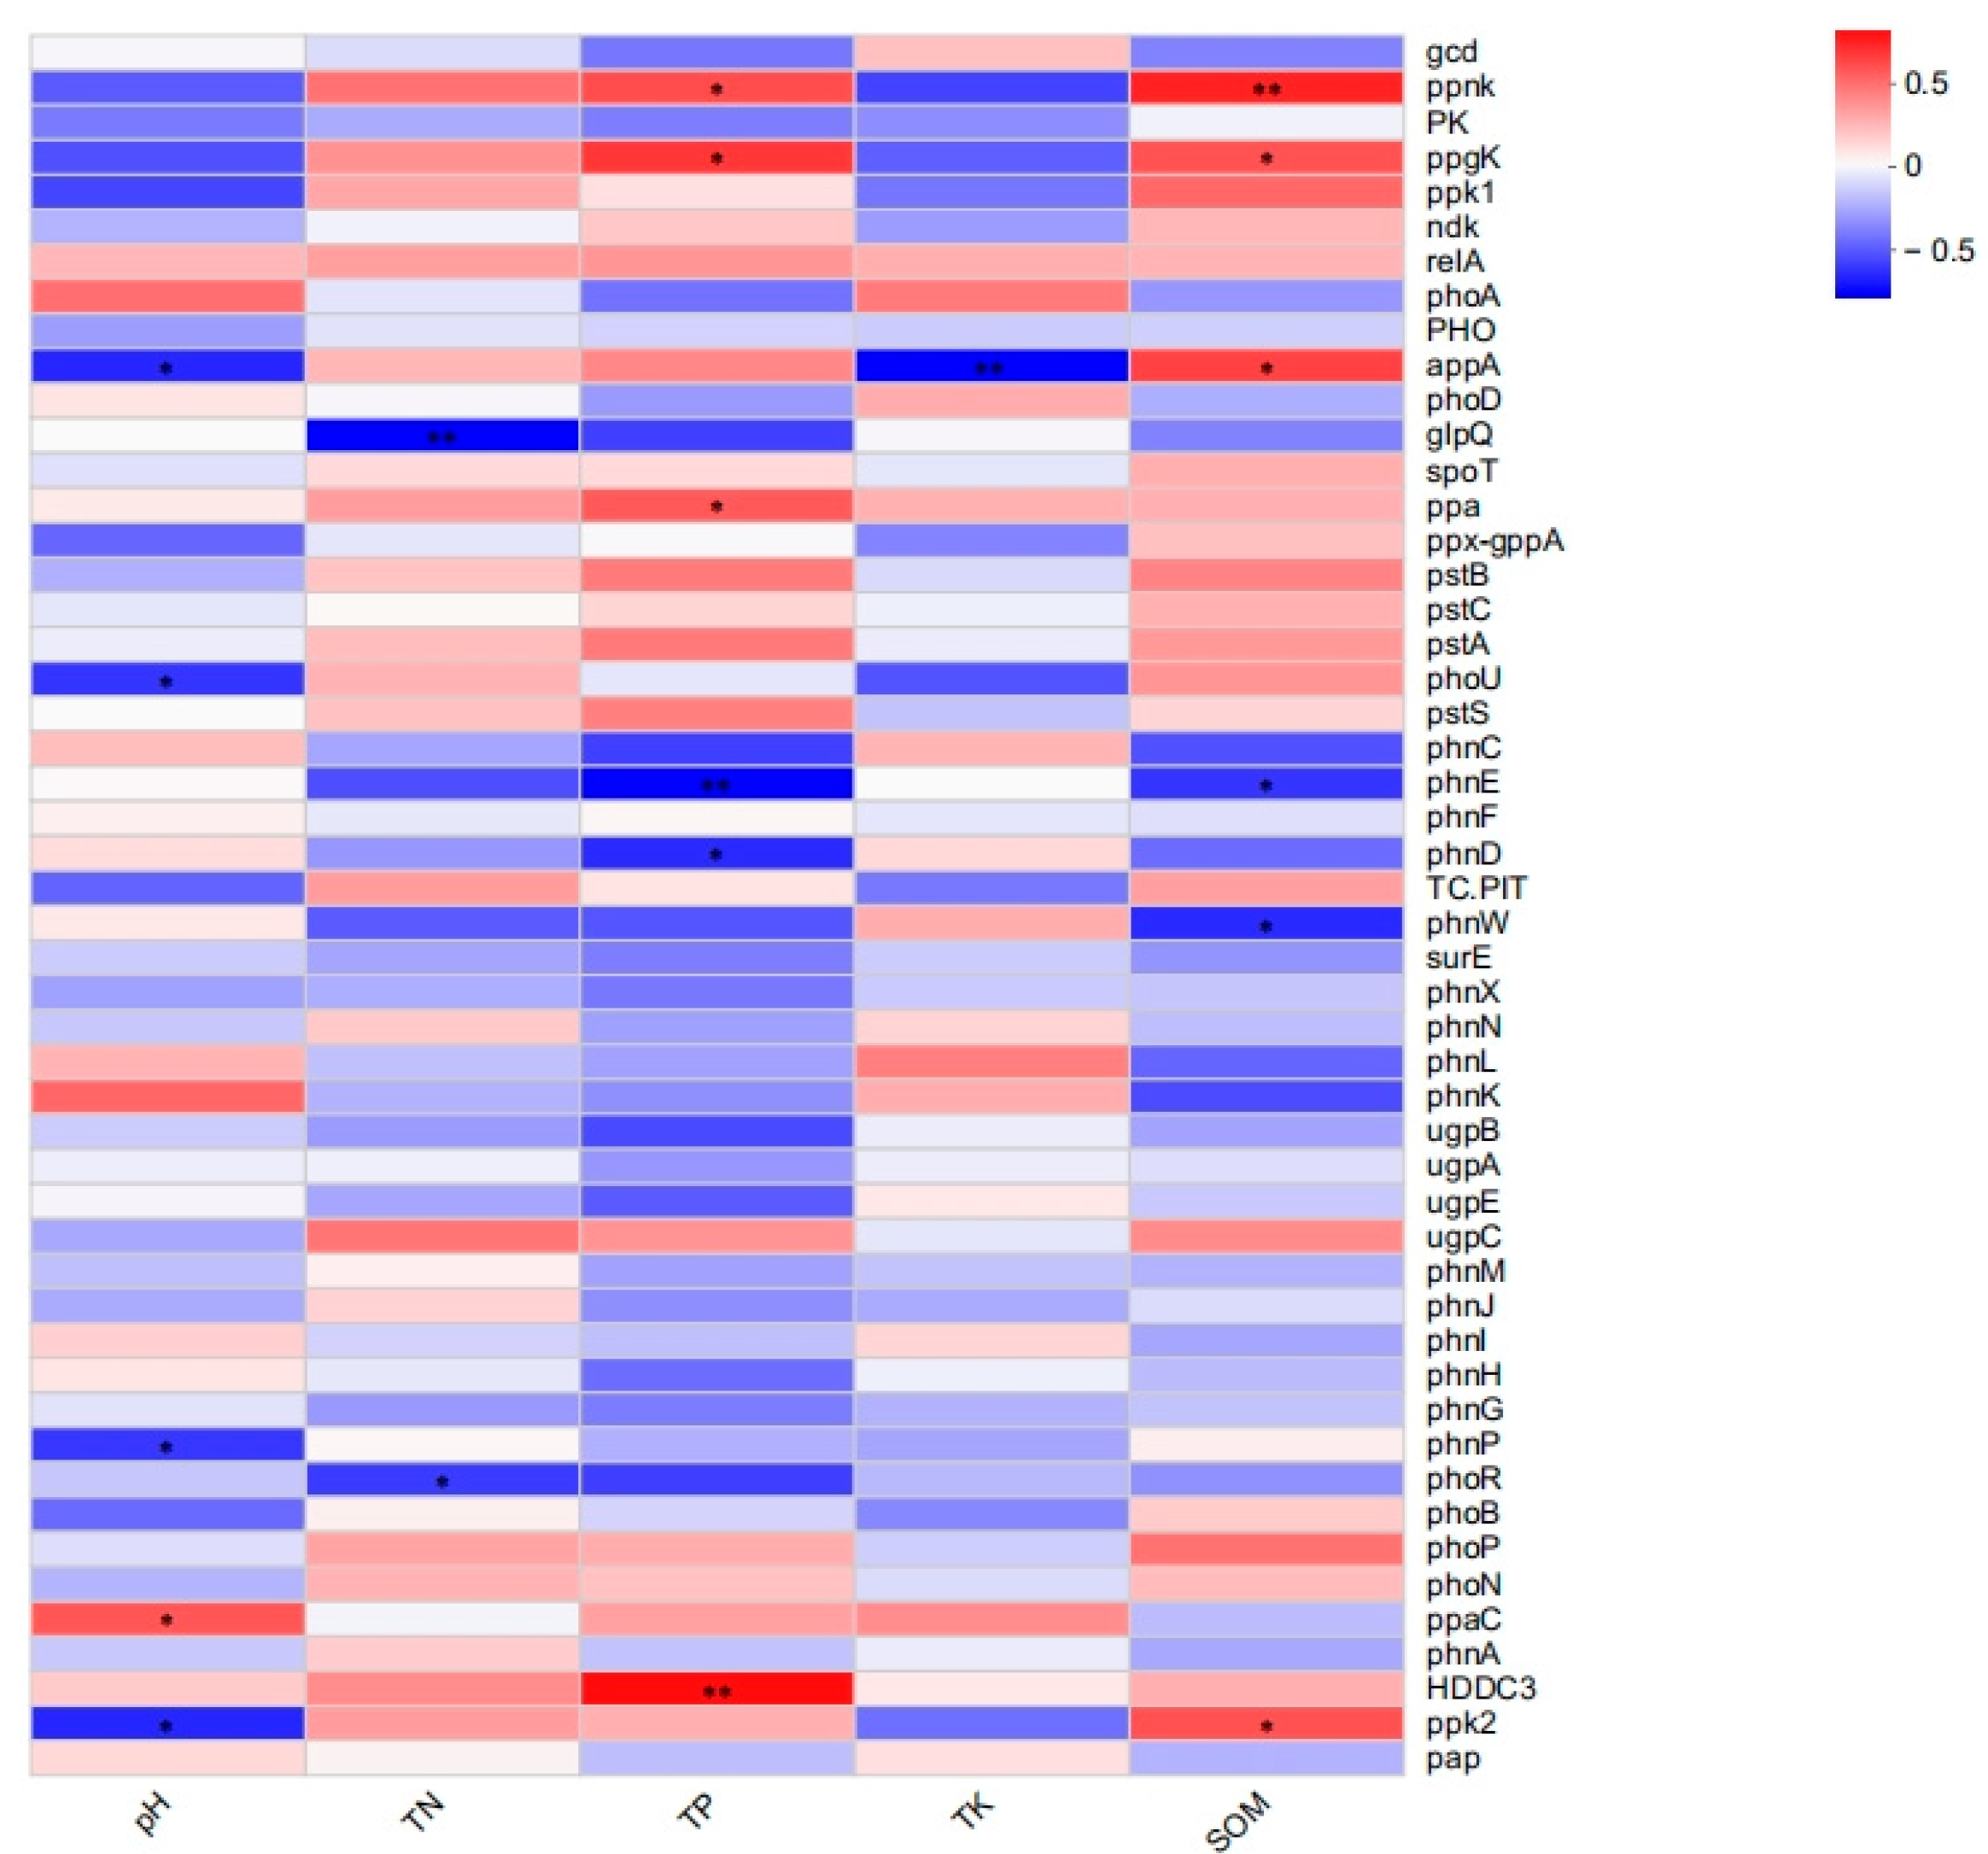
Land 14 00718 g008
Figure 9. Heat map of the correlation analysis of environmental factors and phosphorus metabolism functional genes (* p < 0.05, ** p < 0.01). The Spearman correlation coefficient test revealed that genes with high relative abundance, such as pstS, spoT, phoR, and gcd, were not significantly correlated, but some genes with low relative abundance in the soil reflected significant relationships with environmental factors.
Land 14 00718 g009
Table 1. Experimental design for biogas slurry addition.
GroupReplicates of the Experimental GroupNumberField Experiment Biogas Slurry Application Rate (kg/plant)Biogas Slurry Application Rate in the Indoor Simulation (g/500 g)
Blank group3CK00
Low concentration group3ZY11368.6
Medium concentration group3ZY227142.6
Higher concentration group3ZY340211.2
High concentration group3ZY453279.9
Table 2. Phosphorus forms and contents in soil after 1 d and 30 d of simulated incubation.
GroupCKZY1ZY2ZY3ZY4
Al-P (mg kg−1)1 d56.537 ± 4.4662.335 ± 2.6275.459 ± 3.2681.821 ± 8.5389.518 ± 26.14
30 d46.542 ± 2.4052.215 ± 6.3150.742 ± 4.9253.207 ± 9.3063.871 ± 10.25
Fe-P (mg kg−1)1 d252.061 ± 9.11273.120 ± 4.50269.544 ± 8.02282.675 ± 5.08309.402 ± 9.85
30 d187.870 ± 8.14197.948 ± 12.34213.640 ± 14.37223.829 ± 5.78242.288 ± 7.42
O-P (mg kg−1)1 d193.853 ± 6.58197.207 ± 14.17209.614 ± 10.68208.502 ± 23.62190.175 ± 17.28
30 d225.881 ± 20.38223.786 ± 8.87227.749 ± 51.47215.778 ± 15.96224.666 ± 6.99
Ca-P (mg kg−1)1 d80.026 ± 21.1765.676 ± 9.6078.419 ± 12.6969.958 ± 16.2768.529 ± 5.50
30 d68.581 ± 2.9165.176 ± 5.2081.834 ± 13.4680.979 ± 26.1988.246 ± 4.84
Org-P (mg kg−1)1 d189.316 ± 6.29134.351 ± 43.24157.089 ± 49.55197.565 ± 13.71162.338 ± 31.40
30 d19.65 ± 15.1727.51 ± 1.186.52 ± 0.0047.57 ± 32.6717.89 ± 23.97
TP (mg kg−1)1 d782.297 ± 38.56732.688 ± 49.40790.124 ± 42.53840.520 ± 47.13819.962 ± 35.72
30 d541.977 ± 34.80557.467 ± 13.57576.137 ± 58.03605.509 ± 35.48630.992 ± 6.04
Table 3. Physicochemical indicators of soil in each treatment group (a, b, c, d, e indicate significant differences (p < 0.05) by Duncan’s test).
TreatmentsCKZY1ZY2ZY3ZY4
pH (H2O)5.81 ± 0.10 a4.92 ± 0.07 b4.53 ± 0.03 d4.75 ± 0.01 c4.36 ± 0.01 e
TN (g kg−1)1.38 ± 0.05 a1.39 ± 0.05 a1.13 ± 0.01 b1.13 ± 0.01 b1.40 ± 0.03 a
TP (g kg−1)0.61 ± 0.01 b0.68 ± 0.01 a0.56 ± 0.01 c0.55 ± 0.01 c0.70 ± 0.02 a
TK (g kg−1)14.60 ± 0.15 b15.24 ± 0.28 a14.07 ± 0.17 c14.41 ± 0.06 b15.00 ± 0.06 a
SOM (g kg−1)27.97 ± 3.16 a25.77 ± 2.21 b18.83 ± 1.08 e23.70 ± 1.90 d24.17 ± 0.55 c
Olsen-P (mg kg−1)27.38 ± 3.26 b15.54 ± 0.48 c23.27 ± 0.42 b16.78 ± 1.05 c52.24 ± 0.64 a
Al-P (mg kg−1)197.594160.844143.067213.511247.060
Fe-P (mg kg−1)394.128331.770321.152362.866335.497
Ca-P (mg kg−1)110.90341.51024.89825.23715.761
Org-P (mg kg−1)103.77842.10690.512115.099151.972
Table 4. Phosphorus content in different parts of CO from each treatment group.
TreatmentsBranch Phosphorus Content (mg kg−1)Leaf Phosphorus Content
(mg kg−1)
Fruit (with Seeds) Phosphorus Content (mg kg−1)
CK1161.760 ± 144.17704.625 ± 24.38707.201 ± 27.55
ZY11028.800 ± 107.98638.697 ± 53.17749.910 ± 5.09
ZY21431.043 ± 101.33669.567 ± 65.59699.330 ± 15.64
ZY3915.413 ± 42.77673.953 ± 15.77711.750 ± 18.43
ZY41110.643 ± 168.60714.887 ± 66.66921.567 ± 173.31
Table 5. Microbial community diversity indices for each treatment group (a, b, c, indicate significant differences (p < 0.05) by Duncan’s test).
SubunitDiversity IndexRichness EstimatorCoverage
ShannonSimpsonAceChao
CK4.048 ± 0.32 a0.063 ± 0.02 c854.67 ± 73.16 a854.67 ± 73.16 a1
ZY13.662 ± 0.10 c0.097 ± 0.01 a852 ± 73.51 a852 ± 73.51 a1
ZY23.794 ± 0.07 b0.081 ± 0.01 b851.33 ± 65.77 a851.33 ± 65.77 a1
ZY33.840 ± 0.54 b0.085 ± 0.02 b801.67 ± 86.01 c801.67 ± 86.01 b1
ZY43.880 ± 0.14 b0.069 ± 0.01 c846 ± 21.38 b846 ± 21.38 a1
CK4.048 ± 0.32 a0.063 ± 0.02 c854.67 ± 73.16 a854.67 ± 73.16 a1
ZY13.662 ± 0.10 c0.097 ± 0.01 a852 ± 73.51 a852 ± 73.51 a1
Table 6. Gene set related to soil microbial phosphorus metabolism in the experimental area.
FunctionNumberGene
Organic P mineralization17PHO, phnX, phnW, phoA, phoD, appA, phnG, phnH, phnI, phnJ, phnL, phnM, phnN, phnO, phnP, phoN, phnA
Inorganic P solubilization3gcd, ppa, ppx-gppA
Regulatory4phoB, phoR, phoP, phoU
Transporters16phnC, phnD, phnE, pstA, pstB, pstC, pstS, phnK, phnF, TC.PIT, ugpA, ugpB, ugpC, ugpE, glpQ, pit
Polyphosphate synthesis2ppk1, ppaC
Polyphosphate degradation10ppk2, surE, pap, ppnK, ppgK, relA, spoT, HDDC3, ndk, PK
Organic P mineralization17PHO, phnX, phnW, phoA, phoD, appA, phnG, phnH, phnI, phnJ, phnL, phnM, phnN, phnO, phnP, phoN, phnA
Inorganic P solubilization3gcd, ppa, ppx-gppA
Regulatory4phoB, phoR, phoP, phoU
Table 7. Correlation analysis between soil phosphorus metabolism genes and biogas slurry use.
pstSspoTphnXppk1ppx-gppAgcdphnAphoRppk1
Treatmentscoefficient−0.173−0.0960.0660.3510.2020.2510.2810.1020.351
p0.5370.7350.8160.1990.4700.3670.3110.7170.199
pstBglpQphoBphnPugpCphnMphnJappAphnK
Treatmentscoefficient−0.164−0.0920.4880.4300.0290.3800.3360.223−0.144
p0.5590.7440.0650.1090.9180.1620.2200.4250.608
Table 8. Mantel test of the relationship between environmental factors and the overall abundance of soil phosphorus metabolism genes.
Soil IndicatorsPhosphorus-Metabolizing Microbial Community StructureFunctional Gene Structure of Phosphorus Metabolism
Mantel_RpMantel_Rp
TP−0.0340.522−0.0290.433
Olsen-P−0.0680.566−0.0550.527
Org-p0.1610.1290.0690.299
Al-P0.1910.147−0.0010.424
Fe-P−0.127 0.805−0.1480.86
Ca-P−0.062 0.678 −0.082 0.767
O-P////
pH(H2O)−0.1410.722−0.0630.523
TN−0.0580.586−0.0420.487
TK−0.040 0.522−0.0010.393
Org-matter0.2190.0750.0230.434
Disclaimer/Publisher’s Note: The statements, opinions and data contained in all publications are solely those of the individual author(s) and contributor(s) and not of MDPI and/or the editor(s). MDPI and/or the editor(s) disclaim responsibility for any injury to people or property resulting from any ideas, methods, instructions or products referred to in the content.

