
Nonlinear Effects of Human Settlements on Seasonal Land Surface Temperature Variations at the Block Scale: A Case Study of the Central Urban Area of Chengdu

Abstract
1. Introduction
2. Materials
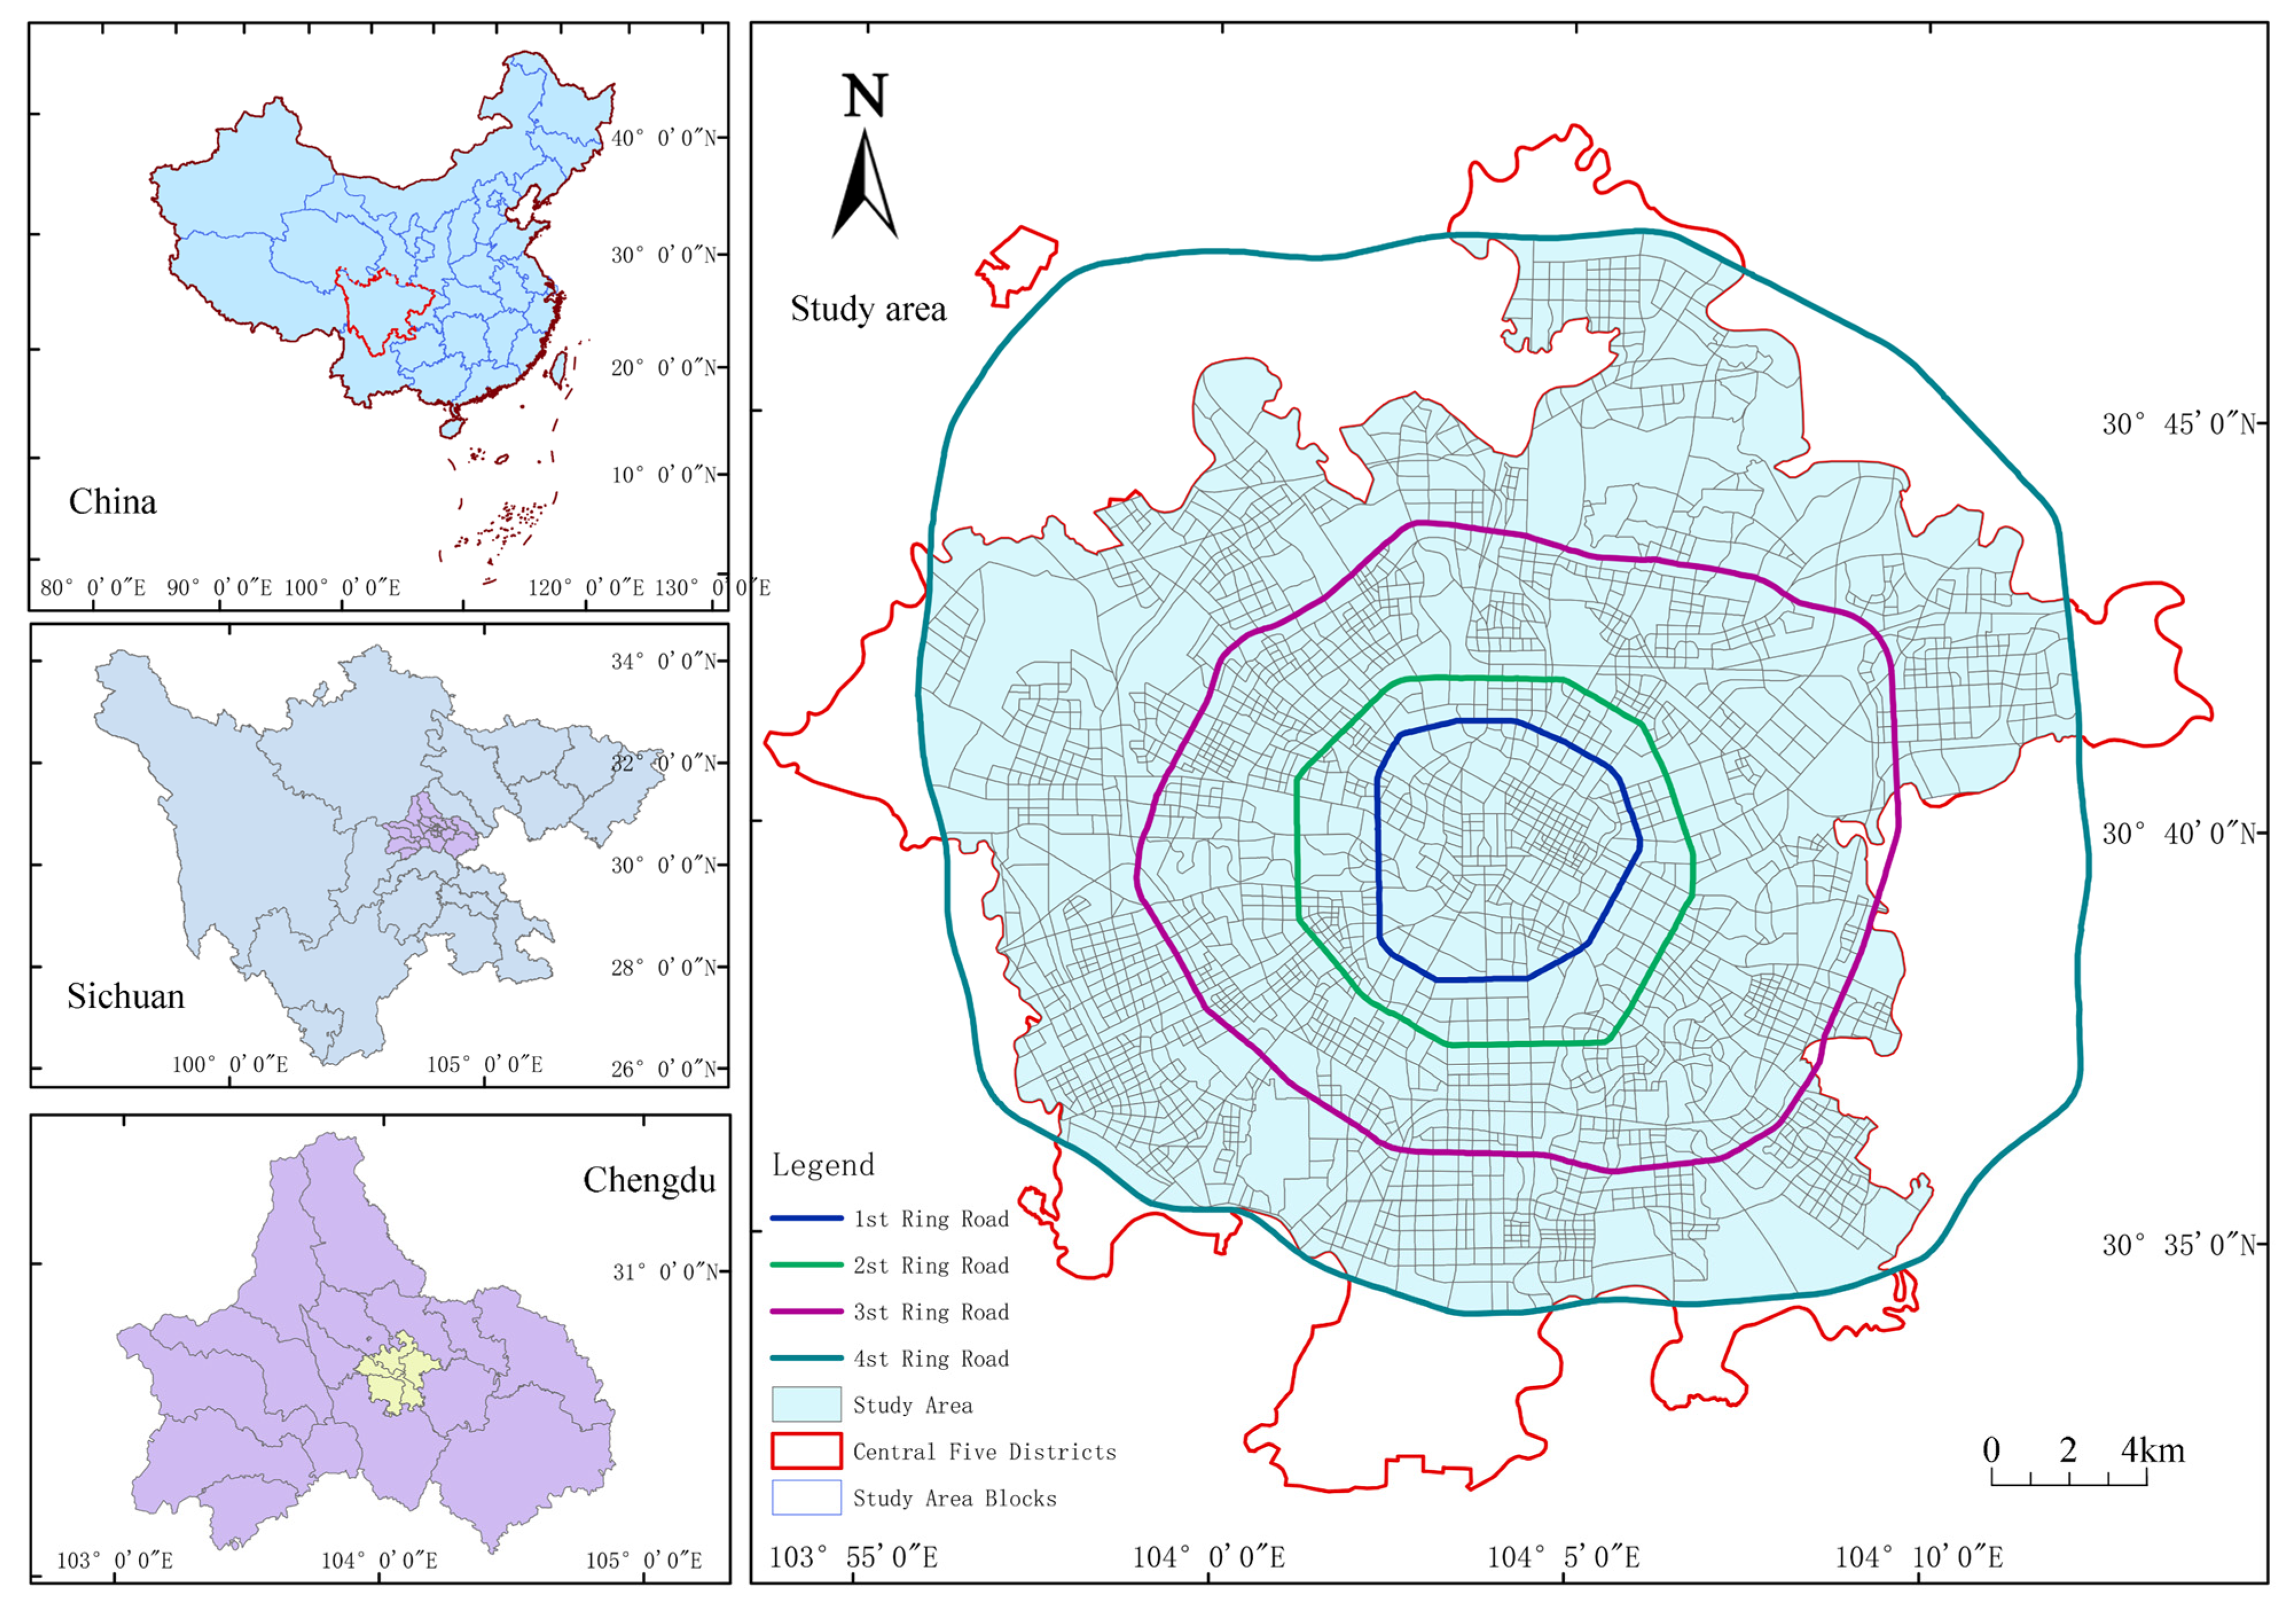
2.1. Study Area
2.2. The Establishment of the Indicator System
2.3. Data Collection
3. Methods
3.1. Google Earth Engine (GEE) Method for Calculating LST
3.2. Gradient Boosting Decision Tree (GBDT) Model
3.3. SHapley Additive exPlanations (SHAP) Method
3.4. Research System Framework
4. Results
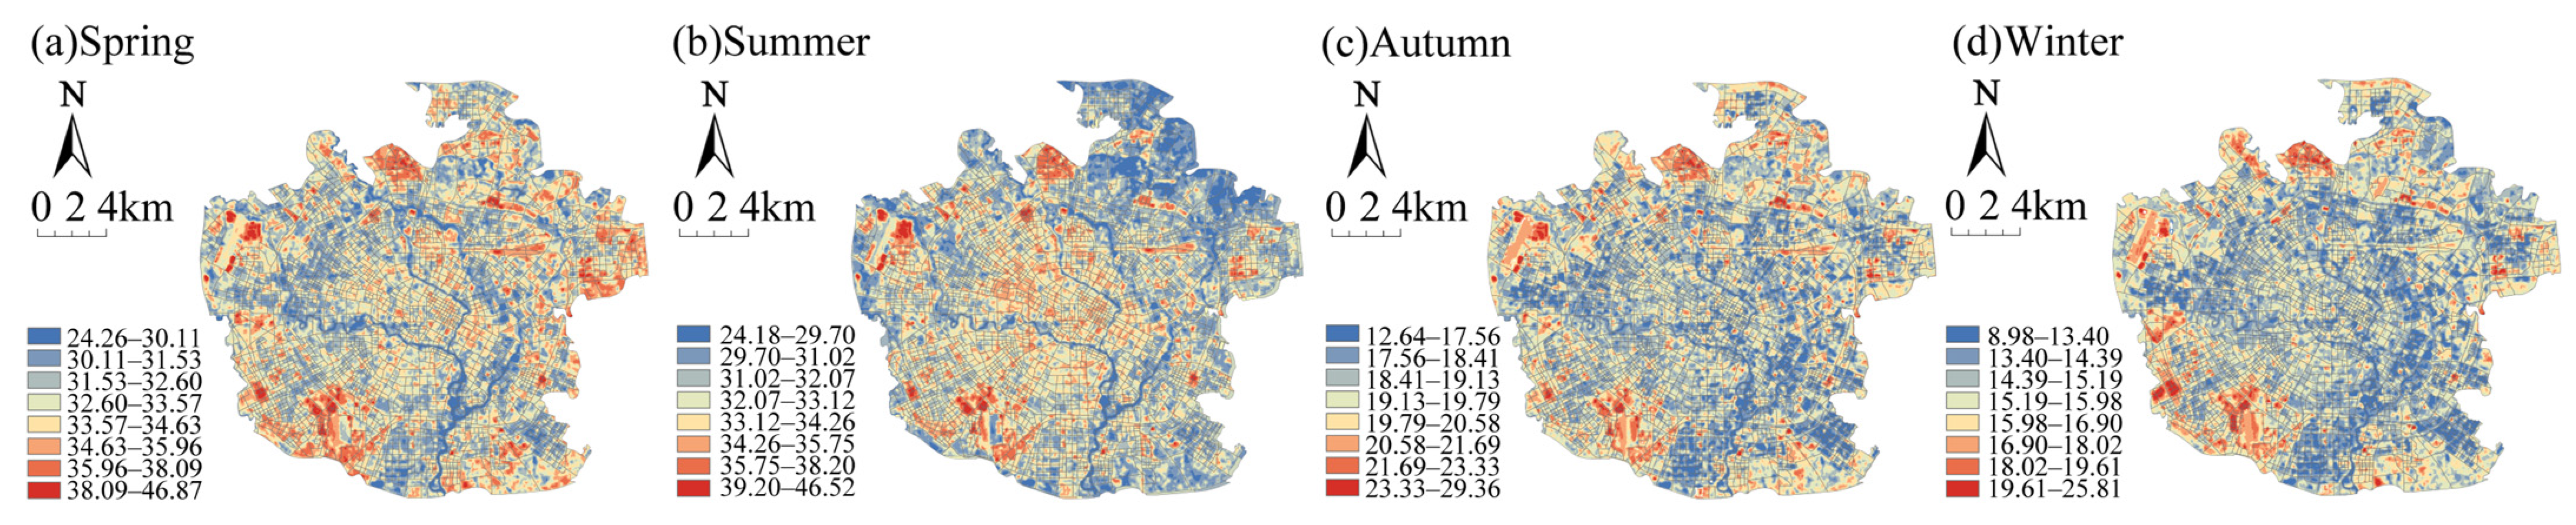
4.1. Spatial Distribution of LST in Different Seasons Under Block Division
4.2. The Relative Importance of HS Indicators on LST Impact
4.3. The Nonlinear Influence of HS Indicators on LST
4.4. The Interactive Effects Between HS Indicators
- (1)
- The Impact of Springtime Interactive Effects on LST
- (2)
- The Impact of Summertime Interactive Effects on LST
- (3)
- The Impact of Autumn time Interactive Effects on LST
- (4)
- The Impact of Wintertime Interactive Effects on LST
5. Discussion
5.1. Investigating the Mechanisms of HS’s Impact on Seasonal Variations in LST
5.2. Differences in the Impact of HS on LST at the Block Scale
5.3. Recommendations for Mitigating SUHI Effects
5.4. Limitations and Future Prospects
6. Conclusions
- (1)
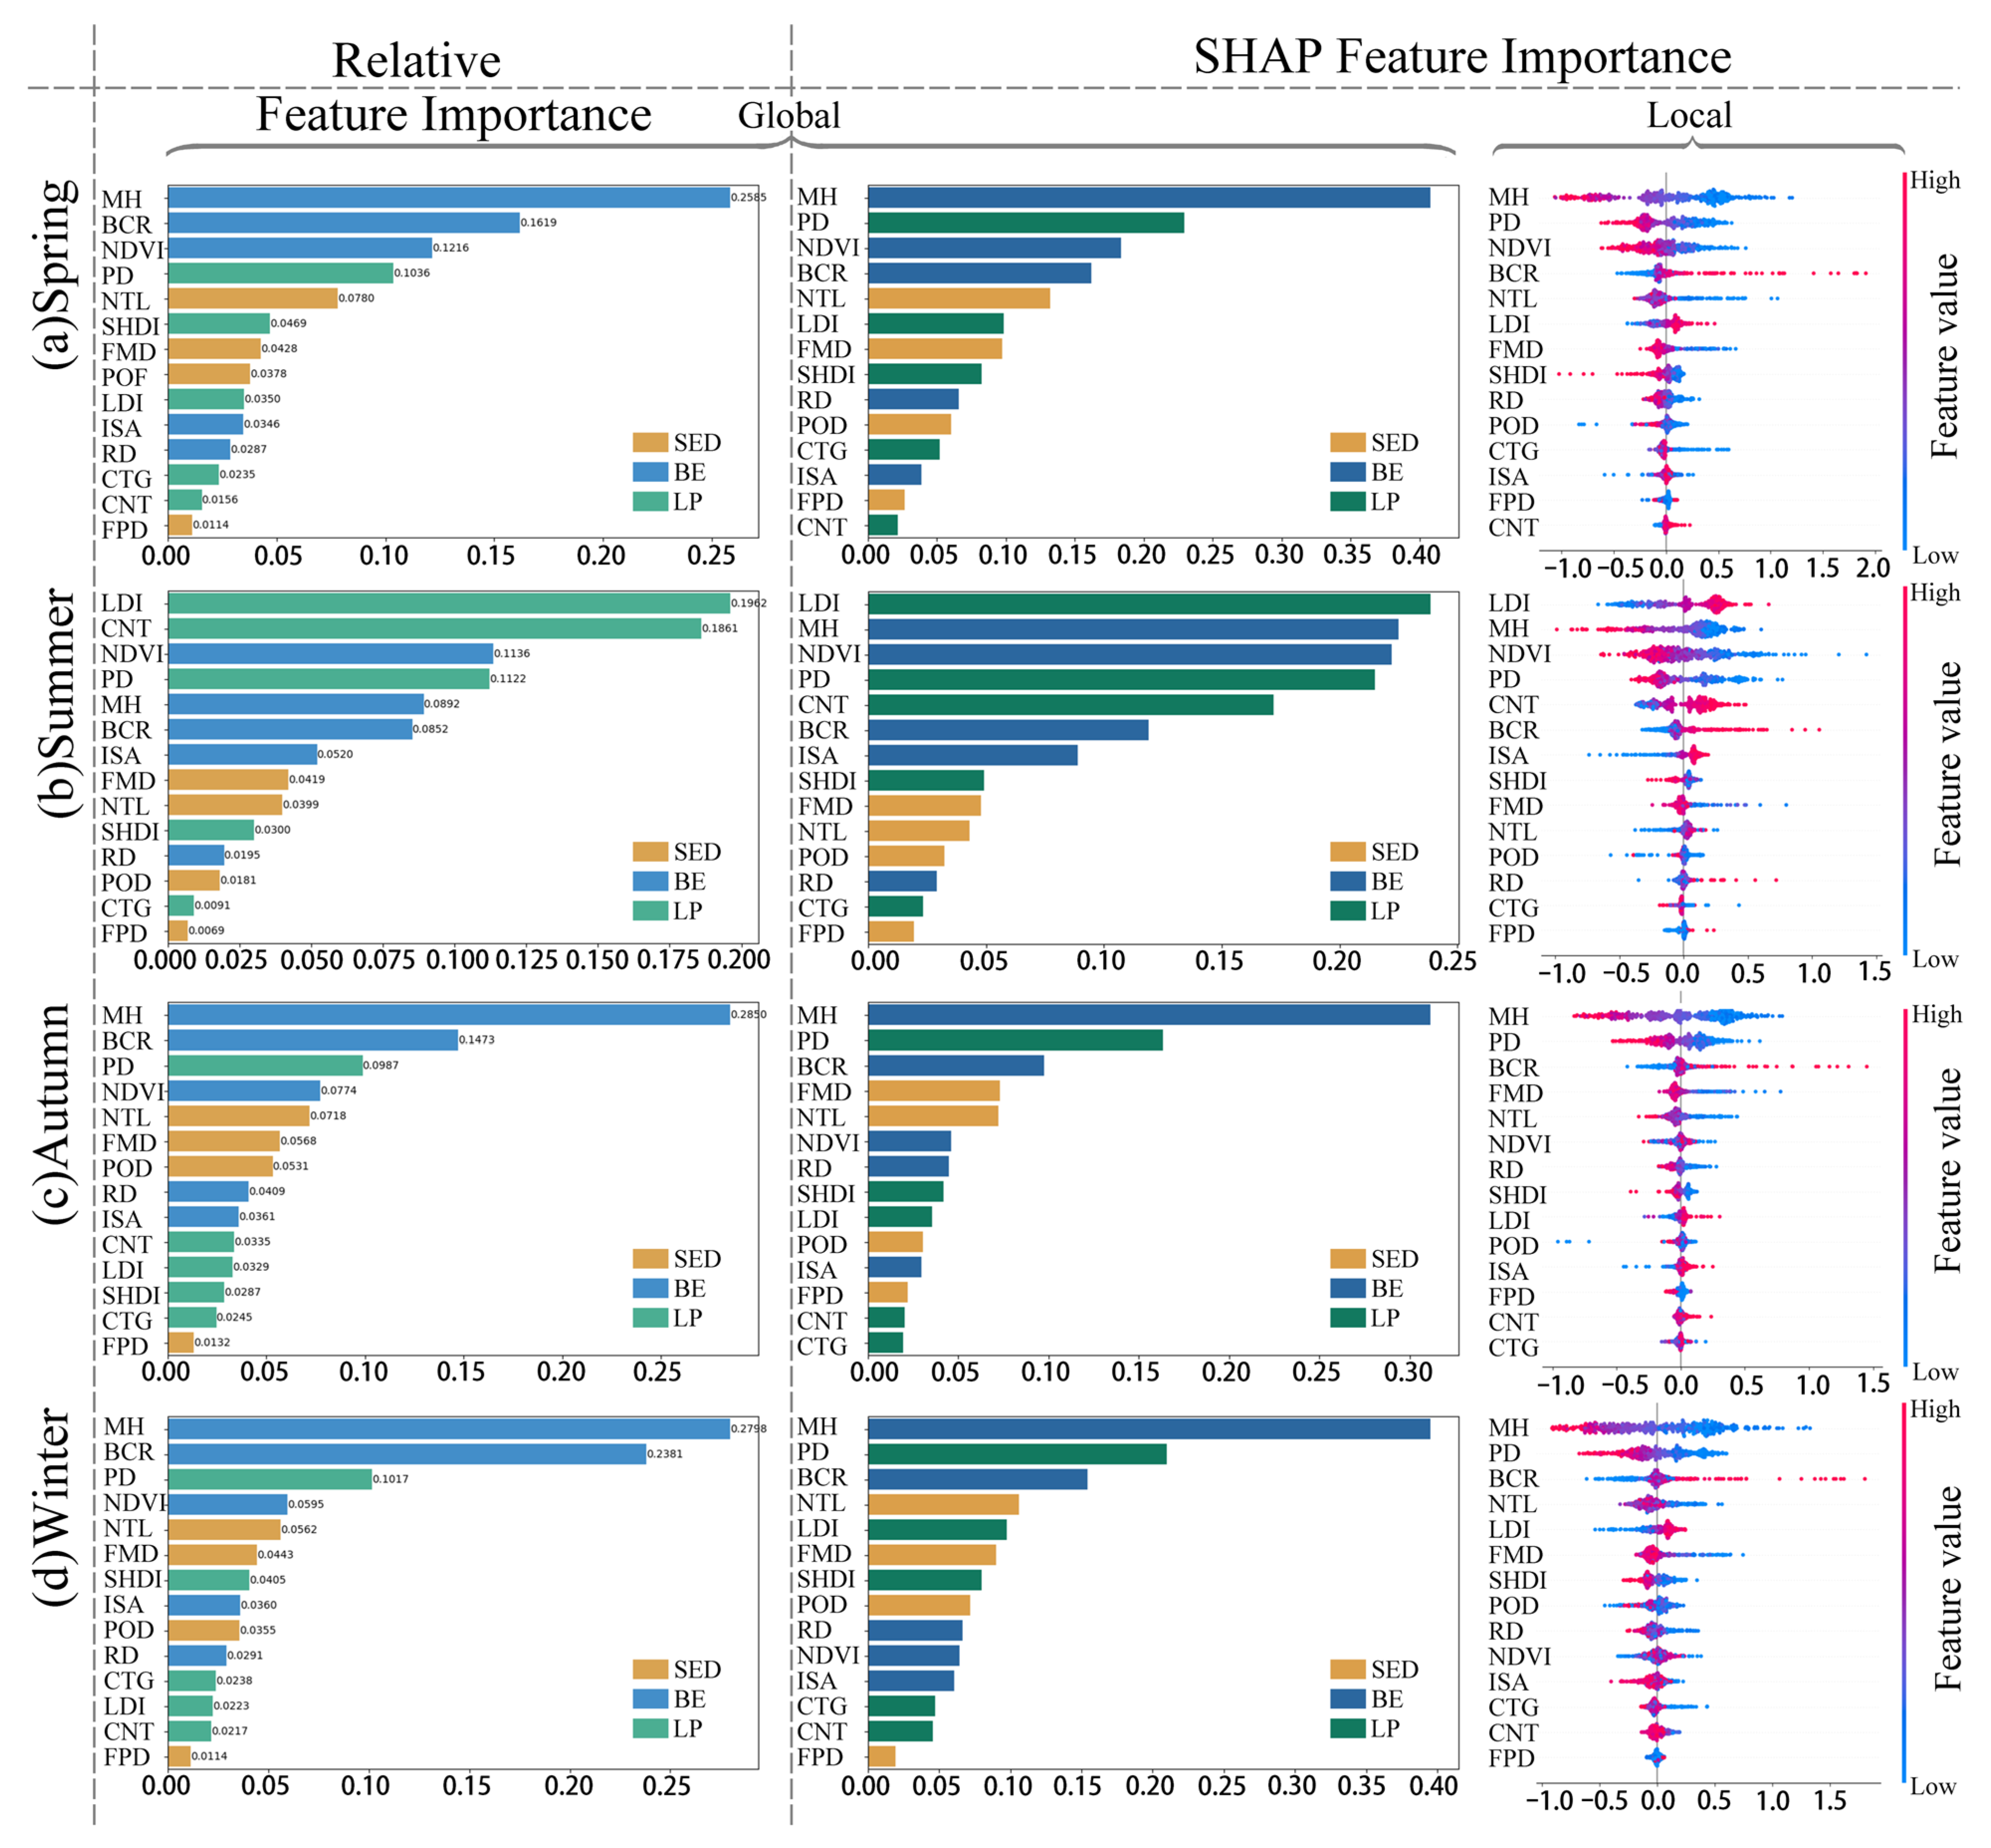
- At the block scale, the primary HS factors influencing land surface temperature (LST) are related to the built environment. The overall impact strength of each factor on LST, in descending order, is as follows: built environment (BE) > landscape pattern (LP) > socio-economic development (SED).
- (2)
- The built environment exerts the strongest influence on LST during spring, autumn, and winter, while landscape pattern has the most significant impact on LST during summer. In terms of the influence strength of individual indicators, MH, BCR, PD, NDVI, and NTL consistently rank among the top five factors influencing LST during spring, autumn, and winter. However, in summer, the top five factors affecting LST differ from those in other seasons, with LDI, CNT, NDVI, PD, and MH taking the leading positions.
- (3)
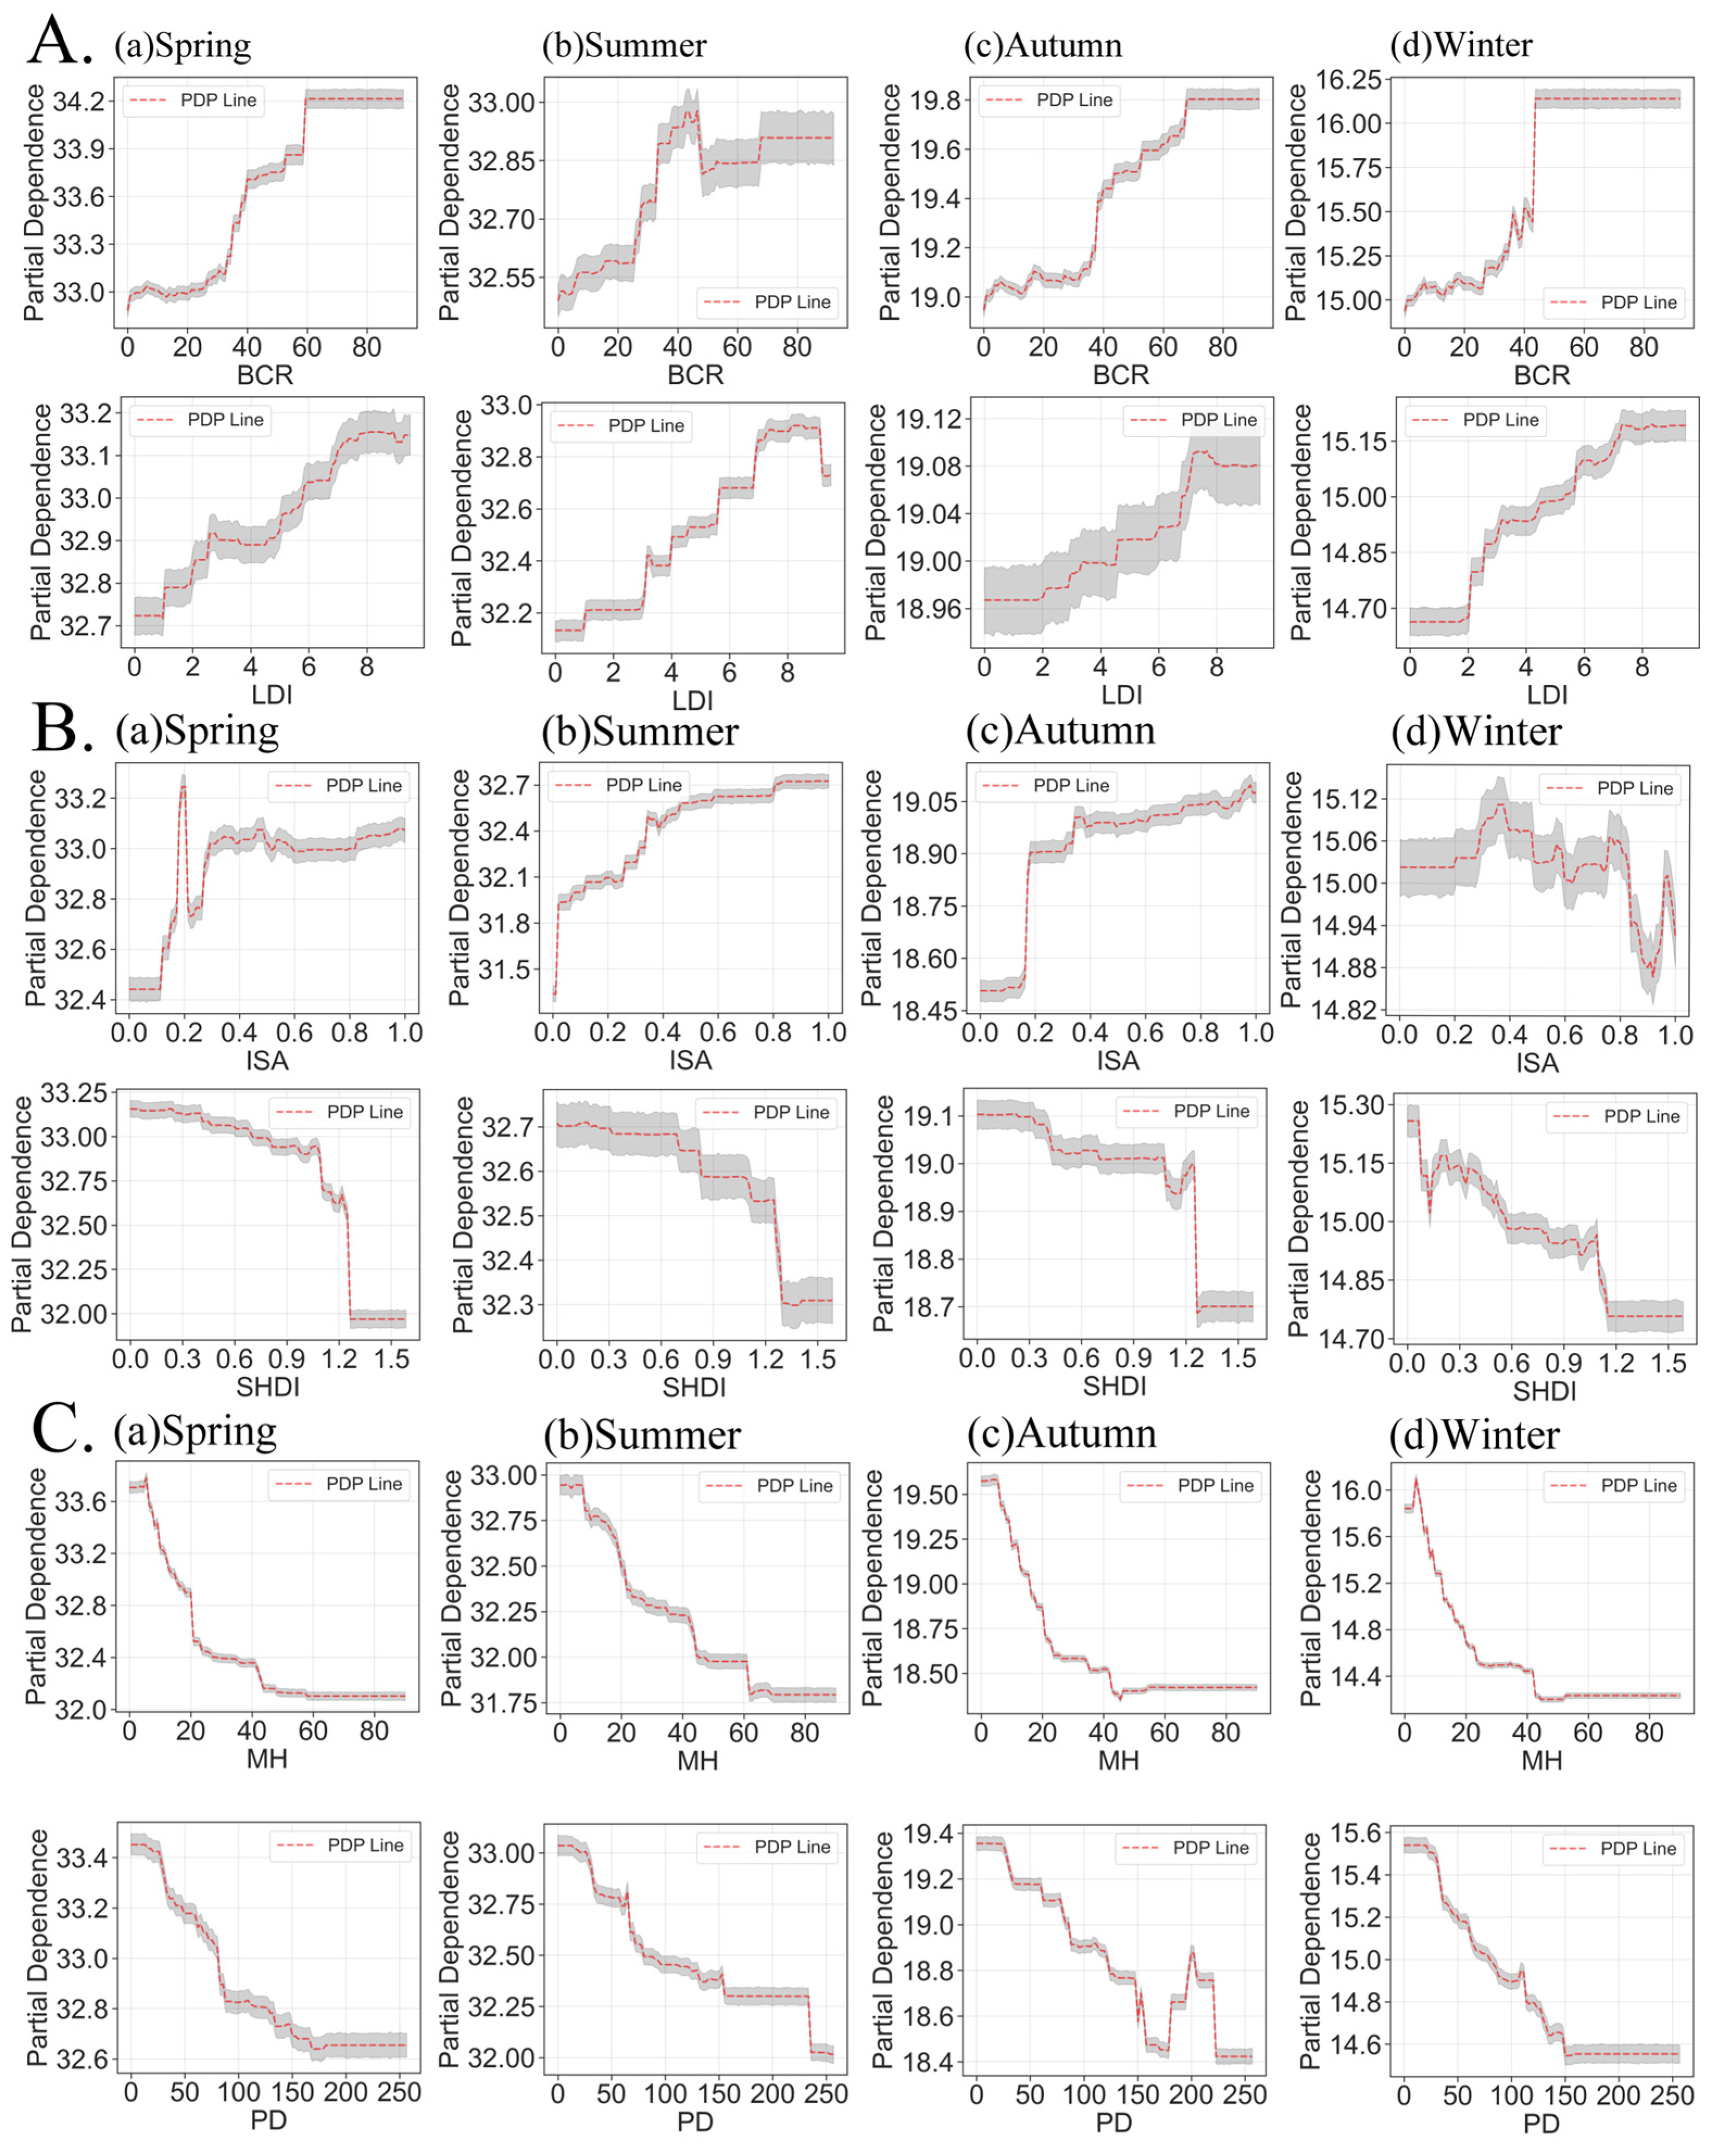
- There are seasonal differences in the nonlinear effects of HS indicators on LST. Building coverage ratio (BCR) and the landscape dispersion index (LDI) consistently exhibit a positive impact on LST throughout all seasons. Meanwhile, patch density (PD), the Shannon diversity index (SHDI), the contagion index (CTG), and mean building height (MH) consistently have a negative impact on LST. The impervious surface area (ISA) has a positive impact on LST during spring, summer, and autumn. The normalized difference vegetation index (NDVI) exerts a negative impact on LST during spring and summer. Nighttime light (NTL) and functional mixing degree (FMD) show a negative impact on LST during spring, autumn, and winter. ISA in winter, FMD and NTL in summer, and NDVI during both autumn and winter show no significant impact on LST. As population density (POD) and road network density (RD) increase, their impact on LST shifts from positive to negative during spring, autumn, and winter. In summer, when RD is below 30 km/km2, it has a positive effect on LST. Connectivity (CNT) and functional density (FPD) exhibit significant threshold effects on LST. Once the threshold is exceeded, LST remains unchanged despite further variations in CNT and FPD.
- (4)
- The interactions between NDVI, LDI, RD, BCR, and MH; NDVI, CTG, and LDI; LDI, SHDI, and PD; NDVI and NTL; ISA and NDVI; as well as PD and RD, exhibit significant effects. The pairwise combinations of these indicators can effectively reduce LST, showing great potential for improving the urban thermal environment. The interaction effects between NDVI and MH, LDI, and NTL are all significant, demonstrating the effective role of coordinated urban green space management in improving the urban thermal environment. This demonstrates that high-rise buildings combined with diversified and well-connected green design can effectively reduce land surface temperature and improve the urban thermal environment. It also indicates that under the influence of intensive human activities in urbanization, a higher-density road network and landscape greening can significantly reduce LST, possibly due to the landscape pattern they create, which is more conducive to heat release.
Author Contributions
Funding
Data Availability Statement
Acknowledgments
Conflicts of Interest
Abbreviations
| LST | Land surface temperature |
| UHI | Urban heat island |
| SUHI | Surface urban heat island |
| GBDT | Gradient Boosting Decision Tree |
| SHAP | SHapley Additive exPlanations |
| HS | Human settlements |
| SED | Socio-economic development |
| BE | Built environment |
| LP | Landscape pattern |
References
- Kim, S.W.; Brown, R.D. Urban heat island (UHI) variations within a city boundary: A systematic literature review. Urban Clim. 2019, 28, 100464. [Google Scholar]
- Chen, M.; Liu, W.; Tao, X. Evolution and assessment on China’s urbanization 1960–2010: Under-urbanization or over-urbanization? Habitat Int. 2013, 38, 25–33. [Google Scholar] [CrossRef]
- Berger, C.; Rosentreter, J.; Voltersen, M.; Baumgart, C.; Schmullius, C.; Hese, S. Spatio-temporal analysis of the relationship between 2D/3D urban site characteristics and land surface temperature. Remote Sens. Environ. 2017, 193, 225–243. [Google Scholar]
- Cai, Z.; Han, G.; Chen, M. Do water bodies play an important role in the relationship between urban form and land surface temperature? Sustain. Cities Soc. 2018, 39, 487–498. [Google Scholar]
- Connors, J.P.; Galletti, C.S.; Chow, W.T.L. Landscape configuration and urban heat island effects: Assessing the relationship between landscape characteristics and land surface temperature in Phoenix, Arizona. Landsc. Ecol. 2013, 28, 271–283. [Google Scholar]
- Kumar, A.; Mukherjee, M.; Goswami, A. Inter-seasonal characterization and correlation of Surface Urban Heat Island (SUHI) and Canopy Urban Heat Island (CUHI) in the urbanized environment of Delhi. Sustain. Cities Soc. 2022, 76, 103668. [Google Scholar]
- Bechtel, B.; Demuzere, M.; Mills, G.; Zhan, W.; Sismanidis, P.; Small, C.; Voogt, J. SUHI analysis using local climate zones—A comparison of 50 cities. Urban Clim. 2019, 28, 100463. [Google Scholar] [CrossRef]
- Hidalgo-García, D.; Arco-Díaz, J. Modeling the surface urban Heat Island (SUHI) to study of its relationship with variations in the thermal field and with the indices of land use in the metropolitan area of Granada (Spain). Sustain. Cities Soc. 2022, 87, 104166. [Google Scholar]
- Voogt, J.A.; Oke, T.R. Thermal remote sensing of urban climates. Remote Sens. Environ. 2003, 86, 370–384. [Google Scholar]
- Bansal, P.; Quan, S.J. Examining temporally varying nonlinear effects of urban form on urban heat island using explainable machine learning: A case of Seoul. Build. Environ. 2024, 247, 110957. [Google Scholar]
- Lin, J.; Qiu, S.; Tan, X.; Zhuang, Y. Measuring the relationship between morphological spatial pattern of green space and urban heat island using machine learning methods. Build. Environ. 2023, 108, 105482. [Google Scholar]
- Lin, J.; Wei, K.; Guan, Z. Exploring the connection between morphological characteristic of built-up areas and surface heat islands based on MSPA. Urban Clim. 2024, 56, 102046. [Google Scholar]
- Zhang, Q.; Xu, D.; Zhou, D.; Yang, Y.; Rogora, A. Associations between urban thermal environment and physical indicators based on meteorological data in Foshan City. Sustain. Cities Soc. 2020, 60, 102288. [Google Scholar]
- Xu, Y.; Yang, J.; Zheng, Y.; Li, W. Impacts of two-dimensional and three-dimensional urban morphology on urban thermal environments in high-density cities: A case study of Hong Kong. Build. Environ. 2024, 252, 111249. [Google Scholar]
- Tanoori, G.; Soltani, A.; Modiri, A. Machine Learning for Urban Heat Island (UHI) Analysis: Predicting Land Surface Temperature (LST) in Urban Environments. Urban Clim. 2024, 112, 104748. [Google Scholar]
- Gao, J.; Gong, J.; Yang, J.; Li, J.; Li, S. Measuring Spatial Connectivity between patches of the heat source and sink (SCSS): A new index to quantify the heterogeneity impacts of landscape patterns on land surface temperature. Landsc. Urban Plan. 2022, 217, 104260. [Google Scholar]
- Xi, Y.; Wang, S.; Zou, Y.; Zhou, X.; Zhang, Y. Seasonal surface urban heat island analysis based on local climate zones. Ecol. Indic. 2024, 159, 111669. [Google Scholar]
- Zhang, Z.; Luan, W.; Yang, J.; Guo, A.; Su, M.; Tian, C. The influences of 2D/3D urban morphology on land surface temperature at the block scale in Chinese megacities. Urban Clim. 2023, 49, 101553. [Google Scholar]
- Cao, X. The changes in remoted land surface temperature (LST) triggered by natural and socioeconomic factors in typical Chinese cities. Sustain. Cities Soc. 2025, 118, 104166. [Google Scholar]
- Wang, Z. Revealing the impact of urban spatial morphology on land surface temperature in plain and plateau cities using explainable machine learning. Sustain. Cities Soc. 2024, 118, 106040. [Google Scholar]
- An, Z.; Ming, Y.; Liu, Y.; Zhang, G. Investigating 2D/3D factors influencing surface urban heat islands in mountainous cities using explainable machine learning. Sustain. Cities Soc. 2024, 107, 104845. [Google Scholar] [CrossRef]
- Yu, J.; Hu, Q.; Li, J. Combining visual intelligence and social-physical urban features facilitates fine-scale seasonality characterization of urban thermal environments. Sustain. Cities Soc. 2024, 107, 104846. [Google Scholar] [CrossRef]
- Liu, Y. Exploring the seasonal effects of urban morphology on land surface temperature in urban functional zones. Sustain. Cities Soc. 2024, 107, 104847. [Google Scholar] [CrossRef]
- Yang, C.; Kui, T.; Zhou, W.; Fan, J.; Pan, L.; Wu, W.; Liu, M. Impact of refined 2D/3D urban morphology on hourly air temperature across different spatial scales in a snow climate city. Urban Clim. 2023, 47, 101404. [Google Scholar] [CrossRef]
- Liu, F.; Liu, J.; Zhang, Y.; Hong, S.; Fu, W.; Wang, M.; Dong, J. Construction of a cold island network for the urban heat island effect mitigation. Sci. Total Environ. 2024, 915, 169950. [Google Scholar] [CrossRef]
- Liang, G.; Xu, Z.; Wang, X.; Li, Y.; Li, X.; Zhang, Y.; Wang, J.; Li, J.; Wang, S.; Wang, Y. A multi-species approach for protected areas ecological network construction based on landscape connectivity. Glob. Ecol. Conserv. 2023, 46, e02569. [Google Scholar] [CrossRef]
- Peng, J.; Jia, J.; Liu, Y.; Li, H.; Wu, J. Seasonal contrast of the dominant factors for spatial distribution of land surface temperature in urban areas. Remote Sens. Environ. 2018, 215, 255–267. [Google Scholar] [CrossRef]
- Chen, G.; Li, Y.; Wang, X.; Zhang, Y.; Liu, Z. Assessing the synergies between heat waves and urban heat islands of different local climate zones in Guangzhou, China. Build. Environ. 2023, 240, 110434. [Google Scholar]
- Yang, K.; Tao, F.; Wang, C.-L.; Wang, Z.-L.; Han, Q.-L.; Zhou, T. An optimization method for surface urban heat island footprint extraction based on anisotropy assumption. Urban Clim. 2023, 49, 101532. [Google Scholar]
- Budhiraja, B.; Gawuc, L.; Agrawal, G. Seasonality of surface urban heat island in Delhi city region measured by local climate zones and conventional indicators. IEEE J. Sel. Top. Appl. Earth Obs. Rem. Sens. 2019, 12, 5223–5232. [Google Scholar]
- Cao, Q.; Huang, H.; Hong, Y.; Huang, X.; Wang, S.; Wang, L.; Wang, L. Modeling intra-urban differences in thermal environments and heat stress based on local climate zones in central Wuhan. Build. Environ. 2022, 225, 109625. [Google Scholar] [CrossRef]
- Ezimand, K.; Chahardoli, M.; Azadbakht, M.; Matkan, A. Spatiotemporal analysis of land surface temperature using multi-temporal and multi-sensor image fusion techniques. Cities Soc. 2021, 64, 102508. [Google Scholar] [CrossRef]
- Yang, J.; Jin, S.; Xiao, X.; Jin, C.; Xia, J.; Li, X.; Wang, S. The footprint of urban heat island effect in 302 Chinese cities: Temporal trends and associated factors. Sci. Total Environ. 2019, 671, 1036–1046. [Google Scholar] [CrossRef] [PubMed]
- Lu, Y.; Yue, W.; Liu, Y.; Huang, Y. Investigating the spatiotemporal non-stationary relationships between urban spatial form and land surface temperature: A case study of Wuhan, China. Sustain. Cities Soc. 2021, 72, 103070. [Google Scholar] [CrossRef]
- Yelixiati, H.; Tong, L.; Luo, S.; Chen, Z. Spatiotemporal heterogeneity of the relationship between urban morphology and land surface temperature at a block scale. Sustain. Cities Soc. 2024, 113, 105711. [Google Scholar] [CrossRef]
- Yao, L.; Li, T.; Xu, M.; Xu, Y. How the landscape features of urban green space impact seasonal land surface temperatures at a city-block-scale: An urban heat island study in Beijing, China. Urban Forestry Urban Green. 2020, 52, 126704. [Google Scholar] [CrossRef]
- Deilami, K.; Kamruzzaman, M.; Liu, Y. Urban heat island effect: A systematic review of spatio-temporal factors, data, methods, and mitigation measures. Int. J. Appl. Earth Obs. Geoinf. 2018, 67, 30–42. [Google Scholar] [CrossRef]
- Geng, S.; Yang, L.; Sun, Z.; Wang, Z.; Qian, J.; Jiang, C.; Wen, M. Spatiotemporal patterns and driving forces of remotely sensed urban agglomeration heat islands in South China. Sci. Total Environ. 2021, 800, 149499. [Google Scholar] [CrossRef]
- Gorelick, N.; Hancher, M.; Dixon, M.; Ilyushchenko, S.; Thau, D.; Moore, R. Google earth engine: Planetary-scale geospatial analysis for everyone. Remote Sens. Environ. 2017, 202, 18–27. [Google Scholar] [CrossRef]
- Yang, C.; Zhu, W.; Sun, J.; Xu, X.; Wang, R.; Lu, Y.; Zhang, S.; Zhou, W. Assessing the effects of 2D/3D urban morphology on the 3D urban thermal environment by using multi-source remote sensing data and UAV measurements: A case study of the snow-climate city of Changchun, China. J. Clean. Prod. 2021, 321, 128956. [Google Scholar] [CrossRef]
- Naserikia, M.; Hart, M.A.; Nazarian, N.; Bechtel, B.; Lipson, M.; Nice, K.A. Land surface and air temperature dynamics: The role of urban form and seasonality. Sci. Total Environ. 2023, 905, 167306. [Google Scholar] [PubMed]
- Liu, Y.; An, Z.; Ming, Y. Simulating influences of land use/land cover composition and configuration on urban heat island using machine learning. Sustain. Cities Soc. 2024, 108, 105482. [Google Scholar]
- Yu, S.; Chen, Z.; Chen, Z.; Wu, B.; Zhao, F. Exploring the relationship between 2D/3D landscape pattern and land surface temperature based on explainable eXtreme Gradient Boosting tree: A case study of Shanghai, China. Sci. Total Environ. 2020, 725, 138229. [Google Scholar] [PubMed]
- Liu, Q.; Wang, J.; Bai, B. Unveiling nonlinear effects of built environment attributes on urban heat resilience using interpretable machine learning. Urban Clim. 2024, 56, 102046. [Google Scholar]
- Lan, H.F.; Hou, H.C.; Gou, Z.H. A machine learning-led investigation to understand individual differences and the human-environment interactive effect on classroom thermal comfort. Build. Environ. 2023, 236, 110956. [Google Scholar]
- Zhu, S. Assessing the impact of adjacent urban morphology on street temperature: A multisource analysis using random forest and SHAP. Urban Clim. 2024, 57, 101982. [Google Scholar]
- Li, Y.; Li, Y.; Zhang, Z. Spatiotemporal variations and influencing factors of heatwaves in Chengdu, China. Atmos. Res. 2023, 280, 106394. [Google Scholar]
- Cheng, Z.; Yang, X.; Sun, C.; Xu, Y. The trend of summer urban heat island effect and its relationship with urban development in Chengdu. Sustain. Cities Soc. 2022, 76, 103457. [Google Scholar]
- Chen, Y.; Luo, B.; Xie, S.D. Characteristics of the long-range transport dust events in Chengdu, Southwest China. Atmos. Res. 2015, 122, 713–722. [Google Scholar]
- Zong, H.; Liu, Y.; Wang, Q.; Liu, M.L.; Chen, H. Usage patterns and comfort of gardens: A seasonal survey of internal garden microclimate in the aged care homes of Chengdu City. Int. J. Biometeorol. 2019, 63, 1181–1192. [Google Scholar]
- Peel, M.C.; Finlayson, B.L.; McMahon, T.A. Updated world map of the Köppen-Geiger climate classification. Hydrol. Earth Syst. Sci. 2007, 11, 1633–1644. [Google Scholar]
- Jia, J.; Changjian, N.; Zeyong, H.; Jun, X.; Yuzhu, X. Variation of haze and its relationship with climate change in Chengdu from 1980 to 2010. Plateau Meteorol. 2017, 36, 517–527. [Google Scholar]
- Kumar, L.; Mutanga, O. Google earth engine applications since inception: Usage, trends, and potential. Remote Sens. 2018, 10, 1509. [Google Scholar] [CrossRef]
- Mutanga, O.; Kumar, L. Google earth engine applications. Remote Sens. 2019, 11, 591. [Google Scholar] [CrossRef]
- Friedman, J.H. Greedy function approximation: A gradient boosting machine. Ann. Stat. 2001, 29, 1189–1232. [Google Scholar]
- Lundberg, S. A Unified Approach to Interpreting Model Predictions. arXiv 2017, arXiv:1705.07874. [Google Scholar]
- Lundberg, S.M.; Erion, G.G.; Lee, S.-I. Consistent Individualized Feature Attribution for Tree Ensembles. arXiv 2018, arXiv:1802.03888. [Google Scholar]
- Li, Z.; Hu, D. Exploring the relationship between the 2D/3D architectural morphology and urban land surface temperature based on a boosted regression tree: A case study of Beijing, China. Sustain. Cities Soc. 2022, 78, 103392. [Google Scholar]
- Liao, W.; Hong, T.; Heo, Y. The effect of spatial heterogeneity in urban morphology on surface urban heat islands. Energy Build. 2021, 244, 111027. [Google Scholar]
- Xi, Z.; Li, C.; Zhou, L.; Yang, H.; Burghardt, R. Built environment influences on urban climate resilience: Evidence from extreme heat events in Macau. Sci. Total Environ. 2023, 859, 160270. [Google Scholar]
- Massaro, E.; Schifanella, R.; Piccardo, M.; Caporaso, L.; Taubenböck, H.; Cescatti, A.; Duveiller, G. Spatially-optimized urban greening for reduction of population exposure to land surface temperature extremes. Nat. Commun. 2023, 14, 2903. [Google Scholar] [CrossRef] [PubMed]
- Hu, Y.; Dai, Z.; Guldmann, J.M. Modeling the impact of 2D/3D urban indicators on the urban heat island over different seasons: A boosted regression tree approach. J. Environ. Manag. 2020, 266, 110424. [Google Scholar] [CrossRef] [PubMed]
- Li, L.; Yu, T.; Zhao, L.; Zhan, Y.; Zheng, F.; Zhang, Y.; Mumtaz, F.; Wang, C. Characteristics and trend analysis of the relationship between land surface temperature and nighttime light intensity levels over China. Infrared Phys. Technol. 2019, 97, 381–390. [Google Scholar] [CrossRef]
- Guo, G.; Zhou, X.; Wu, Z.; Xiao, R.; Chen, Y. Characterizing the impact of urban morphology heterogeneity on land surface temperature in Guangzhou, China. Environ. Modell. Softw. 2016, 84, 427–439. [Google Scholar] [CrossRef]
- Li, J.X.; Song, C.H.; Cao, L.; Zhu, F.G.; Meng, X.L.; Wu, J.G.; Gao, F. Impacts of landscape structure on surface urban heat islands: A case study of Shanghai, China. Remote Sens. Environ. 2011, 115, 3249–3263. [Google Scholar] [CrossRef]
- Qian, W.; Li, X. A cold island connectivity and network perspective to mitigate the urban heat island effect. Sustain. Cities Soc. 2023, 94, 104525. [Google Scholar] [CrossRef]
- Huang, D.Q.; Liu, Z.; Zhao, X.S. Monocentric or Polycentric? The Urban Spatial Structure of Employment in Beijing. Sustainability 2015, 7, 11632–11656. [Google Scholar] [CrossRef]
- Yang, J.; Wang, Y. Optimizing local climate zones to mitigate urban heat island effect in human settlements. J. Clean. Prod. 2020, 275, 123767. [Google Scholar] [CrossRef]
- Luo, X.; Yang, J.; Sun, W.; He, B. Suitability of human settlements in mountainous areas from the perspective of ventilation: A case study of the main urban area of Chongqing. Sustain. Cities Soc. 2025, 118, 104166. [Google Scholar] [CrossRef]
- Hailu, G. Seasonal solar thermal energy storage. In Thermal Energy Battery with Nano-Enhanced PCM; IntechOpen: London, UK, 2018. [Google Scholar]
- Kim, J.; Lee, S.Y.; Kang, J. Temperature reduction effects of rooftop garden arrangements: A case study of Seoul National University. Sustainability 2020, 12, 6032. [Google Scholar] [CrossRef]
- Cui, F.; Hamdi, R.; Yuan, X.; He, H.; Yang, T.; Kuang, W.; Termonia, P.; De Maeyer, P. Quantifying the response of surface urban heat island to urban greening in global north megacities. Sci. Total Environ. 2021, 801, 149553. [Google Scholar] [PubMed]


| Dimensions | Indicator Factor | Abbr. | Description | Spatial Resolution |
|---|---|---|---|---|
| Socio-economic development | Population density | POD | Population density per unit area | 100 m |
| Functional density | FPD | Average number of POIs per thousand people | Vector data | |
| Nighttime light index | NTL | Nighttime light brightness index | 100 m | |
| Mixed functionality degree | FMD | Average POI functional mixing degree across sixteen categories (e.g., business, culture) | Vector data | |
| Built Environment | Building coverage ratio | BCR | Ratio of the total building footprint area to the land area occupied | Vector data |
| Road density | RD | Ratio of total road network length to the land area served | Vector data | |
| Impermeable surface ratio | ISA | Proportion of land covered by impervious surfaces (e.g., concrete and asphalt) | 30 m | |
| Mean building height | MH | Average building height within the area | Vector data | |
| Normalized difference vegetation index | NDVI | Remote sensing index measuring vegetation coverage and health | 30 m | |
| Landscape pattern | Contagion index | CTG | Index measuring the aggregation or extension trend of different patch types | 30 m |
| Shannon diversity index | SHDI | Index measuring the richness and evenness of patch types in a landscape | 30 m | |
| Patch density | PD | Number of different landscape patches per unit area | 30 m | |
| Landscape division index | LDI | Index measuring the degree of landscape fragmentation | 30 m | |
| Connectance index | CNT | Index measuring the interaction between different landscape patches | 30 m |
| Date | Temperature | Weather | Cloudiness | Beijing Time |
|---|---|---|---|---|
| 16 April 2023 | 19–34 °C | Cloudy to Clear | 0.06% | 11:32 |
| 05 July 2023 | 22–35 °C | Cloudy to Clear | 0.23% | 11:33 |
| 26 January 2023 | 8–22 °C | Cloudy to Clear | 0.15% | 11:33 |
| 05 February 2021 | 6–18 °C | Clear | 0.42% | 11:33 |
Disclaimer/Publisher’s Note: The statements, opinions and data contained in all publications are solely those of the individual author(s) and contributor(s) and not of MDPI and/or the editor(s). MDPI and/or the editor(s) disclaim responsibility for any injury to people or property resulting from any ideas, methods, instructions or products referred to in the content. |
© 2025 by the authors. Licensee MDPI, Basel, Switzerland. This article is an open access article distributed under the terms and conditions of the Creative Commons Attribution (CC BY) license (https://creativecommons.org/licenses/by/4.0/).
Share and Cite
Zhang, M.; Hou, T.; Ma, Y.; Liang, M.; Yang, J.; Sun, F.; Wang, E. Nonlinear Effects of Human Settlements on Seasonal Land Surface Temperature Variations at the Block Scale: A Case Study of the Central Urban Area of Chengdu. Land 2025, 14, 693. https://doi.org/10.3390/land14040693
Zhang M, Hou T, Ma Y, Liang M, Yang J, Sun F, Wang E. Nonlinear Effects of Human Settlements on Seasonal Land Surface Temperature Variations at the Block Scale: A Case Study of the Central Urban Area of Chengdu. Land. 2025; 14(4):693. https://doi.org/10.3390/land14040693
Chicago/Turabian StyleZhang, Muze, Tong Hou, Yuping Ma, Mindong Liang, Jiayu Yang, Fengshuo Sun, and Enxu Wang. 2025. "Nonlinear Effects of Human Settlements on Seasonal Land Surface Temperature Variations at the Block Scale: A Case Study of the Central Urban Area of Chengdu" Land 14, no. 4: 693. https://doi.org/10.3390/land14040693
APA StyleZhang, M., Hou, T., Ma, Y., Liang, M., Yang, J., Sun, F., & Wang, E. (2025). Nonlinear Effects of Human Settlements on Seasonal Land Surface Temperature Variations at the Block Scale: A Case Study of the Central Urban Area of Chengdu. Land, 14(4), 693. https://doi.org/10.3390/land14040693